Small/Mid Cap Strategy and Stock Picks - the DBS Vickers ...
Small/Mid Cap Strategy and Stock Picks - the DBS Vickers ... Small/Mid Cap Strategy and Stock Picks - the DBS Vickers ...
Regional Small/Mid Cap Strategy Q2 2008 Bakrie Sumatra Plantation Bloomberg: UNSP IJ | Reuters: UNSP.JK BUY Rp1,810 JCI : 2,419.6 Price Target : 12-Month Rp3,050 Potential Catalyst : Stronger than expected 1Q08 results, higher crude oil price and CPO price recovery Analyst Herry Dion Mahargono +6221 3983 2668 herry.mahargono@id.dbsvickers.com Price Relative Rp 2,614.30 2,114.30 1,614.30 1,114.30 614.30 114.30 Relative Index 2004 2005 2006 2007 2008 Bakrie Sumatra Plantation (LHS) Relative JCI INDEX (RHS) Forecasts and Valuation FY Dec (Rp bn) 2006A 2007F 2008F 2009F Turnover 1,181 1,663 2,632 2,841 EBITDA 326 497 841 1,020 Pre-tax Profit 250 336 693 893 Net Profit 173 235 485 625 Net Pft (Pre Ex.) 173 235 485 625 EPS (Rp) 74.2 62.0 128.1 165.0 EPS Pre Ex. (Rp) 74.2 62.0 128.1 165.0 EPS Gth Pre Ex (%) 40 (16) 106 29 Diluted EPS (Rp) 74.2 56.6 116.9 150.6 Net DPS (Rp) 9.0 11.2 23.1 29.7 BV Per Share (Rp) 275.6 516.1 621.1 756.4 PE (X) 24.4 29.2 14.1 11.0 PE Pre Ex. (X) 24.4 29.2 14.1 11.0 P/Cash Flow (X) 23.9 28.7 14.0 10.9 EV/EBITDA (X) 14.8 16.1 9.7 7.7 Net Div Yield (%) 0.5 0.6 1.3 1.6 P/Book Value (X) 6.6 3.5 2.9 2.4 Net Debt/Equity (X) 1.0 0.6 0.6 0.3 ROAE (%) 30.5 18.1 22.5 24.0 Consensus EPS (Rp): 6,282 12,347 14,701 526 476 426 376 326 276 226 176 126 76 Going for a song Story: Although crude palm oil (CPO) price has tumbled more than 25% from its peak, it is still 34% higher than last year’s average and more importantly, 7% higher than our assumption. However, UNSP’s share price has fallen by over 35% in three weeks due to the CPO price trend reversal. We think the share price decline is excessive. We remain optimistic of CPO prices, backed by a foreseeable critically low supply of oilseeds worldwide in 2008/09 and persistently high crude oil price. Point: We recently upgraded our average CPO price (CIF Rotterdam/ton) assumption to US$1,055 (2008), US$1010 (2009) and US$970 (2010) from US$860, US$770 and US$730, respectively. We also expect CPO production to increase by 51% and 15 % in 2008-09, respectively, led by yield improvement and acquisitions. Coupled with strong CPO price, earnings should surge 106% and 29% in 2008-09, respectively. Relevance: UNSP is trading at 15.4x and 12x 2008-09 (FD) PE compared to the broader market’s 14.5x and 11.9x, respectively. Our target price of Rp.3,050 is based on DCF valuation with WACC of 12.6% and 6% terminal growth. Our target price implies EV/ha (nucleus only) of US$16,400 and 2008-09 PE (FD) of 26x and 20x, respectively. The counter is also the cheapest upstream plantation stock based on EV/ha valuation. At A Glance Issued Capital (m shrs) 3,788 Mkt. Cap (Rpbn/US$m) 6,856 / 746 Major Shareholders Bakrie (BSP) Ltd (%) 28.0 Amerasia Intl. (%) 11.0 Bakrie Brothers (%) 10.0 Free Float (%) 51.0 Avg. Daily Vol.(‘000) 54,542 Sector : Consumer Goods Principal Business: Plantation Page 56 www.dbsvickers.com Refer to important disclosures at the end of this report
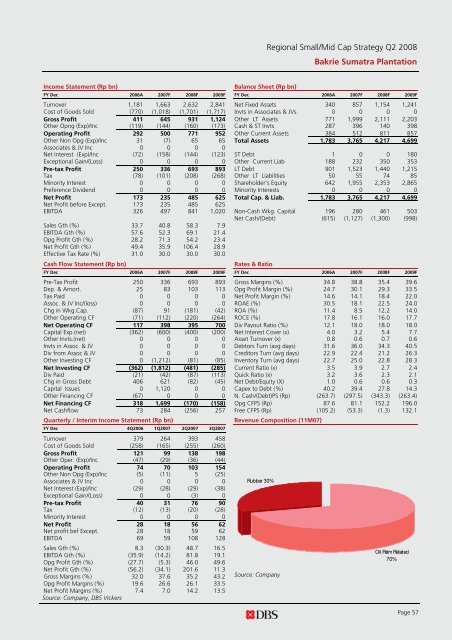
Regional Small/Mid Cap Strategy Q2 2008 Bakrie Sumatra Plantation Income Statement (Rp bn) Balance Sheet (Rp bn) FY Dec 2006A 2007F 2008F 2009F FY Dec 2006A 2007F 2008F 2009F Turnover 1,181 1,663 2,632 2,841 Net Fixed Assets 340 857 1,154 1,241 Cost of Goods Sold (770) (1,018) (1,701) (1,717) Invts in Associates & JVs 0 0 0 0 Gross Profit 411 645 931 1,124 Other LT Assets 771 1,999 2,111 2,203 Other Opng (Exp)/Inc (119) (144) (160) (173) Cash & ST Invts 287 396 140 398 Operating Profit 292 500 771 952 Other Current Assets 384 512 811 857 Other Non Opg (Exp)/Inc 31 (7) 65 65 Total Assets 1,783 3,765 4,217 4,699 Associates & JV Inc 0 0 0 0 Net Interest (Exp)/Inc (72) (158) (144) (123) ST Debt 1 0 0 180 Exceptional Gain/(Loss) 0 0 0 0 Other Current Liab 188 232 350 353 Pre-tax Profit 250 336 693 893 LT Debt 901 1,523 1,440 1,215 Tax (78) (101) (208) (268) Other LT Liabilities 50 55 74 85 Minority Interest 0 0 0 0 Shareholder’s Equity 642 1,955 2,353 2,865 Preference Dividend 0 0 0 0 Minority Interests 0 0 0 0 Net Profit 173 235 485 625 Total Cap. & Liab. 1,783 3,765 4,217 4,699 Net Profit before Except. 173 235 485 625 EBITDA 326 497 841 1,020 Non-Cash Wkg. Capital 196 280 461 503 Net Cash/(Debt) (615) (1,127) (1,300) (998) Sales Gth (%) 33.7 40.8 58.3 7.9 EBITDA Gth (%) 57.6 52.3 69.1 21.4 Opg Profit Gth (%) 28.2 71.3 54.2 23.4 Net Profit Gth (%) 49.4 35.9 106.4 28.9 Effective Tax Rate (%) 31.0 30.0 30.0 30.0 Cash Flow Statement (Rp bn) Rates & Ratio FY Dec 2006A 2007F 2008F 2009F FY Dec 2006A 2007F 2008F 2009F Pre-Tax Profit 250 336 693 893 Gross Margins (%) 34.8 38.8 35.4 39.6 Dep. & Amort. 25 83 103 113 Opg Profit Margin (%) 24.7 30.1 29.3 33.5 Tax Paid 0 0 0 0 Net Profit Margin (%) 14.6 14.1 18.4 22.0 Assoc. & JV Inc/(loss) 0 0 0 0 ROAE (%) 30.5 18.1 22.5 24.0 Chg in Wkg.Cap. (87) 91 (181) (42) ROA (%) 11.4 8.5 12.2 14.0 Other Operating CF (71) (112) (220) (264) ROCE (%) 17.8 16.1 16.0 17.7 Net Operating CF 117 398 395 700 Div Payout Ratio (%) 12.1 18.0 18.0 18.0 Capital Exp.(net) (362) (600) (400) (200) Net Interest Cover (x) 4.0 3.2 5.4 7.7 Other Invts.(net) 0 0 0 0 Asset Turnover (x) 0.8 0.6 0.7 0.6 Invts in Assoc. & JV 0 0 0 0 Debtors Turn (avg days) 31.6 36.0 34.3 40.5 Div from Assoc & JV 0 0 0 0 Creditors Turn (avg days) 22.9 22.4 21.2 26.3 Other Investing CF 0 (1,212) (81) (85) Inventory Turn (avg days) 22.7 25.0 22.8 28.3 Net Investing CF (362) (1,812) (481) (285) Current Ratio (x) 3.5 3.9 2.7 2.4 Div Paid (21) (42) (87) (113) Quick Ratio (x) 3.2 3.6 2.3 2.1 Chg in Gross Debt 406 621 (82) (45) Net Debt/Equity (X) 1.0 0.6 0.6 0.3 Capital Issues 0 1,120 0 0 Capex to Debt (%) 40.2 39.4 27.8 14.3 Other Financing CF (67) 0 0 0 N. Cash/(Debt)PS (Rp) (263.7) (297.5) (343.3) (263.4) Net Financing CF 318 1,699 (170) (158) Opg CFPS (Rp) 87.6 81.1 152.2 196.0 Net Cashflow 73 284 (256) 257 Free CFPS (Rp) (105.2) (53.3) (1.3) 132.1 Quarterly / Interim Income Statement (Rp bn) Revenue Composition (11M07) FY Dec 4Q2006 1Q2007 2Q2007 3Q2007 Turnover 379 264 393 458 Cost of Goods Sold (258) (165) (255) (260) Gross Profit 121 99 138 198 Other Oper. (Exp)/Inc (47) (29) (36) (44) Operating Profit 74 70 103 154 Other Non Opg (Exp)/Inc (5) (11) 5 (25) Associates & JV Inc 0 0 0 0 Net Interest (Exp)/Inc (29) (28) (29) (38) Exceptional Gain/(Loss) 0 0 (3) 0 Pre-tax Profit 40 31 76 90 Tax (12) (13) (20) (28) Minority Interest 0 0 0 0 Net Profit 28 18 56 62 Net profit bef Except. 28 18 59 62 EBITDA 69 59 108 128 Sales Gth (%) 8.3 (30.3) 48.7 16.5 EBITDA Gth (%) (35.9) (14.2) 81.8 19.1 Opg Profit Gth (%) (27.7) (5.3) 46.0 49.6 Net Profit Gth (%) (56.2) (34.1) 201.6 11.3 Gross Margins (%) 32.0 37.6 35.2 43.2 Opg Profit Margins (%) 19.6 26.6 26.1 33.5 Net Profit Margins (%) 7.4 7.0 14.2 13.5 Source: Company, DBS Vickers Rubber 30% Source: Company Oil Palm Related 70% Page 57
- Page 5 and 6: Regional Small/Mid Cap Strategy Q2
- Page 7 and 8: Regional Small/Mid Strategy Q2 2008
- Page 9 and 10: Regional Small/Mid Strategy Q2 2008
- Page 11 and 12: Regional Small/Mid Strategy Q2 2008
- Page 13 and 14: Regional Small/Mid Cap Strategy Q2
- Page 15 and 16: Regional Small/Mid Cap Strategy Q2
- Page 17 and 18: Regional Small/Mid Cap Strategy Q2
- Page 19 and 20: Regional Small/Mid Cap Strategy Q2
- Page 21 and 22: Regional Small/Mid Cap Strategy Q2
- Page 23 and 24: Regional Small/Mid Cap Strategy Q2
- Page 25 and 26: Regional Small/Mid Cap Strategy Q2
- Page 27 and 28: Regional Small/Mid Cap Strategy Q2
- Page 29 and 30: Regional Small/Mid Cap Strategy Q2
- Page 31 and 32: Regional Small/Mid Cap Strategy Q2
- Page 33 and 34: Regional Small/Mid Cap Strategy Q2
- Page 35 and 36: Regional Small/Mid Cap Strategy Q2
- Page 37 and 38: Regional Small/Mid Cap Strategy Q2
- Page 39 and 40: Regional Small/Mid Cap Strategy Q2
- Page 41 and 42: Regional Small/Mid Strategy Q2 2008
- Page 43 and 44: Regional Small/Mid Cap Strategy Q2
- Page 45 and 46: Regional Small/Mid Cap Strategy Q2
- Page 47 and 48: Regional Small/Mid Cap Strategy Q2
- Page 49 and 50: Regional Small/Mid Cap Strategy Q2
- Page 51 and 52: Regional Small/Mid Cap Strategy Q2
- Page 53 and 54: Regional Small/Mid Cap Strategy Q2
- Page 55: Regional Small/Mid Cap Strategy Q2
- Page 59 and 60: Regional Small/Mid Cap Strategy Q2
- Page 61 and 62: Regional Small/Mid Strategy Q2 2008
- Page 63 and 64: Regional Small/Mid Cap Strategy Q2
- Page 65 and 66: Regional Small/Mid Cap Strategy Q2
- Page 67 and 68: Regional Small/Mid Cap Strategy Q2
- Page 69 and 70: Regional Small/Mid Cap Strategy Q2
- Page 71 and 72: Regional Small/Mid Cap Strategy Q2
- Page 73 and 74: Regional Small/Mid Cap Strategy Q2
- Page 75 and 76: Regional Small/Mid Cap Strategy Q2
Regional <strong>Small</strong>/<strong>Mid</strong> <strong>Cap</strong> <strong>Strategy</strong> Q2 2008<br />
Bakrie Sumatra Plantation<br />
Income Statement (Rp bn)<br />
Balance Sheet (Rp bn)<br />
FY Dec 2006A 2007F 2008F 2009F FY Dec 2006A 2007F 2008F 2009F<br />
Turnover 1,181 1,663 2,632 2,841 Net Fixed Assets 340 857 1,154 1,241<br />
Cost of Goods Sold (770) (1,018) (1,701) (1,717) Invts in Associates & JVs 0 0 0 0<br />
Gross Profit 411 645 931 1,124 O<strong>the</strong>r LT Assets 771 1,999 2,111 2,203<br />
O<strong>the</strong>r Opng (Exp)/Inc (119) (144) (160) (173) Cash & ST Invts 287 396 140 398<br />
Operating Profit 292 500 771 952 O<strong>the</strong>r Current Assets 384 512 811 857<br />
O<strong>the</strong>r Non Opg (Exp)/Inc 31 (7) 65 65 Total Assets 1,783 3,765 4,217 4,699<br />
Associates & JV Inc 0 0 0 0<br />
Net Interest (Exp)/Inc (72) (158) (144) (123) ST Debt 1 0 0 180<br />
Exceptional Gain/(Loss) 0 0 0 0 O<strong>the</strong>r Current Liab 188 232 350 353<br />
Pre-tax Profit 250 336 693 893 LT Debt 901 1,523 1,440 1,215<br />
Tax (78) (101) (208) (268) O<strong>the</strong>r LT Liabilities 50 55 74 85<br />
Minority Interest 0 0 0 0 Shareholder’s Equity 642 1,955 2,353 2,865<br />
Preference Dividend 0 0 0 0 Minority Interests 0 0 0 0<br />
Net Profit 173 235 485 625 Total <strong>Cap</strong>. & Liab. 1,783 3,765 4,217 4,699<br />
Net Profit before Except. 173 235 485 625<br />
EBITDA 326 497 841 1,020 Non-Cash Wkg. <strong>Cap</strong>ital 196 280 461 503<br />
Net Cash/(Debt) (615) (1,127) (1,300) (998)<br />
Sales Gth (%) 33.7 40.8 58.3 7.9<br />
EBITDA Gth (%) 57.6 52.3 69.1 21.4<br />
Opg Profit Gth (%) 28.2 71.3 54.2 23.4<br />
Net Profit Gth (%) 49.4 35.9 106.4 28.9<br />
Effective Tax Rate (%) 31.0 30.0 30.0 30.0<br />
Cash Flow Statement (Rp bn)<br />
Rates & Ratio<br />
FY Dec 2006A 2007F 2008F 2009F FY Dec 2006A 2007F 2008F 2009F<br />
Pre-Tax Profit 250 336 693 893 Gross Margins (%) 34.8 38.8 35.4 39.6<br />
Dep. & Amort. 25 83 103 113 Opg Profit Margin (%) 24.7 30.1 29.3 33.5<br />
Tax Paid 0 0 0 0 Net Profit Margin (%) 14.6 14.1 18.4 22.0<br />
Assoc. & JV Inc/(loss) 0 0 0 0 ROAE (%) 30.5 18.1 22.5 24.0<br />
Chg in Wkg.<strong>Cap</strong>. (87) 91 (181) (42) ROA (%) 11.4 8.5 12.2 14.0<br />
O<strong>the</strong>r Operating CF (71) (112) (220) (264) ROCE (%) 17.8 16.1 16.0 17.7<br />
Net Operating CF 117 398 395 700 Div Payout Ratio (%) 12.1 18.0 18.0 18.0<br />
<strong>Cap</strong>ital Exp.(net) (362) (600) (400) (200) Net Interest Cover (x) 4.0 3.2 5.4 7.7<br />
O<strong>the</strong>r Invts.(net) 0 0 0 0 Asset Turnover (x) 0.8 0.6 0.7 0.6<br />
Invts in Assoc. & JV 0 0 0 0 Debtors Turn (avg days) 31.6 36.0 34.3 40.5<br />
Div from Assoc & JV 0 0 0 0 Creditors Turn (avg days) 22.9 22.4 21.2 26.3<br />
O<strong>the</strong>r Investing CF 0 (1,212) (81) (85) Inventory Turn (avg days) 22.7 25.0 22.8 28.3<br />
Net Investing CF (362) (1,812) (481) (285) Current Ratio (x) 3.5 3.9 2.7 2.4<br />
Div Paid (21) (42) (87) (113) Quick Ratio (x) 3.2 3.6 2.3 2.1<br />
Chg in Gross Debt 406 621 (82) (45) Net Debt/Equity (X) 1.0 0.6 0.6 0.3<br />
<strong>Cap</strong>ital Issues 0 1,120 0 0 <strong>Cap</strong>ex to Debt (%) 40.2 39.4 27.8 14.3<br />
O<strong>the</strong>r Financing CF (67) 0 0 0 N. Cash/(Debt)PS (Rp) (263.7) (297.5) (343.3) (263.4)<br />
Net Financing CF 318 1,699 (170) (158) Opg CFPS (Rp) 87.6 81.1 152.2 196.0<br />
Net Cashflow 73 284 (256) 257 Free CFPS (Rp) (105.2) (53.3) (1.3) 132.1<br />
Quarterly / Interim Income Statement (Rp bn)<br />
Revenue Composition (11M07)<br />
FY Dec 4Q2006 1Q2007 2Q2007 3Q2007<br />
Turnover 379 264 393 458<br />
Cost of Goods Sold (258) (165) (255) (260)<br />
Gross Profit 121 99 138 198<br />
O<strong>the</strong>r Oper. (Exp)/Inc (47) (29) (36) (44)<br />
Operating Profit 74 70 103 154<br />
O<strong>the</strong>r Non Opg (Exp)/Inc (5) (11) 5 (25)<br />
Associates & JV Inc 0 0 0 0<br />
Net Interest (Exp)/Inc (29) (28) (29) (38)<br />
Exceptional Gain/(Loss) 0 0 (3) 0<br />
Pre-tax Profit 40 31 76 90<br />
Tax (12) (13) (20) (28)<br />
Minority Interest 0 0 0 0<br />
Net Profit 28 18 56 62<br />
Net profit bef Except. 28 18 59 62<br />
EBITDA 69 59 108 128<br />
Sales Gth (%) 8.3 (30.3) 48.7 16.5<br />
EBITDA Gth (%) (35.9) (14.2) 81.8 19.1<br />
Opg Profit Gth (%) (27.7) (5.3) 46.0 49.6<br />
Net Profit Gth (%) (56.2) (34.1) 201.6 11.3<br />
Gross Margins (%) 32.0 37.6 35.2 43.2<br />
Opg Profit Margins (%) 19.6 26.6 26.1 33.5<br />
Net Profit Margins (%) 7.4 7.0 14.2 13.5<br />
Source: Company, <strong>DBS</strong> <strong>Vickers</strong><br />
Rubber 30%<br />
Source: Company<br />
Oil Palm Related<br />
70%<br />
Page 57


