Small/Mid Cap Strategy and Stock Picks - the DBS Vickers ...
Small/Mid Cap Strategy and Stock Picks - the DBS Vickers ... Small/Mid Cap Strategy and Stock Picks - the DBS Vickers ...
Regional Small/Mid Cap Strategy Q2 2008 Indorama Polymers Bloomberg: IRP TB | Reuters: IRP.BK BUY Bt9.00 SET : 820.31 Price Target : 12-Month Bt 14.00 Potential Catalyst: Recovering product spreads, earnings contribution from latest acquisition. Analyst Vichitr Kuladejkhuna CFA +66 0 26577826 vichitrk@th.dbsvickers.com Price Relative 11 . 70 10 . 70 9 . 70 8 . 70 7 . 70 6 . 70 5 . 70 4 . 70 3 . 70 2 . 70 Bt Relative Index Aug - 05 Feb - 06 Aug - 06 Feb - 07 Aug - 07 Feb - 08 Indorama Polymers ( LHS ) Relative SET INDEX ( RHS ) Forecasts and Valuation FY Dec (Bt m) 2006A 2007A 2008F 2009F Turnover 11,847 25,551 36,034 49,815 EBITDA 1,230 2,069 3,227 4,182 Pre-tax Profit 844 1,129 2,009 2,831 Net Profit 784 1,073 1,836 2,507 Net Pft (Pre Ex.) 784 1,073 1,836 2,507 EPS (Bt) 0.6 0.8 1.3 1.8 EPS Pre Ex. (Bt) 0.6 0.8 1.3 1.8 EPS Gth Pre Ex (%) 2 37 71 37 Diluted EPS (Bt) 0.6 0.8 1.3 1.8 Net DPS (Bt) 0.2 0.2 0.4 0.6 BV Per Share (Bt) 3.2 3.8 4.9 6.3 PE (X) 15.9 11.6 6.8 5.0 PE Pre Ex. (X) 15.9 11.6 6.8 5.0 P/Cash Flow (X) 12.0 8.0 5.0 3.8 EV/EBITDA (X) 14.6 8.9 6.8 5.1 Net Div Yield (%) 1.9 2.7 4.4 6.1 P/Book Value (X) 2.8 2.3 1.8 1.4 Net Debt/Equity (X) 1.1 1.0 1.3 0.9 ROAE (%) 18.3 21.9 30.3 32.2 Consensus EPS (Bt): 1.2 1.6 Sector : Petrochemicals & Chemicals Principal Business: World-class producers of PET polymer with facilities in Thailand, the US, and Europe. 219 169 119 69 19 Among Thailand’s top growth story Story: IRP is on track to achieve its aggressive growth target of 1.4m t.p.a. PET production capacity and become the world’s 2nd largest producer by 2009. IRP’s production capacity was 603,000 t.p.a. at the end of 2007, while the acquisition of 355,000 t.p.a. facilities in the U.K. and Netherlands is expected to complete by end-Mar 2008. The greenfield 432,000 t.p.a. plant in the U.S.A. would fulfill its target. Point: PET product spread was weak in 2H07 owing to a sharp rise in MEG (Mono Ethylene Glycol, c.30% of raw material) price due to supply shortage. However, MEG price has fallen by US$200-300/tonne since early 2008 as supply is expected to normalise in 2Q08. Together with earnings contribution from the newlyacquired assets, we expect IRP’s earnings to improve significantly from 2Q08 onwards. We expect product spread to improve from an average of US$212/tonne in 2007 to US$220-230/tonne in 2008 on the back of (i) normalised MEG price, and (ii) less competitive PET pricing due to limited new supply this year vs large glut of new capacity startup in 2007. We expect earnings to jump 84% in 2008 and 16% in 2009. Relevance: IRP is one of the top growth stocks in our Thailand universe. Valuations are cheap at just 6.8x 2008 PE and moderate dividend yield of 4.4%. With 56% upside to our target price of Bt14.0 (10.5x 2008 PE) and prospect for earnings jump in 2Q08, IRP is one of our top picks. Reiterate Buy. At A Glance Issued Capital (m shrs) 1,382 Mkt. Cap (Btm/US$m) 12,440 / 395 Major Shareholders Beacon Global (%) 38.9 Indorama Industries (%) 26.5 Indorama Synthetics (India) Ltd. (%) 7.2 Free Float (%) 28.0 Avg. Daily Vol.(‘000) 482 Page 48 www.dbsvickers.com Refer to important disclosures at the end of this report
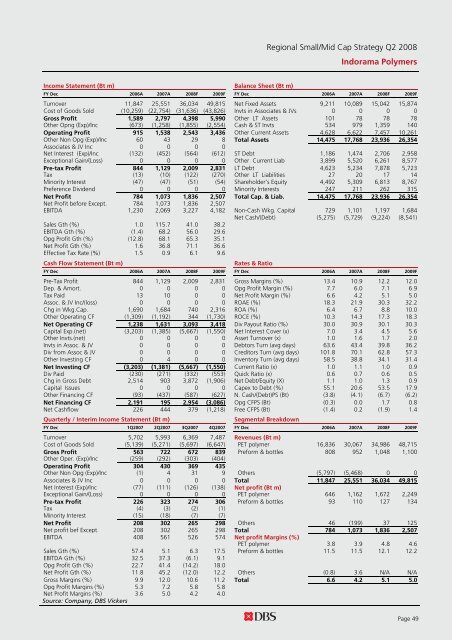
Regional Small/Mid Cap Strategy Q2 2008 Indorama Polymers Income Statement (Bt m) Balance Sheet (Bt m) FY Dec 2006A 2007A 2008F 2009F FY Dec 2006A 2007A 2008F 2009F Turnover 11,847 25,551 36,034 49,815 Net Fixed Assets 9,211 10,089 15,042 15,874 Cost of Goods Sold (10,259) (22,754) (31,636) (43,826) Invts in Associates & JVs 0 0 0 0 Gross Profit 1,589 2,797 4,398 5,990 Other LT Assets 101 78 78 78 Other Opng (Exp)/Inc (673) (1,258) (1,855) (2,554) Cash & ST Invts 534 979 1,359 140 Operating Profit 915 1,538 2,543 3,436 Other Current Assets 4,628 6,622 7,457 10,261 Other Non Opg (Exp)/Inc 60 43 29 8 Total Assets 14,475 17,768 23,936 26,354 Associates & JV Inc 0 0 0 0 Net Interest (Exp)/Inc (132) (452) (564) (612) ST Debt 1,186 1,474 2,706 2,958 Exceptional Gain/(Loss) 0 0 0 0 Other Current Liab 3,899 5,520 6,261 8,577 Pre-tax Profit 844 1,129 2,009 2,831 LT Debt 4,623 5,234 7,878 5,723 Tax (13) (10) (122) (270) Other LT Liabilities 27 20 17 14 Minority Interest (47) (47) (51) (54) Shareholder’s Equity 4,492 5,309 6,813 8,767 Preference Dividend 0 0 0 0 Minority Interests 247 211 262 315 Net Profit 784 1,073 1,836 2,507 Total Cap. & Liab. 14,475 17,768 23,936 26,354 Net Profit before Except. 784 1,073 1,836 2,507 EBITDA 1,230 2,069 3,227 4,182 Non-Cash Wkg. Capital 729 1,101 1,197 1,684 Net Cash/(Debt) (5,275) (5,729) (9,224) (8,541) Sales Gth (%) 1.0 115.7 41.0 38.2 EBITDA Gth (%) (1.4) 68.2 56.0 29.6 Opg Profit Gth (%) (12.8) 68.1 65.3 35.1 Net Profit Gth (%) 1.6 36.8 71.1 36.6 Effective Tax Rate (%) 1.5 0.9 6.1 9.6 Cash Flow Statement (Bt m) Rates & Ratio FY Dec 2006A 2007A 2008F 2009F FY Dec 2006A 2007A 2008F 2009F Pre-Tax Profit 844 1,129 2,009 2,831 Gross Margins (%) 13.4 10.9 12.2 12.0 Dep. & Amort. 0 0 0 0 Opg Profit Margin (%) 7.7 6.0 7.1 6.9 Tax Paid 13 10 0 0 Net Profit Margin (%) 6.6 4.2 5.1 5.0 Assoc. & JV Inc/(loss) 0 0 0 0 ROAE (%) 18.3 21.9 30.3 32.2 Chg in Wkg.Cap. 1,690 1,684 740 2,316 ROA (%) 6.4 6.7 8.8 10.0 Other Operating CF (1,309) (1,192) 344 (1,730) ROCE (%) 10.3 14.3 17.3 18.3 Net Operating CF 1,238 1,631 3,093 3,418 Div Payout Ratio (%) 30.0 30.9 30.1 30.3 Capital Exp.(net) (3,203) (1,385) (5,667) (1,550) Net Interest Cover (x) 7.0 3.4 4.5 5.6 Other Invts.(net) 0 0 0 0 Asset Turnover (x) 1.0 1.6 1.7 2.0 Invts in Assoc. & JV 0 0 0 0 Debtors Turn (avg days) 63.6 43.4 39.8 36.2 Div from Assoc & JV 0 0 0 0 Creditors Turn (avg days) 101.8 70.1 62.8 57.3 Other Investing CF 0 4 0 0 Inventory Turn (avg days) 58.5 38.8 34.1 31.4 Net Investing CF (3,203) (1,381) (5,667) (1,550) Current Ratio (x) 1.0 1.1 1.0 0.9 Div Paid (230) (271) (332) (553) Quick Ratio (x) 0.6 0.7 0.6 0.5 Chg in Gross Debt 2,514 903 3,872 (1,906) Net Debt/Equity (X) 1.1 1.0 1.3 0.9 Capital Issues 0 0 0 0 Capex to Debt (%) 55.1 20.6 53.5 17.9 Other Financing CF (93) (437) (587) (627) N. Cash/(Debt)PS (Bt) (3.8) (4.1) (6.7) (6.2) Net Financing CF 2,191 195 2,954 (3,086) Opg CFPS (Bt) (0.3) 0.0 1.7 0.8 Net Cashflow 226 444 379 (1,218) Free CFPS (Bt) (1.4) 0.2 (1.9) 1.4 Quarterly / Interim Income Statement (Bt m) Segmental Breakdown FY Dec 1Q2007 2Q2007 3Q2007 4Q2007 FY Dec 2006A 2007A 2008F 2009F Turnover 5,702 5,993 6,369 7,487 Revenues (Bt m) Cost of Goods Sold (5,139) (5,271) (5,697) (6,647) PET polymer 16,836 30,067 34,986 48,715 Gross Profit 563 722 672 839 Preform & bottles 808 952 1,048 1,100 Other Oper. (Exp)/Inc (259) (292) (303) (404) Operating Profit 304 430 369 435 Other Non Opg (Exp)/Inc (1) 4 31 9 Others (5,797) (5,468) 0 0 Associates & JV Inc 0 0 0 0 Total 11,847 25,551 36,034 49,815 Net Interest (Exp)/Inc (77) (111) (126) (138) Net profit (Bt m) Exceptional Gain/(Loss) 0 0 0 0 PET polymer 646 1,162 1,672 2,249 Pre-tax Profit 226 323 274 306 Preform & bottles 93 110 127 134 Tax (4) (3) (2) (1) Minority Interest (15) (18) (7) (7) Net Profit 208 302 265 298 Others 46 (199) 37 125 Net profit bef Except. 208 302 265 298 Total 784 1,073 1,836 2,507 EBITDA 408 561 526 574 Net profit Margins (%) PET polymer 3.8 3.9 4.8 4.6 Sales Gth (%) 57.4 5.1 6.3 17.5 Preform & bottles 11.5 11.5 12.1 12.2 EBITDA Gth (%) 32.5 37.3 (6.1) 9.1 Opg Profit Gth (%) 22.7 41.4 (14.2) 18.0 Net Profit Gth (%) 11.8 45.2 (12.0) 12.2 Others (0.8) 3.6 N/A N/A Gross Margins (%) 9.9 12.0 10.6 11.2 Total 6.6 4.2 5.1 5.0 Opg Profit Margins (%) 5.3 7.2 5.8 5.8 Net Profit Margins (%) 3.6 5.0 4.2 4.0 Source: Company, DBS Vickers Page 49
- Page 1 and 2: DBS Group Research Regional Small/M
- Page 3 and 4: Regional Small/Mid Cap Strategy Q2
- Page 5 and 6: Regional Small/Mid Cap Strategy Q2
- Page 7 and 8: Regional Small/Mid Strategy Q2 2008
- Page 9 and 10: Regional Small/Mid Strategy Q2 2008
- Page 11 and 12: Regional Small/Mid Strategy Q2 2008
- Page 13 and 14: Regional Small/Mid Cap Strategy Q2
- Page 15 and 16: Regional Small/Mid Cap Strategy Q2
- Page 17 and 18: Regional Small/Mid Cap Strategy Q2
- Page 19 and 20: Regional Small/Mid Cap Strategy Q2
- Page 21 and 22: Regional Small/Mid Cap Strategy Q2
- Page 23 and 24: Regional Small/Mid Cap Strategy Q2
- Page 25 and 26: Regional Small/Mid Cap Strategy Q2
- Page 27 and 28: Regional Small/Mid Cap Strategy Q2
- Page 29 and 30: Regional Small/Mid Cap Strategy Q2
- Page 31 and 32: Regional Small/Mid Cap Strategy Q2
- Page 33 and 34: Regional Small/Mid Cap Strategy Q2
- Page 35 and 36: Regional Small/Mid Cap Strategy Q2
- Page 37 and 38: Regional Small/Mid Cap Strategy Q2
- Page 39 and 40: Regional Small/Mid Cap Strategy Q2
- Page 41 and 42: Regional Small/Mid Strategy Q2 2008
- Page 43 and 44: Regional Small/Mid Cap Strategy Q2
- Page 45 and 46: Regional Small/Mid Cap Strategy Q2
- Page 47: Regional Small/Mid Cap Strategy Q2
- Page 51 and 52: Regional Small/Mid Cap Strategy Q2
- Page 53 and 54: Regional Small/Mid Cap Strategy Q2
- Page 55 and 56: Regional Small/Mid Cap Strategy Q2
- Page 57 and 58: Regional Small/Mid Cap Strategy Q2
- Page 59 and 60: Regional Small/Mid Cap Strategy Q2
- Page 61 and 62: Regional Small/Mid Strategy Q2 2008
- Page 63 and 64: Regional Small/Mid Cap Strategy Q2
- Page 65 and 66: Regional Small/Mid Cap Strategy Q2
- Page 67 and 68: Regional Small/Mid Cap Strategy Q2
- Page 69 and 70: Regional Small/Mid Cap Strategy Q2
- Page 71 and 72: Regional Small/Mid Cap Strategy Q2
- Page 73 and 74: Regional Small/Mid Cap Strategy Q2
- Page 75 and 76: Regional Small/Mid Cap Strategy Q2
Regional <strong>Small</strong>/<strong>Mid</strong> <strong>Cap</strong> <strong>Strategy</strong> Q2 2008<br />
Indorama Polymers<br />
Income Statement (Bt m) Balance Sheet (Bt m)<br />
FY Dec 2006A 2007A 2008F 2009F FY Dec 2006A 2007A 2008F 2009F<br />
Turnover 11,847 25,551 36,034 49,815 Net Fixed Assets 9,211 10,089 15,042 15,874<br />
Cost of Goods Sold (10,259) (22,754) (31,636) (43,826) Invts in Associates & JVs 0 0 0 0<br />
Gross Profit 1,589 2,797 4,398 5,990 O<strong>the</strong>r LT Assets 101 78 78 78<br />
O<strong>the</strong>r Opng (Exp)/Inc (673) (1,258) (1,855) (2,554) Cash & ST Invts 534 979 1,359 140<br />
Operating Profit 915 1,538 2,543 3,436 O<strong>the</strong>r Current Assets 4,628 6,622 7,457 10,261<br />
O<strong>the</strong>r Non Opg (Exp)/Inc 60 43 29 8 Total Assets 14,475 17,768 23,936 26,354<br />
Associates & JV Inc 0 0 0 0<br />
Net Interest (Exp)/Inc (132) (452) (564) (612) ST Debt 1,186 1,474 2,706 2,958<br />
Exceptional Gain/(Loss) 0 0 0 0 O<strong>the</strong>r Current Liab 3,899 5,520 6,261 8,577<br />
Pre-tax Profit 844 1,129 2,009 2,831 LT Debt 4,623 5,234 7,878 5,723<br />
Tax (13) (10) (122) (270) O<strong>the</strong>r LT Liabilities 27 20 17 14<br />
Minority Interest (47) (47) (51) (54) Shareholder’s Equity 4,492 5,309 6,813 8,767<br />
Preference Dividend 0 0 0 0 Minority Interests 247 211 262 315<br />
Net Profit 784 1,073 1,836 2,507 Total <strong>Cap</strong>. & Liab. 14,475 17,768 23,936 26,354<br />
Net Profit before Except. 784 1,073 1,836 2,507<br />
EBITDA 1,230 2,069 3,227 4,182 Non-Cash Wkg. <strong>Cap</strong>ital 729 1,101 1,197 1,684<br />
Net Cash/(Debt) (5,275) (5,729) (9,224) (8,541)<br />
Sales Gth (%) 1.0 115.7 41.0 38.2<br />
EBITDA Gth (%) (1.4) 68.2 56.0 29.6<br />
Opg Profit Gth (%) (12.8) 68.1 65.3 35.1<br />
Net Profit Gth (%) 1.6 36.8 71.1 36.6<br />
Effective Tax Rate (%) 1.5 0.9 6.1 9.6<br />
Cash Flow Statement (Bt m)<br />
Rates & Ratio<br />
FY Dec 2006A 2007A 2008F 2009F FY Dec 2006A 2007A 2008F 2009F<br />
Pre-Tax Profit 844 1,129 2,009 2,831 Gross Margins (%) 13.4 10.9 12.2 12.0<br />
Dep. & Amort. 0 0 0 0 Opg Profit Margin (%) 7.7 6.0 7.1 6.9<br />
Tax Paid 13 10 0 0 Net Profit Margin (%) 6.6 4.2 5.1 5.0<br />
Assoc. & JV Inc/(loss) 0 0 0 0 ROAE (%) 18.3 21.9 30.3 32.2<br />
Chg in Wkg.<strong>Cap</strong>. 1,690 1,684 740 2,316 ROA (%) 6.4 6.7 8.8 10.0<br />
O<strong>the</strong>r Operating CF (1,309) (1,192) 344 (1,730) ROCE (%) 10.3 14.3 17.3 18.3<br />
Net Operating CF 1,238 1,631 3,093 3,418 Div Payout Ratio (%) 30.0 30.9 30.1 30.3<br />
<strong>Cap</strong>ital Exp.(net) (3,203) (1,385) (5,667) (1,550) Net Interest Cover (x) 7.0 3.4 4.5 5.6<br />
O<strong>the</strong>r Invts.(net) 0 0 0 0 Asset Turnover (x) 1.0 1.6 1.7 2.0<br />
Invts in Assoc. & JV 0 0 0 0 Debtors Turn (avg days) 63.6 43.4 39.8 36.2<br />
Div from Assoc & JV 0 0 0 0 Creditors Turn (avg days) 101.8 70.1 62.8 57.3<br />
O<strong>the</strong>r Investing CF 0 4 0 0 Inventory Turn (avg days) 58.5 38.8 34.1 31.4<br />
Net Investing CF (3,203) (1,381) (5,667) (1,550) Current Ratio (x) 1.0 1.1 1.0 0.9<br />
Div Paid (230) (271) (332) (553) Quick Ratio (x) 0.6 0.7 0.6 0.5<br />
Chg in Gross Debt 2,514 903 3,872 (1,906) Net Debt/Equity (X) 1.1 1.0 1.3 0.9<br />
<strong>Cap</strong>ital Issues 0 0 0 0 <strong>Cap</strong>ex to Debt (%) 55.1 20.6 53.5 17.9<br />
O<strong>the</strong>r Financing CF (93) (437) (587) (627) N. Cash/(Debt)PS (Bt) (3.8) (4.1) (6.7) (6.2)<br />
Net Financing CF 2,191 195 2,954 (3,086) Opg CFPS (Bt) (0.3) 0.0 1.7 0.8<br />
Net Cashflow 226 444 379 (1,218) Free CFPS (Bt) (1.4) 0.2 (1.9) 1.4<br />
Quarterly / Interim Income Statement (Bt m)<br />
Segmental Breakdown<br />
FY Dec 1Q2007 2Q2007 3Q2007 4Q2007 FY Dec 2006A 2007A 2008F 2009F<br />
Turnover 5,702 5,993 6,369 7,487 Revenues (Bt m)<br />
Cost of Goods Sold (5,139) (5,271) (5,697) (6,647) PET polymer 16,836 30,067 34,986 48,715<br />
Gross Profit 563 722 672 839 Preform & bottles 808 952 1,048 1,100<br />
O<strong>the</strong>r Oper. (Exp)/Inc (259) (292) (303) (404)<br />
Operating Profit 304 430 369 435<br />
O<strong>the</strong>r Non Opg (Exp)/Inc (1) 4 31 9 O<strong>the</strong>rs (5,797) (5,468) 0 0<br />
Associates & JV Inc 0 0 0 0 Total 11,847 25,551 36,034 49,815<br />
Net Interest (Exp)/Inc (77) (111) (126) (138) Net profit (Bt m)<br />
Exceptional Gain/(Loss) 0 0 0 0 PET polymer 646 1,162 1,672 2,249<br />
Pre-tax Profit 226 323 274 306 Preform & bottles 93 110 127 134<br />
Tax (4) (3) (2) (1)<br />
Minority Interest (15) (18) (7) (7)<br />
Net Profit 208 302 265 298 O<strong>the</strong>rs 46 (199) 37 125<br />
Net profit bef Except. 208 302 265 298 Total 784 1,073 1,836 2,507<br />
EBITDA 408 561 526 574 Net profit Margins (%)<br />
PET polymer 3.8 3.9 4.8 4.6<br />
Sales Gth (%) 57.4 5.1 6.3 17.5 Preform & bottles 11.5 11.5 12.1 12.2<br />
EBITDA Gth (%) 32.5 37.3 (6.1) 9.1<br />
Opg Profit Gth (%) 22.7 41.4 (14.2) 18.0<br />
Net Profit Gth (%) 11.8 45.2 (12.0) 12.2 O<strong>the</strong>rs (0.8) 3.6 N/A N/A<br />
Gross Margins (%) 9.9 12.0 10.6 11.2 Total 6.6 4.2 5.1 5.0<br />
Opg Profit Margins (%) 5.3 7.2 5.8 5.8<br />
Net Profit Margins (%) 3.6 5.0 4.2 4.0<br />
Source: Company, <strong>DBS</strong> <strong>Vickers</strong><br />
Page 49


