Hist and Proj Operating Receipts FY 2011 2 17 2010 - DC Water
Hist and Proj Operating Receipts FY 2011 2 17 2010 - DC Water
Hist and Proj Operating Receipts FY 2011 2 17 2010 - DC Water

You also want an ePaper? Increase the reach of your titles
YUMPU automatically turns print PDFs into web optimized ePapers that Google loves.
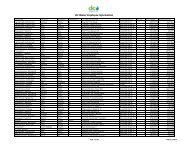
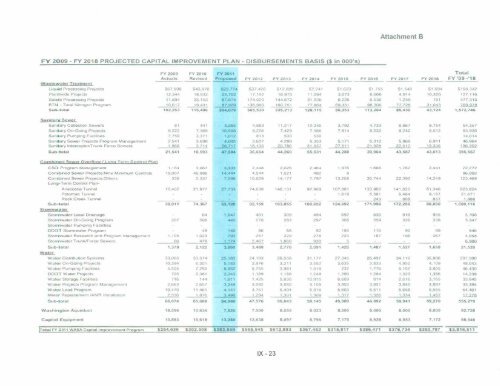
<strong>FY</strong> 2009 - <strong>FY</strong> 2018 PROJECTED CAPITAL IMPROVEMENT PLAN - DISBURSEMENTS BASIS ($ in OOO's)<br />
<strong>FY</strong> 2009 <strong>FY</strong> <strong>2010</strong> <strong>FY</strong> <strong>2011</strong> Total<br />
Actuals Revised Proposed <strong>FY</strong> 2012 <strong>FY</strong> 2013 <strong>FY</strong> 2014 <strong>FY</strong> 2015 <strong>FY</strong> 2016 <strong>FY</strong> 20<strong>17</strong> <strong>FY</strong> 2018 <strong>FY</strong> '09 ·'18<br />
Wastevvater Treatment<br />
Liquid Processing <strong>Proj</strong>ects $67.598 S43.970 $22.774 537,428 $12.820 57.241 $1.623 $1,755 $1.540 $1.594 $198.342<br />
Plantw,de <strong>Proj</strong>ects 12.344 18.932 25.702 <strong>17</strong>.102 16.970 11.084 3.073 6.668 4.914 10.326 127.116<br />
Solids Processing <strong>Proj</strong>ects 11.694 33.153 67.674 <strong>17</strong>4.020 144.672 31.926 6.226 6.536 1.248 161 477.310<br />
BTN - Total Nitrogen Program 10.6<strong>17</strong> 19.431 87,929 136.980 160.751 77.864 69.331 98.306 77.728 31.043 ~<br />
Sub-total 102,253 115,486 204.079 365,530 335,213 128.115 80,253 113,264 85,430 43,124 1,572,746<br />
Sanitary Sewer<br />
Sanitary Collection Sewers 61 441 3,265 4.883 11.2<strong>17</strong> 10.345 3,792 4,733 6.867 8.754 54.357<br />
Sanitary On-Go,ng <strong>Proj</strong>ects 9.222 7.369 10.508 9.226 7.429 7.566 7.814 8.032 8.242 8,512 83.920<br />
Sanitary Pumping Facilities 7.759 3.371 1,012 813 530 530 14.014<br />
Sanitary Sewer <strong>Proj</strong>ects Program Management 2.541 3.698 4,083 3.627 4.299 5.353 5.<strong>17</strong>1 5.312 5.968 6,911 46.964<br />
Sanitary Interceptor/Trunk Force Sewers 1.958 3.714 28,7<strong>17</strong> 18.105 20,786 31.837 27.511 21.828 22.510 19,336 ~<br />
Sub-tolal 21,541 18,593 47,584 36,654 44,260 55,631 44,288 39,904 43,587 43,513 395,557<br />
Co.-nbined Sewer Overflow ! Long Term Control Plan<br />
CSO Program Management 1.164 3.067 3,333 2.348 2.026 2,464 1,9'16 1.666 1,78'1 2,441 22.272<br />
Combined Sewer <strong>Proj</strong>ects:Nine Minimum Controls 19.007 46.986 14,444 4.544 1.521 482 8 86.992<br />
Combined Sewer <strong>Proj</strong>ects:Others 338 2.337 7.598 10.629 14.<strong>17</strong>7 7.797 13.208 30.744 22.392 14.249 123,469<br />
Long-Term Control Plan-<br />
Anacostia Tunnel 10,402 21.977 27,753 74.638 146.131 97.909 107,881 133.962 141.825 61.346 823.824<br />
Potomac Tunnel 1.619 5.381 5,484 9.187 21.671<br />
Rock Creek Tunnel 243 808 837 1,888<br />
Sub-total 30,911 74,367 53,128 92,159 163,855 108,652 124,692 <strong>17</strong>1,996 <strong>17</strong>2,296 88,060 1,080,116<br />
StQrmwater<br />
~<br />
Stormwater Local Drainage 64 1,047 401 309 494 692 830 916 955 5.708<br />
Storm water On-Going Program 207 506 445 278 283 297 308 359 326 338 3.347<br />
Stormwater Pumping Facilities<br />
OOOT Stormwater Program 49 140 86 88 92 193 110 90 99 946<br />
Stormwater Research <strong>and</strong> Program Management 1.105 1.023 793 257 229 278 223 187 196 267 4.558<br />
Storm water Trunk/Force Sewers 66 479 1,<strong>17</strong>4 2.467 1.860 930 5 ~<br />
Sub-total 1,378 2,122 3.600 3,488 2,770 2.091 1,420 1,487 1,527 1,658 21,539<br />
<strong>Water</strong> Distribution Systems 33.065 33.574 25,185 24.193 26,558 31.1'<strong>17</strong> 27.345 26.497 34.110 35.886 297.590<br />
<strong>Water</strong> On-Goin9 <strong>Proj</strong>ects 10.394 6.301 5,183 2.876 3.211 3.552 3.635 3.833 4.950 4.109 48.043<br />
<strong>Water</strong> Pumping Facilities 5.505 7,293 8,952 8.755 3.981 1.018 237 1.776 5.107 3,805 46.430<br />
OOOT <strong>Water</strong> <strong>Proj</strong>ects 705 2.381 2,243 1.189 1,188 1.248 1.290 1.284 1.323 1.386 14.238<br />
<strong>Water</strong> Storage FaCilities 716 144 1,611 1.425 5.830 10.915 6.609 814 2,616 3.165 33.845<br />
<strong>Water</strong> <strong>Proj</strong>ects Program Management 2.663 2.65'1 3,248 3.092 3.080 3.109 3.953 3.851 3.845 3.897 33.394<br />
<strong>Water</strong> Lead Pro9ram 10,4'10 11.461 4,141 4.751 5.494 5.816 5.603 5.511 5.658 5.555 64.461<br />
Meter Replacement IAMR Installation 2,556 1876 3,498 1.294 1,301 1,309 1,3<strong>17</strong> 1.326 1,334 1,467 .1.U1.a<br />
Sub-tolal 66,074 65,688 54.060 47,576 50,643 58,145 49.989 44,892 58,941 59,270 555,279<br />
Washington Aqueduct 18,596 10,634 7,920 7,500 8,055 8,023 8,000 8,000 8,000 8,000 92,728<br />
Capital Equipment 13,883 15,618 13,288 12,638 8,097 6,795 7,<strong>17</strong>5 6,928 6,953 7,<strong>17</strong>2 98,546<br />
frotal <strong>FY</strong> <strong>2011</strong> WASA Capitallmprovcmont Program $254,636 $302,508 $383,659 $565,545 $612,893 $367,452 $315,8<strong>17</strong> $386,471 $376,734 $250,797 $3,816,511<br />
IX - 23