- Page 1 and 2:
District of Columbia Water and Sewe
- Page 3 and 4:
DC WASA's CRITICAL SUCCESS FACTORS
- Page 5 and 6:
ACKNOWLEDGEMENTS PR¡NCIPAL STAFF M
- Page 7 and 8:
( GOVER NMENT FINANC B OFFICERS ASS
- Page 9 and 10:
FY 2010 Oper. Expend. by Department
- Page 11 and 12:
DISTRICT OF COLUMBIA WATER AND SEWE
- Page 13 and 14:
. lncrease the rate of main replace
- Page 15 and 16:
R AND SEWER SOOO OVERLOOK AVENUE, S
- Page 17 and 18:
FY 2010 Budget Major Reductions (¡
- Page 19 and 20:
A Strong Track Record of Capital lm
- Page 21 and 22:
Budgeting for Performance - Ensurin
- Page 23 and 24:
DC WASA successfully completed anot
- Page 25 and 26:
High Use Notification Application (
- Page 27 and 28:
PCI Standards - DC WASA implemented
- Page 29 and 30:
Website Enhancements - Continuing t
- Page 31 and 32:
District. In FY 2009, we commenced
- Page 33 and 34:
• Water Quality Library, to be de
- Page 35 and 36:
services we provide. In FY 2010, we
- Page 37 and 38:
Boys Town of Washington, DC - Durin
- Page 39 and 40:
CI> E! $25.00 .s::. ••• U ~ $
- Page 41 and 42:
This Strategic Plan Critical Succes
- Page 43 and 44:
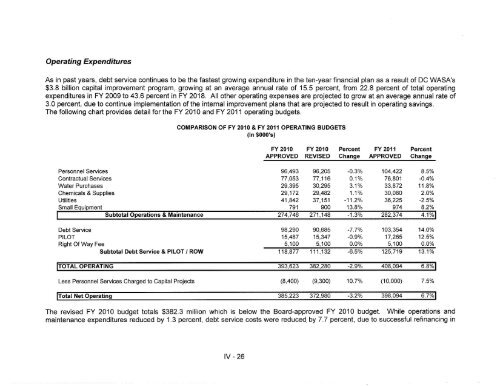
FY 2010 & FY 2011 Operating (In 000
- Page 45 and 46:
Overtime History Dollars and Hours
- Page 47 and 48:
In FY 2009, we completed a study of
- Page 49 and 50:
DC WASA's ten-year capital improvem
- Page 51 and 52:
• Local and Minority Business Rev
- Page 53 and 54:
target for replacement of non-stand
- Page 55 and 56:
DC WASA continues to invest in wate
- Page 57 and 58:
Anacostia and Rock Creek Park, and
- Page 59 and 60:
modification to the permit reducing
- Page 61 and 62:
ELECTRICITY PRICING (ALL-IN-COST) $
- Page 63 and 64: carbon footprint legislation and re
- Page 65 and 66: • Automated Fuel Tracking - to fa
- Page 67 and 68: (AWWA) verifies that the growing re
- Page 69 and 70: Total Rewards Statements - During F
- Page 71 and 72: People Working Together to Make A D
- Page 73 and 74: DC WASA's contractor lost workday c
- Page 75 and 76: District of Columbia Water and Sewe
- Page 77 and 78: District of Columbia Water and Sewe
- Page 79 and 80: Regional Macro-Economics DC WASlt's
- Page 81 and 82: KEY FACTS There appears to be a dir
- Page 83 and 84: FY 2010 Revised Budget ($ooo's¡ CA
- Page 85 and 86: Comoarative Exoenditures ($000's) F
- Page 87 and 88: ACCOUNTING AND BUDGET PROCESSES Bas
- Page 89 and 90: FY 2O1l Budget Galendar Month Event
- Page 91 and 92: WASA Key Flr,ltr,¡cnl PorlctEs DEB
- Page 93 and 94: Financing and Reserue Policies ln F
- Page 95 and 96: Gustomer Demand and Demographics -
- Page 97 and 98: DCCommercialWater Denund rr. Commer
- Page 99 and 100: and implementation of successful pr
- Page 101 and 102: - DC WASA changed banks on Septembe
- Page 103 and 104: Raúes. The proposed rate and fee a
- Page 105 and 106: The proposed monthly IAC charge for
- Page 107 and 108: under the program by DDOE and to mi
- Page 109 and 110: CSO LTCP Spending by Year 123.3 y4.
- Page 111 and 112: 14. Projected decrease in IAC reven
- Page 113: Wholesale - DC WASA's wholesale cus
- Page 117 and 118: the District of Columbia government
- Page 119 and 120: . Wholesale Capital Payments - Appr
- Page 121 and 122: Indenture-Required Operating Reserv
- Page 123 and 124: Water and Sewer System Facility Pla
- Page 125 and 126: and a poss¡ble 2,215 customers wer
- Page 127 and 128: Revenues The proposed FY 2010 recei
- Page 129 and 130: consumption and rate increases, and
- Page 131 and 132: * DC WASA's share of the District's
- Page 133 and 134: FY 2009. The commercial paper progr
- Page 135 and 136: Capital Financing Program, Cash Pos
- Page 137 and 138: Cash Position & Reserwes Cash balan
- Page 139 and 140: Long-Term Operational and Financial
- Page 141 and 142: DISTRICT OF COLUMBIA WATER & SEWER
- Page 143 and 144: 450,000 Historical & Projected Cash
- Page 145 and 146: Hi$orical and Projected Billed Cons
- Page 147 and 148: RECENT & PROPOSED RATE & FEE CHANGE
- Page 149 and 150: $35.00 AVERAGE CAP CUSTOMER MONTHLY
- Page 151 and 152: Fy20,0 RArE-:::il:=: PR,P'SED RA'E
- Page 153 and 154: RECENT & PROPOSED RATE & FEE CHANGE
- Page 155 and 156: FY 2OO9 - FY 2018 FINANCIAL PLAN PR
- Page 157 and 158: FY 2O1O - FY 2018 FINANCIAL PLAN PR
- Page 159 and 160: POTENTIAL IMPACT OF CSO LONG.TERM C
- Page 161 and 162: WHY RATE INCREASES ARE NEEDED, cont
- Page 163 and 164: WHY RATE INCREASES ARE NEEDED, cont
- Page 165 and 166:
WASA,S RETAIL RATES ARE COMPARABLE
- Page 167 and 168:
DC WASA'S RETAIL RATES ARE COMPARAB
- Page 169 and 170:
FY 2009 - FY 2018 Capital lmproveme
- Page 171 and 172:
more w¡dely disposed of at reduced
- Page 173 and 174:
During FY 2009, DC WASA completed a
- Page 175 and 176:
WASHINGTON AQUEDUCT The Washington
- Page 177 and 178:
CAPITAL AUTHORITY As part of DC WAS
- Page 179 and 180:
These are projects that are underta
- Page 181 and 182:
450,000 Historical and Projected Ca
- Page 183 and 184:
CAPITAL EQU I PIIII ENT DISBU RSEIT
- Page 185 and 186:
FY 2009 - FY 2018 Capital Equipment
- Page 187 and 188:
FY 2009 - FY 2018 Capital lmproveme
- Page 189 and 190:
Fiscal Year 2011 Capital Authority
- Page 191 and 192:
FY 2OO9 .2018 CAPITAL IMPROVEMENT P
- Page 193 and 194:
CASH RESERVES SUMMARY (ln $000's) F
- Page 195 and 196:
OursreuilNa Deer SEIIIOR DEBT Publi
- Page 197 and 198:
OUTSTANDING & PROPOSED DEBT SERVICE
- Page 199 and 200:
OUTSTANDING & PROPOSED DEBT SERVICE
- Page 201 and 202:
$6,000,000 TOTAL DEBT OUTSTANDING V
- Page 203 and 204:
District of Columbia Water and Sewe
- Page 205 and 206:
Operations & Maintenance Expenditur
- Page 207 and 208:
Comparative Operating Expenditures
- Page 209 and 210:
Comparative Operating Expenditures
- Page 211 and 212:
Filled vs. Vacant Positions FY 2007
- Page 213 and 214:
Overtime FY 2008 - FY 2011 ($000'5)
- Page 216:
D. C. Water & Sewer Authority Organ
- Page 219 and 220:
MISSION: To treat wastewater delive
- Page 222 and 223:
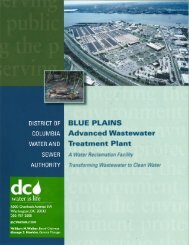
BLUE PLAINS WASTEWATER TREATMENT PL
- Page 224:
BLUE PLAINS WASTEWATER TREATMENT PL
- Page 227 and 228:
I WATER SERVICES I MISSION: To oper
- Page 229 and 230:
HISTORICAL WATER MAIN BREAKS FY 200
- Page 232 and 233:
ASSISTANT GENERAL MANAGER Consumer
- Page 234 and 235:
OVERVIEW FY 2010 Major Recommended
- Page 236 and 237:
ASST. GEN. MGR. Blue Plains POSITIO
- Page 238:
OVERVIEW FY 2010 Major Recommended
- Page 241 and 242:
FY2009 FY 2010 FY2010 FY 2011 Actua
- Page 243 and 244:
~ c: ~ .0 it: ~ ~ cu c: T""" 0 ~ c:
- Page 245 and 246:
MISSION: To perform engineering pla
- Page 247 and 248:
~ ceu .c ;:: ~ ~ euc L{) v 0 +=i c
- Page 249 and 250:
MISSION: To develop, design. constr
- Page 252 and 253:
CHIEF ENGINEER Deputy General Manag
- Page 254:
OVERVIEW FY 2010 Major Recommended
- Page 257 and 258:
BUDGET OVERVIEW: The FY 2010 revise
- Page 260 and 261:
BOARD OF DIRECTORS POSITIONS CURREN
- Page 262 and 263:
OVERVIEW FY 2010 Major Recommended
- Page 264 and 265:
BOARD OF DIRECTORS POSITIONS CURREN
- Page 266:
OVERVIEW FY 2010 Major Recommended
- Page 269 and 270:
INTERNAL AUDIT MISSION: The mission
- Page 272 and 273:
FY 2011 Budget $7,631,000 CHIEF FIN
- Page 274 and 275:
OVERVIEW FY 2010 Major Recommended
- Page 276 and 277:
CHIEF FINANCIAL OFFICER POSITIONS C
- Page 278 and 279:
OVERVIEW FY 2010 Major Recommended
- Page 280 and 281:
BUDGET OVERVIEW: The revised FY 201
- Page 282 and 283:
GENERAL MANAGER CURRENT Average Yea
- Page 284:
OVERVIEW FY 2010 Major Recommended
- Page 287 and 288:
MISSION: To ensure that the Authori
- Page 289 and 290:
• Assume additional operation sup
- Page 292 and 293:
POSITIONS GENERAL CURRENT Average Y
- Page 294:
OVERVIEW FY 2010 Major Recommended
- Page 297 and 298:
MISSION: To deliver high quality, i
- Page 299 and 300:
During FY 2009, the Authority conti
- Page 301 and 302:
and regulations for using electroni
- Page 303 and 304:
To support employees' educational a
- Page 306 and 307:
FY 2011 Budget $6,517,000 Su ASSIST
- Page 308:
OVERVIEW FY 2010 Major Recommended
- Page 311 and 312:
MISSION: To procure, on time and wi
- Page 314 and 315:
ASSISTANT GENERAL MANAGER Authorize
- Page 316:
OVERVIEW FY 2010 Major Recommended
- Page 319 and 320:
BUDGET OVERVIEW: The FY 2010 revise
- Page 322 and 323:
District of Columbia Water and Sewe
- Page 324 and 325:
BOARD OF DIRECTORS: DC WASA's gover
- Page 326 and 327:
FIXED ASSET: Long-lived property ow
- Page 328 and 329:
PAYMENT IN LIEU of TAXES (PILOT): A
- Page 330 and 331:
DETS: DEPARTMENT OF ENGINEERING AND
- Page 332 and 333:
MBE: MINORITY BUSINESS ENTERPRISE R
- Page 334 and 335:
WHEREAS, after extensive discussion
- Page 336 and 337:
WHEREAS, during the January 2010 me
- Page 338 and 339:
and Budget Committees Uointly refer
- Page 340 and 341:
Capital Improvement Plan Descriptio
- Page 342 and 343:
WHEREAS, on December 17, 2009, the
- Page 344 and 345:
FY 2009 - FY 2018 PROJECTED CAPITAL
- Page 346 and 347:
The Board of Directors hereby appro
- Page 348:
Presented and Adopted: February 4,
- Page 351 and 352:
Title 21 DCMR, Chapter 41 RETAIL WA
- Page 353 and 354:
Plan for WASA Board's Low Impact De
- Page 355 and 356:
Presented and Adopted: February 4,
- Page 357 and 358:
Presented and Adopted: February 4,2
- Page 359 and 360:
1. The Board finds that the Authori