Unit 1: Measurement and Motion - CPO Science
Unit 1: Measurement and Motion - CPO Science
Unit 1: Measurement and Motion - CPO Science

You also want an ePaper? Increase the reach of your titles
YUMPU automatically turns print PDFs into web optimized ePapers that Google loves.
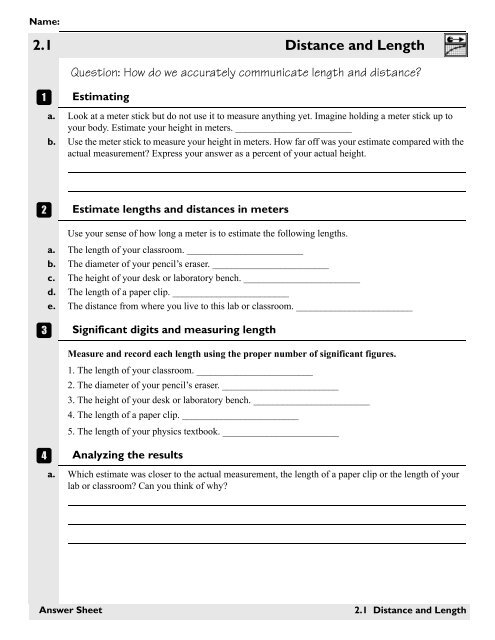
Name:<br />
2.1 Distance <strong>and</strong> Length<br />
A<br />
Question: How do we accurately communicate length <strong>and</strong> distance<br />
Estimating<br />
a. Look at a meter stick but do not use it to measure anything yet. Imagine holding a meter stick up to<br />
your body. Estimate your height in meters. ________________________<br />
b. Use the meter stick to measure your height in meters. How far off was your estimate compared with the<br />
actual measurement Express your answer as a percent of your actual height.<br />
B<br />
Estimate lengths <strong>and</strong> distances in meters<br />
Use your sense of how long a meter is to estimate the following lengths.<br />
a. The length of your classroom. ________________________<br />
b. The diameter of your pencil’s eraser. ________________________<br />
c. The height of your desk or laboratory bench. ________________________<br />
d. The length of a paper clip. ________________________<br />
e. The distance from where you live to this lab or classroom. ________________________<br />
C<br />
Significant digits <strong>and</strong> measuring length<br />
Measure <strong>and</strong> record each length using the proper number of significant figures.<br />
1. The length of your classroom. ________________________<br />
2. The diameter of your pencil’s eraser. ________________________<br />
3. The height of your desk or laboratory bench. ________________________<br />
4. The length of a paper clip. ________________________<br />
5. The length of your physics textbook. ________________________<br />
D<br />
Analyzing the results<br />
a. Which estimate was closer to the actual measurement, the length of a paper clip or the length of your<br />
lab or classroom Can you think of why<br />
Answer Sheet<br />
2.1 Distance <strong>and</strong> Length
. Use a map to estimate the distance from your school or lab to your home. Next time you travel from<br />
your home to school, use the car’s (or bicycle’s) odometer to measure the distance. Compare the<br />
measurement with your estimate.<br />
E<br />
Area<br />
a. Calculate the area of one side of a sheet of paper in square inches.<br />
b. Convert the length <strong>and</strong> width measurements from inches to meters.<br />
c. Calculate the area in square meters.<br />
Hint: The answer is much less than 1 m 2 .<br />
d. Estimate the area of the floor of your lab or classroom.<br />
e. How many sheets of paper would it take to cover the floor of your lab or classroom Explain how you<br />
arrived at your estimate, <strong>and</strong> show any calculations you made.<br />
2.1 Distance <strong>and</strong> Length Answer Sheet
F<br />
Volume<br />
a. How many liters fit in a cube that is 30 centimeters on a side<br />
b. Calculate the volume of a cylinder that has a radius of 4 centimeters <strong>and</strong> a height of 20 centimeters.<br />
The volume of a cylinder is approximately 3.14 × radius × radius × height. This relationship is often<br />
written V = πr 2 h. How many liters fit in this cylinder<br />
G<br />
Volume by experiment<br />
a. Calculate the height of a cylinder that has a radius (r) of 4 centimeters <strong>and</strong> a volume of 1,000 cm 3 .<br />
(Hint: The volume of a cylinder is πr 2 h.)<br />
b. How close did 1 liter of s<strong>and</strong> come to matching the height required to make a volume of 1,000 cm 3 <br />
Answer Sheet<br />
2.1 Distance <strong>and</strong> Length
Extra space for notes <strong>and</strong> performing calculations:<br />
2.1 Distance <strong>and</strong> Length Answer Sheet
Name:<br />
2.2 Time<br />
Question: How do we measure <strong>and</strong> describe time<br />
A<br />
Using the Timer as a stopwatch<br />
There are no questions to answer in Part 1.<br />
B<br />
Mixed units for time<br />
a. Arrange the following three time intervals from shortest to longest:<br />
1) 4 hours, 23 minutes <strong>and</strong> 15 seconds (4:23:15) 2) 250 minutes 3) 16,000 seconds<br />
C<br />
Using the photogates<br />
a. Exactly what action do you take to start <strong>and</strong> stop the Timer Be very specific in your answer. Someone<br />
who has never seen the photogate before should be able to read your answer <strong>and</strong> know what to do with<br />
the light beam to make the Timer start, <strong>and</strong> what to do to make it stop.<br />
b. If you block the light beam several times in a row, does the Timer add each new measurement to the<br />
last one or does it start at zero every time you break the beam Your answer should provide<br />
observations that back up what you say.<br />
Answer Sheet<br />
2.2 Time
D<br />
Using the Timer with two photogates<br />
a. What starts <strong>and</strong> stops the Timer when only the “A” light is on<br />
b. What starts <strong>and</strong> stops the Timer when only the “B” light is on<br />
c. What starts <strong>and</strong> stops the Timer when both “A” <strong>and</strong> “B” lights are on<br />
d. Does the Timer still make measurements when there are no lights on<br />
e. What happens if you go though photogate A once <strong>and</strong> through photogate B multiple times When<br />
answering this question, you might want to think about a race where all the runners start together but<br />
you want each runner’s individual time for finishing the race.<br />
E<br />
Accuracy, resolution <strong>and</strong> precision<br />
a. Resolution means the smallest interval that can be measured. Try using one photogate to determine the<br />
resolution of the Timer. Give your answer in seconds <strong>and</strong> tell how your observations support your<br />
answer.<br />
2.2 Time Answer Sheet
. The word accuracy refers to how close a measurement is to the true value. Which of the following<br />
statements best describes what you know about the accuracy of time measurements made with the<br />
photogates Give a reason for your answer.<br />
1. The Timer is accurate to 0.001 seconds.<br />
2. The Timer is accurate to 0.0001 seconds.<br />
3. It is impossible to know the accuracy without more<br />
information on how the Timer determines one second.<br />
4. A time of 0.0231 seconds is more accurate than<br />
a time of 26 seconds.<br />
c. The word precision describes how closely repeated measurements of the same quantity can be made.<br />
When measurements are very precise, they are close to the same value. For example, an ordinary clock<br />
(with h<strong>and</strong>s) can determine the time to a precision of about a second. That means many people reading<br />
the same clock at the same time will read times that are within a second of each other. It is possible to<br />
be precise but not accurate. Which is likely to be more precise: time measurements made with a<br />
stopwatch or measurements made with photogates<br />
Answer Sheet<br />
2.2 Time
Extra space for notes <strong>and</strong> performing calculations:<br />
2.2 Time Answer Sheet
Name:<br />
2.3 Mass, Matter, <strong>and</strong> the Atom<br />
A<br />
Question: How is mass described<br />
Estimating mass<br />
a. Pick up a full (1 liter) bottle of soda to get a sense of the amount of mass in a kilogram. Next, pick up a<br />
book such as your textbook. Use the comparison to estimate the mass of the book in kilograms.<br />
B<br />
C<br />
D<br />
Estimate the mass of each object:<br />
Estimate the mass of the following objects in kilograms:<br />
a. Your pencil. _____________________<br />
b. Your shoe. _____________________<br />
c. A cement block. _____________________<br />
d. Yourself. _____________________<br />
e. An automobile. _____________________<br />
f. A paper clip. _____________________<br />
Measuring Mass<br />
a. Use the appropriate measuring device to measure the mass in kilograms of each object below:<br />
Your pencil. _____________________<br />
Your shoe. _____________________<br />
A cement block. _____________________<br />
Yourself. _____________________<br />
An automobile. _____________________<br />
A paper clip. _____________________<br />
Scientific notation<br />
a. Rewrite your estimates from 2a - 2f using scientific notation.<br />
Your pencil. _____________________<br />
Your shoe. _____________________<br />
A cement block. _____________________<br />
Yourself. _____________________<br />
An automobile. _____________________<br />
A paper clip. _____________________<br />
Answer Sheet<br />
2.3 Mass, Matter, <strong>and</strong> the Atom
a. Look up or estimate the mass of each of these objects <strong>and</strong> write it both using scientific notation <strong>and</strong> as<br />
a decimal (ordinary) number. It is difficult to write some of the masses as decimal (ordinary) numbers.<br />
a An atom of hydrogen. _____________________<br />
b An atom of uranium. _____________________<br />
c A grain of s<strong>and</strong>. _____________________<br />
d The space shuttle. _____________________<br />
e An official professional soccer ball. _____________________<br />
f The planet Earth. _____________________<br />
2.3 Mass, Matter, <strong>and</strong> the Atom Answer Sheet
Name:<br />
3.1 Speed<br />
Question: What is speed <strong>and</strong> how is it measured<br />
A<br />
Calculating the speed of the rolling ball<br />
Table 1: Speed, Distance, <strong>and</strong> Time Data<br />
Distance from A to B Time from A to B (sec) Speed<br />
(feet) (ft/sec)<br />
(centimeters) (cm/sec)<br />
(inches) (in/sec)<br />
(meters) (m/sec)<br />
a. Calculate the speed of the ball in ft/sec, cm/sec, in/sec, <strong>and</strong> m/sec, <strong>and</strong> write the results in the table.<br />
b. Which is the fastest speed of the four or are they all the same speed<br />
c. Is it possible that a speed of 254 <strong>and</strong> a speed of 100 could be the same speed Explain your answer, <strong>and</strong><br />
<strong>and</strong> state why a speed as “254” is not a very good answer.<br />
B<br />
Relationships between distance, speed, <strong>and</strong> time<br />
There are no questions to answer in Part 2.<br />
C<br />
Setting up a controlled speed<br />
Distance between photogates (m):<br />
Required time from A to B (calculated, sec):<br />
Actual time from A to B (measured, sec):<br />
Actual speed (calculated, m/sec):<br />
Answer Sheet<br />
3.1 Speed
a. How did you make the time between photogates longer<br />
b. How did you make the time between photogates shorter<br />
c. Calculate the percent difference between your measured speed <strong>and</strong> 1 meter per second.<br />
3.1 Speed Answer Sheet
Name:<br />
3.2 Observations of <strong>Motion</strong><br />
A<br />
Question: Can you predict the speed of a ball rolling down a ramp<br />
Setting up an experiment<br />
a. Look around the class <strong>and</strong> note which hole each group is using for its track. With your group, make a<br />
prediction as to which track will have the fastest ball.<br />
b. Roll the ball down the track <strong>and</strong> record the time it takes to go from photogate A to photogate B.<br />
c. Compare your results with other groups’. Did the times that everyone measured agree with your<br />
hypothesis about how the angle of the track would affect the ball’s speed Why or why not<br />
d. Is there a better way to test whether increasing the ramp angle makes the ball go faster Explain how<br />
you would redo this experiment so the results make sense.<br />
B<br />
Variables in an experiment<br />
a. What variables may affect the time it takes the ball to get from photogate A to photogate B Use Table<br />
1 to list all the variables discussed by your group, or by the class.<br />
Table 1: Variables that affect the time between photogates<br />
Variable Variable<br />
C<br />
Doing a controlled experiment<br />
Table 2: Variables <strong>and</strong> values for a controlled experiment<br />
Variable Value Variable Value<br />
Once you have your new results, compare them with the results of the other groups.<br />
Answer Sheet<br />
3.2 Observations of <strong>Motion</strong>
a. Did your times agree with your hypothesis of how they would change with the angle of the track<br />
b. In one or two sentences describe why this experiment was better or worse than your first experiment.<br />
Your answer should discuss the cause-<strong>and</strong>-effect relationships <strong>and</strong> variables.<br />
c. It is often easy to confuse cause <strong>and</strong> effect. When we see something happen, we think up a reason for it<br />
happening but we do not always get the right reason. If you drop a piece of paper <strong>and</strong> a steel weight at<br />
the same time, which one hits the ground first If the paper is flat, the steel weight always hits first.<br />
Why does the steel weight hit first Is it because heavier objects fall faster, or is there another reason<br />
In your answer, give at least one other reason a steel weight might fall faster than a flat sheet of paper.<br />
D<br />
Finding the speed of the ball at different points along the track<br />
Table 3: Speed, position, <strong>and</strong> time data<br />
Position of<br />
photogate A (cm)<br />
from top of track<br />
Time from<br />
photogate A<br />
(sec)<br />
Distance traveled<br />
by the ball<br />
(1.9 cm)<br />
Speed<br />
of the ball<br />
(cm/sec)<br />
3.2 Observations of <strong>Motion</strong> Answer Sheet
E<br />
Graphing <strong>and</strong> analyzing the results<br />
a. Do you notice a trend in your measurements Does the speed of the ball change as it moves down<br />
b. Graph the speed of the ball versus its position. Place speed of the ball on the y-axis <strong>and</strong> position of<br />
photogate A on the x-axis. Add labels to each axis <strong>and</strong> title the graph.<br />
c. What does the graph show about the speed of the ball<br />
Answer Sheet<br />
3.2 Observations of <strong>Motion</strong>
F<br />
Using your graph to predict the speed of the ball<br />
a. Choose a spot on the track where you did not measure the speed of the ball.<br />
b. Use your graph to find the predicted speed of the ball at that position. Record your predicted speed.<br />
c. Use the speed formula to calculate the time it should take the ball to pass through the light beam at the<br />
predicted speed. For example, if the ball were going 100 centimeters per second, it would<br />
take.0190 seconds to pass through the beam (1.9 cm ÷ 100 cm/sec = .0190 sec).<br />
d. Place the photogate at the spot on the track you chose in step (a) <strong>and</strong> record the time it takes for the ball<br />
to pass through the photogate.<br />
e. How does the predicted time compare with the actual measured time What does this tell you about<br />
your experiment <strong>and</strong> measurements<br />
G<br />
Calculating percent error<br />
a. Find the difference between the predicted time <strong>and</strong> the actual measured time.<br />
Predicted time – Actual time = Difference<br />
b. Take this difference <strong>and</strong> divide it by the predicted speed <strong>and</strong> then multiply by 100.<br />
( Difference ÷ Predicted time) × 100 = Percent error<br />
c. Use the percent error to calculate percent correct.<br />
100 – Percent error = Percent correct<br />
3.2 Observations of <strong>Motion</strong> Answer Sheet
Name:<br />
3.3 Analyzing <strong>Motion</strong> with Graphs<br />
A<br />
Question: How do you model motion<br />
Setting up the experiment<br />
a. Suppose the ball takes a longer time to pass through photogate B compared with photogate A. Should<br />
you raise or lower the catcher end to bring the times closer together<br />
b. After you get the track as level as you can, calculate the speed of the ball as it passes through each<br />
photogate. Remember, speed is the diameter (1.9 centimeters) divided by the time through the<br />
photogate. How close are the two speeds Express your answer as a percentage of the speed through<br />
photogate A. For example, the speed at B might be 1 percent slower than the speed at A.<br />
B<br />
C<br />
Measuring the motion of the ball<br />
Record the data in Table 1.<br />
Recording your data in Table 1<br />
Table 1: Position, Speed, <strong>and</strong> Time Data<br />
x<br />
(cm)<br />
t AB<br />
(sec)<br />
t A<br />
(sec)<br />
t B<br />
(sec)<br />
v A<br />
(cm/sec)<br />
v B<br />
(cm/sec)<br />
Answer Sheet<br />
3.3 Analyzing <strong>Motion</strong> with Graphs
D<br />
Graphing <strong>and</strong> analyzing your data<br />
a. Make a position versus time graph using your data. Plot the time from A to B on the x-axis <strong>and</strong> the<br />
position from A to B (position of photogate B) on the y-axis. At this point, do not connect the data<br />
points on the graph. Be sure to label the axes <strong>and</strong> title the graph.<br />
b. Is the graph a straight line or a curve<br />
c. Does the graph get steeper as the ball rolls farther, or does the graph keep the same slope the whole<br />
way What does your answer tell you about the speed of the ball at different times as it rolls along the<br />
track<br />
d. Draw a triangle on your graph <strong>and</strong> determine the rise <strong>and</strong> run from the triangle (see diagram). Calculate<br />
the speed from the slope of the graph. Is the value you get consistent with other speed measurements<br />
you have made with the ball <strong>and</strong> track<br />
3.3 Analyzing <strong>Motion</strong> with Graphs Answer Sheet
E<br />
The speed versus time graph<br />
a. Make a graph of speed versus time. Speed should be the speed at photogate B (v B ) since photogate B<br />
was the one that moved. Time should be the time from A to B (t AB ). Put speed on the y-axis since it is<br />
the dependent variable. Time goes on the x-axis because it is the independent variable.<br />
b. Describe the graph; does it slope up or down Is it level or nearly level Is it a line or a curve<br />
c. Remember, the distance traveled is the product of speed <strong>and</strong> time. Think about a rectangle drawn on<br />
the speed versus time graph. The width of the rectangle is the time. The height of the rectangle is the<br />
speed. Since area is width × height, the area on the speed versus time graph is the distance traveled.<br />
Pick two times that correspond to measurements that are not right next to each other. Draw the<br />
rectangle that lies between the x-axis, the line showing speed, <strong>and</strong> the two times you chose.<br />
Calculate the area of the rectangle. It should be the same as the distance between the two positions of<br />
photogate B.<br />
Answer Sheet<br />
3.3 Analyzing <strong>Motion</strong> with Graphs
Extra space for notes <strong>and</strong> performing calculations:<br />
3.3 Analyzing <strong>Motion</strong> with Graphs Answer Sheet
Name:<br />
4.1 Acceleration<br />
Question: How is the speed of the ball changing<br />
A Setting up Table 1: Acceleration Data<br />
t A : time through A (sec)<br />
t B : time through B (sec)<br />
t AB : time A to B (sec)<br />
v A : speed at A (sec)<br />
v B : speed at B (sec)<br />
a: acceleration (sec)<br />
Trial 1 Trial 2 Trial 3<br />
B<br />
Looking at the data<br />
a. If you moved the photogates to different places, the speeds for each of the three trials should be<br />
different from each other. Are the accelerations different If so, by how much are they different<br />
between the three trials<br />
b. What would the acceleration be if you pushed the ball at the start Would you expect it to be greater,<br />
less, or about the same compared with the acceleration you measured without pushing Answer the<br />
question <strong>and</strong> then try it. You can give the ball a small push by rolling lightly with your finger at the<br />
start.<br />
NOTE: Measure the acceleration a distance away from the start, so your finger does not get in the way.<br />
c. Propose at least one way to increase the acceleration of the ball on the track.<br />
C<br />
The speed versus time graph<br />
Record the data in Table 1.<br />
Answer Sheet<br />
4.1 Acceleration
D<br />
Recording position, speed, <strong>and</strong> time data in Table 2<br />
Table 2: Position, speed, <strong>and</strong> time data<br />
x<br />
(cm)<br />
t AB<br />
(sec)<br />
t A<br />
(sec)<br />
t B<br />
(sec)<br />
v A<br />
(cm/sec)<br />
v B<br />
(cm/sec)<br />
E<br />
Graphing speed versus time<br />
a. Make a speed versus time graph. Plot the speed at photogate B on the y-axis. Plot the time from A to B<br />
on the x-axis.<br />
4.1 Acceleration Answer Sheet
. Is your graph a straight line or a curve<br />
c. The place on the speed versus time graph where the line crosses the y-axis is called the y-intercept. The<br />
y-intercept represents something about the ball. What does the y-intercept of your speed versus time<br />
graph represent (Hint: The y-axis is speed.)<br />
d. Does the ball accelerate as it rolls down the track Justify your answer. Remember that acceleration is<br />
defined as a change in speed over time.<br />
F<br />
Calculating acceleration from the slope of the line<br />
a. Using your speed versus time graph, calculate the acceleration of the ball from the slope of the line.<br />
b. How does the acceleration from the slope compare with the acceleration you calculated from the times<br />
in Part 1 of the Investigation<br />
c. Is the acceleration of the ball changing as it moves down the track Explain your answer using what<br />
you know about the slope of a straight line.<br />
Answer Sheet<br />
4.1 Acceleration
Extra space for notes <strong>and</strong> performing calculations:<br />
4.1 Acceleration Answer Sheet
Name:<br />
4.2 A Model for Accelerated <strong>Motion</strong><br />
Question: How do we describe <strong>and</strong> predict accelerated motion<br />
A<br />
The equations for accelerated motion in a line<br />
There are no questions to answer in Part 1.<br />
B<br />
Planning the experiment<br />
a. Write down the equations for uniform accelerated motion in one dimension using the following<br />
variables. Let:<br />
• t be the time since the ball passed through photogate A (t AB ).<br />
• x 0 be the position of the ball at time t = 0 (at photogate A).<br />
• v 0 be the speed of the ball at time t = 0 (speed at photogate A).<br />
• v be the speed at time t (speed at photogate B).<br />
• x be the position of the ball at time t (position of photogate B).<br />
• a be the acceleration of the rolling ball.<br />
b. Derive an equation for the acceleration of the ball in terms of the three times (t A , t B , t AB ) <strong>and</strong> the<br />
diameter of the ball (d B ). These are all quantities you can measure directly.<br />
Initial<br />
position<br />
(x 0 , m)<br />
Position<br />
(x, m)<br />
C Doing the experiment Table 1: Experimental data<br />
Time<br />
through gate<br />
A<br />
(t A , sec)<br />
Time<br />
through gate<br />
B<br />
(t B , sec)<br />
Time from<br />
Ato B<br />
(t AB , sec)<br />
Speed at gate<br />
B<br />
(v B , m/sec)<br />
Answer Sheet<br />
4.2 A Model for Accelerated <strong>Motion</strong>
D<br />
Preliminary analysis<br />
a. Use the data from Table 1 to make the speed versus time graph for the ball. Scale the graph so it starts<br />
from zero speed <strong>and</strong> zero time. The time axis (x) should be the time from photogate A to photogate B.<br />
The speed axis (y) should be the speed at photogate B.<br />
b. Use the data from Table 1 to make the position versus time graph for the ball. Scale the graph so it<br />
starts from zero position <strong>and</strong> zero time. The time axis (x) should be the time from photogate A to<br />
photogate B. The position axis (y) should be the position of photogate B.<br />
4.2 A Model for Accelerated <strong>Motion</strong> Answer Sheet
c. The equation of a straight line is often given in the form y = mx + b. The variable m is the slope <strong>and</strong> the<br />
variable b is the y-intercept. The speed versus time graph should be a straight line; therefore, the<br />
equation should apply. Rewrite the equation for a straight line for the speed versus time graph using<br />
appropriate variables from the experiment (v, v 0 , x, x 0 , t AB, <strong>and</strong> so on). Make a table that shows how y,<br />
m, x, <strong>and</strong> b correspond to the real experimental variables.<br />
d. From your graph of speed versus time, estimate the initial speed <strong>and</strong> acceleration.<br />
Answer Sheet<br />
4.2 A Model for Accelerated <strong>Motion</strong>
e. Use your formula derived in Part 2b to calculate the acceleration of the ball for a few different<br />
measurements. Compare your calculation with the value you estimated from the graph.<br />
E<br />
Testing the equations<br />
a. Calculate the position of the ball from the equations for uniformly accelerated motion. Use Table 2 for<br />
the results of your calculations. You need to use the initial speed, initial position, <strong>and</strong> acceleration you<br />
estimated from the speed versus time graph. Do the calculations for the same times (from A to B) as<br />
your measured data.<br />
b. Plot the calculation on the same graph as your measured data for position versus time. You can draw<br />
the calculation as a solid line on the graph since the equation predicts the entire curve. The<br />
experimental data should be left as unconnected dots.<br />
4.2 A Model for Accelerated <strong>Motion</strong> Answer Sheet
c. How do your measured positions compare with the positions predicted by the equation<br />
Table 2: Predicted <strong>and</strong> measured positions<br />
Time<br />
(sec)<br />
Predicted position<br />
(x, m)<br />
Measured position<br />
(x, m)<br />
d. Use the equation for uniform accelerated motion to calculate how long the track would have to be for<br />
the ball to reach a speed of 60 miles per hour.<br />
Answer Sheet<br />
4.2 A Model for Accelerated <strong>Motion</strong>
Extra space for notes <strong>and</strong> performing calculations:<br />
4.2 A Model for Accelerated <strong>Motion</strong> Answer Sheet
Name:<br />
4.3 Free Fall <strong>and</strong> the Acceleration due to Gravity<br />
Question: How do you measure the acceleration of a falling object<br />
A<br />
Setting up the experiment<br />
There are no questions to answer in Part 1.<br />
B<br />
A technique for dropping the ball from the right place<br />
There are no questions to answer in Part 2.<br />
C<br />
Determining g from experiment<br />
There are no questions to answer in Part 3.<br />
D<br />
Measuring data to determine g<br />
Table 1: Time <strong>and</strong> distance data<br />
h (m) Time, t A (sec) Time, t B (sec) Time, t AB (sec)<br />
Table 2: Calculation of g<br />
Iteration g (m/sec 2 ) v 0 (m/sec) Formula to use<br />
1 equation 2<br />
2 equation 3<br />
equation 1<br />
3 equation 3<br />
equation 1<br />
Answer Sheet<br />
4.3 Free Fall <strong>and</strong> the Acceleration due to Gravity
a. Use the formula for distance traveled in free fall to derive equations 1, 2, <strong>and</strong> 3.<br />
b. Describe how the values for g change in successive iterations of the calculation.<br />
c. Make a graph showing each intermediate value of g on the y-axis <strong>and</strong> the iteration number on the<br />
x-axis.<br />
What does the graph show you about the calculation<br />
4.3 Free Fall <strong>and</strong> the Acceleration due to Gravity Answer Sheet
d. If you kept going with more iterations of the calculation would the value of g keep getting more <strong>and</strong><br />
more accurate Explain why or why not.<br />
e. Repeat the calculation for at least two more sets of data (trials). Calculate the average value for g for all<br />
three trials. Calculate the percent difference between your average value <strong>and</strong> the published value of<br />
9.82 m/sec 2 . How does your result compare to the accepted value<br />
f. Which variable do you think has the largest uncertainty among the quantities you measured in the<br />
experiment Why do you think so<br />
Answer Sheet<br />
4.3 Free Fall <strong>and</strong> the Acceleration due to Gravity
F<br />
Free fall <strong>and</strong> mass<br />
a. How does the value of g compare for the steel <strong>and</strong> plastic balls<br />
b. Explain any differences you find in part (a) if any.<br />
4.3 Free Fall <strong>and</strong> the Acceleration due to Gravity Answer Sheet