STAT 435: Topics in Advanced Statistics Data analysis for ...
STAT 435: Topics in Advanced Statistics Data analysis for ...
STAT 435: Topics in Advanced Statistics Data analysis for ...

Create successful ePaper yourself
Turn your PDF publications into a flip-book with our unique Google optimized e-Paper software.
<strong>STAT</strong> <strong>435</strong>: <strong>Topics</strong> <strong>in</strong> <strong>Advanced</strong> <strong>Statistics</strong><br />
<strong>Data</strong> <strong>analysis</strong> <strong>for</strong> bio<strong>in</strong><strong>for</strong>matics<br />
Dr Mik Black<br />
Department of Biochemistry<br />
University of Otago<br />
Lecture 7
Annotation<br />
• From wikipedia.org: “Annotation is extra <strong>in</strong><strong>for</strong>mation<br />
associated with a particular po<strong>in</strong>t <strong>in</strong> a document or other<br />
piece of <strong>in</strong><strong>for</strong>mation.”<br />
• Here our “document” is the genome.<br />
• The goal of annotat<strong>in</strong>g the genome is to l<strong>in</strong>k all <strong>in</strong><strong>for</strong>mation<br />
relat<strong>in</strong>g to sequences, genes, prote<strong>in</strong>, function...
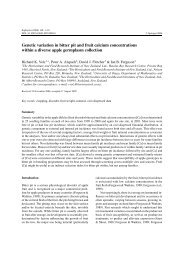
Gene annotation<br />
• Once a fragment of a gene has been sequenced, it is<br />
assigned a unique identifier called an accession number.<br />
• The accession number is used to track that sequence, with<br />
additional <strong>in</strong><strong>for</strong>mation (e.g., function, other sequences)<br />
becom<strong>in</strong>g associated with it as more is learned.<br />
• Sequences used on microarrays can be tracked back to an<br />
accession number.<br />
• <strong>Data</strong>bases of these identifiers are ma<strong>in</strong>ta<strong>in</strong>ed by the<br />
National Center <strong>for</strong> Biotechnology In<strong>for</strong>mation (NCBI), and<br />
others.
Entrez Gene<br />
• With the sequenc<strong>in</strong>g of the human genome, <strong>in</strong>dividual<br />
sequence fragments can be mapped to their position <strong>in</strong> the<br />
genome, and annotated (<strong>in</strong> conjunction with other<br />
fragments) as “genes”.<br />
• Each putative gene <strong>in</strong> the genome is also assigned an<br />
identifier <strong>in</strong> the “Entrez gene” database (also at NCBI).<br />
• The accession numbers of the constituent fragments are<br />
then associated with this identifier (and vice versa).<br />
• The gene identifier is also l<strong>in</strong>ked to a more descriptive gene<br />
name. This usually conveys some <strong>in</strong><strong>for</strong>mation about what<br />
that gene does (or at least what it was understood to be<br />
<strong>in</strong>volved <strong>in</strong> at the time it was named).
Microarrays<br />
• Each spot on a microarray represents a gene fragment, and<br />
has a unique accession number.<br />
• Through this number we can f<strong>in</strong>d out about the gene which<br />
the fragment represents (if known), where <strong>in</strong> the genome<br />
this fragment is located, and (maybe) what it does.<br />
• In microarray experiments this means that we can f<strong>in</strong>d out<br />
the identity of genes which undergo differential expression.<br />
• Depend<strong>in</strong>g on what is known about these genes, this<br />
<strong>in</strong><strong>for</strong>mation may provide important clues about the<br />
underly<strong>in</strong>g biological process be<strong>in</strong>g studied.
Gene function<br />
• For biologists, it’s not particularly <strong>in</strong>terest<strong>in</strong>g to f<strong>in</strong>d out<br />
that a gene is significantly differentially expressed if no<br />
other <strong>in</strong><strong>for</strong>mation is known about that gene.<br />
• One (very good) reason <strong>for</strong> this is that <strong>in</strong> microarray<br />
experiments there are often a lot of false positives, so<br />
biologists tend to be a little bit skeptical...<br />
– Remember: we can only have as much faith <strong>in</strong> the<br />
<strong>analysis</strong> as we do <strong>in</strong> the underly<strong>in</strong>g assumptions. Were<br />
those gene REALLY <strong>in</strong>dependent How about the<br />
residuals - normally distributed
Gene function<br />
• If enough is known about a differentially expressed gene <strong>for</strong><br />
it to “make sense” or be “<strong>in</strong>terest<strong>in</strong>g” <strong>in</strong> the context of the<br />
experiment, then biologists tend to get a bit more excited.<br />
• Although a gene name is often somewhat <strong>in</strong><strong>for</strong>mative, vast<br />
amounts of <strong>in</strong><strong>for</strong>mation about that gene may reside <strong>in</strong><br />
journal publications and <strong>in</strong>ternet databases - how do we get<br />
this <strong>in</strong><strong>for</strong>mation
PubMed identifiers<br />
• PubMed is a service provided by the National Library of<br />
Medic<strong>in</strong>e.<br />
• Conta<strong>in</strong>s over 15 million citations from MEDLINE and<br />
other life sciences publications.<br />
• Every journal publication is given a unique PubMed<br />
identifier.<br />
• Those that relate to a particular gene or sequence are l<strong>in</strong>ked<br />
back to the appropriate identifiers.<br />
• Based on this the NCBI search eng<strong>in</strong>e (the Bio<strong>in</strong><strong>for</strong>matics<br />
Institute (www.bio<strong>in</strong><strong>for</strong>matics.org.nz) hosts a local<br />
copy of the NCBI databases) can be used to retrieve<br />
<strong>in</strong><strong>for</strong>mation about differentially expressed genes.
Problem - too much <strong>in</strong><strong>for</strong>mation<br />
• For situations where large numbers of genes are differentially<br />
expressed, there is simply too much <strong>in</strong><strong>for</strong>mation available.<br />
• Anyway, are we really <strong>in</strong>terested <strong>in</strong> <strong>in</strong>dividual genes<br />
• Wouldn’t it be better to f<strong>in</strong>d groups of differentially<br />
expressed genes which share a common function
Biological pathways<br />
• In reality genes are members of pathways, which per<strong>for</strong>m<br />
major biological functions.<br />
• As more biological experimentation is done, researchers are<br />
able to build a better picture of how genes <strong>in</strong>teract, and<br />
how pathways function.<br />
• In<strong>for</strong>mation about pathway membership and gene function<br />
are stored <strong>in</strong> publicly available databases.<br />
• This <strong>in</strong><strong>for</strong>mation can be used to def<strong>in</strong>e gene sets (groups of<br />
genes which are functionally related), to which statistical<br />
<strong>analysis</strong> can be applied.
Biological pathways: KEGG<br />
• Kyoto Encyclopedia of Gene and Genomes.<br />
www.genome.jp/kegg/kegg4.html<br />
• Provides nice (user-created) pathway diagrams.<br />
• XML output <strong>in</strong>cludes <strong>in</strong><strong>for</strong>mation about genes <strong>in</strong>volved <strong>in</strong><br />
pathways, and <strong>in</strong>ter-gene (and gene product) relationships.<br />
– Can produce graphic representation of pathway based<br />
on XML alone.
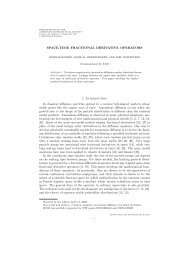
KEGG pathway diagram (apoptosis)
XML output file <strong>for</strong> apoptosis pathway<br />
<br />
<br />
<br />
<br />
<br />
<br />
<br />
<br />
<br />
<br />
<br />
<br />
<br />
<br />
<br />
<br />
XML-based KEGG pathway diagram (apoptosis)
Biological pathways: Biocarta<br />
• Ma<strong>in</strong>ta<strong>in</strong> “open source” pathway database, and provide lab<br />
supplies <strong>for</strong> related experiments:<br />
www.biocarta.com<br />
• Pathway database is edited by “gurus”.<br />
• Very nice pathway diagrams (user created).<br />
• No non-html output.
Biocarta pathway diagram (apoptosis)
Gene ontology<br />
• Gene Ontology (GO) def<strong>in</strong>es a collection of words (an<br />
ontology) which are used to classify the function of a gene.<br />
• Three broad classifications:<br />
– Molecular function.<br />
– Biological process.<br />
– Cellular component.<br />
• Each of these broad terms conta<strong>in</strong>s a hierarchy of<br />
categories, go<strong>in</strong>g from general to specific.<br />
• Each category is <strong>in</strong>dexed by an identifier.
Example of GO hierarchy (apoptosis)<br />
* all : all ( 218850 )<br />
o GO:0008150 : biological_process ( 145098 )<br />
+ GO:0009987 : cellular process ( 91236 )<br />
# GO:0050875 : cellular physiological process (81383 )<br />
* GO:0008219 : cell death ( 2714 )<br />
o GO:0012501 : programmed cell death ( 2395 )<br />
+ GO:0006915 : apoptosis ( 2061 )<br />
+ GO:0007582 : physiological process ( 96419 )<br />
# GO:0050875 : cellular physiological process ( 81383 )<br />
* GO:0008219 : cell death ( 2714 )<br />
o GO:0012501 : programmed cell death ( 2395 )<br />
+ GO:0006915 : apoptosis ( 2061 )<br />
# GO:0016265 : death ( 3054 )<br />
* GO:0008219 : cell death ( 2714 )<br />
o GO:0012501 : programmed cell death ( 2395 )<br />
+ GO:0006915 : apoptosis ( 2061 )
Annotation <strong>for</strong> microarrays<br />
• L<strong>in</strong>k<strong>in</strong>g <strong>in</strong><strong>for</strong>mation back to the array spots.<br />
• Types of <strong>in</strong><strong>for</strong>mation:<br />
– Sequence.<br />
– Gene.<br />
– Chromosome location.<br />
– Publications.<br />
– Function.<br />
– Other (e.g., transcription factors, orthologs, prote<strong>in</strong>s).<br />
• Amount of <strong>in</strong><strong>for</strong>mation available is organism-specific.
Common identifiers<br />
• Microarray experiments often utilize the follow<strong>in</strong>g identifiers:<br />
– Manufacturer’s ID (e.g., Affymetrix probe ID, MWG ID<br />
number).<br />
– Accession number (sequence identifier).<br />
– Entrez Gene ID or LocusL<strong>in</strong>k ID (gene identifier).<br />
– KEGG ID (KEGG pathway membership).<br />
– GO term ID (functional <strong>in</strong><strong>for</strong>mation).<br />
• This <strong>in</strong><strong>for</strong>mation can be used to enhance (or be<br />
<strong>in</strong>corporated <strong>in</strong>to) a statistical <strong>analysis</strong>.
Annotation <strong>in</strong> Bioconductor<br />
• Bioconductor <strong>in</strong>cludes metadata packages which conta<strong>in</strong><br />
annotation <strong>in</strong><strong>for</strong>mation.<br />
– Oligo-set specific (e.g., MWG 30K set).<br />
– Array specific (e.g., Affymetrix HGU133A).<br />
– Organism specific (e.g., human, rat, mouse).<br />
• These packages provide l<strong>in</strong>kage between the sequences used<br />
<strong>in</strong> array experiments, and the genes from which they are<br />
derived.<br />
• Go and KEGG libraries are also available, with l<strong>in</strong>ks to<br />
LocusL<strong>in</strong>k IDs (old name <strong>for</strong> Entrez Gene).
Bioconductor example: hu6800<br />
• Annotation package <strong>for</strong> Affymetrix array used <strong>in</strong> Golub et<br />
al. paper:<br />
> library(hu6800.db)<br />
> hu6800()<br />
Quality control <strong>in</strong><strong>for</strong>mation <strong>for</strong> hu6800:<br />
This package has the follow<strong>in</strong>g mapp<strong>in</strong>gs:<br />
hu6800ACCNUM has 7129 mapped keys (of 7129 keys)<br />
hu6800ALIAS2PROBE has 23712 mapped keys (of 110391 keys)<br />
hu6800CHR has 6178 mapped keys (of 7129 keys)<br />
hu6800CHRLENGTHS has 93 mapped keys (of 93 keys)<br />
hu6800CHRLOC has 6136 mapped keys (of 7129 keys)<br />
hu6800CHRLOCEND has 6136 mapped keys (of 7129 keys)<br />
...
• Gene symbols:<br />
Bioconductor example: hu6800<br />
> library(hu6800.db)<br />
> sym sym[1:3]<br />
$U30894_at<br />
[1] "SGSH"<br />
$X85178_at<br />
[1] "SURF5"<br />
• KEGG pathways:<br />
> KEGG.list KEGG.list[1:2]<br />
$U30894_at<br />
[1] "00531" "01032"<br />
$X85178_at<br />
[1] NA
Bioconductor example: KEGG Pathway names<br />
> library(KEGG.db)<br />
> kg kg[1:3]<br />
$‘00010‘<br />
[1] "Glycolysis / Gluconeogenesis"<br />
$‘00020‘<br />
[1] "Citrate cycle (TCA cycle)"<br />
> kg[match("00860",names(kg))]<br />
$‘00860‘<br />
[1] "Porphyr<strong>in</strong> and chlorophyll metabolism"
Detect<strong>in</strong>g pathway-level changes<br />
• Microarrays are able to measure changes <strong>in</strong> gene expression<br />
across treatment conditions.<br />
• Can obta<strong>in</strong> <strong>in</strong><strong>for</strong>mation about gene sets (e.g., GO, KEGG,<br />
Biocarta).<br />
• Allows microarray data to be used to assess whether<br />
changes <strong>in</strong> expression occur at the group level.<br />
• Such changes often provide greater <strong>in</strong><strong>for</strong>mation than s<strong>in</strong>gle<br />
gene changes.
Hypergeometric distribution<br />
• Simple approach to <strong>in</strong>vestigat<strong>in</strong>g coord<strong>in</strong>ated gene<br />
expression - <strong>in</strong>volves hypergeometric distribution.<br />
• Look <strong>for</strong> functional group<strong>in</strong>gs with<strong>in</strong> a set of significantly<br />
differentially expressed genes:<br />
– e.g., what is the probability of gett<strong>in</strong>g 10 apoptosis<br />
genes <strong>in</strong> my 100 differentially expressed genes<br />
• Similar to classic hypergeometric problem:<br />
– e.g., what is the probability of select<strong>in</strong>g k white balls <strong>in</strong><br />
a sample of size n from a bag conta<strong>in</strong><strong>in</strong>g m white and<br />
N − m black balls
P (X = x) =<br />
Hypergeometric distribution<br />
`M<br />
´`N−M<br />
x n−x<br />
`N<br />
n<br />
´<br />
´ <strong>for</strong> x = max(0, n + M − N) to x = m<strong>in</strong>(n, M)<br />
• Here x is the number of genes from a particular pathway<br />
(of size M) which showed up <strong>in</strong> our list of n differentially<br />
expressed genes (then are N genes <strong>in</strong> total).<br />
• To calculate a p-value <strong>for</strong> this “test” we need to sum up all<br />
of the probabilities from x (which we observed) up to<br />
m<strong>in</strong>(M, n).<br />
• This is done <strong>for</strong> each gene set, and then the p-values are<br />
adjusted to take multiple comparisons <strong>in</strong>to account.
P (X = x) =<br />
Example: hypergeometric distribution<br />
`M<br />
´`N−M<br />
x n−x<br />
`N<br />
n<br />
´<br />
´ <strong>for</strong> x = max(0, n + M − N) to x = m<strong>in</strong>(n, M)<br />
• Suppose that we observe 10 apoptosis genes <strong>in</strong> our 100<br />
differentially expressed genes.<br />
• There are 10,000 genes on our array, of which 500 are<br />
apoptosis genes.<br />
P (X = 10) =<br />
( 500<br />
)( 9500<br />
10 90<br />
( 10,000<br />
100<br />
)<br />
) = 0.012<br />
• Summ<strong>in</strong>g the values from x = 10 to x = 100 gives a<br />
p-value of 0.0205.<br />
• Would then have to adjust this <strong>for</strong> the number of pathways<br />
be<strong>in</strong>g tested.
Limitations<br />
• The hypergeometric test only takes the size of gene sets<br />
<strong>in</strong>to account.<br />
• All genes <strong>for</strong> the same group that are not significant are<br />
treated the same.<br />
– What if they are “almost” significant<br />
• We are now th<strong>in</strong>k<strong>in</strong>g about the ranks of the genes.<br />
• Want to <strong>in</strong>corporate this rank <strong>in</strong><strong>for</strong>mation <strong>in</strong>to our<br />
calculations.
Gene Set Analysis<br />
• How to <strong>in</strong>corporate functional <strong>in</strong><strong>for</strong>mation <strong>in</strong>to statistical<br />
<strong>analysis</strong><br />
• Want to make <strong>in</strong>ferences about groups of genes (“gene<br />
sets”) rather than <strong>in</strong>dividual genes.<br />
• First publication to do this was by Mootha et al. (2003),<br />
which <strong>in</strong>troduced an approach called gene set enrichment<br />
<strong>analysis</strong> (GSEA).<br />
– Somewhat limited - calculated the significance of the<br />
“most up-regulated” gene set <strong>in</strong> an experiment.<br />
– Later a second publication from the same group<br />
appeared <strong>in</strong> PNAS - noth<strong>in</strong>g new (or excit<strong>in</strong>g).<br />
– R code available, but not part of Bioconductor.
GSEA methodology (Mootha et al., 2003)
Significance <strong>analysis</strong> of function and expression<br />
• Barry et al. (2005) published a method called Significance<br />
Analysis of Function and Expression (SAFE) <strong>for</strong> detect<strong>in</strong>g<br />
gene sets undergo<strong>in</strong>g significant changes <strong>in</strong> expression<br />
between two experimental conditions.<br />
• Provided a simple approach to this type of <strong>analysis</strong>.<br />
• Also provided an Bioconductor package (safe) which<br />
allows this method to be used <strong>in</strong> R.
SAFE methodology<br />
• Gene sets are pre-def<strong>in</strong>ed us<strong>in</strong>g exist<strong>in</strong>g group<strong>in</strong>g (e.g.,<br />
KEGG, GO, Biocarta) or expert knowledge.<br />
• Like the earlier GSEA method, SAFE breaks the <strong>analysis</strong><br />
<strong>in</strong>to two parts:<br />
1. Rank genes based on their level of differential expression<br />
between experimental conditions (local).<br />
2. Rank gene sets based on the rank<strong>in</strong>g of the genes they<br />
conta<strong>in</strong> (global).<br />
• Various methods can be used <strong>for</strong> each of the rank<strong>in</strong>g steps.
SAFE gene (local) rank<strong>in</strong>g<br />
• The default method used to rank genes based on their level<br />
of differential expression is the two sample t-test.<br />
– This provides an ordered list based on the absolute value<br />
of the test statistic <strong>for</strong> each gene.<br />
– Other statistics are obviously possible (e.g., SAM,<br />
limma etc).<br />
• No need to assess significance of differential expression -<br />
just want to rank the genes.
SAFE pathway (global) rank<strong>in</strong>g<br />
• The default pathway-rank<strong>in</strong>g method is to take the ranks<br />
<strong>for</strong> the genes <strong>in</strong> each pathway, and use a Wilcoxon Rank<br />
Sum statistic to rank the pathways.<br />
– Produces ranked list of pathways, based on the ranks of<br />
their constituent genes.<br />
– Aga<strong>in</strong>, other rank-based statistics are possible (e.g.,<br />
Kolmogorov-Smirnov).<br />
• Permutation-based resampl<strong>in</strong>g used to assess significance,<br />
while account<strong>in</strong>g <strong>for</strong> correlation between pathways, and<br />
multiple test<strong>in</strong>g.
SAFE output<br />
• SAFE produces a list of significantly changed gene sets,<br />
based on a permutation p-value (and MCP adjustment<br />
<strong>in</strong>corporat<strong>in</strong>g dependency, if selected), us<strong>in</strong>g an α-level<br />
specified by the user.<br />
SAFE results:<br />
Local: t.Student<br />
Global: Wilcoxon<br />
Method: permutation<br />
Size Mean.Rank Emp.pvalue<br />
00860 15 2412.2 0.001<br />
04110 57 1955.9 0.003<br />
00561 12 2086.6 0.008<br />
04966 10 2312.9 0.011<br />
05144 32 1953.0 0.012<br />
00970 16 2133.1 0.018<br />
• Graphical summary (the “safeplot”) is also available.
Safeplot
Interpret<strong>in</strong>g the safeplot<br />
• Significant changes <strong>in</strong> gene set activity are <strong>in</strong>dicated by<br />
deviation from the diagonal.<br />
• The safeplot also shows the direction of differential<br />
expression observed <strong>for</strong> each gene <strong>in</strong> the group (of course to<br />
figure this out you need to know how the rank<strong>in</strong>gs relate to<br />
the comparison of <strong>in</strong>terest).
R code <strong>for</strong> runn<strong>in</strong>g SAFE<br />
library(safe)<br />
library(multtest)<br />
library(hu6800.db)<br />
data(golub)<br />
dimnames(golub)[[1]]
SAFE: summary<br />
• The SAFE methodology provides a relatively simple<br />
approach to <strong>in</strong>vestigat<strong>in</strong>g changes <strong>in</strong> the activity of<br />
pre-def<strong>in</strong>ed gene sets.<br />
• Various deficiencies exists (e.g., correlation between genes<br />
with<strong>in</strong> a pathway not taken <strong>in</strong>to account, magnitude of<br />
changes not accouted <strong>for</strong> by rank<strong>in</strong>g method), but it is still<br />
a useful tool <strong>for</strong> this type of problem.
Extensions and improvements<br />
• Goeman and Buhlmann (2007) def<strong>in</strong>ed two different types<br />
of hypotheses that could be tested <strong>in</strong> a gene set <strong>analysis</strong>:<br />
– a self-conta<strong>in</strong>ed test, where each gene set is tested <strong>for</strong><br />
differential expression between the sample classes<br />
<strong>in</strong>dependently of the other gene sets (the null<br />
distribution is generated by permut<strong>in</strong>g the samples).<br />
– a competitive test, where each gene set is tested <strong>for</strong><br />
differential expression between the sample classes<br />
relative to the other gene sets (the null distribution is<br />
generated by permut<strong>in</strong>g the genes).<br />
• Tests of each type are implemented with<strong>in</strong> the limma<br />
package, allow<strong>in</strong>g use of a l<strong>in</strong>ear models approach.
Gene set <strong>analysis</strong> with Limma<br />
• The roast command per<strong>for</strong>ms “rotation gene set test<strong>in</strong>g”<br />
<strong>for</strong> l<strong>in</strong>ear models (mroast does the same <strong>for</strong> multiple gene<br />
sets): this is a self-conta<strong>in</strong>ed test.<br />
• geneSetTest and wilcoxGST per<strong>for</strong>m a simple competitive<br />
gene set tests (similar to SAFE, but permut<strong>in</strong>g genes rather<br />
than samples).<br />
• romer provides “gene set enrichment <strong>analysis</strong> <strong>for</strong> l<strong>in</strong>ear<br />
models us<strong>in</strong>g rotation tests” as a competitive test.
geneSetTest (Limma)<br />
fit
geneSetTest (Limma)<br />
gst[which.m<strong>in</strong>(gst)]<br />
04120<br />
0.0180696<br />
library(KEGG.db)<br />
path
Barcode plot (Limma)<br />
barcodeplot(selected=seq(1:length(tstat))[C.matrix[,which.m<strong>in</strong>(gst)]==1],<br />
statistics=tstat,labels=c("Up","Down"),ma<strong>in</strong>=paste(path[<br />
match(names(gst[whi\ch.m<strong>in</strong>(gst)]),names(path))][[1]],": p=",<br />
round(m<strong>in</strong>(gst),5),sep=’’))
Rotation-based gene set test<strong>in</strong>g<br />
• Uses rotation of orthogonalized residuals from a l<strong>in</strong>ear<br />
model to generate p-values (other methods simply permute<br />
either genes or samples).<br />
• Applicable to correlated tests (e.g., correlations between<br />
genes), small sample sizes, and arbitrary experimental<br />
designs.<br />
• Wu et al. ROAST: rotation gene set tests <strong>for</strong> complex<br />
microarray experiments. Bio<strong>in</strong><strong>for</strong>matics (2010) vol. 26 (17)<br />
pp. 2176-82.