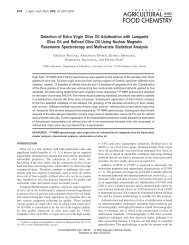
Characterization of Unsaturated Polyester and Alkyd Resins Using ...
Characterization of Unsaturated Polyester and Alkyd Resins Using ...
Characterization of Unsaturated Polyester and Alkyd Resins Using ...

Create successful ePaper yourself
Turn your PDF publications into a flip-book with our unique Google optimized e-Paper software.
<strong>Characterization</strong> <strong>of</strong> <strong>Unsaturated</strong> <strong>Polyester</strong> <strong>and</strong> <strong>Alkyd</strong><br />
<strong>Resins</strong> <strong>Using</strong> One- <strong>and</strong> Two-Dimensional<br />
NMR Spectroscopy<br />
A. Spyros<br />
NMR Laboratory, Department <strong>of</strong> Chemistry, University <strong>of</strong> Crete, Heraklion Crete 71409, Greece<br />
Received 9 April 2002; accepted 12 August 2002<br />
ABSTRACT: One- (1D) <strong>and</strong> two-dimensional (2D) 1 H-<br />
<strong>and</strong> 13 C-NMR spectroscopy was used to characterize polyester<br />
<strong>and</strong> alkyd resins used in the coatings industry. The<br />
wealth <strong>of</strong> chemical composition information <strong>of</strong> the 1 H- <strong>and</strong><br />
13 C-NMR 1D spectra <strong>of</strong> the resins is revealed through 2D<br />
NMR experiments that spread chemical shifts in two dimensions,<br />
thus facilitating the peak assignment <strong>of</strong> the various<br />
components <strong>of</strong> the resins. It is shown that the types <strong>of</strong><br />
polyols, acids, <strong>and</strong> vegetable oils used to modify the resins<br />
can be efficiently traced by NMR spectroscopic techniques.<br />
Information on the quantitative composition <strong>of</strong> the resins<br />
<strong>and</strong> especially the abundance <strong>of</strong> unsaturated fatty acid double<br />
bonds, which influences resin dryability <strong>and</strong> hardness,<br />
can be easily extracted from the 1 H-NMR spectra upon<br />
successful assignment. © 2003 Wiley Periodicals, Inc. J Appl<br />
Polym Sci 88: 1881–1888, 2003<br />
Key words: NMR; crosslinking; resins; coatings<br />
INTRODUCTION<br />
<strong>Unsaturated</strong> polyester <strong>and</strong> alkyd resins are industrially<br />
important network polymers. 1,2 <strong>Alkyd</strong> resins are<br />
widely used as coatings, paints, adhesives, <strong>and</strong> additives,<br />
whereas unsaturated polyesters are used in<br />
combination with glass reinforcement for the preparation<br />
<strong>of</strong> hard polymeric materials for marine applications.<br />
<strong>Alkyd</strong> resins are prepared from polyfunctional<br />
monomers, so that crosslinking occurs during<br />
the polyesterification reaction. Phthalic anhydride is<br />
by far the most common dibasic acid derivative used,<br />
whereas glycerol, pentaerythritol (PE), <strong>and</strong> trimethylolpropane<br />
(TMP) are common polyalcohols. 3,4 <strong>Unsaturated</strong><br />
polyester resins are crosslinked by a subsequent<br />
addition polymerization reaction through reactive<br />
double bonds incorporated into the polyester<br />
backbone. 5 Oil-modified alkyds are prepared by transesterification<br />
<strong>of</strong> the polyalcohol with triglycerides<br />
(TGs) contained in synthetic or natural oils before<br />
polymerization, or by conducting the polymerization<br />
in the presence <strong>of</strong> fatty acids <strong>and</strong> heating. Addition <strong>of</strong><br />
a suitable solvent, driers, <strong>and</strong> pigments leads to alkyd<br />
paints that dry in the presence <strong>of</strong> atmospheric oxygen<br />
through a free-radical crosslinking reaction. The rapidity<br />
<strong>of</strong> drying depends on the amount <strong>of</strong> oil fatty<br />
acids incorporated in the alkyd resin <strong>and</strong> their degree<br />
<strong>of</strong> unsaturation.<br />
Correspondence to: A. Spyros (aspyros@chemistry.uoc.gr).<br />
Journal <strong>of</strong> Applied Polymer Science, Vol. 88, 1881–1888 (2003)<br />
© 2003 Wiley Periodicals, Inc.<br />
This study reports the full characterization <strong>of</strong> the<br />
chemical structure <strong>of</strong> a series <strong>of</strong> polyester resins by 1 H-<br />
<strong>and</strong> 13 C-NMR spectroscopy. It is well known that<br />
polymers in solution produce NMR spectral signals<br />
broadened by the effects <strong>of</strong> conformational heterogeneity<br />
<strong>and</strong> restricted molecular motion. 6 The NMR<br />
spectra <strong>of</strong> resins are further complicated because <strong>of</strong><br />
the multitude <strong>of</strong> functional monomers used in their<br />
synthesis <strong>and</strong> because some <strong>of</strong> these monomers are<br />
mixtures themselves (e.g., natural oils). The assignment<br />
<strong>of</strong> the NMR spectra has been achieved by employing<br />
gradient two-dimensional (2D) NMR spectroscopic<br />
techniques. 2D NMR is highly suited for the<br />
characterization <strong>of</strong> polymeric materials because <strong>of</strong> the<br />
increased resolution <strong>of</strong>fered by spreading chemical<br />
shift information in two spectral dimensions. 6 Pulse<br />
field gradients have been recently 7,8 exploited in 2D<br />
NMR for coherence selection, avoiding time-consuming<br />
phase-cycling schemes <strong>and</strong> improving considerably<br />
the resolution <strong>of</strong> signals in crowded regions.<br />
EXPERIMENTAL<br />
Materials<br />
All samples were used as supplied by Interchem Hellas,<br />
diluted in white spirit or xylenes. S1 is a long-oil<br />
alkyd resin, S2 is a short-oil alkyd resin, S3 <strong>and</strong> S4 are<br />
short-oil polyols, <strong>and</strong> S5 is an oil-free polyester resin.<br />
The available manufacturer information on the resins<br />
was reported previously. 14 Table I summarizes the<br />
chemical structure <strong>of</strong> the monomeric units <strong>of</strong> the resins,<br />
<strong>and</strong> the notation used throughout this report.
TABLE I<br />
Monomer Units Identified () on <strong>Resins</strong> S1–S5, <strong>and</strong> Their 1 H- <strong>and</strong> 13 C-NMR<br />
Chemical Shifts Measured in Acetone-d 6 Solutions<br />
NMR chemical shifts [] Resin<br />
Monomer unit a 13 C-NMR<br />
1 H-NMR S1 S2 S3 S4 S5<br />
PHT 166.8 C-1 <br />
132.2 C-2<br />
131.0 C-3 7.55 H-3<br />
129.0 C-4 7.75 H-4<br />
MA 164.1 C-1 <br />
133.2 C-2 6.85 H-2<br />
EG 62.8 CH 2 4.6 CH 2 <br />
DEG 64.2 C-1 4.4 H-1 <br />
68.6 C-2 3.75 H-2<br />
PG 70.1 CH 5.4 CH <br />
66.9 CH 2 4.4 CH 2<br />
15.8 CH 3 1.4 CH 3<br />
PGm 70.5 CH 4.1 CH <br />
66.8 CH 2 4.4 CH 2<br />
19.1 CH 3 1.2 CH 3<br />
TMP 66.0 C-1 4.2 H-1 <br />
64.2 C-1 3.6 H-1<br />
41.5/<br />
42.7 C-2<br />
23.5 C-3 1.6 H-3<br />
7.5 C-4 1.0 H-4<br />
PE 63.2 C-1 4.2 H-1 <br />
61.1 C-1 3.7 H-1<br />
44.4/<br />
43.0 C-2<br />
TG 69.2 C-2 nd b nd <br />
62.2 C-1 nd nd<br />
MG-1 63.5 C-3 H-3 3.6 <br />
65.2 C-1 H-2 4.2<br />
70.5 C-2 H-2 4.0<br />
Oleic acid <br />
Linoleic acid <br />
Linolenic acid <br />
Lauric acid <br />
Eleostearic acid<br />
<br />
Ricinoleic acid<br />
<br />
Abietic acid<br />
<br />
a PHT, phthalate ester; MA, maleate ester; EG, ethylene glycol; DEG, diethylene glycol;<br />
PG, propylene glycol; PGm, propylene glycol end group; TMP, trimethylolpropane; PE,<br />
pentaerythritol; TG, triglyceride; MG-1, 1-monoglyceride.<br />
b Not determined.
USE OF 1D AND 2D NMR TO CHARACTERIZE RESINS 1883<br />
Figure 1 (a) 1 H-NMR spectra <strong>of</strong> resins S1, S3, <strong>and</strong> S5 at 500.1 MHz in acetone-d 6 . S indicates the styrene solvent proton peaks<br />
in S5. See text for other labeling. (b) 1 H-decoupled 13 C-NMR spectra <strong>of</strong> resins S1, S3, <strong>and</strong> S5 at 125.4 MHz in acetone-d 6 . See<br />
text for labeling.<br />
NMR spectroscopy<br />
1 H- <strong>and</strong> 13 C-NMR spectra were obtained on a Bruker<br />
AMX-500 spectrometer (Bruker Instruments, Billerica,<br />
MA) operating at 500.1 <strong>and</strong> 125.4 MHz for the two<br />
nuclei, respectively, at a probe temperature <strong>of</strong> 30°C in<br />
(CD 3 ) 2 CO. Chemical shifts are reported relative to internal<br />
TMS.<br />
1 H– 1 H homonuclear gradient correlated spectroscopy<br />
(COSY) 2D NMR spectra 9 were obtained using<br />
256 increments <strong>of</strong> 1K data points, 16 scans, <strong>and</strong> four<br />
dummy scans with a recycle delay <strong>of</strong> 1 s.<br />
1 H– 13 C<br />
heteronuclear gradient multiple quantum correlation<br />
(HMQC) 2D NMR spectra 9 were obtained using 128<br />
increments <strong>of</strong> 1K data points, 16 scans, <strong>and</strong> four<br />
dummy scans with a recycle delay <strong>of</strong> 1 s. This experiment<br />
was optimized for one bond 1 H– 13 C couplings<br />
<strong>of</strong> 140 Hz by setting the evolution delay to 3 ms.<br />
Before Fourier transformation all 2D data sets were<br />
zero-filled to a 1K 1K matrix, <strong>and</strong> a square-sinusoidal<br />
window function was used for processing. No<br />
phase correction was applied <strong>and</strong> the 2D spectra are<br />
displayed in magnitude mode.<br />
RESULTS AND DISCUSSION<br />
One-dimensional (1D) 1 H-NMR spectra<br />
Figure 1(a) presents the 1 H-NMR spectra <strong>of</strong> resins S1,<br />
S3, <strong>and</strong> S5 acquired in acetone-d 6 . The low field region<br />
6.5–8.0 contains aromatic protons originating from<br />
phthalic (PHT) <strong>and</strong> maleic (MA) ester fragments <strong>of</strong> the<br />
polyesters. Also in this region appear the aromatic<br />
protons <strong>of</strong> the resin solvents [e.g., white spirit (S1),<br />
xylenes (S3), <strong>and</strong> styrene (S5)]. The middle region <strong>of</strong><br />
the proton spectra ( 3.5–6.0) contains peaks from the<br />
vinyl protons <strong>of</strong> the fatty acids (FA) incorporated in<br />
the alkyd resins (V, 5.3), <strong>and</strong> from protons neighboring<br />
hydroxyl or ester groups. The latter group includes<br />
-hydroxy protons from both alcohols <strong>and</strong><br />
glycerides incorporated in the polymer network. The<br />
peaks in this region are broad <strong>and</strong> signals from different<br />
fragments severely overlap, making their direct<br />
assignment impossible. The high field region <strong>of</strong> the<br />
proton spectra ( 0–3.5) contains mainly methylene<br />
<strong>and</strong> methyl peaks from fatty acid protons, as can be seen<br />
in the spectra <strong>of</strong> S1 <strong>and</strong> S3 in Figure 1(a). Signals are
1884 SPYROS<br />
observed at the positions expected for VOCH 2 OV(A),<br />
–CH 2 OCOOH (B), –CH 2 OV (C), –CH 2 OCH 2 OCOOH<br />
(D), <strong>and</strong> –CH 3 (E) protons <strong>of</strong> fatty acids in these spectra.<br />
11,12 Nevertheless, the 1 H-NMR spectrum <strong>of</strong> S5, the<br />
only resin that contains no fatty acids, also shows signal<br />
intensity from alcohols in this region. Thus, alcohols <strong>and</strong><br />
fatty acids give possibly overlapping signals in the 1 H-<br />
NMR spectra <strong>of</strong> S1–S4, <strong>and</strong> therefore make the quantification<br />
<strong>of</strong> proton signals ambiguous.<br />
1D 13 C-NMR spectra<br />
Figure 1(b) presents the 1 H-decoupled 13 C-NMR spectra<br />
<strong>of</strong> polyesters S1, S3, <strong>and</strong> S5. In the region 160–180<br />
the carbonyl groups <strong>of</strong> phthalic, maleic, <strong>and</strong> fatty acid<br />
esters appear at well-separated chemical shifts, which<br />
are summarized in Table I. The aromatic carbon region<br />
( 125–135) <strong>of</strong> the NMR spectra contains mainly<br />
signals from PHT, 13 MA, 13 <strong>and</strong> from vinyl carbons <strong>of</strong><br />
unsaturated fatty acids (UFA). The presence <strong>of</strong> UFA in<br />
resins S1, S3, <strong>and</strong> MA in S5 was verified by signals<br />
observed in the carbonyl <strong>and</strong> aromatic region <strong>of</strong> the<br />
spectra. However, the aromatic spectral region is<br />
rather crowded in resins dissolved in xylenes (S2–S4),<br />
given that multiple peaks arising from xylene aromatic<br />
carbons appear in this region. 10 The region <br />
60–75 contains peaks originating from carbon atoms<br />
directly bonded to an oxygen atom, so it can provide<br />
information regarding the types <strong>of</strong> alcohols incorporated<br />
in the polyester resins. The assignment <strong>of</strong> peaks<br />
in this region, however, cannot be made by simple<br />
comparison with the NMR spectra <strong>of</strong> model free <strong>and</strong><br />
esterified alcohols. 10,13 This is because <strong>of</strong> the structural<br />
similarity <strong>of</strong> the alcohols used as starting materials,<br />
<strong>and</strong> the fact that NMR chemical shifts are frequently<br />
shifted with respect to those <strong>of</strong> model low molecular<br />
weight compounds. The high field spectral region (<br />
0–50) <strong>of</strong> the 13 C-NMR spectra contains mainly methylene<br />
<strong>and</strong> methyl carbon peaks <strong>of</strong> fatty acids 11 <strong>and</strong><br />
alcohols 10,13 present in the resins. Thus it is very useful<br />
for the identification <strong>of</strong> the oils or fatty acids used for<br />
the modification <strong>of</strong> the resins. The full assignment <strong>of</strong><br />
the 13 C- <strong>and</strong> 1 H-NMR spectra <strong>of</strong> the resins was accomplished<br />
using gradient 2D NMR spectroscopy, as described<br />
in the following sections.<br />
Figure 2 (a) 1 H– 1 H homonuclear gCOSY 2D NMR spectrum<br />
<strong>of</strong> polyester S5. Labels indicate crosspeaks by alcohols<br />
PG, DEG, <strong>and</strong> PGm end groups (see text). (b) 1 H– 13 C heteronuclear<br />
gHMQC 2D NMR spectrum <strong>of</strong> polyester S5. Labels<br />
indicate the methyl peaks <strong>of</strong> backbone PG <strong>and</strong> PGm end<br />
groups.<br />
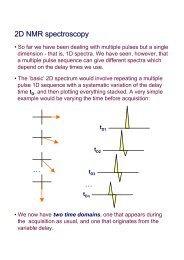
2D NMR spectra<br />
The spread <strong>of</strong> chemical shift information in two spectroscopic<br />
dimensions greatly enhances the ability to<br />
distinguish between multiple components <strong>of</strong> broad<br />
signals in 1D NMR spectra. For all five resins, 1 H– 1 H<br />
gCOSY <strong>and</strong> 1 H– 13 C gHMQC 2D NMR spectra were<br />
acquired for the same samples used to obtain the 1D<br />
NMR spectra. The 1 H– 1 H gCOSY spectra reveal connectivities<br />
between neighboring protons in the polymer<br />
chains, whereas the 1 H– 13 C gHMQC spectra correlate<br />
carbon atoms with their directly bonded protons,<br />
thus allowing the assignment <strong>of</strong> both 1 H <strong>and</strong> 13 C<br />
1D spectra. The monomer units detected with the help<br />
<strong>of</strong> 2D NMR in the resins are reported in Table I, along<br />
with their 1 H- <strong>and</strong> 13 C-NMR chemical shifts in the 1D<br />
spectra acquired in acetone-d 6 .<br />
<strong>Polyester</strong> S5<br />
Figure 2(a) presents the 2D gradient 1 H– 1 H gCOSY<br />
spectrum <strong>of</strong> polyester S5. The observation <strong>of</strong> crosspeaks<br />
attributed to vicinal J-coupling between the
USE OF 1D AND 2D NMR TO CHARACTERIZE RESINS 1885<br />
CH/CH 2 <strong>and</strong> CH/CH 3 protons <strong>of</strong> propylene glycol<br />
(PG) incorporated in the polyester backbone allows<br />
the assignment <strong>of</strong> PG. 10 The methylene protons H-1<br />
<strong>and</strong> H-2 <strong>of</strong> backbone diethylene glycol (DEG) are also<br />
identified 10 by their crosspeak in the spectrum <strong>of</strong> Figure<br />
2(a). Furthermore, the small methyl signal at 1.2<br />
shows connectivity with a proton at 4.1. These two<br />
signals are assigned to CH 3 <strong>and</strong> CH protons belonging<br />
to PG end groups <strong>of</strong> the polyester S5, denoted as PGm<br />
in Figure 2 <strong>and</strong> Table I. The 1 H– 13 C gHMQC spectrum<br />
<strong>of</strong> Figure 2(b) shows two peaks in the methyl region<br />
(top right), thus proving the existence <strong>of</strong> two distinct<br />
types <strong>of</strong> methyl group in the polyester, originating<br />
from PG <strong>and</strong> PGm units <strong>of</strong> the resin. Moreover, this<br />
spectrum makes possible the assignment <strong>of</strong> the carbon<br />
<strong>and</strong> proton signals <strong>of</strong> PG, PGm, ethylene glycol (EG),<br />
DEG, PHT, <strong>and</strong> MA groups in the 1D NMR spectra,<br />
reported in Table I.<br />
Polyols S3 <strong>and</strong> S4<br />
The 2D 1 H– 1 H gCOSY <strong>and</strong> 1 H– 13 C gHMQC spectra <strong>of</strong><br />
polyol S4 are presented in Figure 3(a) <strong>and</strong> (b), respectively.<br />
Starting with the spectrum in Figure 3(b), the<br />
presence <strong>of</strong> two types <strong>of</strong> methyl groups is noted,<br />
which correspond to TMP <strong>and</strong> lauric ester units. 11,13<br />
These can be differentiated by their large 13 C-NMR<br />
chemical shift differences: TMP methyl (C-4) at 7.5<br />
<strong>and</strong> lauric ester methyl at 14.0. Both methyl peaks<br />
show the expected connectivities in the gCOSY spectrum<br />
<strong>of</strong> Figure 3(a): TMP H-4 with H-3, <strong>and</strong> lauric<br />
ester methyl group with the intense methylene peak at<br />
1.2. Another salient feature <strong>of</strong> the gCOSY spectrum<br />
is the connectivities <strong>of</strong> the proton peak at 5.4 with<br />
protons at 1.4 <strong>and</strong> 4.4. This proton system is assigned<br />
to PG, which is verified as a minor alcohol constituent<br />
present in polyol S4. This finding is in agreement with<br />
a recent 31 P-NMR analysis <strong>of</strong> phosphitylated S4. 14 This<br />
assignment was further supported by observing the<br />
signal corresponding to the methyl group <strong>of</strong> PG at <br />
16.2 in the 13 C-NMR spectrum <strong>of</strong> S4 (not shown). PG<br />
<strong>and</strong> TMP end groups were also identified in polyol S4,<br />
as reported in Table I.<br />
Figure 4 presents the 2D 1 H– 1 H gCOSY spectrum <strong>of</strong><br />
polyol S3. Crosspeaks in this spectrum can be divided<br />
in two groups, originating from either linoleic or ricinoleic<br />
ester groups incorporated in the polyol. The<br />
broad 1 H peak at 3.6 contains a proton that correlates<br />
with a carbon at 71.0 in the gHMQC 2D spectrum <strong>of</strong><br />
resin S3 (not shown), <strong>and</strong> is identified as the<br />
–CH(OH)– proton <strong>of</strong> ricinoleic acid, 13 which is the<br />
main fatty acid in castor oil. This assignment is verified<br />
by the crosspeaks at 3.6/2.25 (–CH 2 OCH(OH)O<br />
CH 2 OV) <strong>and</strong> 3.6/1.39 (–CH 2 OCH(OH)OCH 2 OV) in<br />
the 2D 1 H– 1 H gCOSY spectrum <strong>of</strong> S3 in Figure 4<br />
(marked as RIC). Other crosspeaks observed in this<br />
spectrum originate from the protons <strong>of</strong> linoleic acid at<br />
Figure 3 (a) 1 H– 1 H homonuclear gCOSY 2D NMR spectrum<br />
<strong>of</strong> polyol S4. Labels indicate crosspeaks by lauric ester<br />
protons (LAU), <strong>and</strong> alcohols TMP, PG, <strong>and</strong> PGm (see text).<br />
(b) 1 H– 13 C heteronuclear gHMQC 2D NMR spectrum <strong>of</strong><br />
polyester S4. Labels indicate the methyl peaks <strong>of</strong> lauric ester<br />
(LAU) <strong>and</strong> TMP.<br />
well-expected positions, 11,12 except from the characteristic<br />
H-4/H-3 crosspeak <strong>of</strong> TMP [compare with Fig.<br />
3(a)], which indicates that TMP is a minor component<br />
<strong>of</strong> resin S3. The alcoholic regions <strong>of</strong> the 1 H spectra <strong>of</strong><br />
S3 <strong>and</strong> S4 are almost identical, containing mainly<br />
–CH 2 OOCOR units at 4–5 <strong>and</strong> free –CH 2 OH units at<br />
3.6 originating from TMP <strong>and</strong> PE, at well-expected<br />
positions. 13<br />
<strong>Alkyd</strong> resins S1, S2<br />
Figure 5(a) depicts the 2D 1 H– 1 H gCOSY spectrum <strong>of</strong><br />
alkyd resin S2. Several overlapping methyl peaks are
1886 SPYROS<br />
observed in the region 0.85–1.0 <strong>of</strong> the 1 H-NMR spectrum.<br />
The methyl peak at about 0.95 in Figure 5(a)<br />
correlates with a proton peak at 2.0, which proves<br />
that linolenic acid’s characteristic fragment CH 3 O<br />
CH 2 OCHACH– is present in resin S2. The correlation<br />
<strong>of</strong> the methyl peak at 0.85 with the intense methylene<br />
peak at 1.3 is attributed to oleic, linoleic, <strong>and</strong><br />
saturated fatty acids, as expected for a linseed oil–<br />
modified alkyd resin. 11 The rest <strong>of</strong> the crosspeaks in<br />
the 2D gCOSY spectrum <strong>of</strong> Figure 5(a) also originate<br />
from linseed oil unsaturated fatty acids present in<br />
resin S2 (compare with Fig. 4). Figure 5(b) presents the<br />
vinyl region <strong>of</strong> the 2D 1 H– 13 C gHMQC spectrum <strong>of</strong><br />
resin S2. Of special interest are the two peaks marked<br />
with an arrow, corresponding to vinyl carbons with<br />
chemical shifts <strong>of</strong> 120.9 <strong>and</strong> 123.2, which are assigned<br />
to the vinyl carbons <strong>of</strong> abietic acid, 13 the major<br />
constituent <strong>of</strong> rosin. Close examination <strong>of</strong> the 13 C spectrum<br />
<strong>of</strong> resin S2 at increased vertical scale revealed the<br />
presence <strong>of</strong> several small intensity peaks originating<br />
from the rest <strong>of</strong> the carbon atoms <strong>of</strong> abietic acid at the<br />
expected chemical shift positions. 13 Also, the isopropyl<br />
methyl groups <strong>of</strong> abietic acid were detected in the<br />
broad methyl proton resonance at 1.0 [Fig. 5(a)], thus<br />
verifying that resin S2 was modified with small<br />
amounts <strong>of</strong> rosin. The presence <strong>of</strong> another fatty acid,<br />
eleostearic acid (<strong>and</strong> thus, modification <strong>of</strong> S2 with<br />
tung oil) was indicated by noting the presence <strong>of</strong> two<br />
carbon peaks at 32.2 <strong>and</strong> 32.8 in the 13 C-NMR spectrum<br />
<strong>of</strong> S2. Linseed oil fatty acids do not contribute in<br />
Figure 5 (a) 1 H– 1 H homonuclear gCOSY 2D NMR spectrum<br />
<strong>of</strong> alkyd resin S2. The methyl crosspeak <strong>of</strong> linolenic<br />
acid (LN) is labeled, whereas an arrow indicates the methyl<br />
crosspeak attributed to other fatty acid methyl groups. For<br />
labeling <strong>of</strong> fatty acid protons see text. (b) Vinyl region <strong>of</strong> the<br />
1 H– 13 C heteronuclear gHMQC 2D NMR spectrum <strong>of</strong> alkyd<br />
resin S2. Arrows indicate peaks <strong>of</strong> the vinyl carbons <strong>of</strong><br />
abietic acid.<br />
Figure 4<br />
1 H– 1 H homonuclear gCOSY 2D NMR spectrum<br />
<strong>of</strong> polyol S3. Crosspeaks attributed to ricinoleic acid (RIC)<br />
<strong>and</strong> TMP are labeled. For labeling <strong>of</strong> linoleic acid protons see<br />
text.<br />
this spectrum region, 11 where methylene carbons C-15<br />
<strong>and</strong> C-16 <strong>of</strong> eleostearic acid are expected. Finally,<br />
main-chain <strong>and</strong> end-group pentaerythritol <strong>and</strong> various<br />
glyceride structures were identified in this resin<br />
(see Table I) with the help <strong>of</strong> its 1 H– 13 C gHMQC<br />
spectrum.<br />
Resin S1 is a soya oil–modified resin, <strong>and</strong> thus crosspeaks<br />
from linoleic acid, pentaerythritol, <strong>and</strong> phthalate<br />
groups dominate its 2D NMR gCOSY <strong>and</strong> gH-<br />
MQC spectra (not shown), as expected. No minor
USE OF 1D AND 2D NMR TO CHARACTERIZE RESINS 1887<br />
Resin<br />
TABLE II<br />
Chemical Composition (mol %) <strong>of</strong> <strong>Polyester</strong> <strong>and</strong> <strong>Alkyd</strong> <strong>Resins</strong> by 1 H-NMR Spectroscopy a<br />
Diacid<br />
(mol %)<br />
Fatty acid (FA) c<br />
Alcohol<br />
(mol %)<br />
PHT MA Total b (mol %) GL PE TMP PG DEG Total<br />
UN d<br />
TUN d<br />
S1 24 — 24 (24) 49 (63) 17 10 — — — 27 0.71 0.35<br />
S2 32 — 32 (34) 34 (36) 35 — — — — 35 1.03 0.32<br />
S3 38 — 38 (38) 26 (41) 2 22 12 — — 36 0.75 0.20<br />
S4 43 — 43 (50) 19 (25) — — 33 5 — 38 — —<br />
S5 33 16 49 — — — — 37 14 51 — —<br />
a GL is the glycerol content; for other abbreviations used see Table I.<br />
b The phthalic anhydride content (wt %) in the feed is given in parentheses.<br />
c Resin S2 contains 3.5% abietic acid; S3 contains 6.5% linoleic acid <strong>and</strong> 19.5% ricinoleic acid; S4 contains only lauric acid.<br />
Oil lengths (wt %) are given in parentheses.<br />
d UN is the average number <strong>of</strong> double bonds per fatty acid molecule, <strong>and</strong> TUN (UN FA)/100. NMR integration error<br />
5%, leading to errors <strong>of</strong> 10% for the % molar composition.<br />
components were identified in this resin by its NMR<br />
spectra.<br />
Resin chemical composition by 1 H-NMR<br />
Once the components <strong>of</strong> the 1 H-NMR peaks have been<br />
determined with the help <strong>of</strong> 2D NMR techniques, their<br />
integrals, which are related to the molar concentration<br />
<strong>of</strong> each type <strong>of</strong> proton in the resin, can be used to<br />
extract chemical composition information. Phthalate<br />
<strong>and</strong> maleate ester units were quantified by their corresponding<br />
aromatic proton peaks, whereas the fatty<br />
acid content FA was calculated from the methylene<br />
proton peak D (see Fig. 1 for peak positions). The<br />
molar ratio <strong>of</strong> the different alcohols present in the<br />
resins was calculated from the corresponding methylene<br />
integrals in the region 3.5–4.5 (PE, GL, DEG)<br />
<strong>and</strong>/or the region 1.0–1.6 (TMP). When an oil has<br />
been used for the modification, the intensity <strong>of</strong> glycerol<br />
protons introduced by oil triglycerides was taken<br />
into account. Abietic acid in S2 was quantified by its<br />
isopropyl methyl groups at 1.0. Only linoleic acid<br />
contributes to peak A (Fig. 1), so this peak was used to<br />
calculate the amount <strong>of</strong> linoleic acid in S3. The molar<br />
ratios <strong>of</strong> the different components <strong>of</strong> resins S1–S5, as<br />
calculated by 1 H-NMR, are presented in Table II. Itis<br />
interesting to note that the NMR molar percentage <strong>of</strong><br />
phthalate esters PHT in Table II is similar to the percentage<br />
<strong>of</strong> phthalic anhydride in the polymerization<br />
feed, whereas FA is always found to be smaller compared<br />
to the percentage oil length <strong>of</strong> the resins. This is<br />
expected, given that fatty acids <strong>and</strong> triglycerides both<br />
have larger molecular weights than that <strong>of</strong> PHT, <strong>and</strong><br />
their weight percentage in the feed overestimates their<br />
molar ratio in the final polymer.<br />
The abundance <strong>of</strong> double bonds in alkyd resins is<br />
directly related to their drying <strong>and</strong> hardening properties,<br />
given that in general an increasing number <strong>of</strong><br />
double bonds will lead to faster hardening through<br />
crosslinking <strong>of</strong> neighboring fatty side chains during<br />
drying. Table II reports the values <strong>of</strong> UN, which is the<br />
average number <strong>of</strong> double bonds per fatty acid molecule<br />
in each resin. This parameter is calculated by<br />
comparing the integral ratio <strong>of</strong> peak V (vinyl protons)<br />
to peak D [see Fig. 1(a)], the latter peak referring to all<br />
fatty acids present in a resin. Resin S2 has the highest<br />
value <strong>of</strong> UN in Table II because <strong>of</strong> its high content in<br />
linolenic <strong>and</strong> eleostearic acid, both <strong>of</strong> which have three<br />
double bonds per fatty acid molecule. Additionally,<br />
the presence <strong>of</strong> conjugated double bonds in eleostearic<br />
acid gives S2 very fast drying capabilities. However,<br />
the actual number <strong>of</strong> double bonds in a resin also<br />
depends on the molar percentage <strong>of</strong> oil in the resin<br />
(i.e., long versus short oil alkyds). To take this factor<br />
into account, we calculated TUN, the total unsaturation<br />
<strong>of</strong> a resin as (UN FA)/100, which is a parameter<br />
properly normalized to the mol % <strong>of</strong> fatty acids in the<br />
resins, as measured by 1 H-NMR. As can be seen in<br />
Table II, the alkyd resins S1 <strong>and</strong> S2 now have the<br />
highest total unsaturation, TUN, whereas polyol S3<br />
has a much lower TUN value <strong>of</strong> 0.20. The order S1<br />
S2 is in agreement with the superior hardening<br />
properties <strong>of</strong> resin S1 versus S2, as specified by the<br />
resin manufacturer, showing that TUN can serve as a<br />
useful index <strong>of</strong> the hardening properties <strong>of</strong> alkyd resins.<br />
CONCLUSIONS<br />
This study describes the application <strong>of</strong> advanced 1D<br />
<strong>and</strong> 2D 1 H- <strong>and</strong> 13 C-NMR techniques for the characterization<br />
<strong>of</strong> various alkyd resins, polyols, <strong>and</strong> polyesters<br />
used in the coatings industry. 2D NMR allows<br />
the spreading <strong>of</strong> chemical shift information in two<br />
dimensions, <strong>and</strong> is ideal for polymers exhibiting complex<br />
1D NMR spectra with broad <strong>and</strong>/or featureless<br />
peaks. NMR spectroscopy can thus provide a wealth<br />
<strong>of</strong> information regarding the chemical composition <strong>of</strong><br />
the resins (i.e., the type <strong>of</strong> polyols, fatty acids, <strong>and</strong><br />
vegetable oils used in the preparation <strong>of</strong> the resins).
1888 SPYROS<br />
13 C-NMR spectroscopy, with its wide chemical shift<br />
range, is ideally suited for the detection <strong>of</strong> materials<br />
present in small quantities. For example, the presence<br />
<strong>of</strong> eleostearic <strong>and</strong> abietic acids in resin S2 points to the<br />
modification <strong>of</strong> the resin by tung oil <strong>and</strong> rosin, respectively.<br />
1 H-NMR, on the other h<strong>and</strong>, provides quantitative<br />
information about the molar percentages <strong>of</strong><br />
resin components on the final product. This type <strong>of</strong><br />
information is valuable because the weight percentage<br />
<strong>of</strong> monomers in the feed is only an approximation to<br />
the final resin composition.<br />
1 H-NMR also provides<br />
information regarding the double bond content <strong>of</strong> the<br />
alkyd resins, which is useful to evaluate their hardening<br />
<strong>and</strong> drying properties. Further work in the direction<br />
<strong>of</strong> characterizing the oxidation <strong>and</strong> crosslinking<br />
products <strong>of</strong> alkyd resins on exposure to light, using<br />
high-resolution <strong>and</strong> solid-state NMR spectroscopy, is<br />
in progress in our laboratory.<br />
The authors thank Dr. G. Tsagaropoulos, <strong>of</strong> Interchem Hellas<br />
SA, for providing the samples, <strong>and</strong> Pr<strong>of</strong>essor P. Dais,<br />
University <strong>of</strong> Crete, for providing lab space.<br />
References<br />
1. Morgans, W. Outlines <strong>of</strong> Paint Technology; Halsted: New York,<br />
1990; Chapter 11.<br />
2. Br<strong>and</strong>au, A. Introduction to Coatings Technology; Federation <strong>of</strong><br />
Societies for Coatings Technology: Philadelphia, PA. 1990.<br />
3. Prane, J. Introduction to Polymers <strong>and</strong> <strong>Resins</strong>; Federation <strong>of</strong><br />
Societies for Coatings Technology: Philadelphia, PA, 1986.<br />
4. Weiss, K. D. Prog Polym Sci 1997, 22, 203.<br />
5. H<strong>of</strong>l<strong>and</strong>, A. J. Coat Technol 1995, 67, 113.<br />
6. Koenig, J. L. Spectroscopy <strong>of</strong> Polymers, 2nd ed.; Elsevier Science:<br />
Amsterdam, 1999.<br />
7. Tolman, J. R.; Prestegard, J. H. Concepts NMR Spectrosc 1995,<br />
114, 10663.<br />
8. Norwood, T. J Chem Soc Rev 1994, 23, 59.<br />
9. Braun, S.; Kalinowski, H.-O., Berger, S. 150 <strong>and</strong> More Basic<br />
NMR Experiments: A Practical Course; Wiley-VCH: Weinheim,<br />
1990.<br />
10. Aldrich/ACD Library <strong>of</strong> FT NMR Spectra Pro, v. 1.0, 1998.<br />
11. Sacchi, R.; Addeo, F.; Paolillo, L. Magn Reson Chem 1997, 35,<br />
S133.<br />
12. Sacchi, R.; Patumi, M.; Fontanazza, G; Barone, P.; Fiordiponti, P.;<br />
Mannina, L.; Rossi, E.; Segre, A. L. J Am Oil Chem Soc 1996, 73,<br />
747.<br />
13. Integrated Spectral Data Base System for Organic Compounds;<br />
SDBSWeb: http://www.aist.go.jp/RIODB/SDBS/<br />
14. Spyros, A. J. Appl Polym Sci 2002, 83, 1635.