Table of Contents - HUNAGI
Table of Contents - HUNAGI
Table of Contents - HUNAGI

Create successful ePaper yourself
Turn your PDF publications into a flip-book with our unique Google optimized e-Paper software.
iGlobe: Bringing Weather and Climate to a 3D Globe<br />
Varun Chandola, Oak Ridge National Laboratory<br />
The growing understanding <strong>of</strong> changing climate and its impact on the environment and society has<br />
propelled heavy research investment in the area <strong>of</strong> climate modeling resulting in sophisticated<br />
models that can capture multitudes <strong>of</strong> scenarios and produce realistic forecasts at decadal and<br />
century scales and produce simulation outputs which are valuable data sources for understanding<br />
climate change impacts.<br />
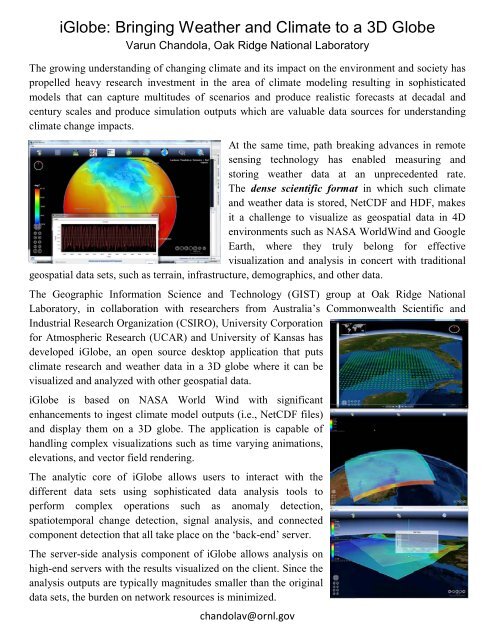
At the same time, path breaking advances in remote<br />
sensing technology has enabled measuring and<br />
storing weather data at an unprecedented rate.<br />
The dense scientific format in which such climate<br />
and weather data is stored, NetCDF and HDF, makes<br />
it a challenge to visualize as geospatial data in 4D<br />
environments such as NASA WorldWind and Google<br />
Earth, where they truly belong for effective<br />
visualization and analysis in concert with traditional<br />
geospatial data sets, such as terrain, infrastructure, demographics, and other data.<br />
The Geographic Information Science and Technology (GIST) group at Oak Ridge National<br />
Laboratory, in collaboration with researchers from Australia’s Commonwealth Scientific and<br />
Industrial Research Organization (CSIRO), University Corporation<br />
for Atmospheric Research (UCAR) and University <strong>of</strong> Kansas has<br />
developed iGlobe, an open source desktop application that puts<br />
climate research and weather data in a 3D globe where it can be<br />
visualized and analyzed with other geospatial data.<br />
iGlobe is based on NASA World Wind with significant<br />
enhancements to ingest climate model outputs (i.e., NetCDF files)<br />
and display them on a 3D globe. The application is capable <strong>of</strong><br />
handling complex visualizations such as time varying animations,<br />
elevations, and vector field rendering.<br />
The analytic core <strong>of</strong> iGlobe allows users to interact with the<br />
different data sets using sophisticated data analysis tools to<br />
perform complex operations such as anomaly detection,<br />
spatiotemporal change detection, signal analysis, and connected<br />
component detection that all take place on the ‘back-end’ server.<br />
The server-side analysis component <strong>of</strong> iGlobe allows analysis on<br />
high-end servers with the results visualized on the client. Since the<br />
analysis outputs are typically magnitudes smaller than the original<br />
data sets, the burden on network resources is minimized.<br />
chandolav@ornl.gov