AMPER, SA and Subsidiaries Consolidated Financial Statements for ...
AMPER, SA and Subsidiaries Consolidated Financial Statements for ...
AMPER, SA and Subsidiaries Consolidated Financial Statements for ...

Create successful ePaper yourself
Turn your PDF publications into a flip-book with our unique Google optimized e-Paper software.
The aggregate sum of Development Expenditures directly entered as an expense in the <strong>Consolidated</strong><br />
Income <strong>Statements</strong> of 2011 <strong>and</strong> 2010 is 12,641 thous<strong>and</strong>s of Euros <strong>and</strong> 9,984 thous<strong>and</strong>s of Euros<br />
respectively.<br />
At 31 December 2011 <strong>and</strong> 2010 there were no intangible assets to which title was restricted.<br />
At 31 December 2011 <strong>and</strong> 2010 the Group had fully amortised intangible fixed assets in use <strong>for</strong> a value<br />
of 19,874 thous<strong>and</strong>s of Euros <strong>and</strong> 17, 178 thous<strong>and</strong>s of Euros respectively.<br />
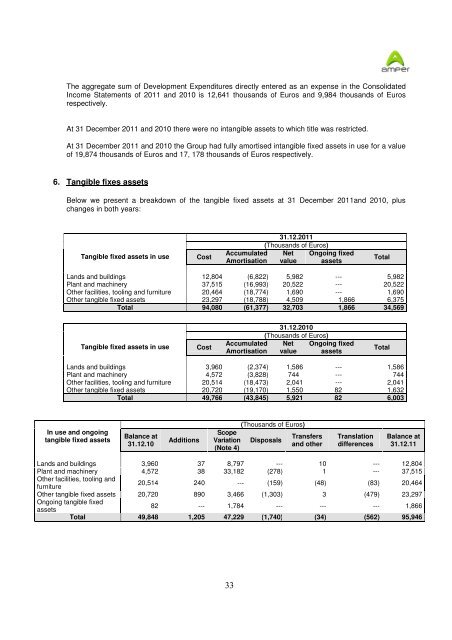
6. Tangible fixes assets<br />
Below we present a breakdown of the tangible fixed assets at 31 December 2011<strong>and</strong> 2010, plus<br />
changes in both years:<br />
Tangible fixed assets in use<br />
Cost<br />
Accumulated<br />
Amortisation<br />
31.12.2011<br />
(Thous<strong>and</strong>s of Euros)<br />
Net<br />
value<br />
Ongoing fixed<br />
assets<br />
Total<br />
L<strong>and</strong>s <strong>and</strong> buildings 12,804 (6,822) 5,982 --- 5,982<br />
Plant <strong>and</strong> machinery 37,515 (16,993) 20,522 --- 20,522<br />
Other facilities, tooling <strong>and</strong> furniture 20,464 (18,774) 1,690 --- 1,690<br />
Other tangible fixed assets 23,297 (18,788) 4,509 1,866 6,375<br />
Total 94,080 (61,377) 32,703 1,866 34,569<br />
Tangible fixed assets in use<br />
Cost<br />
Accumulated<br />
Amortisation<br />
31.12.2010<br />
(Thous<strong>and</strong>s of Euros)<br />
Net<br />
value<br />
Ongoing fixed<br />
assets<br />
Total<br />
L<strong>and</strong>s <strong>and</strong> buildings 3,960 (2,374) 1,586 --- 1,586<br />
Plant <strong>and</strong> machinery 4,572 (3,828) 744 --- 744<br />
Other facilities, tooling <strong>and</strong> furniture 20,514 (18,473) 2,041 --- 2,041<br />
Other tangible fixed assets 20,720 (19,170) 1,550 82 1,632<br />
Total 49,766 (43,845) 5,921 82 6,003<br />
In use <strong>and</strong> ongoing<br />
tangible fixed assets<br />
Balance at<br />
31.12.10<br />
Additions<br />
Scope<br />
Variation<br />
(Note 4)<br />
(Thous<strong>and</strong>s of Euros)<br />
Disposals<br />
Transfers<br />
<strong>and</strong> other<br />
Translation<br />
differences<br />
Balance at<br />
31.12.11<br />
L<strong>and</strong>s <strong>and</strong> buildings 3,960 37 8,797 --- 10 --- 12,804<br />
Plant <strong>and</strong> machinery 4,572 38 33,182 (278) 1 --- 37,515<br />
Other facilities, tooling <strong>and</strong><br />
furniture<br />
20,514 240 --- (159) (48) (83) 20,464<br />
Other tangible fixed assets 20,720 890 3,466 (1,303) 3 (479) 23,297<br />
Ongoing tangible fixed<br />
assets<br />
82 --- 1,784 --- --- --- 1,866<br />
Total 49,848 1,205 47,229 (1,740) (34) (562) 95,946<br />
33