AMPER, SA and Subsidiaries Consolidated Financial Statements for ...
AMPER, SA and Subsidiaries Consolidated Financial Statements for ... AMPER, SA and Subsidiaries Consolidated Financial Statements for ...
AMPER, S.A. Income Statement (Thousands of euros) 2011 2010 2009 2008 Net Business Turnover 17.078 16.899 23.840 27.028 Changes in inventory --- --- --- --- Supplies --- --- --- --- Gross profit and loss 17.078 16.899 23.840 27.028 Other operating revenue 629 611 248 59 Personnel expenses (8.053) (6.836) (5.967) (6.056) Other operating expenses (4.698) (9.470) (6.375) (5.778) Depreciation of fixed assets (315) (404) (334) (288) Operating profit and loss 4.641 800 11.412 14.965 Financial profit and loss (8.080) (4.787) (6.680) (9.320) Profit and loss due to impairment/reversal of assets 5.557 (34.448) (12.568) (4.510) Pre-tax profit and loss 2.118 (38.435) (7.836) 1.135 Profit tax (568) (6.696) (1.543) 4.969 Financial year profit and loss 1.550 (45.131) (9.379) 6.104
AMPER PROGRAMAS DE ELECTRÓNICA Y COMUNICACIONES, S.A. Balance Sheets (Thousands of euros) Assets 2011 2010 2009 2008 NON-CURRENT ASSETS 10.507 10.318 9.333 9.220 Intangible fixed assets 1.798 1.973 1.935 2.019 Tangible fixed assets 1.621 2.437 3.379 4.051 Long-term financial investments 2.548 1.678 1.349 1.289 Other non-current assets 4.540 4.230 2.670 1.861 CURRENT ASSETS 61.809 72.068 81.768 85.231 Inventory 2.288 13.181 13.174 12.813 Trade and other current assets receivable 59.521 58.887 68.594 72.418 Total Assets 72.316 82.386 91.101 94.451 Liabilities 2011 2010 2009 2008 NET ASSETS 14.340 20.145 21.299 22.880 Capital 3.005 3.005 3.005 3.005 Reserves 6.078 13.586 13.337 12.050 Financial year profit and loss 5.257 3.554 4.957 7.825 NON-CURRENT LIABILITIES 1.359 1.375 166 319 CURRENT LIABILITIES 56.617 60.866 69.636 71.252 Total Liabilities 72.316 82.386 91.101 94.451
- Page 127 and 128: The Committees of the Board of Dire
- Page 129 and 130: D.1 Description of the risk policy
- Page 131 and 132: equired, its renewal or non renewal
- Page 133 and 134: YES Specify the measures adopted Th
- Page 135 and 136: Amper, S A losses for the fiscal ye
- Page 137 and 138: Beneficiaries: The Managing Directo
- Page 139 and 140: Likewise, in its session of 25 May
- Page 141 and 142: Not applicable 3. Although Commerci
- Page 143 and 144: the directors concerned, in additio
- Page 145 and 146: See caption: B.1.21 Not applicable
- Page 147 and 148: Complies 28. The companies must mak
- Page 149 and 150: c) Main characteristics of occupati
- Page 151 and 152: of the participation in the differe
- Page 153 and 154: a) To submit proposals with regard
- Page 155 and 156: G - OTHER INFORMATION OF INTEREST I
- Page 157 and 158: APPENDIX TO THE ANNUAL CORPORATE GO
- Page 159 and 160: - In the case of all other employee
- Page 161 and 162: changes approved, as well as formal
- Page 163 and 164: EVALUATING RISKS IN FINANCIAL INFOR
- Page 165 and 166: The descriptions cover controls for
- Page 167 and 168: The manual establishes that its upd
- Page 169 and 170: A description of the scope of the e
- Page 171 and 172: KPMG KPMG Auditores S.L Edificio To
- Page 173 and 174: 3. Review the explanatory documenta
- Page 175 and 176: Principal Companies of the Amper Gr
- Page 177: AMPER, S.A. Balance Sheets (Thousan
- Page 181 and 182: AMPER SISTEMAS, S.A. (Unipersonal)
- Page 183 and 184: HEMISFERIO NORTE BRASIL, S. L. (Uni
- Page 185 and 186: GRUPO MEDIDATA INFORMÁTICA Balance
- Page 187 and 188: EPICOM, S.A. Balance Sheets (Thousa
- Page 189 and 190: LANDATA COMUNICACIONES DE EMPRESA,
- Page 191 and 192: AMPER GROUP Balance Sheets (Thousan
- Page 193 and 194: eLandia INTERNATIONAL, INC. Balance
- Page 195 and 196: 7. Delegation, in favour of the Boa
- Page 197 and 198: a) By the subsequent and express re
- Page 199 and 200: In accordance with the provisions s
- Page 201 and 202: Resolutions relating to item three
- Page 203 and 204: Shareholders representing at least
- Page 205 and 206: members are present or represented
- Page 207 and 208: This Regulation aims to: a) Make pu
- Page 209 and 210: • Significant events notified to
- Page 211 and 212: information could be harmful to the
- Page 213 and 214: Article 7. Convening of a meeting a
- Page 215 and 216: Article 11. Agenda The agenda shall
- Page 217 and 218: esolution previously adopted to suc
- Page 219 and 220: Article 28: Publication Following i
- Page 221 and 222: other existing paid-up share capita
- Page 223 and 224: each issue or issue tranche; howeve
- Page 225 and 226: debentures and bonds and warrants,
- Page 227 and 228: The present proposal may be subject
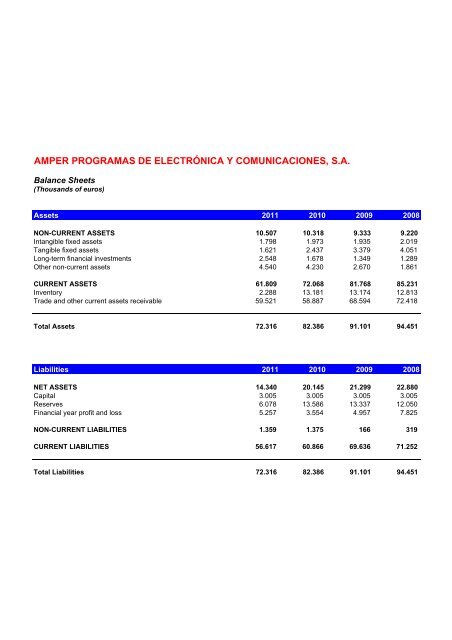
<strong>AMPER</strong> PROGRAMAS DE ELECTRÓNICA Y COMUNICACIONES, S.A.<br />
Balance Sheets<br />
(Thous<strong>and</strong>s of euros)<br />
Assets 2011 2010 2009 2008<br />
NON-CURRENT ASSETS 10.507 10.318 9.333 9.220<br />
Intangible fixed assets 1.798 1.973 1.935 2.019<br />
Tangible fixed assets 1.621 2.437 3.379 4.051<br />
Long-term financial investments 2.548 1.678 1.349 1.289<br />
Other non-current assets 4.540 4.230 2.670 1.861<br />
CURRENT ASSETS 61.809 72.068 81.768 85.231<br />
Inventory 2.288 13.181 13.174 12.813<br />
Trade <strong>and</strong> other current assets receivable 59.521 58.887 68.594 72.418<br />
Total Assets 72.316 82.386 91.101 94.451<br />
Liabilities 2011 2010 2009 2008<br />
NET ASSETS 14.340 20.145 21.299 22.880<br />
Capital 3.005 3.005 3.005 3.005<br />
Reserves 6.078 13.586 13.337 12.050<br />
<strong>Financial</strong> year profit <strong>and</strong> loss 5.257 3.554 4.957 7.825<br />
NON-CURRENT LIABILITIES 1.359 1.375 166 319<br />
CURRENT LIABILITIES 56.617 60.866 69.636 71.252<br />
Total Liabilities 72.316 82.386 91.101 94.451


