O-Cube™ and H-Cube® Application Note - ThalesNano
O-Cube™ and H-Cube® Application Note - ThalesNano
O-Cube™ and H-Cube® Application Note - ThalesNano

Create successful ePaper yourself
Turn your PDF publications into a flip-book with our unique Google optimized e-Paper software.
O-Cube <strong>and</strong> H-Cube ® <strong>Application</strong> <strong>Note</strong><br />
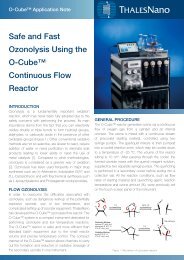
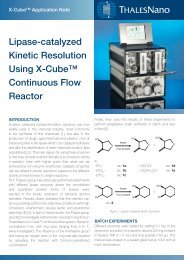
GENERAL PROCEDURE<br />
After setting up the corresponding reaction parameters<br />
(see Table 1), the O-Cube reactor was started in Auto<br />
Mode. In the meantime parameters on the H-Cube ®<br />
system were also set <strong>and</strong> the catalyst in the CatCart ®<br />
column was preactivated by passing solvent through the<br />
system in the presence of hydrogen.<br />
The ozonide solution from the O-Cube instrument was<br />
collected into a cooled (-30 °C) small sample vial. The<br />
solution was purged with nitrogen in order to drive out<br />
any excess of ozone prior to pumping into the H-Cube®<br />
instrument. The product (aldehyde) was collected at the<br />
outlet of the device.<br />
In order to decrease the time spent for optimization of<br />
the reaction we have used a FT-IR inline monitoring by<br />
integrating the flow cell of the ReactIR (product of Mettler<br />
Toledo Autochem Inc.) <strong>and</strong> making measurements in the<br />
near IR range (650-4000 cm -1 ) every 30 secs.<br />
Before running each reaction, reference spectra of the<br />
solvent, the starting material <strong>and</strong> product were recorded,<br />
<strong>and</strong> the peaks of the solvent were subtracted from the<br />
starting material <strong>and</strong> product spectra. In the case of<br />
the products <strong>and</strong> starting materials we needed to find<br />
a specific wave number where the ReactIR system<br />
was able to continuously monitor the intensity of each<br />
compound (Figure 2) over time. The optimal reaction<br />
conditions were identified when the maximum intensity<br />
of the product could be recorded <strong>and</strong> where the peak of<br />
the starting material disappeared (Figure 3). The product<br />
mixture collected under the optimal conditions was<br />
evaporated to yield the product. The optimal conditions<br />
for each reaction <strong>and</strong> results can be seen in Table 1.<br />
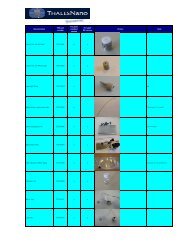
Reaction Reaction conditions Result<br />
Table 1: Reaction conditions <strong>and</strong> results, *: by 1 H-NMR, **: by TLC<br />
c = 0.02 M in DCM<br />
O-Cube: -30 °C, 1 mL/min,<br />
50% O 3 excess<br />
H-Cube ® : RT, 30 bar, 1mL/min,<br />
10% Pd/C<br />
c = 0.04 M in EtOAc<br />
O-Cube: -28 °C, 1 mL/min,<br />
50% O 3 excess<br />
H-Cube ® : RT, 30 bar, 1mL/min,<br />
10% Pd/C<br />
c = 0.06 M in DCM<br />
O-Cube: -9 °C, 0.7 mL/min,<br />
50% O 3 excess<br />
H-Cube ® : RT, 30 bar, 0.7 mL/min,<br />
10% Pd/C<br />
c = 0.07 M in EtOH<br />
O-Cube: -28 °C, 0.7 mL/min,<br />
30% O 3 excess<br />
H-Cube ® : RT, 30 bar, 0.7 mL/min,<br />
10% Pd/C<br />
Isolated yield: 85%<br />
Purity*: >95%<br />
Conversion**:<br />
quantitative<br />
Isolated yield: 80%<br />
Purity*: 90%<br />
Conversion**:<br />
quantitative<br />
Isolated yield: 77%<br />
Purity*: 100%<br />
Isolated yield: 50%<br />
Purity*: 100%