Elektronika 2012-01 I.pdf - Instytut Systemów Elektronicznych ...
Elektronika 2012-01 I.pdf - Instytut Systemów Elektronicznych ...
Elektronika 2012-01 I.pdf - Instytut Systemów Elektronicznych ...

You also want an ePaper? Increase the reach of your titles
YUMPU automatically turns print PDFs into web optimized ePapers that Google loves.
ok LIII nr 1/<strong>2<strong>01</strong>2</strong><br />
• MATERIAŁY • KONSTRUKCJE • UKŁADY<br />
• SYSTEMY • MIKROELEKTRONIKA<br />
• OPTOELEKTRONIKA • FOTONIKA<br />
konstrukcje technologie zastosowania<br />
MIESIECZNIK NAUKOWO-TECHNICZNY<br />
• ELEKTRONIKA MIKROFALOWA<br />
• MECHATRONIKA<br />
• ENERGOELEKTRONIKA • INFORMATYKA<br />
ZESPÓŁ REDAKCYJNY<br />
prof. dr hab. inż. Jerzy Klamka – redaktor naczelny<br />
Bożena Lachowicz – sekretarz redakcji<br />
Stały współpracownik: mgr inż. Cezary Rudnicki<br />
Redaktorzy tematyczni: mgr inż. Wiesław Jabłoński,<br />
mgr inż. Krzysztof Kowalski<br />
Adres redakcji: ul. Chmielna 6 m.6, 00-020 Warszawa,<br />
tel./fax (22) 827 38 79; tel.: (22) 826 65 64,<br />
e-mail: elektronika@red.pl.pl, www.elektronika.orf.pl<br />
Zamówienia na reklamę przyjmuje redakcja lub Dział Reklamy<br />
i Marketingu, ul. Mazowiecka 12, 00-950 Warszawa, skr. 1004, tel./fax<br />
(22) 827 43 66, (22) 826 80 16, e-mail: reklama@sigma-not.pl<br />
Kolportaż: ul. Ku Wiśle 7, 00-716 Warszawa, tel. (22) 840 35 89;<br />
tel./fax: (22) 840 59 49, (22) 891 13 74<br />
RADA PROGRAMOWA<br />
prof. dr hab. inż. Władysław Torbicz (PAN) – przewodniczący<br />
prof. dr hab. inż. Leonard Bolc, dr hab. inż. Jerzy Czajkowski, prof.<br />
dr hab. inż. Andrzej Dziedzic, prof. dr hab. inż. Jerzy Frączek, dr hab<br />
inż. Krzysztof Górecki, dr inż. Józef Gromek, mgr inż. Jan Grzybowski,<br />
prof. dr hab. Ryszard Jachowicz, prof. dr hab. Włodzimierz Janke,<br />
prof. dr hab. Włodzimierz Kalita, inż. Stefan Kamiński, prof. dr hab.<br />
inż. Marian P. Kaźmierkowski, dr inż. Wojciech Kocańda, prof. dr hab.<br />
Bogdan Kosmowski, mgr inż. Zbigniew Lange, dr inż. Zygmunt Łuczyński,<br />
prof. dr hab. inż. Józef Modelski, prof. dr hab. Tadeusz Morawski,<br />
prof. dr hab. Bohdan Mroziewicz, prof. dr hab. Andrzej Napieralski, prof.<br />
dr hab. Tadeusz Pałko, prof. dr hab. inż. Marian Pasko, prof. dr hab. Józef<br />
Piotrowski, prof. dr hab. inż. Ryszard Romaniuk, dr hab. inż. Grzegorz<br />
Różański, prof. dr hab. inż. Edward Sędek, prof. dr hab. Ludwik<br />
Spiralski, prof. dr hab. inż. Zdzisław Trzaska, mgr inż. Józef Wiechowski,<br />
prof. dr hab. inż. Marian Wnuk, prof. dr hab. inż. Janusz Zarębski<br />
Czasopismo dotowane przez Ministerstwo Nauki i Szkolnictwa<br />
Wyższego. Za opublikowane w nim artykuły MNiSzW przyznaje<br />
9 punktów.<br />
SIGMA - NOT<br />
Spółka z o.o.<br />
00-950 Warszawa<br />
skrytka pocztowa 1004<br />
ul. Ratuszowa 11<br />
tel.: (0-22) 818 09 18, 818 98 32<br />
fax: (022) 619 21 87<br />
Internet<br />
http://www.sigma-not.pl<br />
Prenumerata<br />
e-mail: kolportaz@sigma-not.pl<br />
Informacje<br />
e-mail: informacja@sigma-not.pl<br />
“<strong>Elektronika</strong>” jest wydawana<br />
przy współpracy Komitetu Elektroniki<br />
i Telekomunikacji Polskiej Akademii Nauk<br />
IEEE<br />
WYDAWNICTWO<br />
CZASOPISM I KSIĄŻEK<br />
TECHNICZNYCH<br />
Redakcja współpracuje<br />
z Polską Sekcją IEEE<br />
„<strong>Elektronika</strong>” jest notowana<br />
w międzynarodowej bazie IEE<br />
Inspec<br />
Publikowane artykuły naukowe były<br />
recenzowane przez samodzielnych<br />
pracowników nauki<br />
Redakcja nie ponosi odpowiedzialności<br />
za treść ogłoszeń. Zastrzega<br />
sobie prawo do skracania i adiustacji<br />
nadesłanych materiałów.<br />
Indeks 35722<br />
Nakład do 2000 egz.<br />
Skład i druk: Drukarnia SIGMA-NOT Sp. z o.o.<br />
Wersja papierowa ELEKTRONIKI jest wersją pierwotną.<br />
Spis treści ● Contents<br />
Study of IDE as a sensor head for interfacing with handheld<br />
electrochemical analyzer system (Projekt głowicy IDE dla<br />
sensorów do zastosowań w podręcznych systemach analizy<br />
elektrochemicznej) – Velusamy V., Arshak K., Korostynska O.,<br />
Adley C. . . . . . . . . . . . . . . . . . . . . . . . . . . . . . . . . . . . . . . . . . . 11<br />
Impact of non-optimal grounding of the CC2420 RFIC on<br />
a 802.15.4 Tyndall sensor wireless mote (Wpływ nieoptymalnego<br />
uziemienia układu CC2420 zgodnego ze standardem<br />
IEEE 802.15.4 na pracę systemu Tyndall Mote) – Haigh P., Buckley<br />
J., O’Flynn B., Ó’Mathúna C. . . . . . . . . . . . . . . . . . . . . . 14<br />
Numerical study of the interface heat transfer characteristics<br />
of micro-cooler with CNT structures (Analiza numeryczna<br />
transferu ciepła przez interfejs mikroradiatora ze strukturami<br />
CNT) – Zhang Y., Wang S., Ma S., Hu Z., Liu J., Sitek<br />
J., Janeczek K. . . . . . . . . . . . . . . . . . . . . . . . . . . . . . . . . . . . . 17<br />
Device for road holes and obstacles detection (Urządzenie<br />
do rozpoznawania dziur oraz przeszkód na drodze) – Gelmuda<br />
W., Kos A. . . . . . . . . . . . . . . . . . . . . . . . . . . . . . . . . . . . . . 19<br />
Metal – oxide sensor array for gas detection (Matryca sensorów<br />
na bazie tlenków metali do detekcji gazów) – Gwiżdż P.,<br />
Brudnik A., Zakrzewska K. . . . . . . . . . . . . . . . . . . . . . . . . . . . . 22<br />
Dynamic research of foot pressure distribution – the fourpoints<br />
shoe insert with PVDF sensors (Dynamiczne badania<br />
rozkładu nacisku stopy na podłoże – czteropunktowa wkładka<br />
do obuwia z polimerowymi czujnikami z PVDF) – Klimiec E.,<br />
Zaraska W., Kuczyński Sz. . . . . . . . . . . . . . . . . . . . . . . . . . . . 25<br />
Design and realization of a microfluidic capillary sensor based<br />
on a silicon structure and disposable optrodes (Projekt<br />
i realizacja mikrocieczowego czujnika kapilarnego opartego na<br />
przestrzennej strukturze krzemowej z wykorzystaniem włókien<br />
światłowodowych) – Szczepański Z., Borecki M., Szmigiel D.,<br />
Pawlowski M.L.K. . . . . . . . . . . . . . . . . . . . . . . . . . . . . . . . . . . . 28<br />
A compact thermoelectric harvester for waste heat conversion<br />
(Kompaktowy termoelektryczny generator do pozyskiwania<br />
i przetwarzania ciepła odpadowego na energię elektryczną)<br />
– Dziurdzia P., Lichota K. . . . . . . . . . . . . . . . . . . . . . . . . . . . . . 30<br />
An investigation of the quality of the conductive lines deposited<br />
by inkjet printing on different substrates (Badanie<br />
jakości ścieżek przewodzących wytworzonych metodą druku<br />
strumieniowego na różnych podłożach) – Sitek J., Futera K.,<br />
Belavič D., Santo Zarnik M., Kościelski M., Bukat K., Janeczek<br />
K., Kuščer Hrovatin D., Jakubowska M. . . . . . . . . . . . . . . . . . 32<br />
High temperature properties of thick-film and LTCC components<br />
(Wysokotemperaturowe właściwości elementów grubowarstwowych<br />
i LTCC) – Nowak D., Janiak M., Dziedzic A.,<br />
Piasecki T. . . . . . . . . . . . . . . . . . . . . . . . . . . . . . . . . . . . . . . . . 35<br />
LTCC microfluidic chip with fluorescence based detection<br />
(Mikroprzepływowy fluorescencyjny czujnik ceramiczny wykonany<br />
techniką LTCC) – Czok M., Malecha K., Golonka L. . . . . 37<br />
Investigation of multiple degradation and rejuvenation cycles<br />
of electroluminescent thick film structures (Badanie<br />
powtarzanych cykli degradacji i regeneracji grubowarstwowych<br />
struktur elektroluminescencyjnych) – Mroczkowski M., Cież M.,<br />
Kalenik J. . . . . . . . . . . . . . . . . . . . . . . . . . . . . . . . . . . . . . . . . . 39
Investigations of passive components embedded in printed<br />
circuit boards (Badania podzespołów biernych wbudowanych<br />
w płytki obwodów drukowanych) – Stęplewski W., Serzysko T.,<br />
Kozioł G., Janeczek K., Dziedzic A. . . . . . . . . . . . . . . . . . . . . . 41<br />
GENESI: Wireless Sensor Networks for structural monitoring<br />
(Bezprzewodowa sieć sensorów do monitorowania<br />
strukturalnego) – O’Flynn B., Boyle D., Popovici E., Magno<br />
M., Petrioli C. . . . . . . . . . . . . . . . . . . . . . . . . . . . . . . . . . . . . . 46<br />
Mechanical and thermal properties of SiC – ceramics<br />
substrate interface (Mechaniczne oraz cieplne właściwości<br />
połączenia między strukturą SiC a podłożem ceramicznym)<br />
– Kisiel R., Szczepański Z., Firek P., Guziewicz M.,<br />
Krajewski A. . . . . . . . . . . . . . . . . . . . . . . . . . . . . . . . . . . 48<br />
Analysis of pulse durability of thin-film and polymer thickfilm<br />
resistors embedded in printed circuit boards (Analiza<br />
odporności impulsowej grubo- i cienkowarstwowych rezystorów<br />
wbudowanych w płytki obwodów drukowanych) – Kłossowicz<br />
A., Dziedzic A., Winiarski P., Stęplewski W., Kozioł G.. . . . . . . 51<br />
Analysis of long-term stability of thin-film and polymer thickfilm<br />
resistors embedded in Printed Circuit Boards (Analiza<br />
stabilności długoczasowejrezystorów cienkowarstwowych oraz<br />
polimerowych rezystorów grubowarstwowych wbudowanych<br />
w płytkiobwodów drukowanych) – Winiarski P., Dziedzic A.,<br />
Kłossowski A., Stęplewski W., Kozioł G.. . . . . . . . . . . . . . . . . . 55<br />
Impedance spectroscopy as a diagnostic tool of degradation<br />
of Solid Oxide Fuel Cells (Spektroskopia impedancyjna jako<br />
narzędzie diagnostyczne degradacji tlenkowych ogniw paliwowych)<br />
– Dunst K., Molin S., Jasiński P. . . . . . . . . . . . . . . . . . . . 59<br />
Analysis of electromagnetic couplingsin hybrid circuit<br />
made on austenitic metal substrate (Analiza sprzężeń elektromagnetycznych<br />
w układach hybrydowych wykonanych na<br />
podłożach ze stali austenitycznej) – Sabat W., Klepacki D.,<br />
Kamuda K. . . . . . . . . . . . . . . . . . . . . . . . . . . . . . . . . . . . . . . . 61<br />
EMC aspects in microelectronics structures made in LTCC<br />
technology ( Zagadnienia EMC w mikroelektronicznych strukturach<br />
wytwarzanych w technologii LTCC) – Sabat W., Klepacki<br />
D., Kalita W., Slosarčík S., Jurčišin M., Cabúk P. . . . . . . . . . . 65<br />
Method of processing of thermal images recorded in the<br />
beam displacement modulation technique (Metoda przetwarzania<br />
obrazów termicznych zarejestrowanych techniką<br />
modulacji przestrzennej) – Kosikowski M., Suszyński Z. . . . . . 68<br />
Electrocatalytic sensor based on Nasicon with auxiliary layer<br />
(Czujnik elektrokatalityczny na bazie Nasiconu z warstwą dodatkową<br />
– Strzelczyk A., Jasiński G., Jasiński P., Chachulski B. . . 72<br />
Oxide layers fabricated by spray pyrolysis on metallic surfaces<br />
(Warstwy tlenkowe wytworzone metodą pirolizy aerozolowej<br />
na podłożach metalicznych) – Kobierowska K., Karpińska<br />
M., Molin S., Jasiński P. . . . . . . . . . . . . . . . . . . . . . . . . . . . . . . 74<br />
TECHNIKA SENSOROWA: Mechanoakustyczny czujnik aktywności<br />
układu sercowo-naczyniowego (Mechano-acoustic<br />
sensor of the cardiovascular system activity) – Lewandowski<br />
J., Dziuda Ł., Celiński-Spodar K. . . . . . . . . . . . . . . . . . . . . 77<br />
TECHNIKA MIKROFALOWA I RADIOLOKACJA: Aktywne anteny<br />
radarów wielofunkcyjnych – analiza stanu i perspektywy<br />
rozwoju – część 1 (Active phased antenna array for multifunction<br />
radar – review and perspective development – part 1)<br />
– Sędek E. . . . . . . . . . . . . . . . . . . . . . . . . . . . . . . . . . . . . . . . . 81<br />
TECHNIKI INFORMATYCZNE: Technologie informacyjne<br />
w predykcji pogodowych zagrożeń w ruchu drogowym (Information<br />
technology in prediction of weather hazards affecting<br />
road traffic) – Mitas A.W., Bernaś M., Bugdol M., Ryguła A. 90<br />
Electronic measurement system for monitoring of geometrical<br />
parameters of rolling shaped metal profiles (Еlektroniczny<br />
system pomiarowy do kontroli parametrów geometrycznych<br />
profili produkowanych na liniach wytłaczarkowych) – Zaharieva<br />
S., Mutkov V., Georgiev I. . . . . . . . . . . . . . . . . . . . . . . . . . . . . 95<br />
Modulacja amplitudy sygnałem pseudolosowym (Amplitude modulation<br />
with pseudo random signal) – Stępień R., Walczak J. . . 98<br />
Problematyka modelowania w programie SPICE charakterystyk<br />
stałoprądowych elektroizolowanych diodowych modułów<br />
mocy zawierających diody typu PiN oraz diody typu FRED<br />
(Problem of the SPICE modeling of the d.c. characteristics of the<br />
electroisolated power diode modules containing PiN diodes and<br />
fast recovery epitaxial diodes) – Dąbrowski J., Zarębski J. . . . . 103
Streszczenia artykułów ● Summaries of the articles<br />
VELUSAMY V., ARSHAK K., KOROSTYNSKA O., ADLEY C.: Projekt<br />
głowicy IDE dla sensorów do zastosowań w podręcznych systemach<br />
analizy elektrochemicznej<br />
<strong>Elektronika</strong> (LIII), nr 1/<strong>2<strong>01</strong>2</strong>, s. 11<br />
W ostatnich latach wiele publikowano na temat przetworników elektrochemicznych<br />
do różnych zastosowań, między innymi do diagnostyki chorób<br />
zakaźnych, detekcji związków chemicznych, hybrydyzacji DNA i detekcji<br />
patogenicznych mikroorganizmów. Monitorowanie żywności i wody w czasie<br />
rzeczywistym ma globalnie wysoki priorytet a obecność patogenicznych<br />
organizmów jest szczególnie ważnym zagadnieniem w badaniach<br />
środowiska. Chociaż zastosowano różne miary do monitorowania jakości<br />
żywości, takie jak zasady dobrej praktyki rolniczej [1, 2], zasady dobrej<br />
praktyki produkcyjnej [2, 3], system analizy zagrożeń i krytycznych punktów<br />
kontroli (HACCP) [4, 5] system kodów do znakowania żywności [6],<br />
ciągle pojawiają się raporty o wybuchach epidemii.<br />
Przedmiotem pracy jest projekt głowicy czujnika do zastosowania w podręcznym<br />
elektrochemicznym analizatorze do detekcji w czasie rzeczywistym<br />
zmiennych środowiskowych z uwzględnieniem patogenicznych mikroorganizmów.<br />
Cienkowarstwową międzypalczastą złotą elektrodę (IDE),<br />
wykonaną techniką sitodruku, zastosowano jako czujnik do detekcji DNA<br />
występującego w żywności patogenu Bacillus cereus. Zastosowanie Polypyrrole<br />
(PPy) jako matrycy immobilizującej i połączenie modyfikowanej<br />
za pomocą PPy międzypalczastej mikroelektrody z pomiarami impedancji<br />
dało czuły biosensor, który jest zdolny do detekcji DNA. Elektroda IDE<br />
wykonana w technologii cienkowarstwowej jest czuła, szybka i tania. Uzyskano<br />
elektryczną detekcję 100 pM koncentracji DNA immobilizowanego<br />
na zmodyfikowanej przez PPy złotej IDE, o szerokości 400µm.<br />
Słowa kluczowe: przetworniki elektrochemiczne, analizator impedancji;<br />
biosensor; DNA<br />
VELUSAMY V., ARSHAK K., KOROSTYNSKA O., ADLEY C.: Study of<br />
IDE as a sensor head for interfacing with handheld electrochemical<br />
analyzer system<br />
<strong>Elektronika</strong> (LIII), no 1/<strong>2<strong>01</strong>2</strong>, p. 11<br />
Electrochemical sensors for various applications including diagnosis of infectious<br />
diseases, detection of chemicals, DNA hybridization and detection<br />
of pathogenic micro-organisms have been reported in recent years. Realtime<br />
monitoring of food and water is a high priority globally and the presence<br />
of pathogenic micro organisms is a particular environmental concern.<br />
Although various measures like good agricultural practices [1, 2], good<br />
manufacturing practices [2, 3], hazard analysis and critical control point<br />
(HACCP) [4, 5] and the food code indicating approaches [6], have been<br />
taken to monitor the food quality, there are still reports of outbreaks.<br />
Detailed in this work is the design of a sensor head for use in a handheld<br />
electrochemical analyzer system to detect environmental variables including<br />
pathogenic micro-organisms in real-time. A thick-film interdigitated<br />
gold electrode (IDE) prepared by screen printing technique was employed<br />
as a sensor to detect DNA of the foodborne pathogen Bacillus cereus. Polypyrrole<br />
(PPy) was used as an immobilization matrix and the combination<br />
of PPy modified interdigitated micro-electrode with impedance measurements<br />
yielded a sensitive label-free biosensor which was able to detect<br />
DNA. The IDE prepared by thick-film technology is sensitive, rapid and<br />
cost effective. The electrical detection of 100 pM concentration of DNA<br />
immobilized onto the PPy modified gold IDE was achieved, with an IDE<br />
width of 400µm.<br />
Keywords: Electrochemical sensor; impedance analyzer; biosensor;<br />
DNA<br />
HAIGH P., BUCKLEY J., O’FLYNN B., Ó’MATHÚNA C.: Wpływ nieoptymalnego<br />
uziemienia układu CC2420 zgodnego ze standardem IEEE<br />
802.15.4 na pracę systemu Tyndall Mote<br />
<strong>Elektronika</strong> (LIII), nr 1/<strong>2<strong>01</strong>2</strong>, s. 14<br />
Działanie układu dopasowującego wysokiej częstotliwości zależy od integralności<br />
uziemienia. Jeżeli połączenie z masą nie jest właściwe, powstają<br />
dodatkowe elementy pasożytnicze, które mogą degradować funkcjonowanie<br />
układu i prowadzić do niepożądanych wyników. Tradycyjnie, projektanci<br />
mierzą moc fali stojącej dla oceny czy tor W.Cz. pracuje optymalnie,<br />
elementy są dopasowane i uziemione. W artykule pokazano, że są<br />
sytuacje, gdy jakość modulacji może być narażona na szwank z powodu<br />
wady uziemienia, która się nie ujawnia przy pomiarze fali stojącej. Konsekwencją<br />
tego jest zredukowany zakres i niezawodność układu. Pomiary<br />
wykonywano na przykładzie systemu Tyndall Mote z zastosowaniem układu<br />
CC2420 aby zademonstrować jak wadliwe połączenie lutowane pomiędzy<br />
masą a płaszczyzną płytki drukowanej, która powinna być uziemiona,<br />
może prowadzić do degradacji funkcjonowania układu. Zaprezentowano<br />
szczegółową analizę pogorszenia jakości przebiegu, przy jednoczesnym<br />
utrzymywaniu się mocy wyjściowej w akceptowalnych granicach, która<br />
wymagała nowej definicji metrologicznej dla standardu IEEE 802.15.4.<br />
Słowa kluczowe: CC2420, sensory bezprzewodowe, uziemienie, 802.15.4,<br />
wielkość wektora błędu (EVM)<br />
HAIGH P., BUCKLEY J., O’FLYNN B., Ó’MATHÚNA C.: Impact of nonoptimal<br />
grounding of the CC2420 RFIC on a 802.15.4 Tyndall sensor<br />
wireless mote<br />
<strong>Elektronika</strong> (LIII), no 1/<strong>2<strong>01</strong>2</strong>, p. 14<br />
The performance of an RF output matching network is dependent on integrity<br />
of the ground connection. If this connection is compromised in anyway,<br />
additional parasitic elements may occur that can degrade performance<br />
and yield unreliable results. Traditionally, designers measure Constant<br />
Wave (CW) power to determine that the RF chain is performing optimally,<br />
the device is properly matched and by implication grounded. It is shown<br />
that there are situations where modulation quality can be compromised<br />
due to poor grounding that is not apparent using CW power measurements<br />
alone. The consequence of this is reduced throughput, range and<br />
reliability. Measurements are presented on a Tyndall Mote using a CC2420<br />
RFIC to demonstrate how poor solder contact between the ground contacts<br />
and the ground layer of the PCB can lead to the degradation of modulated<br />
performance. Detailed evaluation that required the development of<br />
a new measurement definition for 802.15.4 and analysis is presented to<br />
show how waveform quality is affected while the modulated output power<br />
remains within acceptable limits.<br />
Keywords: CC2420, Wireless Sensors, Grounding, 802.15.4, Error Vector<br />
Magnitude (EVM)<br />
ZHANG Y., WANG S., MA S., HU Z., LIU J., SITEK J., JANECZEK K.:<br />
Analiza numeryczna transferu ciepła przez interfejs mikroradiatora<br />
ze strukturami CNT<br />
<strong>Elektronika</strong> (LIII), nr 1/<strong>2<strong>01</strong>2</strong>, s. 17<br />
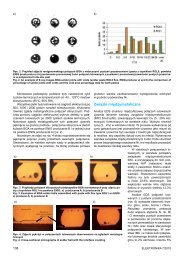
Technika mikrochłodzenia stanowi obiecujące rozwiązanie w zarządzaniu<br />
ciepłem systemów elektronicznych wraz ze wzrostem mocy mikroprocesorów.<br />
Nanorurki węglowe (CNTs) mogą być wykorzystane w mikroradiatorach,<br />
jako podstawowy materiał służący do tworzenia struktur rozpraszających<br />
ciepło w ich wnętrzu. Interfejsami w mikroradiatorach opartych<br />
na CNTs są obszary między CNT i substancją chłodzącą oraz miedzy CNT<br />
i klejem. Transfer ciepła przez te interfejsy ma istotny wpływ na wydajność<br />
mikroradiatora. W artykule ukazano wyniki analiz numerycznych transferu<br />
ciepła przez interfejsy pomiędzy CNT i innymi materiałami przeprowadzone<br />
za pomocą symulacji dynamiki molekularnej (MDS) dla różnych przypadków.<br />
Słowa kluczowe: zarządzanie ciepłem, nanorurki węglowe (CNT), Symulacja<br />
dynamiki molekularnej (MDS)<br />
ZHANG Y., WANG S., MA S., HU Z., LIU J., SITEK J., JANECZEK K.:<br />
Numerical study of the interface heat transfer characteristics of micro-cooler<br />
with CNT structures<br />
<strong>Elektronika</strong> (LIII), no 1/<strong>2<strong>01</strong>2</strong>, p. 17<br />
Micro-cooling techniques provide a promising solution for the thermal<br />
management of electronics system with increasing microprocessor powers.<br />
Carbon nanotubes (CNTs) can be utilized in micro-coolers as basic<br />
materials to constitute the heat dissipation structures inside. The interfaces<br />
involved in the CNT-based micro-cooler include the one between the CNT<br />
and the coolant, and the CNT and the adhesive. The heat transfer through<br />
these interfaces plays an important role in the thermal performance of the<br />
micro-cooler. In this paper, numerical investigations on thermal resistance<br />
across interfaces between the CNT and other materials are carried out by<br />
molecular dynamics simulation (MDS), and various cases are studied.<br />
Keywords: Thermal Management, CNT, MDS<br />
<strong>Elektronika</strong> 1/<strong>2<strong>01</strong>2</strong>
Streszczenia artykułów ● Summaries of the articles<br />
GELMUDA W., KOS A.: Urządzenie do rozpoznawania dziur oraz przeszkód<br />
na drodze<br />
<strong>Elektronika</strong> (LIII), nr 1/<strong>2<strong>01</strong>2</strong>, s. 19<br />
Na początku XXI wieku ludzkość nadal boryka się ze zjawiskiem niepełnosprawności.<br />
Chociaż istnieje wiele protez oraz wyspecjalizowanych<br />
urządzeń, niektóre problemy ludzi niepełnosprawnych ciągle pozostają<br />
nierozwiązane. Na świecie są miliony osób niewidomych i prawie każda<br />
z nich korzysta z pomocy prostej laski dla niewidomych jako podstawowej<br />
pomocy przy przemieszczaniu się. W celu poprawy bezpieczeństwa osób<br />
niewidomych podczas poruszania się autorzy konstruują specjalne urządzenie<br />
w ramach projektu MOBIAN©. Jednymi z trudniejszych przeszkód<br />
do wykrycia podczas poruszania się osoby niewidomej są dziury i uskoki<br />
w nawierzchni. W tym celu użyty został dalmierz na podczerwień. Do wykrywania<br />
przeszkód zastosowano wiele czujników ultradźwiękowych dla<br />
powiększenia obszaru wykrywania. Artykuł przedstawia projekt urządzenia<br />
do wykrywania przeszkód oraz dziur i uskoków nawierzchni.<br />
Słowa kluczowe: ultradźwięki, podczerwień, sensory, niewidomi, przeszkody,<br />
wykrywanie dziur, symulator<br />
GWIŻDŻ P., BRUDNIK A., ZAKRZEWSKA K.: Matryca sensorów na bazie<br />
tlenków metali do detekcji gazów<br />
<strong>Elektronika</strong> (LIII), nr 1/<strong>2<strong>01</strong>2</strong>, s. 22<br />
Celem projektu było zaprojektowanie i skonstruowanie matrycy półprzewodnikowych<br />
rezystancyjnych czujników gazów przeznaczonej do detekcji<br />
i rozpoznawania składników mieszaniny gazów. W skład matrycy wchodzi<br />
sześć komercyjnych sensorów gazów na bazie tlenków metali umieszczonych<br />
w komorze pomiarowej. Zastosowano również sensory wilgotności<br />
i temperatury. System elektroniczny obsługujący matrycę wykorzystuje mikrokontrolery<br />
z rdzeniem ARM i magistralę CAN co ułatwia jego rekonfigurację<br />
w przypadku zmiany liczby sensorów. Każdy sensor może pracować<br />
w innej temperaturze dzięki zmianie napięcia zasilania jego grzejnika. Zaprojektowany<br />
i skonstruowany system do detekcji gazu został przetestowany<br />
na wodór H 2<br />
, amoniak NH 3<br />
oraz dwutlenek węgla CO 2<br />
.<br />
Słowa kluczowe: czujniki gazów, mikrokontrolery<br />
KLIMIEC E., ZARASKA W., KUCZYŃSKI SZ.: Dynamiczne badania<br />
rozkładu nacisku stopy na podłoże – czteropunktowa wkładka do<br />
obuwia z polimerowymi czujnikami z PVDF<br />
<strong>Elektronika</strong> (LIII), nr 1/<strong>2<strong>01</strong>2</strong>, s. 25<br />
Możliwości ruchowe człowieka, w dużej mierze, zależą od stanu jego stopy.<br />
Ocenić go można, badając rozkład sił nacisku stopy na podłoże. Prawidłowo<br />
zbudowana stopa jest wysklepiona po wewnętrznej stronie, co działa<br />
jak amortyzator, łagodząc wstrząsy spowodowane chodzeniem. Największe<br />
wartości nacisku występują na pięcie i śródstopiu a nieznaczne na wklęśniętej<br />
części stopy, jego wzrost, świadczy o stopniu zdeformowania stopy<br />
np. przy płaskostopiu. W artykule omówiono sposób jego pomiaru przy pomocy<br />
opracowanej przez autorów czteropunktowej wkładki do obuwia, którą<br />
umieścić można w dowolnym obuwiu sportowym. Wielkość nacisku mierzono<br />
na pięcie, wklęśniętej części stopy, śródstopiu i dużym palcu, rejestrując<br />
napięcia wytworzone na czujnikach z piezoelektrycznej folii polimerowej<br />
z PVDF. Rezystancja obciążenia układu pomiarowego wynosiła 10 14 Ω.. Ponieważ<br />
czujnik pomiarowy z piezoelektrycznej folii polimerowej z elektrodami<br />
jest samo – ładującym się kondensatorem pod wpływem odkształceń mechanicznych<br />
a także wykazuje właściwości piroelektryczne, bardzo ważną<br />
rolę w prawidłowym przeprowadzeniu pomiarów, odgrywa układ zerujący.<br />
Zapewnia on powrót układu pomiarowego do punktu wyjścia po wykonaniu<br />
każdego kroku, zapobiegając zniekształceniu wyników pomiarowych.<br />
Słowa kluczowe: czujniki nacisku, PVDF, wady postawy<br />
SZCZEPAŃSKI Z., BORECKI M., SZMIGIEL D., PAWLOWSKI M.L.K.:<br />
Projekt i realizacja mikrocieczowego czujnika kapilarnego opartego<br />
na przestrzennej strukturze krzemowej z wykorzystaniem włókien<br />
światłowodowych<br />
<strong>Elektronika</strong> (LIII), nr 1/<strong>2<strong>01</strong>2</strong>, s. 28<br />
W artykule przedstawiono projekt i omówiono realizację optycznego mikrocieczowego<br />
czujnika kapilarnego, przeznaczonego do badań cieczy chemicznych<br />
i biologicznych. Zasada ich działania oparta jest na wykorzystaniu<br />
zmian sygnału świetlnego przechodzącego przez kapilarę wypełnioną<br />
badaną cieczą. Sygnały optyczne wychodzące z czujnika są przetwarzane<br />
w obwodach optoelektronicznych i przekazywane do komputera. Przy<br />
analizowaniu sygnałów wykorzystywane są sztuczne sieci neuronowe. Dla<br />
poprawienia dokładności pomiarowej, czujnik pracuje w układzie wieloparametrycznym,<br />
rejestrując informacje o podstawowych parametrach cieczy.<br />
Główną zaletą tych czujników jest mała ilość cieczy potrzebnej do badań<br />
i krótki czas pomiaru Optoelektroniczne czujniki kapilarne znajdują zastosowanie<br />
w biotechnologii, diagnostyce medycznej, w wykrywaczach narkotyków<br />
oraz w badaniach właściwości użytkowych biopaliw.<br />
Słowa kluczowe: kapilara optyczna, czujnik mikrocieczowy, czujnik inteligentny,<br />
technologia mikrosystemów, czujnik światłowodowy, czujnik zintegrowany<br />
<br />
GELMUDA W., KOS A.: Device for road holes and obstacles detection<br />
<strong>Elektronika</strong> (LIII), no 1/<strong>2<strong>01</strong>2</strong>, p. 19<br />
At the beginning of the 21 st century the world still deals with some of<br />
people’s disabilities. Although there are many prostheses and special<br />
devices, some problems of disabled people are still unsolved. There are<br />
millions of visually impaired people around the world. Almost every blind<br />
person has to cope with everyday life activities only with the aid of a white<br />
stick. To help the blind people navigate and avoid obstacles and holes,<br />
a device is to be designed as a part of the MOBIAN© project, which is<br />
being carried out by the authors. The holes detection is one of a rather<br />
difficult kind of obstacles to be detected when a blind person is moving.<br />
This detection will employ an infrared ranging which is hard to debug in<br />
a real-time environment. That is why a simulator is highly required. The<br />
obstacles detection will employ an array of ultrasonic sensors to increase<br />
sensing area width. Td.<br />
Keywords: ultrasonic, infrared, sensors, blind people, obstacles, holes<br />
detection, simulator<br />
GWIŻDŻ P., BRUDNIK A., ZAKRZEWSKA K.: Metal – oxide sensor array<br />
for gas detection<br />
<strong>Elektronika</strong> (LIII), no 1/<strong>2<strong>01</strong>2</strong>, p. 22<br />
The aim of this work was to design and construct an array of resistive-type<br />
semiconducting sensors dedicated to detection of gas mixture components.<br />
The array comprises six commercial metal oxide gas sensors placed<br />
in the measuring chamber. Humidity and temperature measurements<br />
are provided by the relevant sensors. Electronic system supporting the<br />
array is based on ARM core microcontrollers and CAN bus architecture<br />
what makes it flexible and easy to reconfigure in respect to the number of<br />
sensors. Each sensor can operate at different temperatures by changing<br />
a heater supply voltage. The designed and constructed gas detection system<br />
has been tested for hydrogen H 2<br />
, ammonia NH 3<br />
and carbon dioxide<br />
CO 2<br />
detection.<br />
Keywords: gas sensors, microcontrollers<br />
KLIMIEC E., ZARASKA W., KUCZYŃSKI SZ.:Dynamic research of foot<br />
pressure distribution – the four-points shoe insert with PVDF sensors<br />
<strong>Elektronika</strong> (LIII), no 1/<strong>2<strong>01</strong>2</strong>, p. 25<br />
The man’s movement possibilities depend on foot deformation. It can<br />
be estimated by foot pressure distribution investigations. Healthy foot<br />
is arched on internal side, what acts like shock absorber, softening jolts<br />
caused by walking. Largest values of pressure appear on heel and metatarsus.<br />
Insignificant values appears on medial arch, and its growth shows<br />
the foot extent deformation eg. flatfoot. Article presents measurement<br />
method of foot pressure on the ground by four-points shoe insole, developed<br />
by authors, which can be placed in any sport footwear. The value of<br />
pressure was measured on heel, medial arch, metatarsus and hallux by<br />
recording values of generated voltage on sensors which were made of<br />
piezoelectric polymer PVDF thin film. Load resistance of measuring setup<br />
was 10 14 Ω. Under the influence of mechanical strain, the sensor, which<br />
is made from piezoelectric polymer film with electrodes, acts like a selfcharging<br />
capacitor. To conduct correct measurements, it is important to<br />
use restart circuit. Restart circuit ensures recovery to starting point after<br />
execution of each step, what prevents charge accumulation in capacitor<br />
and measurement results distortion.<br />
Keywords: pressure sensors, PVDF, faulty posture<br />
SZCZEPAŃSKI Z., BORECKI M., SZMIGIEL D., PAWLOWSKI M.L.K.:<br />
Design and realization of a microfluidic capillary sensor based on<br />
a silicon structure and disposable optrodes<br />
<strong>Elektronika</strong> (LIII), no 1/<strong>2<strong>01</strong>2</strong>, p. 28<br />
In this paper a new design and technology of microfluidic capillary sensors<br />
is presented. Those sensors can be applied for in situ classification of biological<br />
and chemical liquids. The principle of work of capillary sensors is<br />
based on changes of light transmission within capillary filled the liquid subject<br />
to a local heating pulse. An example of its application can be instant<br />
determining of biofuel usability at a filling station. The main advantages of<br />
microfluidic capillary sensors are the small sample volume of about 3 mm 3<br />
and a short time of examination, below 2 minutes. The microfluidic capillary<br />
sensor head has been designed as a 3D hybrid structure working in<br />
conjunction with disposable optical capillary optrodes. The hybrid structure<br />
consists of ceramic base (DBC) and a silicon substrate. The silicon substrate<br />
is fabricated using MEMS micromachining processes.<br />
Keywords: optical capillary, microfluidic sensor, intelligent sensor, microsystem<br />
technology, fiber optic sensors, capillary sensor, MEMS sensors<br />
<strong>Elektronika</strong> 1/<strong>2<strong>01</strong>2</strong>
Streszczenia artykułów ● Summaries of the articles<br />
DZIURDZIA P., LICHOTA K.: Kompaktowy termoelektryczny generator<br />
do pozyskiwania i przetwarzania ciepła odpadowego na energię<br />
elektryczną<br />
<strong>Elektronika</strong> (LIII), nr 1/<strong>2<strong>01</strong>2</strong>, s. 30<br />
A artykule przedstawiono kompaktowy generator termoelektryczny składający<br />
się z modułu Peltiera, radiatora, przetwornika ultra niskiego napięcia,<br />
mikrokontrolera oraz czujnika. W artykule zawarto opis konstrukcji mechanicznej<br />
generatora oraz części elektronicznej wraz z układem do zarządzania<br />
mocą. W pracy przedstawiono wyniki testów oraz pomiarów uzyskanych<br />
poziomów mocy oraz napięć w funkcji gradientów temperatury. Na końcu<br />
zamieszczono analizę na temat możliwych zastosowań zaprojektowanego<br />
termogeneratora do zasilania węzłów sieci bezprzewodowych.<br />
Słowa kluczowe: pozyskiwanie energii środowiska, generator termoelektryczny,<br />
przetwarzanie energii cieplnej<br />
DZIURDZIA P., LICHOTA K.: A compact thermoelectric harvester for<br />
waste heat conversion<br />
<strong>Elektronika</strong> (LIII), no 1/<strong>2<strong>01</strong>2</strong>, p. 30<br />
In the paper a compact thermoelectric harvester that consists of a Peltier<br />
module, a small heat sink, an ultra low voltage converter, a microcontroller<br />
(µC) and a sensor is presented. A detailed description of the mechanical<br />
and electronic circuits design for power management is also shown. Results<br />
of tests and measurements of obtained voltage and electrical power<br />
levels against temperature gradients are presented and analyzed. A study<br />
on possible application of the designed thermogenerators to supplying<br />
with electrical power wireless sensor nodes is also provided.<br />
Keywords: energy harvesting, thermoelectric generator, heat conversion<br />
SITEK J., FUTERA K., BELAVIČ D., SANTO ZARNIK M., KOŚCIELSKI<br />
M., BUKAT K., JANECZEK K., KUŠČER HROVATIN D., JAKUBOWSKA<br />
M.: Badanie jakości ścieżek przewodzących wytworzonych metodą<br />
druku strumieniowego na różnych podłożach<br />
<strong>Elektronika</strong> (LIII), nr 1/<strong>2<strong>01</strong>2</strong>, s. 32<br />
W artykule przedstawiono badania jakości ścieżek przewodzących wytworzonych<br />
metodą druku strumieniowego na różnych podłożach. W badaniach<br />
użyto trzech różnych typów podłoży ceramicznych oraz tuszu<br />
opartego na nanoproszku srebra. Stwierdzono, że wytwarzanie ścieżek<br />
przewodzących, poprzez ich nadruk na podłoże z surowej taśmy ceramicznej<br />
LTCC i następnie ich wypalenie z użyciem profilu stosowanego<br />
dla LTCC jest nietechnologiczne. Bardziej obiecujące wyniki uzyskano dla<br />
wstępnie wypalonego podłoża LTCC oraz podłoża z ceramiki alundowej.<br />
Konieczne są jednak dalsze prace celem polepszenia jakości ścieżek na<br />
tych podłożach.<br />
Słowa kluczowe: druk strumieniowy, ścieżki przewodzące, technologia<br />
grubowarstwowa<br />
SITEK J., FUTERA K., BELAVIČ D., SANTO ZARNIK M., KOŚCIELSKI<br />
M., BUKAT K., JANECZEK K., KUŠČER HROVATIN D., JAKUBOWSKA<br />
M.: An investigation of the quality of the conductive lines deposited<br />
by inkjet printing on different substrates<br />
<strong>Elektronika</strong> (LIII), no 1/<strong>2<strong>01</strong>2</strong>, p. 32<br />
In this paper an investigation of the quality of inkjet-printed conductive<br />
lines deposited on different substrates is presented. Three different types<br />
of ceramic substrates as well as an ink based on nanosilver powder were<br />
used for investigations. It was found that the inkjet-printing deposition on<br />
green tape LTCC and then co-firing with the conditions of an LTCC temperature<br />
profile is not a usable technology. More promising results on prefired<br />
LTCC and alumina substrates were obtained, but some additional<br />
efforts are required to improve the quality of the lines.<br />
Keywords: inkjet printing, conductive lines, thick-film technology<br />
NOWAK D., JANIAK M., DZIEDZIC A., PIASECKI T.: Wysokotemperaturowe<br />
właściwości elementów grubowarstwowych i LTCC<br />
<strong>Elektronika</strong> (LIII), nr 1/<strong>2<strong>01</strong>2</strong>, s. 35<br />
Od ponad dziesięciu lat obserwuje się rosnące zainteresowanie w obszarze<br />
elektroniki wysokotemperaturowej. Rozwój materiałów półprzewodnikowych<br />
z szeroką przerwą energetyczną (węglik krzemu, azotek galu) umożliwił wytworzenie<br />
nowej klasy przyrządów pracujących w trudnych warunkach środowiska,<br />
również w wysokiej temperaturze. Wymusza to potrzebę rozwoju<br />
elementów biernych, które wspólnie umożliwią wykonanie w pełni funkcjonalnych<br />
układów elektronicznych. Technologie grubowarstwowa i niskotemperaturowej<br />
ceramiki współwypalnej (LTCC) są powszechnie stosowane<br />
do produkcji różnorodnych elementów pasywnych. Wysoka odporność<br />
temperaturowa materiałów ceramicznych w szczególny sposób kwalifikuje<br />
je do zastosowań w podwyższonej temperaturze. W pracy przedstawiono<br />
charakteryzację elementów grubowarstwowych i LTCC pracujących w temperaturze<br />
do 500°C.<br />
Słowa kluczowe: elementy bierne, technologia grubowarstwowa, niskotemperaturowa<br />
ceramika współwypalana, właściwości elektryczne<br />
NOWAK D., JANIAK M., DZIEDZIC A., PIASECKI T.: High temperature<br />
properties of thick-film and LTCC components<br />
<strong>Elektronika</strong> (LIII), no 1/<strong>2<strong>01</strong>2</strong>, p. 35<br />
For the last ten years there has been observed an increasing interest in<br />
the field of high temperature electronics. The development of engineering<br />
of wide-bandgap semiconductors (SiC, GaN) has brought new class of<br />
electronic devices that can work in harsh environment involving high temperature.<br />
This fact imposes development of passive components to enable<br />
manufacturing of fully functional devices. Low temperature co-fired ceramics<br />
(LTCC) and thick-film technologies are well-established techniques of<br />
fabrication different types of passive components. High thermal resistance<br />
of used materials predestines them for high temperature applications. This<br />
paper deals with characterization of LTCC and thick-film passives operating<br />
at temperature up to 500°C.<br />
Keywords: passive components, thick-film, LTCC, electrical properties<br />
CZOK M., MALECHA K., GOLONKA L.: Mikroprzepływowy fluorescencyjny<br />
czujnik ceramiczny wykonany techniką LTCC<br />
<strong>Elektronika</strong> (LIII), nr 1/<strong>2<strong>01</strong>2</strong>, s. 37<br />
W artykule opisano proces wytwarzania mikroprzepływowego czujnika<br />
fluorescencyjnego, w technologii nisktotemperaturowej ceramiki współwypalanej<br />
LTCC (Low Temperature Co-fired Ceramics Technology). Wykonany<br />
czujnik składa się z łatwo dostępnych i niedrogich elementów elektronicznych,<br />
a także z polimerowych światłowodów PMMA (polimetakrylan<br />
metylu). Pracę mikroprzepływowego czujnika ceramicznego zbadano za<br />
pomocą barwnika fluorescencyjnego. W tym celu przygotowano pięć różnych<br />
stężeń fluoresceiny w etanolu. Roztwory testowe pobudzano źródłem<br />
promieniowania, o długości fali równej 465 nm, a następnie mierzono<br />
(dwoma fotodetektorami) natężenie wyemitowanej wiązki światła. Przeprowadzone<br />
badania wykazały, że możliwa jest detekcja sygnału fluorescencyjnego,<br />
wewnątrz mikroprzepływowego czujnika ceramicznego, za<br />
pomocą powszechnie dostępnych elementów optoelektronicznych.<br />
Słowa kluczowe: mikroprzepływowy, fluorescencja, Lab-on-Chip, LTCC<br />
CZOK M., MALECHA K., GOLONKA L.: LTCC microfluidic chip with<br />
fluorescence based detection<br />
<strong>Elektronika</strong> (LIII), no 1/<strong>2<strong>01</strong>2</strong>, p. 37<br />
This paper presents development and manufacturing processes of the<br />
fluorescence based microfluidic chip using Low Temperature Co-fired Ceramics<br />
technology (LTCC). The LTCC material was chosen because of<br />
its outstanding physical and chemical properties. Moreover, there is a possibility<br />
to integrate electronic and optoelectronic components into single<br />
LTCC microfluidic chip. The manufactured microfluidic chip consists of<br />
inexpensive and commonly available electronic components and PMMA<br />
(poly(methyl methacrylate)) optic fibres. Its performance is investigated<br />
with a fluorescent dye. Five different fluorescein solutions are excited with<br />
465 nm light source, and then the intensity of the emitted fluorescent light<br />
is measured with two photodetectors. The performed experiments have<br />
shown that it is possible to detect fluorescent signal inside the LTCC microfluidic<br />
chip using commonly available optoelectronic components.<br />
Keywords: microfluidic, fluorescence, Lab-on-Chip, LTCC<br />
<strong>Elektronika</strong> 1/<strong>2<strong>01</strong>2</strong>
Streszczenia artykułów ● Summaries of the articles<br />
MROCZKOWSKI M., CIEŻ M., KALENIK J.: Badanie powtarzanych<br />
cykli degradacji i regeneracji grubowarstwowych struktur elektroluminescencyjnych<br />
<strong>Elektronika</strong> (LIII), nr 1/<strong>2<strong>01</strong>2</strong>, s. 39<br />
W ramach badań podjęto próbę wykonania wielokrotnej regeneracji zdegradowanych<br />
struktur elektroluminescencyjnych. Do tego celu został przygotowany<br />
zestaw testowych grubowarstwowych źródeł światła. Najpierw<br />
te źródła światła zostały zdegradowane przez starzenie przy zasilaniu napięciem<br />
prostokątnym. Następnie próbki wygrzano celem ich regeneracji.<br />
Taki cykl degradacji i regeneracji został wykonany dwukrotnie. Zmierzono<br />
wybrane parametry badanych struktur. Pomiary zostały wykonane po<br />
przygotowaniu próbek, po ich degradacji i po regeneracji.<br />
Zmierzono luminancję struktur zasilanych napięciem prostokątnym o różnej<br />
częstotliwości. W celu określenia wpływu zmian w warstwie izolacyjnej<br />
na luminancję struktury, zamierzono pojemność próbek. Dodatkowo, podjęto<br />
próbę określenia wpływu degradacji i regeneracji na widmo emisyjne<br />
elektroluminescencyjnych struktur grubowarstwowych.<br />
Słowa kluczowe: ZnS, elektroluminescencja wewnętrzna, struktury elektroluminescencyjne,<br />
ACEL, warstwy grube<br />
MROCZKOWSKI M., CIEŻ M., KALENIK J.: Investigation of multiple<br />
degradation and rejuvenation cycles of electroluminescent thick film<br />
structures<br />
<strong>Elektronika</strong> (LIII), no 1/<strong>2<strong>01</strong>2</strong>, p. 39<br />
An attempt to investigate the possibility of repeated rejuvenation of degraded<br />
electroluminescent (EL) lamps was undertaken. A set of samples<br />
of EL lamps with ZnS:Cu phosphor was fabricated. First, each of these<br />
samples worked for a period of time, driven by square voltage. After this<br />
process of degradation, samples were annealed in order to rejuvenate<br />
them. Such cycles of degradation and rejuvenation were repeated twice.<br />
Several parameters of investigated structures were estimated. Measurements<br />
were performed after fabrication of test samples, after degradation<br />
and after annealing. Luminance of EL lamps driven by voltage of different<br />
value of frequency was measured. Capacitance of these samples was measured<br />
to estimate the influence of changes in insulator layer of EL lamps<br />
on changes of luminance. Also an attempt to investigate the influence of<br />
degradation and rejuvenation on emission spectrum of electroluminescent<br />
thick film structures was undertaken.<br />
Keywords: ZnS, AC electroluminescence, EL lamps, ACEL, thick films<br />
STĘPLEWSKI W., SERZYSKO T., KOZIOŁ G., JANECZEK K., DZIE-<br />
DZIC A.: Badania podzespołów biernych wbudowanych w płytki obwodów<br />
drukowanych<br />
<strong>Elektronika</strong> (LIII), nr 1/<strong>2<strong>01</strong>2</strong>, s. 41<br />
W artykule przedstawiono wyniki badań podzespołów biernych wbudowanych<br />
w płytkę odwodu drukowanego. Rezystory cienkowarstwowe zostały<br />
wykonane ze stopu Ni-P nałożonego na folię miedzianą laminatu FR4<br />
(technologia OhmegaPly ® ), rezystory grubowarstwowe zostały wykonane<br />
metodą druku sitowego z rezystywnej pasty węglowej (Electra ® ED7100)<br />
i węglowo-srebrowej (Electra ® ED7500) a kondensatory wykonano z ultra<br />
cienkiego laminatu (dielektryk foliowany obustronnie miedzią – Farad-<br />
Flex ® ). Wykorzystano również materiał nowej generacji złożony z warstwy<br />
pojemnościowej i rezystywnej (Ohmega/FaradFlex). Materiały te zostały<br />
wbudowane pomiędzy warstwami PCB bez zwiększenia jej grubości.<br />
Słowa kluczowe: rezystor cienkowarstwowy, rezystor grubowarstwowy, pojemność<br />
zagrzebana, płytka obwodu drukowanego, podzespoły wbudowane<br />
STĘPLEWSKI W., SERZYSKO T., KOZIOŁ G., JANECZEK K., DZIE-<br />
DZIC A.: Investigations of passive components embedded in printed<br />
circuit boards<br />
<strong>Elektronika</strong> (LIII), no 1/<strong>2<strong>01</strong>2</strong>, p. 41<br />
In this article the results of embedded passive components investigations<br />
are presented. Thin-film resistors were made with NiP metal alloy on copper<br />
foiled FR4 laminate (OhmegaPly ® technology), thick-film resistors<br />
were printed with carbon (Electra ® ED7100) and carbon-silver (Electra ®<br />
ED7500) inks and capacitors were manufactured with ultra-thin laminate<br />
(FaradFlex ® ). A material of a new generation being a composite of capacitance<br />
and resistance layer (Ohmega/FaradFlex) was also used. These<br />
materials were embedded between layers of the PCB without increase of<br />
its thickness.<br />
Keywords: thin-film resistor, thick-film resistor, buried capacitance, printed<br />
circuit board, embedded passives<br />
O’FLYNN B., BOYLE D., POPOVICI E., MAGNO M., PETRIOLI C.: GE-<br />
NESI: Bezprzewodowa sieć sensorów do monitorowania strukturalnego<br />
<strong>Elektronika</strong> (LIII), nr 1/<strong>2<strong>01</strong>2</strong>, s. 46<br />
Ambitnym celem projektu GENESI jest podniesienie technologii bezprzewodowej<br />
sieci czujników na poziom, na którym będzie ona mogła stać<br />
się rdzeniem następnej generacji systemów dla strukturalnego monitorowania<br />
zdrowia, długowiecznych, wszechobecnych, totalnie rozproszonych<br />
i autonomicznych. Ten cel wymaga podjęcia inżynierskich i naukowych<br />
wyzwań, którym nigdy dotąd nie stawiano czoła. Węzły sensorowe będą<br />
przeprojektowane w celu przełamania bieżących ograniczeń, zwłaszcza<br />
pod względem przechowywania i dostarczania energii (potrzebujemy<br />
urządzeń o wirtualnie nieskończonym czasie życia), odporności na uszkodzenia<br />
i interferencje (dla niezawodnej i krzepkiej pracy). Zdefiniowany zostanie<br />
nowy softwer i protokoły aby w pełni wykorzystać możliwości nowego<br />
hardweru, dostarczając nowe paradygmaty dla wewnątrzwarstwowej<br />
interakcji na wszystkich warstwach stosu protokołu spełniając wymagania<br />
nowej koncepcji jakości obsługi, zorientowanej na aplikacje, wiernie odzwierciedlającej<br />
punkt widzenia i oczekiwania końcowego użytkownika.<br />
W ramach projektu GENESI zostaną opracowane długowieczne węzły sensorowe<br />
drogą połączenia nowatorskich technologii pozyskiwania energii ze<br />
środowiska i zielonych źródeł energii (ogniwa paliwowe o małych wymiarach);<br />
w projekcie GENESI zostaną zdefiniowane modele pozyskiwania<br />
energii, przechowywania energii w super-kondensatorach i dostępności<br />
dodatkowej energii za pomocą ogniw paliwowych, jako dodatek do opracowania<br />
nowych algorytmów i protokołów dynamicznej alokacji zadań pomiarowych<br />
i komunikacyjnych. Zespół projektowy opracuje protokoły komunikacyjne<br />
dla wielkoformatowych heterogenicznych bezprzewodowych sieci<br />
sensorowych posiadających zdolność pozyskiwania energii i zdefiniuje rozproszone<br />
mechanizmy dla oceny kontekstowej i świadomości sytuacyjnej.<br />
W artykule zaprezentowano analizę wymagań dla systemu GENESI sformułowanych<br />
w celu osiągnięcia ambitnych celów projektu. Wychodząc<br />
od prezentowanych wymagań, przedyskutowano kształtujące się specyfikacje<br />
systemu względem jego wybranych elementów. Wynikowy system<br />
będzie oceniany i charakteryzowany w celu sprawdzenia czy jest zdolny<br />
spełnić wymagania funkcjonalne projektu.<br />
Słowa kluczowe: strukturalne monitorowanie zdrowia, zielone bezprzewodowe<br />
sieci sensorowe, źródła energii odnawialnej<br />
O’FLYNN B., BOYLE D., POPOVICI E., MAGNO M., PETRIOLI C.: GE-<br />
NESI: Wireless Sensor Networks for structural monitoring<br />
<strong>Elektronika</strong> (LIII), no 1/<strong>2<strong>01</strong>2</strong>, p. 46<br />
The GENESI project has the ambitious goal of bringing WSN technology<br />
to the level where it can provide the core of the next generation of systems<br />
for structural health monitoring that are long lasting, pervasive and totally<br />
distributed and autonomous. This goal requires embracing engineering<br />
and scientific challenges never successfully tackled before. Sensor nodes<br />
will be redesigned to overcome their current limitations, especially concerning<br />
energy storage and provisioning (we need devices with virtually<br />
infinite lifetime) and resilience to faults and interferences (for reliability and<br />
robustness). New software and protocols will be defined to fully take advantage<br />
of the new hardware, providing new paradigms for cross-layer interaction<br />
at all layers of the protocol stack and satisfying the requirements<br />
of a new concept of Quality of Service (QoS) that is application-driven,<br />
truly reflecting the end user perspective and expectations.<br />
The GENESI project will develop long lasting sensor nodes by combining<br />
cutting edge technologies for energy generation from the environment<br />
(energy harvesting) and green energy supply (small form factor fuel cells);<br />
GENESI will define models for energy harvesting, energy conservation in<br />
super-capacitors and supplemental energy availability through fuel cells,<br />
in addition to the design of new algorithms and protocols for dynamic allocation<br />
of sensing and communication tasks to the sensors. The project<br />
team will design communication protocols for large scale heterogeneous<br />
wireless sensor/actuator networks with energy-harvesting capabilities and<br />
define distributed mechanisms for context assessment and situation awareness.<br />
This paper presents an analysis of the GENESI system requirements in<br />
order to achieve the ambitious goals of the project. Extending from the<br />
requirements presented, the emergent system specification is discussed<br />
with respect to the selection and integration of relevant system components.The<br />
resulting integrated system will be evaluated and characterised<br />
to ensure that it is capable of satisfying the functional requirements of the<br />
project.<br />
Keywords: Structural Health Monitoring, Green Wireless Sensor Networks,<br />
Green Energy Sources<br />
<br />
<strong>Elektronika</strong> 1/<strong>2<strong>01</strong>2</strong>
Streszczenia artykułów ● Summaries of the articles<br />
KISIEL R., SZCZEPAŃSKI Z., FIREK P., GUZIEWICZ M., KRAJEWSKI<br />
A.: Mechaniczne oraz cieplne właściwości połączenia między strukturą<br />
SiC a podłożem ceramicznym<br />
<strong>Elektronika</strong> (LIII), nr 1/<strong>2<strong>01</strong>2</strong>, s. 48<br />
W artykule zaprezentowano proces realizacji montażu struktur SiC do<br />
podłoży DBC (ceramiki alundowej dwustronnie pokrytej warstwą Cu o grubości<br />
200 µm) przy zastosowaniu niskotemperaturowego zgrzewania mikroproszkiem<br />
Ag. W badaniach wstępnych, zamiast struktur SiC zastosowano<br />
struktury DBC o wymiarach 3 × 3 mm montowane do podłoża DBC<br />
10 × 10 mm (obie łączone części miały metalizację Au). W montażu wykorzystano<br />
mikroproszki Ag, a łączenie wykonywano przez: wygrzewanie w powietrzu<br />
pod naciskiem oraz przez wygrzewanie w próżni pod naciskiem. W obu<br />
metodach uzyskano dobrą adhezję tuż po łączeniu (z zakresu 8…10 MPa).<br />
Przeprowadzone próby starzeniowe w temperaturze 350°C wskazały, że adhezja<br />
próbek łączonych w powietrzu dramatycznie spada po 24 godzinach<br />
wygrzewania. Natomiast adhezja próbek łączonych pod naciskiem w próżni<br />
1,3 Pa w temperaturach z zakresu 500…550°C po procesach starzeniowych<br />
w temperaturze 350°C przez kilkaset godzin jest dobra (powyżej 10 MPa).<br />
Słowa kluczowe: technologie montażu i hermetyzacji, montaż struktur<br />
SiC, zgrzewanie niskotemperaturowe, mikroproszki Ag<br />
KŁOSSOWICZ A., DZIEDZIC A., WINIARSKI P., STĘPLEWSKI W., KO-<br />
ZIOŁ G.: Analiza odporności impulsowej grubo- i cienkowarstwowych<br />
rezystorów wbudowanych w płytki obwodów drukowanych<br />
<strong>Elektronika</strong> (LIII), nr 1/<strong>2<strong>01</strong>2</strong>, s. 51<br />
Elementy bierne (rezystory, kondensatory, cewki) wbudowane w płytki obwodów<br />
drukowanych (PCB) mogą polepszyć właściwości oraz niezawodność<br />
układów elektronicznych. Stabilność impulsowa jest ważnym parametrem<br />
zarówno elementów biernych jak i urządzeń aktywnych. W przypadku rezystorów<br />
pozwala ona określić szereg właściwości takich jak np. maksymalna<br />
moc rozproszona, zmiana rezystancji lub zjawiska występujące wewnątrz<br />
struktury rezystora po przepłynięciu impulsu wysokonapięciowego. Co więcej<br />
odporność impulsowa określa użyteczność rezystora w obwodach pracujących<br />
impulsowo. Dlatego też w artykule przedstawiono wyniki badań odporności<br />
impulsowej cienkowarstwowych i polimerowych grubowarstwowych rezystorów<br />
utworzonych na powierzchni bądź wbudowanych w płytki obwodów<br />
drukowanych. Badane struktury zostały wytworzone z stopu fosforku niklu<br />
(Ni-P) lub polimerowej pasty rezystywnej na laminacie FR-4 o podobnych<br />
wartościach rezystancji powierzchniowej (25 Ω/kw lub 100 Ω/kw dla stopu<br />
Ni-P oraz 20 Ω/kw lub 200 Ω/kw dla polimerowych past rezystywnych). Odporność<br />
impulsowa została określona na podstawie wyznaczonych parametrów:<br />
maksymalnego nieniszczącego pola elektrycznego, maksymalnej nieniszczącej<br />
powierzchniowej gęstości mocy oraz maksymalnej nieniszczącej<br />
objętościowej gęstości mocy. Parametry te zostały ustalone oraz porównane<br />
dla obu rodzajów rezystorów w zależności od czasu trwania impulsu, geometrii<br />
rezystora (długości, szerokości, współczynnika proporcji), rezystancji<br />
powierzchniowej, rodzaju materiału zastosowanego między warstwą rezystywną<br />
a jej kontaktem oraz rodzajem pokrycia. Na podstawie otrzymanych<br />
wyników przeprowadzonych badań przeanalizowano podobieństwa i różnice<br />
w odporności impulsowej dla obu rodzajów rezystorów.<br />
Słowa kluczowe: płytki obwodów drukowanych, rezystory wbudowane,<br />
odporność impulsowa, fosforek niklu, cienkowarstwowe, grubowarstwowe<br />
WINIARSKI P., DZIEDZIC A., KŁOSSOWSKI A., STĘPLEWSKI W., KO-<br />
ZIOŁ G.: Analiza stabilności długoczasowejrezystorów cienkowarstwowych<br />
oraz polimerowych rezystorów grubowarstwowych wbudowanych<br />
w płytkiobwodów drukowanych<br />
<strong>Elektronika</strong> (LIII), nr 1/<strong>2<strong>01</strong>2</strong>, s. 55<br />
W pracy przedstawiono wyniki badań stabilności długoczasowej rezystorów<br />
cienkowarstwowych oraz polimerowych rezystorów grubowarstwowych<br />
wykonanych na powierzchni lub wbudowanych w płytki obwodów<br />
drukowanych (PCB). Badane struktury testowe zostały wykonane ze<br />
stopu fosforku niklu (Ni-P) lub grubowarstwowych past polimerowych na<br />
podłożu FR-4, z podobnymi rezystancjami powierzchniowymi (25 Ω/kw lub<br />
100 Ω/kw dla stopów Ni-P oraz 20 Ω/kw, 200 Ω/kw lub 5 kΩ/kw dla grubowarstwowych<br />
past polimerowych), lecz zdecydowanie różnej grubości<br />
warstw rezystywnych – 0.1 lub 0.4 μm dla stopów Ni-P oraz około 10…12<br />
μm dla polimerowych warstw rezystywnych. Część próbek z rezystorami<br />
Ni-P pokryto dwoma typami warstwy ochronnej – laminatem RCC (Resin<br />
Coated Copper) lub preimpregnatem LDP (Laser Drillable Prepreg). Grubowarstwowe<br />
rezystory polimerowe zostały nadrukowane na kontaktach<br />
Cu lub Cu z powłoką Ni/Au oraz zostały pokryte warstwą laminatu RCC.<br />
Aby przeprowadzić analizę zachowania długoczasowego elementów wykorzystano<br />
metodę procesu przyśpieszonego starzenia oraz pomiarów<br />
In-Situ (pomiar rezystancji w warunkach narażeń).Wyniki wykazały zupełnie<br />
inne zachowanie się obu grup rezystorów. W przypadku rezystorów<br />
cienkowarstwowych Ni-P geometria niemal nie wpływa na stabilność<br />
długoczasową. Jednak znaczny wpływ na zachowanie się rezystorów był<br />
związany z rezystancją powierzchniową, typem pokrycia oraz temperaturą<br />
<strong>Elektronika</strong> 1/<strong>2<strong>01</strong>2</strong><br />
KISIEL R., SZCZEPAŃSKI Z., FIREK P., GUZIEWICZ M., KRAJEWSKI<br />
A.: Mechanical and thermal properties of SiC – ceramics substrate<br />
interface<br />
<strong>Elektronika</strong> (LIII), no 1/<strong>2<strong>01</strong>2</strong>, p. 48<br />
In this paper, we present the realization of assembly of SiC samples to<br />
DBC substrate (Direct Bonding Copper Substrate with 200 µm Cu metallization<br />
Au covered) by low-temperature sintering of micro scale Ag powder.<br />
In the preliminary experiments DBC test samples size 3 × 3 mm (in place<br />
of SiC die) were assembled to DBC substrate size 10 × 10 mm using following<br />
methods: a) sintering by Ag powder with Ag microparticles in air by<br />
applying temperature and pressure, b) sintering by Ag powder with Ag microparticles<br />
using temperature, pressure and high vacuum. Methods „a” and<br />
„b” permit to obtain very good adhesion range 8…10 MPa after sintering.<br />
However after ageing test at temperature 350°C in air the adhesion fall<br />
down dramatically. By increasing sintering temperature up to 500…550°C<br />
and sintering in vacuum range 1.3 Pa the adhesion is satisfactory. The<br />
results of these experiments will be presented in paper.<br />
Keywords: packaging technology, SiC die bonding, low temperature sintering,<br />
silver microparticles<br />
KŁOSSOWICZ A., DZIEDZIC A., WINIARSKI P., STĘPLEWSKI W.,<br />
KOZIOŁ G.: Analysis of pulse durability of thin-film and polymer<br />
thick-film resistors embedded in printed circuit boards<br />
<strong>Elektronika</strong> (LIII), no 1/<strong>2<strong>01</strong>2</strong>, p. 51<br />
The passives (resistors, capacitors, inductors) embedded in printed circuit<br />
boards (PCBs) can improve electrical properties and reliability of electronic<br />
systems. Pulse durability is an important parameter of passive components<br />
and active devices. In the case of resistors it allows to determine<br />
many properties including maximum power dissipation, resistance change<br />
or phenomena occurring in resistor structures after pulse surging. Furthermore<br />
pulse durability defines utility for pulse circuits. Thus this work<br />
presents pulse durability of thin-film and polymer thick-film resistors made<br />
on the surface or embedded in Printed Circuit Boards (PCBs). Investigated<br />
test structures were made of nickel–phosphorus (Ni-P) alloy or polymer<br />
thick-film resistive inks on FR-4 laminate with similar sheet resistance (25<br />
Ω/sq or 100 Ω/sq for Ni-P alloys and 20 Ω/sq or 200 Ω/sq for polymer<br />
thick-film inks). Pulse durability was determined by calculating the maximum<br />
nondestructive electric field, maximum nondestructive surface power<br />
density or maximum nondestructive volume power density. These parameters<br />
were determined and compared for both kind of resistors in dependence<br />
on pulse duration, resistor geometry (length, width, aspect ratio),<br />
sheet resistance, interface between resistive film and termination material,<br />
type of cladding. Based on experimental results the similarities and dissimilarities<br />
in pulse durability of both group of resistors were analyzed.<br />
Keywords: printed circuit board, embedded resistor, pulse durability, nickel-phosphorous,<br />
thin film, thick film<br />
WINIARSKI P., DZIEDZIC A., KŁOSSOWSKI A., STĘPLEWSKI W.,<br />
KOZIOŁ G.: Analysis of long-term stability of thin-film and polymer<br />
thick-film resistors embedded in Printed Circuit Boards<br />
<strong>Elektronika</strong> (LIII), no 1/<strong>2<strong>01</strong>2</strong>, p. 55<br />
This work presents long-term stability of thin-film and polymer thick-film<br />
resistors made on the surface or embedded in Printed Circuit Boards<br />
(PCBs). Investigated test structures were made of nickel–phosphorus (Ni-<br />
P) alloy or polymer thick-film resistive inks on FR-4 laminate with similar<br />
sheet resistance (25 Ω/sq or 100 Ω/sq for Ni-P alloys and 20 Ω/sq, 200 Ω/<br />
sq or 5 kΩ/sq for polymer thick-film inks) but decidedly different thickness<br />
of resistive layers - 0.1 or 0.4 μm thick Ni-P alloy and about 10…12 μm<br />
for polymer resistive films). Part of the Ni-P samples was covered with<br />
two different coatings – Resin Coated Copper (RCC) or Laser Drillable<br />
Prepreg (LDP). Polymer thick-film resistors were printed on Cu contacts or<br />
Cu contacts with Ni/Au coating and were covered by RCC film. The In-Situ<br />
accelerated ageing process (resistance of test samples performed directly<br />
at the ageing conditions) was carried out to perform long-term behaviour<br />
analysis. The results showed quite different behaviour of both group of<br />
resistors. In case of Ni-P thin-film resistors resistor geometry almost not<br />
affect long-term stability. However a significant influence on the behaviour<br />
of resistors was due to sheet resistance, type of encapsulation and ageing<br />
temperature. Measurement results revealed the square-root-of-time<br />
dependence of the resistance changes, which represent a single ageing<br />
mechanism. In temperature domain resistance drift can be described by<br />
the Arrhenius equation. The extrapolation of these results could be used to<br />
predict behaviour of resistors in various temperature and times of ageing.
Streszczenia artykułów ● Summaries of the articles<br />
starzenia. Wyniki pomiarów ujawniłyiżzmiany rezystancji są proporcjonalne<br />
do pierwiastka czasu, co prezentuje pojedynczy mechanizm starzenia.W<br />
dziedzinie czasu zmiany rezystancji mogą być opisane równaniem<br />
Arrheniusa, ekstrapolacja tych wyników może być użyta do przewidywania<br />
zachowania się rezystorów w różnych temperaturach oraz czasach starzenia.Taka<br />
ekstrapolacja jest prawie niemożliwa dla polimerowych rezystorów<br />
grubowarstwowych, gdzie wzrost temperatury starzenia prowadzi<br />
do zmian relatywnego dryftu rezystancji względem czasu z dodatniego na<br />
ujemny. W przypadku tych struktur połączenie pomiędzy warstwą rezystywną<br />
a materiałem kontaktu gra istotną rolę w obserwowanym poziomie<br />
względnych zmian rezystancji.<br />
Słowa kluczowe: rezystory wbudowane, płytka obwodu drukowanego,<br />
stabilność długoczasowa, thermal ageing, Fosforek niklu (Ni-P), polimerowe<br />
rezystory grubowarstwowe<br />
Such an extrapolation is almost impossible for polymer-thick film resistors,<br />
where the increase of ageing temperature leads to change relative resistance<br />
drift versus ageing time from positive to negative. In the case<br />
of these structures the interface between resistive films and termination<br />
materials plays a very important role on the level of observed relative resistance<br />
changes.<br />
Keywords: embedded resistors, printed circuit board, long-term stability,<br />
thermal ageing, Nickel-Phosphorus (Ni-P), polymer thick film resistor<br />
DUNST K., MOLIN S., JASIŃSKI P.: Spektroskopia impedancyjna jako<br />
narzędzie diagnostyczne degradacji tlenkowych ogniw paliwowych<br />
<strong>Elektronika</strong> (LIII), nr 1/<strong>2<strong>01</strong>2</strong>, s. 59<br />
Tlenkowe ogniwa paliwowe SOFCs (ang. Solid Oxide Fuel Cells) są obecnie<br />
bliskie komercjalizacji. Wiedza na temat mechanizmów degradacji ogniw<br />
paliwowych jest niezbędna do dalszej poprawy ich działania. Spektroskopia<br />
impedancyjna jest skutecznym narzędziem diagnostycznym. Pozwala ona<br />
na wskazanie który element ogniwa SOFC ulega pogorszeniu oraz pozwala<br />
poznać dokładniej naturę procesu degradacji. W tej pracy degradacja<br />
ogniwa SOFC została zbadana przy użyciu spektroskopii impedancyjnej.<br />
Jako paliwa użyto wodoru oraz metanu. Związek pomiędzy niestabilnością<br />
w metanie (spowodowaną osadzaniem się węgla) a widmem impedancji<br />
został pokazany. Rodzaj degradacji został powiązany z częstotliwościami<br />
charakterystycznymi odczytanymi z widm impedancyjnych.<br />
Słowa kluczowe: spektroskopia impedancyjna, tlenkowe ogniwa paliwowe,<br />
degradacja<br />
DUNST K., MOLIN S., JASIŃSKI P.: Impedance spectroscopy as a diagnostic<br />
tool of degradation of Solid Oxide Fuel Cells<br />
<strong>Elektronika</strong> (LIII), no 1/<strong>2<strong>01</strong>2</strong>, p. 59<br />
Solid Oxide Fuel Cells (SOFCs) are close to commercialization and knowledge<br />
about degradation mechanism become a vital step for their further<br />
improvement. A powerful diagnosis tool is impedance spectroscopy (IS).<br />
The IS allows indicating the degrading element of the SOFC and may<br />
provide knowledge about nature of the degradation process. In this paper<br />
degradation of the SOFCs has been investigated by impedance spectroscopy.<br />
Hydrogen and methane was used as a fuel. Relation between<br />
instability in the methane (caused by carbon formation) and impedance<br />
spectra was revealed. Type of degradation was linked with characteristic<br />
frequencies obtained from the impedance spectra.<br />
Keywords: impedance spectroscopy, solid oxide fuel cell, degradation<br />
SABAT W., KLEPACKI D., KAMUDA K.: Analiza sprzężeń elektromagnetycznych<br />
w układach hybrydowych wykonanych na podłożach ze<br />
stali austenitycznej<br />
<strong>Elektronika</strong> (LIII), nr 1/<strong>2<strong>01</strong>2</strong>, s. 61<br />
W opracowaniu przeanalizowano uwarunkowania geometryczne i technologicznerealizacji<br />
układów hybrydowych na podłożach metalowych austenitycznych<br />
w aspekcie ich kompatybilności elektromagnetycznej.W ujęciu<br />
ilościowym określono jak konfiguracja ścieżek, ich parametry geometryczne<br />
i fizyczne wpływają na wartość parametrów elementów resztkowych,<br />
a w efekcie finalnym na proces propagacji sygnałów szybkozmiennych<br />
w układach wzajemnie równoległych ścieżek. Na bazie przeprowadzonej<br />
analizy zdefiniowano mechanizm propagacji znormalizowanych sygnałów<br />
elektrycznych w tego rodzaju strukturach. Dal wybranych konfiguracji ścieżek<br />
zaprezentowano wyniki obliczeń i pomiarów w celu określenia wpływu<br />
zmian parametrów geometrycznych układu na funkcję przenoszenia.<br />
Słowa kluczowe: mikroelektroniczne układy hybrydowe, EMC, integralność<br />
sygnałów, technologia LTCC<br />
SABAT W., KLEPACKI D., KAMUDA K.: Analysis of electromagnetic<br />
couplingsin hybrid circuit made on austenitic metal substrate<br />
<strong>Elektronika</strong> (LIII), no 1/<strong>2<strong>01</strong>2</strong>, p. 61<br />
The geometrical and technological conditions of realization of hybrid circuits<br />
made on austenitic metal substrate in EMC aspects have been analyzed<br />
in this paper. The influence of path configurations, their geometrical<br />
and physical parameters on parasitic element parameters has been determined<br />
in quantitative point of view. On the basis carried out analysis of<br />
topical materials the mechanisms ofpropagation of normalized electrical<br />
signals in this type structure have been characterized. The degree of modification<br />
of transfer function under changes of the particular geometrical<br />
and physical factors of such type structures has been determined. The<br />
results of calculations and experimental verification have been also presented<br />
for the selected path configurations.<br />
Keywords: microelectronic hybrid circuits, electromagnetic compatibility,<br />
signal integrity,hybrid technology<br />
SABAT W., KLEPACKI D., KALITA W., SLOSARČÍK S., JURČIŠIN M.,<br />
CABÚK P.: Zagadnienia EMC w mikroelektronicznych strukturach<br />
wytwarzanych w technologii LTCC<br />
<strong>Elektronika</strong> (LIII), nr 1/<strong>2<strong>01</strong>2</strong>, s. 65<br />
W opracowaniu zaprezentowano uwarunkowania geometryczne i technologiczne<br />
realizacji układów hybrydowych w technologii LTCC w odniesieniu<br />
do kwestii kompatybilności elektromagnetycznej. W ujęciu ilościowym<br />
określono jak konfiguracja ścieżek, ich parametry geometryczne i fizyczne<br />
wpływają na wartość parametrów elementów resztkowych. Zaprezentowano<br />
wyniki obliczeń i pomiarów parametrów resztkowych dla wybranych<br />
charakterystycznych konfiguracji wzajemnie sprzężonych układów ścieżek.<br />
Określono ilościowo wpływ konfiguracji ścieżek oraz parametrów<br />
elektrycznych dla znormalizowanych sygnałów na efektywność procesu<br />
propagacji sygnałów zakłócających w tego typu strukturach.<br />
Słowa kluczowe: mikroelektroniczne układy hybrydowe, EMC, integralność<br />
sygnałów, technologia LTCC<br />
SABAT W., KLEPACKI D., KALITA W., SLOSARČÍK S., JURČIŠIN M.,<br />
CABÚK P.: EMC aspects in microelectronics structures made in<br />
LTCC technology<br />
<strong>Elektronika</strong> (LIII), no 1/<strong>2<strong>01</strong>2</strong>, p. 65<br />
The geometrical and technological conditions of realization of hybrid circuits<br />
made in LTCC technology in EMC aspects have been analyzed in<br />
this paper. The results of calculations and measurements of the change<br />
interval of parasitic element parameters in mutually parallel path systems<br />
have been presented for selected characteristic configurations of conducted<br />
path systems. In terms of quantity the influence of geometrical configuration<br />
of path systems and electrical parameters for standard test signals<br />
on efficiency of process propagation of disturbing signals in this type structures<br />
has been determined. The results of calculations and measurements<br />
have been presented for the selected path configurations.<br />
Keywords: microelectronic hybrid circuit, EMC, signal integrity, LTCC<br />
technology<br />
<br />
<strong>Elektronika</strong> 1/<strong>2<strong>01</strong>2</strong>
Streszczenia artykułów ● Summaries of the articles<br />
KOSIKOWSKI M., SUSZYŃSKI Z.: Metoda przetwarzania obrazów termicznych<br />
zarejestrowanych techniką modulacji przestrzennej<br />
<strong>Elektronika</strong> (LIII), nr 1/<strong>2<strong>01</strong>2</strong>, s. 68<br />
W artykule zaprezentowano i opisano koncepcję akwizycji i przetwarzania<br />
obrazów termicznych zarejestrowanych w trybie modulacji przestrzennej<br />
(BDM). Podstawowym problemem analizy tak pozyskanych obrazów termograficznych<br />
jest niejednorodność tła termicznego oraz duże zróżnicowanie<br />
poziomów sygnału wynikające z różnic kontrastu optycznego. W typowej<br />
termografii aktywnej nie jest to problemem ponieważ, po pierwsze<br />
czas rejestracji jest znacznie krótszy i tło temperaturowe można uznać za<br />
niezmienne a po drugie detekcja sygnału w dziedzinie czasu dotyczy albo<br />
wszystkich pikseli jednocześnie albo każdego piksela oddzielnie. W trybie<br />
BDM rejestruje się wartość sygnału temperaturowego dla kolejnych pikseli<br />
dla tego samego opóźnienia względem pobudzenia, co przy dużych różnicach<br />
kontrastu optycznego powoduje znaczące skokowe zmiany sygnału<br />
o skończonym czasie relaksacji, co wprowadza zniekształcenie liniowe<br />
sygnału, widoczne na obrazach w postaci smug.<br />
Słowa kluczowe: przetwarzanie obrazów, termografia aktywna, modulacja<br />
przestrzennej, metody termiczne, metody temofalowe<br />
KOSIKOWSKI M., SUSZYŃSKI Z.: Method of processing of thermal<br />
images recorded in the beam displacement modulation technique<br />
<strong>Elektronika</strong> (LIII), no 1/<strong>2<strong>01</strong>2</strong>, p. 68<br />
The article discusses the concept of acquisition and processing of thermal<br />
images recorded in the mode of spatial modulation. The basic problem<br />
related to analysing thermal images acquired in such a way is the inhomogeneity<br />
of the thermal background and significant diversification of signal<br />
levels, stemming from optic contrast differences. In the typical active<br />
thermography this is not a problem because the recording time is much<br />
shorter and the temperature background may be considered invariable<br />
and, the signal detection in the realm of time refers either to all the pixels<br />
at the same time or to every pixel separately. In the beam displacement<br />
modulation mode, the temperature signal value is recorded for successive<br />
pixel for the same lag when compared to the excitation which for large optical<br />
contrast differences brings about significant discrete signal changes<br />
with a finite relaxation time, resulting in linear signal distortion, visible as<br />
trails in the images.<br />
Keywords: image processing, active thermography, spatial modulation,<br />
thermowave methods<br />
STRZELCZYK A., JASIŃSKI G., JASIŃSKI P., CHACHULSKI B.: Czujnik<br />
elektrokatalityczny na bazie Nasiconu z warstwą dodatkową<br />
<strong>Elektronika</strong> (LIII), nr 1/<strong>2<strong>01</strong>2</strong>, s. 72<br />
W pracy zostały przedstawione wyniki pomiarów czujnika na bazie Nasiconu<br />
pracującego w trybie elektrokatalitycznym. Czujniki takie pobudzane<br />
są zmieniającym się napięciem przy jednoczesnym pomiarze odpowiedzi<br />
prądowej. Przygotowano czujniki ceramiczne o dwóch różnych typów.<br />
Pierwszy z nich to czujnik posiadający dwie identyczne elektrody złote,<br />
pomiędzy którymi znajduje się elektrolit stały. Drugi czujnik posiada złote<br />
elektrody dodatkowo pokryte warstwą azotanu (III) sodu. Zmierzono i porównano<br />
odpowiedzi obu czujników dla różnych stężeń dwutlenku azotu<br />
w mieszaninie z powietrzem.<br />
Słowa kluczowe: czujnik gazu, elektrolit stały, Nasicon, czujnik elektrokatalityczny<br />
STRZELCZYK A., JASIŃSKI G., JASIŃSKI P., CHACHULSKI B.: Electrocatalytic<br />
sensor based on Nasicon with auxiliary layer<br />
<strong>Elektronika</strong> (LIII), no 1/<strong>2<strong>01</strong>2</strong>, p. 72<br />
In this study properties of Nasicon solid state gas sensors working in<br />
electrocatalytic mode are investigated. The principle of operation of such<br />
sensors is based on the excitation with a periodic potential signal, while<br />
current response is recorded. The sensors are prepared in ceramic technology<br />
with two different constructions. One construction is a symmetrical,<br />
sandwich type structure with electrolyte between two identical gold<br />
electrodes. In the second, the same structure is used, but the electrodes<br />
are covered with auxiliary layer of sodium nitrite. Nitrogen dioxide sensing<br />
properties of both sensors are determined and compared.<br />
Keywords: gas sensor, solid state electrolyte, Nasicon, electrocatalytic<br />
sensor<br />
KOBIEROWSKA K., KARPIŃSKA M., MOLIN S., JASIŃSKI P.: Warstwy<br />
tlenkowe wytworzone metodą pirolizy aerozolowej na podłożach metalicznych<br />
<strong>Elektronika</strong> (LIII), nr 1/<strong>2<strong>01</strong>2</strong>, s. 74<br />
W niniejszym artykule przebadane zostały możliwości zastosowania metody<br />
pirolizy aerozolowej do wytwarzania warstw z tlenku cyrkonu stabilizowanego<br />
itrem na podłożu ze stali nierdzewnej 316L. W pierwszej<br />
kolejności bardzo ważne było określenie optymalnych warunków przygotowania<br />
warstw. Podstawowym parametrem w procesie napylania warstw<br />
metodą pirolizy aerozolowej jest temperatura powierzchni, której wpływ<br />
systematycznie przebadano. Przeprowadzone badania wykazały przydatność<br />
warstw z zastosowaniem tlenku cyrkonu stabilizowanego itrem<br />
wytworzonych metodą pirolizy aerozolowej. W celu określenia odporności<br />
na korozję oraz właściwości ochronnych zostały przeprowadzone pomiary<br />
potencjodynamiczne w roztworze imitującym środowisko tkankowe.<br />
Wyniki uzyskane z pomiarów laboratoryjnych dostarczyły informacji na<br />
temat zjawisk korozyjnych zachodzących na powierzchni stali oraz warstw<br />
ochronnych. Badania pokazały, że warstwą wykazującą poprawę właściwości<br />
antykorozyjnych jest ta, która powstała poprzez napylenie prekursora<br />
polimerowego w temperaturze 390°C.<br />
Słowa kluczowe: piroliza aerozolowa, antykorozyjne warstwy ochronne,<br />
tlenek cyrkonu stabilizowany itrem<br />
Lewandowski J., Dziuda Ł., CELIŃSKI-SPODAR K.: Mechanoakustyczny<br />
czujnik aktywności układu sercowo-naczyniowego<br />
<strong>Elektronika</strong> (LIII), nr 1/<strong>2<strong>01</strong>2</strong>, s. 77<br />
W artykule zaprezentowano projekt oraz wyniki badań mechanoakustycznego<br />
czujnika służącego do monitorowania aktywności układu sercowonaczyniowego.<br />
W założeniu czujnik był pomocniczym elementem systemu<br />
sensorów do bezkontaktowych pomiarów aktywności serca i czynności<br />
oddechowej. W prezentowanym czujniku zastosowano głowicę stetoskopu<br />
oraz głowicę odbierającą drgania akustyczne wykorzystującą światłowodową<br />
siatkę Bragga jako element pomiarowy. Czujnik został przebadany<br />
na zaprojektowanym w tym celu stanowisku badawczym. Pasmo odbioru<br />
drgań akustycznych czujnika wynosi 25…135 Hz, zaś jego wzmocnienie<br />
przy częstotliwości 100 Hz – 9,2 dB. Parametry te stwarzają potencjalną<br />
możliwość zastosowania urządzenia w przyszłości jako stetoskopu światłowodowego<br />
bądź elementu pomiarowego w balistokardiografii. Do odbioru<br />
drgań wykorzystywano system interrogacji Micron Optics SM-130.<br />
Słowa kluczowe: akustyka, stetoskop, światłowodowa siatka Bragga,<br />
układ sercowo-naczyniowy<br />
<strong>Elektronika</strong> 1/<strong>2<strong>01</strong>2</strong><br />
KOBIEROWSKA K., KARPIŃSKA M., MOLIN S., JASIŃSKI P.: Oxide<br />
layers fabricated by spray pyrolysis on metallic surfaces<br />
<strong>Elektronika</strong> (LIII), no 1/<strong>2<strong>01</strong>2</strong>, p. 74<br />
In this paper the possibilities of using spray pyrolysis method to produce<br />
yttrium stabilized zirconia layers have been examined. A stainless steel,<br />
type 316L, was used as a substrate. It was important to determine the<br />
optimal conditions of the films preparation. The basic parameter in the<br />
pyrolysis technology process is a surface temperature, which was systematically<br />
examined. The layer was intended to be used as protective film<br />
for metallic implants. In order to determine the corrosion resistance and<br />
protective properties of produced layers, potentiodynamic measurements<br />
in mimicking tissue environment solution were carried out. It provided information<br />
about the corrosive effects, which occur on the steel surface and<br />
on the protective layer. The experimental results showed that improvement<br />
of corrosion resistance properties was obtained by spraying the precursor<br />
at 390°C.<br />
Keywords: spray pyrolysis, corrosion protective layers, yttrium stabilized<br />
zirconia<br />
LEWANDOWSKI J., Dziuda Ł., CELIŃSKI-SPODAR K.: Mechano-acoustic<br />
sensor of the cardiovascular system activity<br />
<strong>Elektronika</strong> (LIII), no 1/<strong>2<strong>01</strong>2</strong>, p. 77<br />
This article presents the design and results of study on the mechanoacoustic<br />
sensor used for monitoring cardiovascular activity. The basic idea<br />
was to utilize the presented sensor as a secondary element in the sensor<br />
system for contactless measurement of cardiac and respiratory activity.<br />
The sensor consists of a stethoscope head and an acoustic head which<br />
receives vibrations by means of the fiber Bragg grating acting as a sensing<br />
element. The sensor has been tested at the dedicated experimental setup.<br />
The frequency range of acoustic vibration receiving reaches 25-135 Hz,<br />
and its amplification at 100 Hz is 9.2 dB. These parameters make a potential<br />
opportunity to apply the device in the future as a fiber-optic stethoscope<br />
or fiber-optic sensing element in balistocardiography. For signals<br />
receiving, the SM-130 interrogation system by Micron Optics was used.<br />
Keywords: acoustics, cardiovascular system, fiber Bragg grating, stethoscope
Streszczenia artykułów ● Summaries of the articles<br />
SĘDEK E.: Aktywne anteny radarów wielofunkcyjnych – analiza stanu<br />
i perspektywy rozwoju – część 1<br />
<strong>Elektronika</strong> (LIII), nr 1/<strong>2<strong>01</strong>2</strong>, s. 81<br />
W artykule przeglądowym omówiono stan techniki aktywnych anten radarów<br />
wielofunkcyjnych stosowanych w stacjonarnych urządzeniach<br />
naziemnych. Aktywne anteny stosowane w radarach transportowalnych,<br />
samolotowych i okrętowych będą omówione w następnym artykule. Przedstawiono<br />
rozwiązania reprezentatywne dla anten aktywnych stosowanych<br />
w wymienionych radarach. Pokazano ich cechy charakterystyczne oraz<br />
tendencje rozwoju i integracji aktywnych systemów antenowych. Opracowanie<br />
składa się z 3 części. Pierwsza część poświęcona jest aktywnym<br />
antenom naziemnych radarów wielofunkcyjnych. W drugiej części dokonano<br />
przeglądu aktywnych anten stosowanych w radarach transportowalnych,<br />
samolotowych i okrętowych, zaś trzecia część poświęcona będzie<br />
mikrofalowym podzespołom stosowanych w aktywnych antenach.<br />
Słowa kluczowe: radary wielofunkcyjne, radary stacjonarne, aktywne anteny<br />
ścianowe, moduły nadawczo-odbiorcze T/R<br />
SĘDEK E.: Active phased antenna array for multifunction radar – review<br />
and perspective development – part 1<br />
<strong>Elektronika</strong> (LIII), no 1/<strong>2<strong>01</strong>2</strong>, p. 81<br />
In the paper review of active phased antenna array for multifunction radar<br />
is presented. Active phased antenna array for ground based radar is presented<br />
in detail. Shipboard, airborne and transportable/mobile radar active<br />
phased antenna array will be presented in the next paper. The full paper is<br />
compose from three parts. In the first part an active phased antenna array<br />
for multifunction ground based long-range radar is presented. In the second<br />
part the active phase antenna array for transportable/mobile radar, shipboard<br />
and airborne radar will be analyzed. In the third part will be presented<br />
parameters of microwave devices used in antenna array and technology of<br />
transmit/receive modules. We would like to show, that monolithic microwave<br />
technology is perspective and needed to use in active phase antenna<br />
array especially in the higher frequency band such as X, Ka, and W.<br />
Keywords: multifunction radar, ground based radar, active phased antenna<br />
array, transmit/receive modules T/R<br />
MITAS A.W., BERNAŚ M., BUGDOL M., RYGUŁA A.: Technologie informacyjne<br />
w predykcji pogodowych zagrożeń w ruchu drogowym<br />
<strong>Elektronika</strong> (LIII), nr 1/<strong>2<strong>01</strong>2</strong>, s. 90<br />
W artykule w syntetycznym ujęciu przedstawiono zagadnienie predykcji<br />
pogodowej, ze szczególnym uwzględnieniem detekcji zagrożeń atmosferycznych<br />
w ruchu drogowym. W kolejnych punktach opracowania opisano<br />
podstawy prognozowania pogodowego, scharakteryzowano przykładowe<br />
modele matematyczne oraz zaprezentowano autorski system wnioskowania<br />
o niebezpiecznych stanach atmosferycznych na drodze.<br />
Słowa kluczowe: predykcja pogodowa, bezpieczeństwo transportu, technologia<br />
informacyjna w ruchu drogowym<br />
MITAS A.W., BERNAŚ M., BUGDOL M., RYGUŁA A.: Information technology<br />
in prediction of weather hazards affecting road traffic<br />
<strong>Elektronika</strong> (LIII), no 1/<strong>2<strong>01</strong>2</strong>, p. 90<br />
In the article summarized the issue of predicting the weather hazards, with<br />
particular emphasis on the detection of dangerous atmospheric conditions<br />
in road traffic. In the following sections the basis of weather forecasting,<br />
mathematical models and the authors inference system about hazardous<br />
road condition were described.<br />
Keywords: weather prediction, transport safety, information technology<br />
in road traffic<br />
ZAHARIEVA S., MUTKOV V., GEORGIEV I.: Еlektroniczny system pomiarowy<br />
do kontroli parametrów geometrycznych profili produkowanych<br />
na liniach wytłaczarkowych<br />
<strong>Elektronika</strong> (LIII), nr 1/<strong>2<strong>01</strong>2</strong>, s. 95<br />
Pomiar kompleksowych i różnicowych geometrycznych parametrów<br />
w trakcie produkcji cylindrycznych, kwadratowych i prostokątnych wytłaczanych<br />
wyrobów niewątpliwie zwiększa jakość gotowej produkcji. Dynamika<br />
procesu technologicznego oraz wpływ zewnętrznych czynników<br />
na parametry wyrobów narzuca wprowadzanie elektronicznego systemu<br />
pomiarowego, który w trakcie produkcji mierzy i przechowywuje dane pomiarów.<br />
Zrealizowany elektroniczny system pomiarowy do kontroli parametrów<br />
geometrycznych profili produkowanych na liniach wytłaczakowych<br />
pozwala na aktywną kontrolę w trakcie produkcji i równocześnie zwiększa<br />
jakość gotowej produkcji.<br />
Słowa kluczowe: system pomiarowy; kontrolа; parametry geometryczne;<br />
cylindryczne, kwadratowe i prostokątne wytłaczane profile<br />
ZAHARIEVA S., MUTKOV V., GEORGIEV I.: Electronic measurement<br />
system for monitoring of geometrical parameters of rolling shaped<br />
metal profiles<br />
<strong>Elektronika</strong> (LIII), no 1/<strong>2<strong>01</strong>2</strong>, p. 95<br />
The measurement of the complex and the differential geometric parameters<br />
in the production process of cylindrical, square and rectangular rolling<br />
shaped metal profiles will inevitably lead to a rise in the production<br />
quality. The dynamism of the technological process and the influence of<br />
great number of outside factors over geometrical parameters of revolving,<br />
enforce development of an electronic measurement system, which reliably<br />
reads and preserves measured data immediately in the production process<br />
of rolling shaped metal. The accomplished electronic measurement<br />
system for monitoring of geometric parameters of rolling shaped metal<br />
performs an active firsthand control in the production process, for the purpose<br />
of management of the quality of the finished production.<br />
Key words: measurement system, monitoring, geometric parameters, cylindrical,<br />
square and rectangular rolling shaped metal profiles<br />
STĘPIEŃ R., WALCZAK J.: Modulacja amplitudy sygnałem pseudolosowym<br />
<strong>Elektronika</strong> (LIII), nr 1/<strong>2<strong>01</strong>2</strong>, s. 98<br />
W artykule rozpatrzono problem modulacji amplitudy sinusoidalnej fali<br />
nośnej przebiegiem pseudolosowym. Podano przykładowe realizacje generatorów<br />
sygnałów pseudolosowych i ich właściwości. Omówiono proces<br />
modulacji AM sygnałem pseudolosowym i właściwości widma sygnałów<br />
zmodulowanych. Zaproponowano fizyczną realizację modulatora wraz<br />
z układem kształtowania widma. Zaprezentowano wyniki badań symulacyjnych<br />
i eksperymentalnych modulatora podając także jedno z możliwych<br />
zastosowań.<br />
Słowa kluczowe: sygnały pseudolosowe, modulacja AM, generatory<br />
LFSR, widmo sygnału pseudolosowego, modulator, zagłuszanie<br />
STĘPIEŃ R., WALCZAK J.: Amplitude modulation with pseudo random<br />
signal<br />
<strong>Elektronika</strong> (LIII), no 1/<strong>2<strong>01</strong>2</strong>, p. 98<br />
In this article a pseudorandom AM modulation of the sinusoidal carrier is<br />
considered. An exemplary realizations of the pseudorandom generators<br />
are shown. The pseudorandom AM modulation process and its spectrum<br />
are described. A practical construction of the modulator with spectrum<br />
shaping circuit is proposed. Simulation of proposed circuit, experimental<br />
results and one of the possible use of the constructed device are shown.<br />
Keywords: pseudorandom signals, AM modulation, LFSR generator,<br />
pseudorandom signal spectrum, modulator, jamming<br />
DĄBROWSKI J., ZARĘBSKI J.: Problematyka modelowania w programie<br />
SPICE charakterystyk stałoprądowych elektroizolowanych<br />
diodowych modułów mocy zawierających diody typu PiN oraz diody<br />
typu FRED<br />
<strong>Elektronika</strong> (LIII), nr 1/<strong>2<strong>01</strong>2</strong>, s. 103<br />
W artykule poruszono problematykę modelowania w programie SPICE<br />
charakterystyk statycznych krzemowych elektroizolowanych diodowych<br />
modułów mocy. Do badań wybrano moduły zawierające diody typu PiN<br />
oraz diody typu FRED<br />
Słowa kluczowe: moduł elektroizolowany, dioda PiN, dioda FRED (Fast<br />
Recovery Epitaxial Diode), SPICE, modelowanie<br />
DĄBROWSKI J., ZARĘBSKI J.: Problem of the SPICE modeling of the<br />
d.c. characteristics of the electroisolated power diode modules containing<br />
PiN diodes and fast recovery epitaxial diodes<br />
<strong>Elektronika</strong> (LIII), no 1/<strong>2<strong>01</strong>2</strong>, p. 103<br />
In the paper the problem of modeling of d.c. characteristics of electroisolated<br />
power diode modules was considered. For investigations the modules<br />
containing the silicon PiN diodes and the silicon fast recovery epitaxial<br />
diodes were chosen<br />
Keywords: electroisolated module, PiN diode, fast recovery epitaxial diode<br />
(FRED), SPICE, modeling<br />
10<br />
<strong>Elektronika</strong> 1/<strong>2<strong>01</strong>2</strong>
Study of IDE as a sensor head for interfacing<br />
with handheld electrochemical analyzer system<br />
(Projekt głowicy IDE dla sensorów do zastosowań w podręcznych<br />
systemach analizy elektrochemicznej)<br />
Vijayalakshmi Velusamy 1) , prof. Khalil Arshak 1) , dr Olga Korostynska 2) ,<br />
dr Catherine Adley 3)<br />
1)<br />
Department of Electronic and Computer Engineering<br />
3)<br />
Department of Chemical and Environmental Sciences University of Limerick, Limerick, Ireland<br />
2)<br />
School of Physics, Dublin Institute of Technology, Dublin, Ireland<br />
Electrochemical biosensors have been receiving more attention<br />
in recent years since they are simple to use, cost-effective, offer<br />
high sensitivity and suitable for in situ analysis [7–10]. Applications<br />
are mainly focused on food quality monitoring for the detection of<br />
foodborne pathogens [11], environmental quality monitoring for<br />
the detection of contamination of potable water resources due to<br />
pathogenic micro organisms and industrial by-products [12, 13]<br />
and in biosecurity for the detection of biowarfare agents [14].<br />
An electrochemical sensor is an electrical device in which the<br />
biological and/or the chemical information are converted to an<br />
electrical signal, which is then processed and recorded for further<br />
analysis.<br />
Towards the development of an electrochemical analyzer system,<br />
a sensor was initially designed that may be interfaced with the<br />
handheld system comprising both the potentiostat and the impedance<br />
analyzer. In biosensors the lower limit of detection is a big<br />
challenge and numerous electrode geometries have been developed<br />
during the past decade to address this problem. Among various<br />
electrode geometries IDE have advantage in bioanalytical applications.<br />
A thick-film gold IDE was employed in this research and<br />
it was prepared by screen printing technique. Thick-film sensors<br />
are advantageous since it is compact, robust and relatively cost-effective.<br />
It is possible to mass produce from macro- to microscale,<br />
with greater reproducibility. However, the applicability of the technology<br />
is limited to a possible minimum line width (100 µm) [15].<br />
The planar IDE sensors based on thick films are very wellsuited<br />
to integrate with electronic circuits. The IDE sensors can<br />
be combined with other planar technologies like plasma/chemical<br />
vapor deposition for surface modification. The device produced<br />
by the thick-film technique has the ability to facilitate as a supporting<br />
structure upon which other sensing materials can be deposited.<br />
To fabricate a DNA sensor for the real time detection of the<br />
microbial pathogens, meandering heater element patterns can be<br />
screen-printed as a first layer which acts as both a temperature<br />
sensor and a heater to enable the localised temperature to be<br />
raised to release the bacteria and thus the DNA fragments. A dielectric<br />
layer can be then deposited over the heating pattern and<br />
the final layer is a gold IDE pattern.<br />
To study the performance of the sensor a label free unmodified<br />
DNA was immobilized and hybridized using simple electrochemical<br />
adsorption technique. Prior to immobilization one pole of<br />
the gold IDE was modified by the conducting polymer polypyrrole<br />
(PPy) which served as an immobilization matrix.<br />
from distilled water. The capture probe and the target probe are<br />
20-mer oligonucleotides and the non complementary probe is 21-<br />
mer in length. Table 1 shows the sequence of the oligonucleotides<br />
probes used in this work.<br />
Tabl. 1. DNA Sequences<br />
Tab. 1. Sekwencje DNA<br />
Probe (5’-3’)<br />
Function<br />
Complementary (5’-3’)<br />
Non-Complementary (5’-3’)<br />
IDE Preparation<br />
Sequence<br />
ATC GCC TCG TTG GAT GAC GA<br />
TCG TCA TCC AAC GAG GCG AT<br />
AAA ATC GAT GGT AAA GGT TGG<br />
The interdigitated electrode structure was screen-printed onto precleaned<br />
alumina substrates (CeramTec UK Ltd.) using a DEK 1202<br />
automatic screen-printer. The material used for the electrodes was<br />
Au thick film conductive paste (Heraeus Materials). After screenprinting,<br />
the electrodes were placed into an oven at 80°C for 2 hours<br />
to facilitate the initial drying of the paste. In this step, the remaining<br />
solvent in the thick film paste evaporates, leaving the dried pattern<br />
on the substrate. The devices are next placed into a multi-chamber<br />
belt-furnace for an 850°C temperature cycle. In this step, any<br />
remaining organic binder is removed and the metal frit is sintered<br />
into one solid structure. This step also allows the electrode pattern<br />
to settle to its final thickness and resistivity values.<br />
The IDE structure used in this work is shown in Fig. 1. The thickness<br />
of the Au thick film was measured as 9 µm using a Dektak<br />
Surface Profile Measuring System.<br />
Materials and Methods<br />
Materials<br />
Pyrrole and MgCl 2<br />
solution was purchased from Sigma-Aldrich,<br />
USA. All the reagents were analytical grade and used without further<br />
purification. Specific sequences for the Bacilus cereus (B.<br />
cereus) were designed in the laboratory [16] and its synthetic<br />
form was purchased from Integrated DNA technologies, USA. All<br />
stock solutions and a concentration of 100 pM/µl were prepared<br />
Fig. 1. Schematic of the gold IDE sensor that is employed in this<br />
work. All dimensions are in millimeters<br />
Rys. 1. Schemat złotego czujnika typu IDE, który jest wykorzystywany<br />
w pracy. Wszystkie wymiary podano w milimetrach<br />
<strong>Elektronika</strong> 1/<strong>2<strong>01</strong>2</strong> 11
Instrumentation<br />
Link wires were soldered directly to the bond pads of the IDE structure.<br />
An Autolab PGSTAT302N was used to apply constant potential.<br />
The AC characteristics were monitored using a HP 4192A<br />
Low Frequency Impedance Analyzer (0.3 V,10 Hz – 10 kHz), using<br />
LabView software to log the results.<br />
Gold electrode surface modification and<br />
electrochemical synthesis of Polypyrrole<br />
Before surface modification, the bare IDE electrode was scanned<br />
between – 0.3 and 0.8 V in 0.1 M MgCl 2<br />
/10 mM Tris-HCl buffer<br />
(pH 7.2) until a reproducible cyclic voltammogram (CV) was obtained.<br />
Electropolymerization of PPy was performed at a constant<br />
potential of 1 V for 20 s. The IDE electrode was immersed into<br />
a 3 ml solution of 0.1 M pyrrole containing the doping electrolyte<br />
0.1 M MgCl 2<br />
. The IDE coated with PPy film was then washed with<br />
distilled water and dried at room temperature. The prepared PPy<br />
coated electrode was analyzed by impedance measurements. All<br />
impedance measurements were performed in an analysis buffer<br />
consisting of 0.1 M MgCl 2<br />
and 10 mM Tris-HCl buffer, with a pH of<br />
7.2. An AC amplitude of 10 mV was used and the data were collected<br />
in the frequency range 10 Hz – 10 kHz. Impedance versus<br />
frequency was measured and recorded.<br />
Immobilization of capture DNA<br />
The immobilization solution consists of 20 mM MgCl 2<br />
in10 mM<br />
Tris–HCl buffer (pH 7.2) with 100 pM probe DNA. The probe DNA<br />
was immobilized onto the PPy coated electrode by electrochemical<br />
adsorption at 0.5 V for 600 s. The ss-DNA immobilized surface<br />
was washed with distilled water to remove unadsorbed DNA and<br />
dried at room temperature. Impedance analysis was then undertaken<br />
on the PPy/ss-DNA film.<br />
Hybridization of the target DNA<br />
100 pM of the ss- target probe was electrostatically adsorbed as<br />
stated above onto the ss-capture probe immobilized PPy film. The<br />
hybridized Au/PPy/DNA film was washed with distilled water to<br />
remove unadsorbed DNA, dried at room temperature and impedance<br />
measurements were taken.<br />
Results and Discussion<br />
Modification of gold IDE<br />
To detect target DNA, it is important that biorecognition element<br />
(ss-probe DNA) is well integrated with the signal transducer. Integration<br />
is most commonly achieved by immobilizing ss-DNA on<br />
the electrode surface. Here, conducting polymer polypyrrole was<br />
used as an immobilization matrix because of its biocompatibility<br />
and the ease of immobilization. Electrical conduction in PPY is<br />
the result of electron movement within delocalized orbitals and<br />
positive charge defects known as polarons [17]. These positive<br />
charges are located every three to four pyrrole units along the<br />
polymer backbone and negatively charged dopants are deposited<br />
at the locations. Since DNA can form a strong bond with PPy,<br />
based on the interchanging of dopant DNA molecules [18], PPy<br />
has received greater attention for application of DNA biosensors.<br />
Here, one pole of the Gold IDE was modified by PPy film from the<br />
one-step electropolymerization of pyrrole monomer in 20 s and its<br />
thickness can be controlled by varying the polymerization time.<br />
Immobilization and hybridization of DNA<br />
In this study, 100 pM (0.2 µg/ml) of the probe DNA sequence specific<br />
to B.cereus was immobilized onto the PPy coated electrode<br />
through electrochemical adsorption at a potential of 0.5 V for 600<br />
s. Electrochemical adsorption has several advantages over physical<br />
adsorption or physisorption. In electrochemical adsorption<br />
forces of attraction are due to chemical bond whereas in physisorption<br />
forces of attraction are due van der Waals’ forces. Unlike<br />
12<br />
Fig. 2. Frequency versus Impedance plot of (a) the PPy film, (b) PPy/<br />
ss-DNA capture immobilized surface, (c) After the hybridization with<br />
complementary target DNA<br />
Rys. 2. Impedancja w funkcji częstotliwości (a) warstewka PPy, (b)<br />
PP/ss-DNA zajmuje immobilizującą powierzchnię (c) po hybrydyzacji<br />
z komplementarnym DNA<br />
physisorption, electrochemisorption is difficult to reverse and it is<br />
highly specific. However, the elementary step in an electrochemical<br />
adsorption requires an activation energy. To immobilize the<br />
probe DNA a potential of 0.5 V was applied to activate the electrochemical<br />
adsorption process.<br />
In PPy, due to the delocalized electronic structure, the positively<br />
charged defect structures are mobile along the chain axis. This<br />
mobility allows for more flexibility towards the binding of DNA’s<br />
fixed negative charge sites. Therefore, PPy provides a unique<br />
surface for DNA immobilization. The use of PPy allows label-free<br />
immobilization without modifying the probes and no additional reagents<br />
are required. The same amount of target complementary<br />
DNA was electrostatically adsorbed onto the ss-DNA immobilized<br />
electrode as stated above. The electrochemical transduction mechanism<br />
is based on impedance measurements (without the use<br />
of redox active species). The frequency versus impedance plots<br />
for PPy modified electrode, immobilized DNA and hybridized DNA<br />
are shown in Fig. 2.<br />
When the probe DNA is immobilized onto the PPy modified<br />
electrode surface, they form a layer that hinders the electron<br />
transfer and an increase in impedance is expected. If the target<br />
DNA attaches to the immobilized probe DNA it forms DNA duplexes<br />
which will create a further barrier to the electron transfer<br />
to and from the modified electrode surface and hence the impedance<br />
increases. From Fig. 2, the impedance measured at 5 kHz<br />
prior to immobilization (Au/PPy) was 92.47 Ω and after immobilizing<br />
the ss probe DNA 92.4% (177.9 Ω) increase in impedance<br />
was observed. The total change in impedance after hybridization<br />
was 177% (256.2 Ω). The results show that the increase in impedance<br />
is due to presence of the probe DNA at the PPY surface,<br />
which blocks the passage of chloride ions at the PPy/solution interface<br />
and further addition of negative charge to the IDE surface,<br />
in the form of complementary oligonucleotide, further blocks the<br />
chloride ion exchange which yields an increase in impedance after<br />
hybridization.<br />
To validate the performance of the designed IDE sensor, with<br />
respect to its detection limit and sensitivity it was compared to the<br />
conventional gold disc electrode using the same procedures. The<br />
gold disc electrode was modified by PPy and 0.5 µg/ml of DNA<br />
was immobilized and the same amount was used for hybridization<br />
where as in IDE only 0.2 µg/ml of DNA was used. In both cases<br />
impedance measurements are carried without any redox probes.<br />
The results obtained using IDE are comparable to those obtained<br />
by the disc electrodes and are shown in Fig. 3.<br />
Table 2 shows the comparison between IDE and the disc electrode<br />
at frequencies of 100 Hz and 5 kHz. Comparing Fig. 3a and<br />
3b, at 5 kHz the change in impedance after hybridization was<br />
177% using IDE and 34.64% was observed using disc electrode.<br />
<strong>Elektronika</strong> 1/<strong>2<strong>01</strong>2</strong>
a)<br />
thick-film technology is simple, sensitive, rapid and cost effective.<br />
The electrical detection of 100 pM concentration of DNA immobilized<br />
onto the PPy modified gold IDE was achieved, with an IDE width of<br />
400 µm. Using IDE samples of few µl to pl can be analyzed thereby,<br />
avoiding the typical three electrode electrochemical cell. Also, it has<br />
led to the use of two-electrode control circuits, rather than the conventional<br />
three-electrode setup and the planar IDE can be directly<br />
interfaced with front-end electronics circuit, which in turn will lead to<br />
the development of handheld system for real time monitoring and<br />
detection of microbial pathogens and bio-warfare agents.<br />
Further research is directed to the development of a handheld<br />
sensor system to detect the DNA of the pathogenic micro-organisms<br />
in a real-time environment directly from food and water.<br />
b)<br />
Fig. 3. (a) Shows the experimental results using LabView software<br />
obtained from using IDE and (b) shows the data obtained with the<br />
typical disc gold electrodes (2 mm diameter) using commercial electrochemical<br />
workstation<br />
Rys. 3. (a) prezentuje wyniki eksperymentalne uzyskane z zastosowaniem<br />
IDE i oprogramowania LabView i (b) pokazuje dane uzyskane<br />
za pomocą typowej okrągłej złotej elektrody (o średnicy 2 mm) z zastosowaniem<br />
komercyjnego stanowiska roboczego<br />
Tabl. 2. Comparison between IDE and disc electrode<br />
Tab. 2. Porównanie pomiędzy IDE i elektrodą dyskową<br />
IDE<br />
Disc electrode<br />
Frequency Impedance (Ω)<br />
Change in Impedance (Ω) Change in<br />
impedance<br />
impedance<br />
Au/PPy Au/PPy/DNA (%) Au/PPy Au/PPy/DNA (%)<br />
100 Hz 116.75 810.4 594.13 152.4 276.9 81.69<br />
5 kHz 92.47 256.2 177.06 127.6 171.8 34.64<br />
Moreover, the amount of DNA used for IDE was 0.2 µg/ml whereas<br />
0.5 µg/ml of DNA is used for disc electrode.<br />
The IDE yields better sensitivity since it has the ability to monitor<br />
the change of the electrical properties in the immediate vicinity<br />
of its surface and they are more sensitive to the rate of change of<br />
electron transfer. There is an option to polymerize either one or<br />
both poles of the IDE.<br />
In this study, only one pole of the IDE was modified with PPy<br />
and used for immobilizing DNA. They can be mass produced in<br />
array format for the simultaneous detection of multiple pathogens.<br />
Conclusion<br />
The combination of polypyrrole modified interdigitated microelectrodes<br />
with impedance measurements offers a sensitive label-free<br />
biosensor capable of DNA detection. The use of the conducting polymer,<br />
polypyrrole and impedance measurements are advantageous,<br />
since label-free unmodified DNA can be detected in aqueous<br />
solutions that are compatible to the DNA’s natural conditions.<br />
Impedance experiments were carried out directly without any<br />
redox probe and the results are reproducible. The IDE prepared by<br />
This project is funded by Science Foundation Ireland (SFI) Research<br />
Frontiers Programme, ID no: 07RPF-ENEF500.<br />
References<br />
[1] Kay D., J. Crowther, L. Fewtrell, C.A. Francis, M. Hopkins, C. Kay,<br />
A.T. McDonald, C.M. Stapleton, J. Watkins, J. Wilkinson, and M.D.<br />
Wyer:: Quantification and control of microbial pollution from agriculture:<br />
a new policy challenge. Environmental Science & Policy, vol.<br />
11, Apr 2008, pp. 171–184.<br />
[2] Umali-Deininger D., M. Sur: Food safety in a globalizing world: opportunities<br />
and challenges for India. Agricultural Economics, vol. 37,<br />
Dec 2007, pp. 135–147.<br />
[3] Mucchetti G., B. Bonvini, S. Francolino, E. Neviani, and D. Carminati:<br />
Effect of washing with a high pressure water spray on removal of<br />
Listeria innocua from Gorgonzola cheese rind. Food Control, vol. 19,<br />
May 2008, pp. 521–525.<br />
[4] Jin S.S., J. Zhou, and J. Ye: Adoption of HACCP system in the Chinese<br />
food industry: A comparative analysis. Food Control, vol. 19,<br />
Aug 2008, pp. 823–828.<br />
[5] Taylor E.: A new method of HACCP for the catering and food service<br />
industry. Food Control, vol. 19, Feb 2007, pp. 126–134.<br />
[6] Piatek D.R. D.L.J. Ramaen: Method for controlling the freshness of<br />
food products liable to pass an expiry date, uses a barcode reader<br />
device that reads in a conservation code when a product is opened<br />
and determines a new expiry date which is displayed. PIATEK D R<br />
(PIAT-Individual) RAMAEN D L J (RAMA-Individual), 20<strong>01</strong>.<br />
[7] Huang Q., H.Y. Liu, and B. Fang: Development of Electrochemical<br />
DNA Biosensors. Progress in Chemistry, vol. 21, May 2009, pp.<br />
1052–1059.<br />
[8] Wei D., M.J.A. Bailey, P. Andrew, and T. Ryhaenen: Electrochemical<br />
biosensors at the nanoscale. Lab on a Chip, vol. 9, 2009,<br />
pp. 2123–2131.<br />
[9] Pedrero M., S. Campuzano, and J.M.<br />
Pingarron: Electroanalytical Sensors<br />
and Devices for Multiplexed Detection<br />
of Foodborne Pathogen Microorganisms.<br />
Sensors, vol. 9, Jul 2009,<br />
pp. 5503–5520.<br />
[10] Velusamy V., K. Arshak, O. Korostynska,<br />
K. Oliwa, and C. Adley: An overview<br />
of foodborne pathogen detection:<br />
In the perspective of biosensors.<br />
Biotechnology Advances, vol. 28,<br />
2<strong>01</strong>0, pp. 232–254.<br />
[11] Velusamy V., K. Arshak, O. Korostynska, K. Oliwa, and C. Adley: Design<br />
of a real time biorecognition system to detect foodborne pathogens-DNA<br />
Biosensor. in 4th IEEE Sensors Applications Symposium,<br />
New Orleans, LA, USA, 2009, pp. 38–42.<br />
[12] Heo J. and S.Z. Hua: An Overview of Recent Strategies in Pathogen<br />
Sensing. Sensors, vol. 9, Jun 2009, pp. 4483–4502.<br />
[13] Melton S. J., H. N. Yu, K.H. Williams, SA Morris, P.E. Long, and D.A.<br />
Blake: Field-based detection and monitoring of uranium in contaminated<br />
groundwater using two immunosensors. Environmental Science<br />
& Technology, vol. 43, 2009, pp. 6703–6709.<br />
[14] Jayanta C., B. Malay, and B. Debadin: Anthrax and bio-terrorism. Biomedical<br />
& Pharmacology Journal, vol. 1, 2008, pp. 315–324.<br />
[15] Aubeck R., C. Eppelsheim, C. Brauchle, and N. Hampp: Potentiometric<br />
thick-film sensor for the determination of the tumor-marker bound<br />
sialic-acid. Analyst, vol. 118, Nov 1993, pp. 1389–1392.<br />
[16] Adley C., K. Arshak, C. Molnar, K. Oliwa, and V. Velusamy: Design of<br />
specific DNA primers to detect the Bacillus cereus group species. in<br />
4th IEEE Sensors Applications Symposium, New Orleans, LA, USA,<br />
2009, pp. 206–209.<br />
[17] Devreux F., F. Genoud, M. Nechtschein, and B. Villeret: Electronspin-resonance<br />
investigation of polarons and bipolarons in conducting<br />
polymers - the case of polypyrrole. Synthetic Metals, vol. 18, Feb<br />
1987, pp. 89–94.<br />
[18] Rodriguez M.I. and E.C. Alocilja: Embedded DNA-polypyrrole biosensor<br />
for rapid detection of Escherichia coli. IEEE Sensors Journal,<br />
vol. 5, Feb 1987, pp. 733–736.<br />
<strong>Elektronika</strong> 1/<strong>2<strong>01</strong>2</strong> 13
Impact of non-optimal grounding of the CC2420 RFIC<br />
on a 802.15.4 Tyndall sensor wireless mote<br />
(Wpływ nieoptymalnego uziemienia układu CC2420 zgodnego<br />
ze standardem IEEE 802.15.4 na pracę systemu Tyndall Mote)<br />
Peter Haigh 2) , MSc John Buckley 1) , MSc Brendan O’Flynn 1) , PhD. Cían Ó’Mathúna 1)<br />
1)<br />
Clarity Centre for Sensor Web Technology<br />
2)<br />
Tyndall National Institute, University College Cork Lee Maltings, Dyke Parade, Cork, Ireland<br />
Range, throughput and power consumption are important issues<br />
in 802.15.4 [1] Wireless Sensor Networks. While the focus is<br />
often on increased power output (at the expense of dc power)<br />
and sensitivity to address these issues, little attention is given<br />
to waveform quality. Poor waveform quality often measured in<br />
terms of EVM can lead to increased packet errors, transmission<br />
retries and therefore reduced range and throughput leading to<br />
increased power consumption. One important factor in relation to<br />
this is proper grounding of the RF devices. This paper describes<br />
an investigation into these effects that was triggered when poor<br />
throughput was reported from the system integrators.<br />
Measurement Technique<br />
As the modulated signal passes through a non-linear function it<br />
becomes distorted. This distortion leads to a degradation in the<br />
signal quality and ultimately affects the throughput of the system<br />
due to an increase in Bit Error Rate (BER) leads to re-transmissions.<br />
The relationship between linearity, Adjacent Channel Power<br />
Ratio (ACPR) and EVM is well established [2, 3]. Of particular<br />
interest in this study was the effect of non-optimal grounding of<br />
the radio transceiver on output spectrum and EVM. Test methods<br />
were devised to measure these parameters based on the existing<br />
802.15.4 standard.<br />
Adjacent Channel Power Ratio<br />
The incumbent radio standard defines some parameters for signal<br />
quality and ACPR. These are defined to ensure that the wireless<br />
system will perform to specification taking into account regulatory<br />
as well as inter and intra system issues. For ACPR it was found<br />
that the definition in 802.15.4 was not sensitive enough for this<br />
investigation. Therefore, a new measurement was defined to enable<br />
the analysis of more detailed linearity effects.<br />
A typical 802.15.4 spectra such as in Fig. 1, exhibits well defined<br />
troughs that are defined by the channel filter characteristic.<br />
From experimentation, it was shown that the spectral degradation<br />
of these troughs is very sensitive to non-linearity as shown in Fig.<br />
2. Two ACPR points at the first and second trough were established<br />
leading to the settings summarised in Table 1 below.<br />
Tab. 1. ACPR spectrum analyser settings<br />
Tab. 1. Ustawienia analizatora widma przy pomiarze ACPR<br />
14<br />
Description<br />
Tx Channel<br />
Integration Bandwidth<br />
ACPR 1<br />
Integration Bandwidth<br />
Spacing<br />
ACPR 2<br />
Integration Bandwidth<br />
Spacing<br />
Resolution Bandwidth<br />
Video Bandwidth<br />
Parameter<br />
2 MHz<br />
100 kHz<br />
1.5 MHz<br />
100 kHz<br />
2.5 MHz<br />
30 kHz<br />
300 kHz<br />
Ref -10 dBm<br />
-20<br />
UNCAL<br />
-30<br />
-40<br />
1 RM *<br />
CLRWR -50<br />
-60<br />
-70<br />
-80<br />
-90<br />
-100<br />
Att<br />
5 dB<br />
* RBW 30 kHz<br />
* VBW 300 kHz<br />
* SWT 100 ms<br />
Center 2.469955 GHz 1 MHz/<br />
Span 10 MHz<br />
Fig. 1. Typical 802.15.4 spectrum<br />
Rys. 1. Typowe spektrum standardu IEEE 802.15.4<br />
Ref -10 dBm<br />
-20<br />
UNCAL -30<br />
-40<br />
1 RM *<br />
CLRWR -50<br />
-60<br />
-70<br />
-80<br />
-90<br />
-100<br />
Att 5 dB<br />
* RBW 30 kHz<br />
* VBW 300 kHz<br />
* SWT 100 ms<br />
Center 2.44 GHz 1 MHz/<br />
Span 10 MHz<br />
Fig. 2. Typical 802.15.4 distorted spectrum<br />
Rys. 2. Typowe zniekształcenie spektrum standardu IEEE 802.15.4<br />
Figures 1 and 2 below, show examples of good and bad<br />
802.15.4 spectra that were measured on a spectrum analyser.<br />
Figure 1 shows an 802.15.4 signal with good linearity typified by<br />
the well defined troughs in the spectral shape..<br />
Figure 2 shows a plot of an 802.15.4 signal that has been subjected<br />
to non-linear distortion. It is clear that the spectrum has<br />
spread out and the troughs have been filled due to spectral regrowth.<br />
Measuring the spectrum in these troughs yields a highly<br />
sensitive measurement with respect to linearity.<br />
Error Vector Magnitude Measurement<br />
The EVM measurement was conducted as defined in the 802.15.4<br />
standard using a half sine measurement filter. EVM can be used<br />
as a measure of SNR, BER and packet loss as it is a measurement<br />
of the deviation of the baseband vector from the ideal constellation<br />
location. The instantaneous error vector is a function of<br />
all noise sources (deterministic and random) and if averaged over<br />
time, the noise power and thus SNR can be calculated therefore<br />
establishing a correlation with EVM. By applying some analysis, it<br />
is also possible to distinguish between random and deterministic<br />
noise sources [6]. National Instruments published a graph which<br />
is reproduced in Fig. 3 below for 802.15.4 and demonstrates the<br />
effect of EVM on BER. [3].<br />
<strong>Elektronika</strong> 1/<strong>2<strong>01</strong>2</strong><br />
A<br />
3DB<br />
A<br />
SGL<br />
3DB
Fig. 5. Device characterization at 2.47 GHz<br />
Rys. 5. Charakterystyka elementu na częstotliwości 2.47 GHz<br />
Fig. 3. EVM verse’s BER for 802.15.4<br />
Rys. 3. EVM w funkcji BER dla standardu IEEE 802.15.4<br />
EVM is a function of a number of noise sources, both random<br />
and deterministic. Assuming that the radio design has taken<br />
these into account, at high output powers non-linear distortion<br />
can dominate. Even though 802.15.4 selected a modulation and<br />
pulse shaping filter to yield a constant envelope, poor waveform<br />
quality and ACP degradation can be seen if the transfer function<br />
through the transmitter is non-linear.<br />
Device Characterisation<br />
To investigate the reported throughput issues a representative<br />
sample of Tyndall Motes [5] were tested. Figures 4 and 5 below,<br />
summarises a subsection of these results at 2.44 GHz and 2.47<br />
GHz respectively.<br />
EVM<br />
Six out of ten devices measured an EVM of greater than 20%.<br />
Simple link budget tests on these motes confirmed that for a given<br />
RSSI value the number of received good packet interrupts at the<br />
CC2420 was considerably less for the high EVM motes compared<br />
to the low EVM motes. It was also observed that the difference in<br />
performance between the high and low EVM motes was considerably<br />
less at 2.47 GHz compared to 2.44 GHz. This is in agreement<br />
with the EVM measured values in the figures below.<br />
Closer inspection of the measurements above shows that<br />
there is a correlation between EVM, output power and ACPR. As<br />
the ACPR is degrading with EVM, this is an indication that the<br />
degradation in EVM was due to a linearity issue rather than a random<br />
noise source. Further experiments were conducted to test<br />
this theory. Figure 6 below plots the output power back off against<br />
EVM. One can see that the EVM improves considerably once<br />
the power is backed off relative to the maximum output power.<br />
This was presented as further indication that the root cause of the<br />
problem was linearity rather than noise. If the ACP was dominated<br />
Fig. 6. EVM v Power Back-Off<br />
Rys. 6. EVM w funkcji Power Back-Off<br />
by noise (e.g thermal or phase) there would not be such an improvement<br />
at back off.<br />
Note that at the lowest power levels, below approximately -20<br />
dBm, the EVM gracefully degrades. This is due to the noise floor<br />
of the device beginning to dominate the EVM.<br />
Having established a correlation with linearity, the next step<br />
was to establish the source. There are a number of possibilities<br />
that all tend to be associated with the output matching and balun<br />
circuitry. The investigation focused on the output matching and<br />
balun as this is the only part of the design external to the RFIC<br />
that could influence the linearity.<br />
S11 (Output Return Loss)<br />
To determine whether the device is seeing the correct load impedances,<br />
a simple S11 measurement was taken using a vector<br />
network analyser and a 1 port calibration. Figure 7 below shows<br />
a typical plot of a high EVM mote (Mote 35) against a low EVM<br />
mote (Mote 30). To simplify the measurement, the RFIC is switched<br />
Fig. 4. Device characterization at 2.44 GHz<br />
Rys. 4. Charakterystyka elementu na częstotliwości 2.44 GHz<br />
Fig. 7. S11 for motes 30 and 35<br />
Rys. 7. S11 dla mote 30 i 35<br />
<strong>Elektronika</strong> 1/<strong>2<strong>01</strong>2</strong> 15
to receive mode. As the matching circuit and balun is common to<br />
both modes, it was concluded that this would give an indication<br />
of a correlation of matching impedance between the two types<br />
of motes. It is observed that the return loss is lower for the high<br />
EVM mote and that the return loss is better at higher frequencies<br />
due to the tuning being centered high in frequency. From these<br />
results it was ascertained that all the high EVM motes were tuned<br />
to a higher frequency compared with low EVM Motes.<br />
Even though this is a measure of Rx S11, this may indicate<br />
the path to ground is different between each mote type and that<br />
the impedance difference must be somewhere common to both<br />
Tx and Rx possibly the connection from the transceiver ground<br />
puck to the PCB.<br />
Measurement Summary<br />
Table 2 below summarises the correlation between the measurements<br />
at 2.44 GHz. The values presented are the average of<br />
the 6 Low throughput motes and the average of the 4 expected<br />
throughput motes. Note how the output power alone does not reveal<br />
the throughput issue.<br />
Tab. 2. Measurement overview<br />
Tab. 2. Wyniki pomiarów<br />
16<br />
Description Good Mote Poor Mote<br />
Throughput Expected Low<br />
EVM 3% 43%<br />
ACP1 -33dBc -28dBc<br />
ACP2 -48dBc -43dBc<br />
Tuning Centre 2.54 GHz 2.58 GHz<br />
Output Power 0dBm ± 3dB 0dBm ± 3dB<br />
The test results show correlation between EVM, ACP, high<br />
tuning centering and power back off with poor throughput. This<br />
combination seems to indicate a linearity, that, given the constant<br />
envelope nature of the waveform was rather surprising.<br />
The CC2420 [7] is highly integrated and the only external components<br />
that affect the RF are the matching and balun circuit. After confirming<br />
that the matching and balun circuit was identical between the<br />
high and low throughput motes it was concluded that the only other<br />
possible variable was the grounding of the RFIC to the PCB ground.<br />
Grounding<br />
A number of high and low EVM parts were removed from the PCB<br />
and an example of each type is shown in Figures 8 and 9 below.<br />
Fig. 8. Low EVM PCB and RFIC. Rys. 8. PCB i RFIC z niskim EVM<br />
Fig. 9. High EVM PCB and RFIC. Rys. 9. PCB i RFIC z wysokim EVM<br />
From Figure 8 above although the solder connection is not<br />
perfect it has good solder wetting over 70% of its surface area.<br />
Also noteworthy was that it took over 5 minutes to remove the part<br />
from the board, using a fine nozzle heat gun.<br />
This part in Figure 9 above clearly had a very poor ground connection.<br />
It also only took a few seconds to remove from the PCB.<br />
Neither the ground puck on the IC or the ground plane on the PCB<br />
exhibited a shiny solder finish normally associated with a good joint.<br />
In this case only part of the PCB surface had solder coverage. The<br />
solder joint was dry in the portion of the ground area it did cover.<br />
This would mean that the device connection to ground would differ<br />
significantly from its model used in design. Thus we see a shift in<br />
frequency of the S11 response from optimum and poor linearity.<br />
Conclusion<br />
It has been demonstrated that measurement of output power<br />
alone may not be enough to determine whether the RF design<br />
is performing to specification. It is possible to get both expected<br />
output power and degraded performance at the same time.<br />
It was found that the existing ACPR measurement definition<br />
defined in 802.15.4 was not sensitive enough to detect changes<br />
in linearity. So a new ACPR measurement was defined that was<br />
more sensitive to linearity degradation.<br />
It is proposed that the quality of the grounding of the CC2420<br />
to the ground pad on the PCB has significant impact on the performance.<br />
Although the data seems to indicate that this relates to<br />
linearity there are two parameters that contradict this view.<br />
i. 802.15.4 uses a constant envelope modulation scheme that is<br />
designed to be very robust to non-linear transfer functions.<br />
ii. There is a clear correlation between the tuning centering and<br />
a high and low throughput mote, EVM and ACP. It should be<br />
noted that the return loss is measured in receive mode and so<br />
is only indicative of an impedance shift in Tx mode. Currently<br />
it is only assumed that in Tx mode the change in impedance is<br />
large enough to cause such a degradation.<br />
It is also shown that monitoring of output power alone may<br />
not reveal grounding issues with the RFIC and that the EVM can<br />
be as poor 50% in these circumstance thus degrading BER and<br />
throughput. Evaluation of the linearity and waveform quality parameters<br />
should be undertaken to ensure the integrity of the build.<br />
Further analysis and measurements are required to confirm the<br />
hypothesis presented in this paper.<br />
The authors would like to acknowledge the support of Enterprise<br />
Ireland, the EU commission through the ME3GAS project. The<br />
authors would also like to acknowledge the support by Science<br />
Foundation Ireland under grant 07/CE/I1147.<br />
References<br />
[1] IEE Std 802.15.4, IEEE Standard for Information Technology – Telecommunication<br />
and information exchange between systems – Local<br />
and metropolitan networks – Specific requirements, Part 15.4<br />
Wireless Medium Acces Control (MAC) and Physical control Layer<br />
(PHY) Specifications for Low-Rate Wireless Personal Area Networks<br />
(WPANS)<br />
[2] Rishad Ahmed Shafik., Md. Shahriar Rahman.: AHM Razibal Islam.,<br />
On the Extended Relationships Among EVM, BER and SNR as<br />
Performance Metrics, 4 th International Conference on Electrical and<br />
Computer Engineering, IECE 2006, 2006, pp. 408–411.<br />
[3] National Instruments., The Basics of Zigbee Transmitter Testing, National<br />
Instruments White Paper, 2006, pp. 1–17.<br />
[4] TAN Xiao-heng., LI Teng-jiao., EVM simulation and analysis in digital<br />
transmitter, The Journal of China Universities of Posts and Telecommunications,<br />
issue 6, Dec 2009, pp. 43–48.<br />
[5] O’Flynn B., Lynch A., Aherne K., Angove P., Barton J., Harte S.,<br />
O’Mathuna C., Diamond D., Regan F.: The Tyndall Mote. Enabling<br />
Wireless Research and Practical Sensor Application Development,<br />
SourceAdvances in Pervasive Computing 2006 Adjunct Proceedings<br />
of Pervasive, Vol. 207, 2006, pp. 21–26.<br />
[6] Hassan R., Flaherty M., Matreci R., Taylor M.: Effective Evaluation<br />
of Link Quality Using Error Vector Magnitude Techniques, Proc IEEE<br />
Wireless Communications Conference, 1997, pp. 89–94.<br />
[7] CC2420 Data sheet. http://focus.ti.com/docs/prod/folders/print/<br />
cc2420.html<br />
<strong>Elektronika</strong> 1/<strong>2<strong>01</strong>2</strong>
Numerical study of the interface heat transfer<br />
characteristics of micro-cooler with CNT structures<br />
(Analiza numeryczna transferu ciepła przez interfejs mikro-radiatora<br />
ze strukturami CNT)<br />
Ph.D Yan Zhang 1) , M.Sc. Shun Wang 1) , Ph.D Shiwei Ma 1) , M.Sc. Zhili Hu 1) ,<br />
Ph.D Johan Liu 1, 2) , Ph.D Janusz Sitek 3) , M.Sc.Eng. Kamil Janeczek 3)<br />
1)<br />
Key Laboratory of Advanced Display and System Applications, Ministry of Education & SMIT Center, School<br />
of Mechatronics Engineering and Automation, Shanghai University, China<br />
2)<br />
SMIT Center & Bionano Systems Laboratory, Department of Microtechnology and Nanoscience, Chalmers University<br />
of Technology, Gothenburg, Sweden, 3) Tele and Radio Research Institute, Warsaw<br />
With the continuously increasing packaging density in electronic<br />
products, the system ability to dissipate heat loads has become<br />
a concern in the overall performance. Some novel cooling techniques<br />
have emerged to meet the thermal management requirements<br />
of high power microelectronics components and devices.<br />
Micro cooling, including micro-pin-fin, micro-channel and so on,<br />
provides a promising solution for high-powered electronics.<br />
Meanwhile, carbon nanotubes (CNTs) have shown advantages<br />
in material properties such as the electrical conductivity [1],<br />
[2], the thermal conductivity [3], [4] and the mechanical properties<br />
[5], [6]. CNTs can be used as the micro-cooler construction due to<br />
the excellent thermal conductivity [7]. A micro-channel cooler with<br />
vertically aligned CNT arrays had been developed [8], [9], where<br />
the CNT structures were employed as channels inside to enhance<br />
the heat transfer. And experimental measurement had also been<br />
carried out to evaluate the overall heat removal capability of the<br />
CNT-based micro-cooler. Beside experimental works, the macroscopic<br />
heat transfer characteristics of the micro-channel heat<br />
sinks with carbon nanotubes were also studied numerically [10],<br />
[11], in which parameters such as the inlet velocity, the heating<br />
power, the CNT structure size as well as the flow field and the<br />
temperature distribution were analyzed.<br />
The most widely used fabrication method to obtain aligned<br />
CNTs is the thermal or plasma-enhanced chemical vapour deposition<br />
(CVD). During the process, the carrier substrate typically<br />
needs to be heated up to approximately 700°C or even higher.<br />
Such a high temperature is not compatible with most of the temperature-sensitive<br />
components or devices. A transfer method was<br />
proposed as a solution to this problem, in which the pre-prepared<br />
CNT forest could be transferred onto the target surface at a low<br />
temperature so that the integration of the CNTs into various device<br />
and material processes became feasible [12]. The adhesives<br />
with designed pattern have shown successful transfer.<br />
For a CNT-based micro-cooler with liquid coolant, there appear<br />
various interfaces, such as the one between the CNT and the<br />
coolant or the adhesive. The interfacial resistance was expected<br />
to be more important in the nano-composites than in the traditional<br />
composites since the interfacial density was higher [13]. In the<br />
present paper, numerical investigations on the thermal resistance<br />
across interfaces between the CNT and its surrounding materials<br />
involved in micro-cooler are carried out by molecular dynamics<br />
simulation (MDS), and various cases are studied.<br />
MDS model<br />
The interface thermal resistance values of carbon nanotubes<br />
embedded in various materials was found to range from<br />
0.76 × 10 -8 to 20.0 × 10 -8 m 2 K/W [14]. As for the micro-cooler<br />
with CNT structures inside, there exist interfaces between CNT<br />
and other materials. In the MDS, a (5,5) armchair single-walled<br />
carbon nanotube (SWCNT) is used, and matrices of different<br />
materials are then constructed to embed the CNT inside. Heat<br />
flux is prescribed to the system and temperature field can be<br />
obtained.<br />
According to the simulated temperature field, there appears an<br />
obvious temperature gradient in the interface region. This indicates<br />
that the dominating thermal resistance is associated with the conduction<br />
in the interface area. As shown in Fig. 1, the involved atoms<br />
belonging to the CNT and the material adjacent to the nanotube<br />
surface are marked with green and red spheres, respectively.<br />
Fig. 1. Sketch of the atom<br />
selection in calculation<br />
Rys. 1. Szkic atomów wybranych<br />
do obliczeń<br />
The thermal resistance R th<br />
due to the interface can be calculated<br />
by the temperature gradient at the interface with expression as:<br />
R ∆<br />
T<br />
=<br />
th Q<br />
/<br />
A<br />
where T is the temperature drop across the interface, Q/A is heat<br />
flux in which Q is the heat power and A is the interfacial area.<br />
Simulation results and analysis<br />
As for the micro-cooler with CNT structures, the thermal resistances<br />
at interface between CNT and other materials are taken into<br />
consideration.<br />
CNT-water interface<br />
Water was adopted as the cooling medium in the micro-channel<br />
cooler [8], [9], as described in previous experiment, so the interface<br />
heat transfer of the CNT-water case is studied firstly in the<br />
present work. Fig. 2 shows the structure adopted in MDS.<br />
Fig. 2. CNT-water structure in MDS<br />
Rys. 2. Struktura CNT-woda w MDS<br />
<strong>Elektronika</strong> 1/<strong>2<strong>01</strong>2</strong> 17
Non-equilibrium molecular dynamics (NEMD) method is used<br />
and the adaptive intermolecular reactive empirical bond order<br />
(AIREBO) potential energy function is applied for the CNT in the<br />
constructed model.<br />
The thermal resistance of the CNT-water interface calculated<br />
to is about 14.69 × 10 -8 Km 2 /W. The value is closed to the one<br />
obtained in ref. [15], where the thermal boundary resistance of<br />
SWCNT-water is estimated to be 12.2 × 10 -8 Km 2 /W.<br />
CNT-epoxy interface<br />
As for the micro-cooler with CNT structures by transfer technique,<br />
the carbon nanotubes were mounted onto the target surface by<br />
means of adhesive. In addition to be exempted from high temperature,<br />
the component/device can also obtain an improved joint<br />
strength of CNTs and the cooler substrate. The thermal characteristics<br />
of the CNT-adhesive interface introduced by the transfer<br />
are studied.<br />
The epoxy used in the present work is DGEBA (diglycidyl<br />
ether of bisphenol-A), as shown in Fig. 3a. Before the simulation<br />
of thermal resistance at the interface between CNT and the epoxy<br />
matrix, the thermal conductivity of the epoxy itself is calculated.<br />
The epoxy matrix is constructed, and the non-equilibrium molecular<br />
dynamics (NEMD) method is adopted. A heat-injection<br />
method is used, where a constant heat rate is added to one end<br />
of the computation area and removed at the other end. Periodic<br />
boundary condition is used in the simulation. After the system<br />
reaches a steady state, the temperature gradient is obtained and<br />
the thermal conductivity can be calculated. The thermal conductivity<br />
of the epoxy matrix is about 0.170 W/mK, and this value is<br />
applied in the following CNT-epoxy simulation.<br />
Then the epoxy matrix with a CNT embedded is constructed.<br />
Two steps are adopted: Firstly, the epoxy matrix is constructed<br />
with a volume 40 × 40 × 28Å 3 ; Secondly, the CNT with a length of<br />
28Å was immersed into the center of the epoxy matrix. The obtained<br />
the CNT-epoxy structure in MDS is shown in Fig. 3b.<br />
The thermal resistance of the CNT-epoxy interface is calculated<br />
at 300K, and the obtained values are 1.0–1.5 × 10 -8 Km 2 /W.<br />
The values shows quite good agreement with the value<br />
2.6 ± 0.9 × 10 −8 Km 2 /W obtained by Bryning [5].<br />
Furthermore, the polymer network is considered. As shown in<br />
Fig. 4, for example, DGEBA can form a network when reacts with<br />
MDA (Methylene Diamine Dianilene). Cross-links are generated<br />
during the molecule reactions so that the polymer networks come<br />
into being.<br />
As the polymer is a network structure, it is difficult to ‘insert’<br />
a carbon nanotube into the polymer. So the surface of the CNT<br />
is treated as plane-shaped instead of a tube. Namely a piece of<br />
graphene was used instead of a carbon nanotube in the simulation.<br />
This is reasonable as a carbon nanotube can be regarded as<br />
rolling up a graphene sheet.<br />
The system is kept at a constant atoms number, pressure and<br />
temperature. In order to decrease the gap between the carbon<br />
nanotube/graphene and the polymer, a higher pressure is used.<br />
In order to get a reasonable distance between the polymer and<br />
the graphene, the pressure in the x- and y- direction are couple<br />
together, while at the z – direction it is set to be independent.<br />
The size of the computational cell was stable at 19.98Å ×<br />
18.46Å × 62.1Å. The bottom area of the simulation cell equals to<br />
that of the grapheme. The distance between the polymer and the<br />
graphene is about 2.1Å. The period boundary condition is applied<br />
to this system.<br />
The thermal resistance at the interface between the carbon nanotube<br />
and the polymer was calculated, and the value is 33.262<br />
× 10 -8 m 2 K/W. This interface resistance is quite high compared<br />
with the one of CNT-epoxy, and reason might be that the space<br />
between the polymer network and the graphene is overcalculated<br />
or the conductance between them is underestimated.<br />
a) The network structure of the polymer<br />
Fig. 3. CNT-Epoxy structure in MDS<br />
Rys. 3. Struktura CNT-klej epoksydowy w MDS<br />
In the molecular dynamics simulation of the heat transfer<br />
across the CNT-epoxy interface, the computational domain<br />
is constructed as a rectangular cell. The periodic boundary condition<br />
is applied over the cell of the CNT-epoxy structure in MDS<br />
so that the simulation results are usable for the adhesive layer<br />
involving CNT bundles.<br />
The simulation is then carried out under the condition of a canonica<br />
ensemble (NVT), while constant valence force field (CVFF)<br />
is applied to evaluate the inter-atomic potentials. When the temperature<br />
is stable at 165K, the simulation is performed under a microcanonical<br />
ensemble (NVE). By means of the Bredensen thermostat,<br />
the system is stabilized at ambient temperature of 300K.<br />
18<br />
b) Geometry of CNT and polymer matrix<br />
Fig. 4. CNT-polymer structure in MDS<br />
Rys. 4. Struktura CNT-polimer w MDS<br />
<strong>Elektronika</strong> 1/<strong>2<strong>01</strong>2</strong>
Conclusions<br />
For the CNT-based micro-cooler, the heat transfer between the<br />
CNT and its surrounding material is essential for the effective heat<br />
dissipation as the interface presents a barrier to the heat flow<br />
and will affect the thermal dissipation from the powered chip or<br />
devices to the cooler. Therefore, the interface characteristics are<br />
studied in the present paper.<br />
Molecular dynamics simulations have been carried out to obtain<br />
the thermal resistance across the interfaces of CNT-coolant<br />
and CNT-adhesive. And cases including the CNT in the water, the<br />
CNT in the epoxy matrix, as well as the CNT-polymer network one<br />
between the CNT and the adhesive are simulated. The obtained<br />
results of interface heat transfer can provide information for evaluating<br />
the thermal performance of the CNT-based micro-cooler.<br />
This work was supported by the National Natural Science Foundation<br />
of China (10702037). Support by China-Poland Scientific<br />
and Technology Cooperation Committed (No. 34–11) and Innovation<br />
Program of Shanghai Municipal Education Commission<br />
(12YZ006) were also appreciated.<br />
References<br />
[1] Foygel M., Morris R. D., Anez D., French S., Sobolev V. L.: Theoretical<br />
and Computational Studies of Carbon Nanotube Composites and<br />
Suspensions: Electrical and Thermal Conductivity”, Physical Review<br />
B, Vol. 71, No.10, pp. 1042<strong>01</strong>, 2005.<br />
[2] Martin C. A., Sandler J. K. W., Shaffer M. S. P., Schwarz M. K.,<br />
Hauhofer Q., Schulte K., Windle A. H., „Formation of Percolating Networks<br />
in Multi-Wall Carbon-Nanotube-Epoxy Composites”, Composites<br />
Science and Technology, Vol. 64, pp. 2309–2316, 2004.<br />
[3] Duong H. M., Papavassiliou D. V., Lee L. L., Mullen K. J., „Random<br />
Walks in Nanotube Composites: Improved Algorithms and the Role<br />
of Thermal Boundary Resistance”, Applied Physics Letters, Vol. 87,<br />
pp. <strong>01</strong>31<strong>01</strong>, 2005.<br />
[4] Bryning M. B., Mikie D. E., Islam M. F., Kikkawa J. M., Yodh A. G.,<br />
„Thermal conductivity and interfacial resistance in single-wall carbon<br />
nanotube epoxy composites”, Applied Physics Letters, Vol. 87, 2005,<br />
pp. 161909.<br />
[5] Lau K. T., „Interfacial bonding characteristics of nanotube/polymer<br />
composites”, Chemical Physics Letters, Vol. 370, pp. 399–405,<br />
2003.<br />
[6] Zhu R., Pan E., Roy A. K., „Molecular Dynamics Study of the Stressstrain<br />
Behavior of Carbon-nanotube Reinforced Epon 862 Composites”,<br />
Materials Science and Engineering A, Vol. 447, 2007,<br />
pp. 51–57.<br />
[7] Xu Y., Zhang Y., Suhir E., Wang X., „Thermal Properties of Carbon<br />
Nanotube Array Used for Integrated Circuit Cooling”, Journal of Applied<br />
Physics, Vol. 100, 2006, pp. 074302.<br />
[8] Mo Z., Morjan R., Anderson J., Campbell E. E. B., and Liu J., „Integrated<br />
Nanotube Microcooler for Microelectronics Applications”,<br />
Proceedings of 55th Electronic Componenets and Technology Conference,<br />
Florida, USA, May-June 2005, pp. 51–54.<br />
[9] Wang T., Jonsson M., Nystrom E., Mo Z., Campbell E.B. and Liu<br />
J., „Development and Characterization of Microcoolers using Carbon<br />
Nanotubes”, Proceedings of 1st Electronics Systemintegration<br />
Technology Conference, Dresden, Germany, September 2006,<br />
pp. 881–885.<br />
[10] Zhong X., Fan Y., Liu J., Zhang Y., Wang T., and Cheng Z., A Study<br />
of CFD Simulation for On-chip Cooling with 2D CNT Micro-fin Array’’,<br />
Proceedings of the 2007 International Symposium on High Density<br />
Packaging and Microsystem Integration, Shanghai, China, June<br />
2007, pp. 442–447.<br />
[11] Wang S., Zhang Y., Fu Y., Liu J., Wang X., Cheng Z., „A Study of<br />
the Heat Transfer Characteristics of the Micro-Channel Heat Sink’’,<br />
Proceedings of 2009 International Conference on Electronic Packaging<br />
Technology and High Density Packaging, Beijing, China, August<br />
2009, pp. 255–259.<br />
[12] Wang T., Carlberg B., Jonsson M., Jeong G. H., Campbell E. E. B.<br />
and Liu J., „Low Temperature Transfer and Formation of Carbon Nanotube<br />
Arrays by Imprinted Conductive Adhesive’’, Applied Physics<br />
Letters, Vol. 91, No. 9, 2007, pp. 093123.<br />
[13] Shenogin S., Xue L., Ozisik R., Keblinski P., „Role of thermal boundary<br />
resistance on the heat flow in carbon-nanotube composite”. Journal<br />
of Applied Physics, Vol. 95, No. 12, 2004, pp. 8136–8144.<br />
[14] Unnikrishnan V. U, Banerjee. D, Reddy J. N., „Atomistic-mesoscale<br />
interfacial resistance based thermal analysis of carbon nanotube<br />
systems”. International Journal of Thermal Sciences, Vol. 47, 2008,<br />
pp. 1602–1609.<br />
[15] Maruyama S., Igarashi Y., Shibuta Y., Molecular dynamics simulations<br />
of heat transfer issues in carbon nanotubes, the 1 st international symposium<br />
on micro & nano technology, Hawaii, USA, March 14–17, 2004.<br />
Device for road holes and obstacles detection<br />
(Urządzenie do rozpoznawania dziur oraz przeszkód na drodze)<br />
mgr. Wojciech Gelmuda, prof. dr hab. inż. Andrzej Kos<br />
AGH University of Science and Technology Department of Electronics, Kraków<br />
Today’s life as we know it is based on visual signs. Practically all<br />
the important information needed to go independently through an<br />
average person’s day is provided by their sight. Let us focus on<br />
some urban environment. A person is able to see objects, determine<br />
their approximate distance, distinguish between a hole and<br />
a bump on a road, detect and recognize an important element<br />
from its background or simply read some text information from<br />
books, posters, etc. Most of these actions, if not all, allow people<br />
to gather information and give them time to react before they approach<br />
some objects. Furthermore, there are many devices that<br />
help people gain more important for them information than they<br />
would be able to learn from a closest environment in their field of<br />
view, such as navigation systems. There are also many devices<br />
that help people keep safe and avoid some accidents, like for<br />
instance, street lights and road signs. But neither of them is well<br />
suited for visually impaired people. Of course, there are special<br />
audio signals for blind people near some pedestrian crossings<br />
and there are devices which help visual impaired people avoid<br />
obstacles [1], but they are still not sufficient to keep them safe<br />
and well informed about their surrounding environment [2]. This<br />
is mostly due to a change of sensors positions while a blind<br />
person is moving. That is why we develop a MOBIAN© project<br />
– Mobile Safety System for the Blind [3]. This project is supported<br />
by The National Centre for Research and Development<br />
under: NR13-0065-10. A part of the MOBIAN© project is to create<br />
a highly reliable device for detecting obstacles and holes<br />
of various length and depth, as it is presented in Fig. 1. There<br />
is no doubt that special algorithms have to be designed, tested<br />
and implemented for this purpose.<br />
Fig. 1. Holes and other obstacle detection<br />
Rys. 1. Wykrywanie dziur, uskoków oraz innych przeszkód<br />
<strong>Elektronika</strong> 1/<strong>2<strong>01</strong>2</strong> 19
While working on ultrasonic both transmitters and receivers<br />
[4] and employing them into a hole detection device based on<br />
a white stick [5], tests have shown that there were some minor<br />
difficulties with sensors vibrations caused by a while stick movement,<br />
especially when the white stick touched the ground. Therefore,<br />
this time an infrared beam will be implemented for a hole<br />
detection concept.<br />
This paper proposes the design of the holes and obstacles detection<br />
device and a software environment based on MatLab for<br />
testing holes detection algorithms, as a faster way to the project<br />
development.<br />
Basic concept<br />
The design of the holes and obstacles detection device is presented<br />
in Fig. 2. The device is controlled by a low-power microcontroller.<br />
A series of ultrasound transducers is used to assure<br />
the high reliability in detecting obstacles in a wide range when<br />
a blind person is walking. A custom made multichannel ultrasonic<br />
range finder was developed. The holes detection is done by an<br />
infrared range finder. Preliminary tests have shown that variable<br />
sensor position while a person is moving leads to inaccurate<br />
measurements which causes incorrect detections. That is why<br />
the measurements have to be corrected with a help of data from<br />
accelerometer and gyroscope. This is how the infrared beam is<br />
being stabilized by software. Small motor vibrators enabled by the<br />
microcontroller are informing a blind person about the danger.<br />
It is more simple to develop and debug electronic systems and<br />
algorithms where all signals come from the inside of the system<br />
and they are predictable and relatively easy to measure. The difficult<br />
part starts when signals come from the outside of the system,<br />
for instance, from sensors. In this project, regards to the holes detection,<br />
an input signal comes from an infrared beam that returns<br />
reflected from the ground ahead. Since neither models of environment<br />
nor electronic parts are perfect, it would not be reliable to<br />
develop and test algorithms for detecting holes in real-time environment.<br />
For the early stages of the MOBIAN© system design the<br />
software environment for testing holes detection algorithms is to<br />
be created based on MatLab. A basic concept is to create a software<br />
environment where imperfects on the road, e.g. holes, could<br />
be simulated. A simple movement of the sensor and of course<br />
distance measurement is to be implemented as well.<br />
For creating reliable test scenarios, a repeatable and self-acting<br />
test-bench has to be implemented. For this purpose, some<br />
environmental variables, such as a hole width, a hole length, and<br />
Fig. 2. Diagram of the holes and obstacles detection device<br />
Rys. 2. Schemat blokowy urządzenia do wykrywanie dziur, uskoków<br />
oraz innych przeszkód<br />
20<br />
a hole depth, have to be pseudorandomly generated. In each<br />
scenario a number of holes and their dimensions should be different.<br />
The whole software environment, aside from modeling a road<br />
and holes and a distance measurement, should be well suited for<br />
different kinds of algorithms. The advantage of using the MatLab<br />
environment instead of simply writing the simulator in one of the<br />
many high-level programming languages is that MatLab is already<br />
supported by a great number of mathematical functions, methods<br />
and algorithms. An implementation of new algorithms or testing<br />
the existing ones is not so complicated and time consuming.<br />
Simulations also have another advantage. One is able to test<br />
as many algorithms as they like on the same sample set without<br />
worrying that computations will take too much time and then new<br />
samples in a buffer will be overwritten. One can also pause and<br />
unpause a simulation.<br />
Due to the nature of the device, a maximum range of the ultrasonic<br />
scanner is over 3 m (a walking direction). That provides<br />
enough time for a blind person to react if some obstacle is detected.<br />
The multisensory approach makes it possible to detect obstacles<br />
placed on variable heights. A detection range is over 1.5 m<br />
(both vertical and horizontal direction). A sufficient ultrasonic scan<br />
interval is 0.5 s. The successful detection of the obstacles relies<br />
on the obstacles dimensions, geometry, material and distance between<br />
them and ultrasonic sensor [3]. However, even 1 cm metal<br />
squares are possible to be detected with the multichannel ultrasonic<br />
range finder. The infrared range finder maximum distance<br />
measurement is over 5 m. This allows to detect holes within the<br />
distance of 3 m. An infrared scan interval is less than 25 ms. The<br />
minimum dimensions of detected holes are determined by the algorithm<br />
which is employed in the device.<br />
Software modules<br />
The simulator consists of the following modules:<br />
– initialization module;<br />
– holes generation module;<br />
– distance computation module;<br />
– holes detection algorithms module;<br />
– display module;<br />
– report module.<br />
The initialization module starts the simulation. It creates environmental<br />
variables, such as, road and holes dimensions, number<br />
of holes, sensor start position, etc.<br />
The hole generation module uses a pseudorandom algorithm<br />
to create holes on the road. One can determine minimal and<br />
maximal dimensions of holes as well as minimal and maximal dimensions<br />
of spaces between them. The algorithm also makes<br />
sure that all holes fit in the defined road area. Another important<br />
issue is that one can set the initial road length. This dimension<br />
defines a hole-free space between an infrared dot starting position<br />
and a first hole. This feature will help to show some flaws in<br />
algorithms.<br />
The distance computation module uses mathematical methods<br />
to calculate the current location of an infrared dot and put it<br />
onto a shape of the road.<br />
The holes detection algorithms module is a module where one<br />
or more algorithms can be implemented and tested. It contains<br />
a detection matrix where algorithms puts theirs results. The matrix<br />
is shared among other modules.<br />
The display module makes it possible to visualize the progress<br />
and computation results. The visualization of data can be done in<br />
a 3D isometric view or in a 2D plane view. For the clarity of the<br />
visualization one may choose how big the part of the road should<br />
be in view. Displaying an image in MatLab takes time, especially<br />
if it is done from a big matrix. Therefore, the display module is<br />
created as a function, so it could be called out whenever we want.<br />
It is wise to visualize the data only if necessary, e.g. when debugging<br />
or if an important event occurs (hole not detected) and additionally,<br />
when the simulation starts and ends.<br />
<strong>Elektronika</strong> 1/<strong>2<strong>01</strong>2</strong>
Fig. 3. Simulation flowchart. Rys. 3. Schemat symulatora<br />
The report module creates statistics. Final results of the simulation<br />
are displayed at the end. Results contain data about generated<br />
holes, the number of detected holes by each algorithm.<br />
One can also put there some other information, such as, the<br />
average distance between the sensor and the beginning of detected<br />
holes, dimensions and location of undetected holes, etc.<br />
Some debug information and warnings could be also included<br />
in the report.<br />
The simulator flowchart is presented in Fig. 3. When the simulation<br />
starts, all constants and variables are initiated. Next, a road<br />
and holes in it are being created with regard to parameters one<br />
put. Then, the first distance computation, a starting position and<br />
an angle of an infrared beam are being connected to the road.<br />
A visualization is an optional step. The following computations are<br />
being done till the end of the road. After each iteration the holes<br />
detection algorithms module is activated and results are being put<br />
into a result matrix, errors may be displayed if occurred. One can<br />
enable the current view display. In the end, a summarized report<br />
is being displayed and the simulation stops.<br />
Results<br />
Various algorithms for detecting holes had been designed or modified<br />
and then tested. Algorithms based on median calculations<br />
with a memory effect (ones that analyze measurements from longer<br />
period of time) have problems with detecting short holes, but<br />
thanks to the inertial effect, there are less wrong-hole-detection<br />
glitches. Algorithms that check only the last few measurement<br />
samples have better detected to undetected holes ratio, but the<br />
mentioned above glitches could get a blind person confused. The<br />
good way is to use several algorithms simultaneously.<br />
A prototype of the device is being constructed. Tested algorithms<br />
are going to be implemented into the device, adjusted and<br />
optimized. Efficiency of holes detection will be compared with<br />
simulations results.<br />
In simple simulations a source of an infrared beam moves only<br />
along the road axis. A horizontal (the road width) and vertical (the<br />
height) position is fixed. When a person with attached sensors is<br />
moving, a real source of infrared beam moves in three directions.<br />
The infrared beam changes its position constantly. This influences<br />
a hole detecting algorithms performance. To minimize this effect,<br />
a accelerometer and a gyroscope is implemented. This data<br />
is more helpful in advanced simulations. Also, sometimes during<br />
walking some accidental shakes may occur, such as when a person<br />
suddenly stops or a person is poked. Having the knowledge<br />
about these shakes is a way to avoid some potentially false data<br />
from distance measurement sensors.<br />
The simulator is operational. Some hole detection algorithm<br />
has been implemented. Right now its computation is only based<br />
on a current distance between an infrared beam and a road. The<br />
holes generation module works fine. One can choose if a current<br />
road, a sensor and an infrared dot placement should be displayed<br />
either after every computation iteration, after selected distance<br />
step or only when simulation starts and ends. A sample both 3D<br />
and 2D road display is shown in Fig. 4.<br />
Fig. 4. Sample simulator visualizations<br />
Rys. 4. Przykładowe wizualizacje<br />
symulacji<br />
References<br />
[1] Dakopoulos D., N. G. Bourbakis: Wearable obstacle avoidance electronic<br />
travel aids for blind: a survey. IEEE Transactions on Systems,<br />
Man, and Cybernetics, Part C: Applications and Reviews, volume 40,<br />
issue 1, 25–35 (2<strong>01</strong>0).<br />
[2] Boroń K., W. Gelmuda, A. Kos: Mobile Safety System for the Blind.<br />
ELTE 2<strong>01</strong>0, IMAPS-CPMT: 10th electron technology conference and<br />
34th international microelectronics and packaging, Wrocław, 22–25<br />
September 2<strong>01</strong>0.<br />
[3] Gelmuda W., A. Kos: Możliwości detekcyjne piezoelektrycznych czujników<br />
ultradźwiękowych 40STR-XX w powietrzu. Prace <strong>Instytut</strong>u<br />
Elektrotechniki, ISSN 0032-6216, t. 57 z. 246 s. 133–141, 2<strong>01</strong>0.<br />
[4] Andň B., S. Graziani: Multisensor Strategies to Assist Blind People:<br />
A Clear-Path Indicator. IEEE Transactions on Instrumentation and<br />
Measurement, vol. 58, no. 8, August 2009.<br />
[5] Gelmuda W., A. Kos: Ultrasonic white stick for detecting holes for<br />
blind people. <strong>Elektronika</strong> – konstrukcje, technologie, zastosowania,<br />
ISSN 0033-2089, nr 10 s. 141–143, Warszawa, 2<strong>01</strong>0.<br />
<strong>Elektronika</strong> 1/<strong>2<strong>01</strong>2</strong> 21
Metal – oxide sensor array for gas detection<br />
(Matryca sensorów na bazie tlenków metali do detekcji gazów)<br />
mgr inż. Patryk Gwiżdż, dr inż. Andrzej Brudnik, dr hab. inż. Katarzyna Zakrzewska<br />
AGH University of Science and Technology, Faculty of Electrical Engineering, Automatics, Computer Science<br />
and Electronics, Kraków<br />
Resistive-type semiconducting gas sensors based on metal oxides<br />
are convenient and relatively cheap devices used for detection<br />
of reducing and oxidizing gases. It is well-known that except<br />
for their high sensitivity, their largest drawback is the lack of selectivity.<br />
Such sensors cannot distinguish between different gases of<br />
the same type, e.g. hydrogen and methane because their dynamic<br />
responses look similar. However, this cross-sensitivity, manifesting<br />
itself as a non-zero sensor response to interfering gases,<br />
is used to advantage in arrays of gas sensors or electronic noses<br />
[1–2]. Application of pattern recognition schemes (PARC) allows<br />
for classification and recognition of particular components of the<br />
analyzed gas mixture and volatile organic compounds (VOCs)<br />
[3–6]. Vast research field of classification based on this idea has<br />
been established in the 80 ties of 20 th century and a new type of<br />
device called: electronic nose has been proposed [1]. The electronic<br />
noses are mainly designed to detect and recognize VOCs<br />
responsible for smell [7]. Although commercial devices are now<br />
available, there is still a need to create miniaturized portable systems.<br />
The aim of this work was to design and construct an array of<br />
resistive-type semiconducting sensors dedicated to detection and<br />
recognition of components of a gas mixture especially hydrogen<br />
and ammonia. Detection of these gases becomes increasingly<br />
important for their use in automotive industry (ammonia) [8] and<br />
fuel cells (hydrogen) [9].<br />
One of the most important requirements for the supporting<br />
electronic system is its flexibility understood as a simplicity of<br />
reconfiguration in the case of changing number of sensors. The<br />
analog part of the system had to be constructed in such a way<br />
that it should provide adaptable measuring range for each sensor<br />
individually. The created system would constitute a base for implementation<br />
of new sensors based on nanomaterials.<br />
Experimental set up<br />
The sensor array was built from six commercial metal oxide gas<br />
sensors, humidity and temperature detectors. All chosen gas sensors<br />
have different specifications, i.e., should be primary used for<br />
the following targets: ammonia, hydrogen, hydrocarbons, alcohol,<br />
air pollution and explosive gases and are destined to operate at<br />
the heater voltage of 5 V. Schematic diagram of the gas detection<br />
system designed and assembled by the authors of this work is<br />
shown in Fig. 1. The system consists of the sensor array placed<br />
in the measuring chamber, gas flow controllers, electronic measuring<br />
and control unit and a PC with a dedicated software.<br />
Concentration of the detected gas in the measuring chamber<br />
can be changed in a step-like way. Gas flow is set and measured<br />
separately for each detected gas as well as for the reference<br />
(synthetic air). All signals from the sensors are recorded by the<br />
electronic measuring and control unit built by the authors.<br />
The measuring system is based on the STM32F103 microcontroller<br />
family. The innovative approach consists in the system<br />
architecture. Each gas sensor is operated by its own measuring<br />
and control module containing analog measuring part, power control<br />
circuit of the sensor heater and microcontroller based digital<br />
part. All modules are connected to the CAN bus which allows for<br />
data transfer between them creating a sensor network. As shown<br />
schematically in Fig. 2, one module communicates with the computer<br />
transferring data from all the modules to a PC.<br />
22<br />
Fig. 1. Schematic diagram of the constructed gas detection system<br />
Rys. 1. Schemat skonstruowanego systemu do detekcji gazu<br />
Gas sensor no. 1<br />
and measuring module<br />
Gas sensor no. 6<br />
and measuring module<br />
Humidity, temperature<br />
sensors<br />
PC computer and<br />
dedicated software<br />
CAN Bus<br />
Fig. 2. Modular representation of the constructed electronic system<br />
Rys. 2. Schemat blokowy skonstruowanego systemu elektronicznego<br />
For the designed array and the electronic system a dedicated<br />
PC computer software has been written in the Microsoft Visual<br />
C++ with the aim to facilitate data acquisition and analysis of the<br />
response of each sensor in the array.<br />
An independent change in the supply voltage of each sensor<br />
has been made possible. This affects the temperature of the sensing<br />
layer, the most important factor that determines the sensing<br />
parameters and responses. Thanks to the independent temperature<br />
change of each sensor, the sensitivity and selectivity can be<br />
optimized.<br />
It is well known that humidity variation influences responses<br />
of the resistive-type semiconducting gas sensors based on metal<br />
oxides [10]. Therefore, continuous monitoring of the humidity level<br />
and temperature was provided by the relevant sensors placed<br />
directly in the measuring chamber.<br />
<strong>Elektronika</strong> 1/<strong>2<strong>01</strong>2</strong>
In order to demonstrate to what extent these sensors are nonselective,<br />
the responses to a certain gas concentration of all the<br />
sensors in the array are drawn as radar plots in Figs. 5, 6, 7 and<br />
8. The worst scenario is presented in Fig. 5. Five of six sensors<br />
are almost equally sensitive to ammonia. Weak responses are<br />
obtained with hydrocarbons sensor. On the other hand, as indicated<br />
by the results in Fig. 6, the ammonia and alcohol sensors are<br />
less sensitive to hydrogen than four other sensors.<br />
Fig. 3. Top view of the gas detection system: 1 – measuring chamber<br />
containing six metal oxide sensors; 2 – electronic measuring and<br />
control unit; 3 – gas flow controllers; 4 – gas flow meter; 5 – PC<br />
computer<br />
Rys. 3. Widok układu do detekcji gazów: 1 – komora pomiarowa zawierająca<br />
sześć czujników gazu na bazie tlenków metali; 2 – elektroniczny<br />
system kontrolno-pomiarowy; 3 – kontrolery przepływu gazu;<br />
4 – miernik przepływu gazu; 6 – komputer PC<br />
Results<br />
Designed and constructed array of sensors is shown in Fig. 3.<br />
The test performed comprised the measurements of the response<br />
as a function of:<br />
• gas type,<br />
• gas concentration,<br />
• humidity level,<br />
• heater voltage (temperature).<br />
The response S of a single resistive-type gas sensor has been<br />
defined as:<br />
∆<br />
R<br />
R<br />
−<br />
R<br />
0<br />
S<br />
=<br />
=<br />
(1)<br />
R<br />
R<br />
0 0<br />
where: R 0<br />
is the sensor resistance in the reference atmosphere<br />
(synthetic air), R denotes the sensor resistance in the presence<br />
of the target gas.<br />
The influence of the humidity on the sensor response is given<br />
in Fig. 4 for two particular detectors (explosive gases and air pollution)<br />
upon detection of hydrogen.<br />
Fig. 5. Radar plot indicating the responses of all six sensors in the<br />
array upon changes in the concentration of NH 3<br />
; heater voltage 5 V<br />
Rys. 5. Wykres biegunowy przedstawiający odpowiedzi wszystkich<br />
sześciu czujników zawartych w matrycy pod wpływem zmian koncentracji<br />
NH 3<br />
; napięcie zasilania grzejnika 5 V<br />
Fig. 6. Radar plot indicating the responses of all six sensors in the<br />
array upon changes in the concentration of H 2<br />
; heater voltage 5 V<br />
Rys. 6. Wykres biegunowy przedstawiający odpowiedzi wszystkich<br />
sześciu czujników zawartych w matrycy pod wpływem zmian koncentracji<br />
H 2<br />
; napięcie zasilania grzejnika 5 V<br />
Fig. 4. Response to hydrogen for the explosive gases and air pollution<br />
sensors under different levels of humidity<br />
Rys. 4. Odpowiedzi czujników gazów wybuchowych i czystości powietrza<br />
dla wodoru przy różnych poziomach wilgotności powietrza<br />
Fig. 7. Radar plot indicating the responses of all six sensors in the<br />
array upon changes in the concentration of CO 2<br />
; heater voltage 5 V<br />
Rys. 7. Wykres biegunowy przedstawiający odpowiedzi wszystkich<br />
sześciu czujników zawartych w matrycy pod wpływem zmian koncentracji<br />
CO 2<br />
; napięcie zasilania grzejnika 5 V<br />
<strong>Elektronika</strong> 1/<strong>2<strong>01</strong>2</strong> 23
y humidity, therefore taking its influence into account is crucial<br />
for reliable gas recognition. The designed electronic measuring<br />
system enables further research and testing of new sensors<br />
based on nanomaterials. The biggest advantage of the system<br />
is its flexibility in respect to the number of the connected sensors<br />
achieved thanks to using the CAN bus and wide measuring range<br />
of the sensor response.<br />
Financial support from Polish Ministry of Science and Higher<br />
Education under AGH-University of Science and Technology<br />
grant no. 11.11.120.614 (Statutory project) for years 2<strong>01</strong>1–<strong>2<strong>01</strong>2</strong><br />
is acknowledged.<br />
Fig. 8. Radar plot indicating the responses of all six sensors in the<br />
array upon changes in the concentration of CO 2<br />
; heater voltage 4 V<br />
Rys. 8. Wykres biegunowy przedstawiający odpowiedzi wszystkich<br />
sześciu czujników zawartych w matrycy pod wpływem zmian koncentracji<br />
CO 2<br />
; napięcie zasilania grzejnika 4 V<br />
Quite pronounced effect of the voltage supplying the sensor<br />
heater on the selectivity of responses to CO 2<br />
is seen when comparing<br />
the radar plots in Figs. 7 and 8. By lowering the voltage<br />
from 5 V to 4 V, what in consequence leads to a decrease in the<br />
operating temperature, all but two gas sensors become insensitive<br />
to CO 2<br />
. The best response is obtained for the explosive gas<br />
sensor according to expectations. Hydrogen sensor is very sensitive<br />
to all studied gases.<br />
Conclusions<br />
The sensor array designed and assembled by the authors of this<br />
work is based on six commercial gas sensor, humidity and temperature<br />
detector. The measurements performed show different<br />
responses of the array of metal oxides gas sensors to ammonia,<br />
hydrogen and carbon dioxide. By adjusting the voltage of the sensor<br />
heater, the temperature of the sensing layer of each sensor<br />
has been modified thus making it possible to reach better selectivity<br />
of the whole array. The response of the sensors suggests that<br />
using more sophisticated algorithms, a reliable gas detection and<br />
recognition may be achieved in future. The tests carried out indicate<br />
that the response of the sensors is affected to a great extent<br />
References<br />
[1] Gardner J. W., Barlett P.N.: A brief history of electronic noses. Sensors<br />
and Actuators B, Vol. 18, Issues 1–3, 1994, pp. 210–211.<br />
[2] Röck F., Barsan N., Weimar U.: Electronic Nose: current status and<br />
future trends. Chemical Review, Vol. 108, 2008, pp. 705–725.<br />
[3] Brudzewski K., Osowski S., Markiewicz T., Ulaczyk J.: Classification<br />
of gasoline with supplement of bio-products by means of an electronic<br />
nose and SVM neural network. Sensors and Actuators B, Vol.<br />
113, Issue 1, 2006, pp. 135–141.<br />
[4] Bicego M., Tessari G., Tecchiolli G., Bettinelli M.: A comparative analysis<br />
of basic pattern recognition techniques for the development of<br />
small size electronic nose. Sensors and Actuators B, Vol. 85, Issues<br />
1–3, 2002, pp. 137–144.<br />
[5] Szczurek A., Szecówka P.M., Licznerski B.W.: Application of sensor<br />
array and neural networks for quantification of organic solvent vapours<br />
in air. Sensors and Actuators B, Vol. 58, Issues 1–3, 1999,<br />
pp. 427–432.<br />
[6] Capone S., Zuppa M., Presicce D.S., Francioso L., Casino F., Siciliano<br />
P.: Metal oxide gas sensor array for the detection of diesel<br />
fuel in engine oil. Sensors and Actuators B, Vol. 131, Issue 1, 2008,<br />
pp. 125–133.<br />
[7] Brudzewski K., Osowski S., Wolińska K., Ulaczyk J.: Smell similarity<br />
on the basis of gas sensor array measurements. Sensors and Actuators<br />
B, Vol. 129, Issue 2, 2008, pp. 643–651.<br />
[8] Moos R., Müller R., Plog C., Knezevic A., Leye H., Irion E., Braun<br />
T., Marquardt K. J., Binder K.: Selective ammonia exhaust gas sensor<br />
for automotive applications. Sensors and Actuators B, Vol. 83,<br />
Issues 1–3, 2002, pp. 181–189.<br />
[9] Cheng X., Shi Z., Glass N., Zhang L., Zhang J., Song D., Liu Z.S.,<br />
Wang H., Shen J.: A review of PEM hydrogen fuel cell contamination:<br />
Impacts, mechanisms, and mitigation. Journal of Power Sources, Vol.<br />
165, Issue 2, 2007, pp. 739–756.<br />
[10] Han N., Tian Y., Wu X., Chen Y.: Improving humidity selectivity in formaldehyde<br />
gas sensing by a two-sensor array made of Ga-doped<br />
ZnO. Sensors and Actuators B, Vol. 138, Issue 1, 2009, pp. 228–235.<br />
Przypominamy o prenumeracie miesięcznika <strong>Elektronika</strong> na <strong>2<strong>01</strong>2</strong> r.<br />
24<br />
<strong>Elektronika</strong> 1/<strong>2<strong>01</strong>2</strong>
Dynamic research of foot pressure distribution<br />
– the four-points shoe insert with PVDF sensors<br />
(Dynamiczne badania rozkładu nacisku stopy na podłoże – czteropunktowa<br />
wkładka do obuwia z polimerowymi czujnikami z PVDF)<br />
dr inż. Ewa Klimiec, dr inż. Wiesław Zaraska, mgr inż. Szymon Kuczyński<br />
<strong>Instytut</strong> Technologii Elektronowej, Oddział w Krakowie<br />
The human foot structure majorly decides about his/her movement<br />
possibilities. Correctly constructed foot is arched on internal<br />
side. The weight is distributed in a way, that medial arch acts like<br />
a shock absorber, by softening shocks caused by walking. Correctness<br />
of the foot structure can be estimate, by examining foot<br />
pressure distribution on the ground. Faulty posture manifest itself<br />
by different than correct, foot pressure distribution on the ground.<br />
Currently there are two measuring systems on the market, allowing<br />
diagnosis. It is EMed-SF [1, 2] and PEDAR – System [3,<br />
4]. In the first one, examined person crosses through the track,<br />
placing third step on the measuring platform. Contact with the<br />
platform surface should be measured in a natural way so, that<br />
there was no measuring distortion by aware step shortening or<br />
lengthening. For this purpose, several trials heve to be done and<br />
starter has to be suitably set up. Obtained results are in the form<br />
of map which shows the pressure distribution on foot contact surface<br />
with measuring platform in N/cm 2 . The example of recorded<br />
pressure distribution for healthy foot structure is shown on Fig.1.<br />
ted: under the heel, medial arch, mid-foot and hallux. Films were<br />
glued together. The view of the four-points measuring shoe insert<br />
is shown on Fig. 2.<br />
Fig. 2. The view of a four-point measuring shoe insert<br />
Rys. 2. Widok czteropunktowej wkładki pomiarowej<br />
Fig. 1. Pressure distribution of healthy foot to the ground recorded<br />
by EMed-SF system<br />
Rys. 1. Rozkład nacisku prawidłowo zbudowanej stopy na podłoże,<br />
zarejestrowany przez EMed–SF system<br />
Data presented on Fig. 1 shows that for healthy foot, the biggest<br />
values of the pressure are observe under heel, midfoot and<br />
on hallux. Measuring system PEDAR is characterized by the fact<br />
that we examine the foot pressure between foot and shoe sole.<br />
The pressure is recorded by pressure sensors which are installed<br />
into shoe insole. The system is expensive and shoe insole very<br />
thick. It will be profitable to develop competitive system which will<br />
be able to do research on a large scale. Research on the development<br />
of competing systems and results interpretation are<br />
conducted by various research and development centers in the<br />
world [5].<br />
The article discuss measurement system developed by the<br />
authors where the active element is made of piezoelectric PVDF<br />
film (Measurement Specialties, Inc.) with 100 μm thickness, with<br />
printed silver electrodes, placed in the insert to the shoe of his<br />
own design. Insert was placed in a sport shoe.<br />
Dynamic investigations of foot pressure<br />
distribution on the ground<br />
Shoe insert and measuring system design<br />
Shoe insert consist of two polyester films without piezoelectric<br />
properties. Both films have silver, screen printed electrodes. Between<br />
them, piezoelectric sensors made of PVDF film were loca-<br />
Fig. 3. Electric scheme of measuring system, where: S – Sensing element,<br />
E – Electromotive force, X – Reactance of an equivalent source,<br />
U – Voltage, RS – Resetting System, MA – Measurement amplifier<br />
(Keihley 6517A multimetr), OC – Oscilloscope (LeCroy LT-341), TS<br />
– Time Sensor<br />
Rys. 3. Schemat elektryczny systemu pomiarowego, gdzie: S – czujnik,<br />
E – siła elektromotoryczna, X – reaktancja układu zastępczego,<br />
U – napięcie, RS – układ zerujący, MA – wzmacniacz pomiarowy (Keihley<br />
6517A multimetr), OC – oscyloskop (LeCroy LT-341), TS – czujnik<br />
czasu<br />
Electric scheme of measuring system is shown on Fig. 3.<br />
Large load resistance 10 14 Ω has been provided to measuring<br />
system by input analog amplifier of Keithley multimeter. Generated<br />
piezoelectric voltage was recorded on an oscilloscope.<br />
Recorded digital data were used for further signal analysis. The<br />
sensor made of piezoelectric polymer film with printed electrodes<br />
is a self-charging capacitor. It is caused by mechanical deformation<br />
and by pyroelectric properties influence. That is why resetting<br />
system perform very important role in proper measurements.<br />
Resetting system prevents capacitor charging and also reduce<br />
influence of pyroelectric signal which direction is opposite to piezoelectric<br />
signal. Moreover, piezoelectric voltage measurements<br />
were performed when temperature in shoes was established. Resetting<br />
system ensure return of the measurement system to the<br />
starting point, after each step.<br />
Voltage signals analysis – the influence<br />
of design and fasten of measurement shoe insole<br />
to signal quantity and shape<br />
PVDF sensors are very sensitive to any mechanical deformation.<br />
That should be taken into consideration in shoe insert design<br />
where measuring insert, shown on Fig. 2, is fasten. The article<br />
<strong>Elektronika</strong> 1/<strong>2<strong>01</strong>2</strong> 25
investigate three designs of shoe insert, which were fastened in<br />
a typical man sports shoe, size EU42. Dynamic research of stress<br />
distribution on foot were made on running track. The speed of<br />
a walking man, weighing ~ 76 kg, was ~ 4 km/h. Design no.1,<br />
consist of measuring insert and lining which was made of a thin<br />
rubber – leather layer. Obtained voltage signals on insole, design<br />
no.1, are shown on Fig. 4.<br />
U [V]<br />
25<br />
20<br />
15<br />
10<br />
5<br />
Heel<br />
Medial arch<br />
Metatarsal<br />
Hallux<br />
Signal for sensor which was located on medial arch also increased.<br />
To summarize voltage curves on Fig. 4, 5 and 6, it is seen,<br />
that presented modernization of the insert is beneficial only for<br />
sensors placed under the heel and hallux.<br />
Further modernization of the insert has gone in direction of<br />
even greater sensors stiffening and further reduction of other mechanical<br />
factors reaction except stress. Additional metal plates<br />
were mounted above sensors, to design no 2. Voltage traces on<br />
insole, design no 3, with stiffened sensor on both sides, are shown<br />
on Fig. 6.<br />
20<br />
15<br />
10<br />
Heel<br />
Medial arch<br />
Metatarsal<br />
Hallux<br />
0<br />
-5<br />
-10<br />
-0.2 0 0.2 0.4 0.6 0.8 1 1.2 1.4 1.6 1.8<br />
Time [s]<br />
Fig. 4. Piezoelectric voltage signal traces obtained on shoe insert<br />
– design no 1<br />
Rys. 4. Przebiegi piezoelektrycznego napięcia na wkładce do obuwia<br />
– konstrukcja nr 1<br />
U [V]<br />
5<br />
0<br />
-5<br />
-10<br />
-15<br />
0.0 0.2 0.4 0.6 0.8 1.0 1.2<br />
Time [s]<br />
Voltage traces shown on Fig. 4, presents, that besides positive<br />
signals, which are coming from the applied stress of the foot on<br />
the ground, there are signals of opposite sign, resulting from bending,<br />
torsioning and also other mechanical reactions of foot with<br />
shoe sole. The highest voltage value was obtained from a sensor<br />
placed under heel, and it was ~ 22 V. Next largest is the signal<br />
from metatarsal area ~ 8 V and hallux ~ 6 V. Very small voltage<br />
signal was received from medial arch.<br />
To reduce influence of other mechanical reactions on the measuring<br />
insert except for pressure, design no.1 was modernized.<br />
On the bottom of the measuring insole, under sensors surface,<br />
metal plates with 1.5 mm thickness were sticked. Also, lining leather-rubber<br />
was added starting from shoe sole. This modernization<br />
was done to make the sensor more stiffner and to suppress<br />
measuring insert vibrations. Obtained voltage signals from shoe<br />
insole, design no. 2, are presented on Fig. 5.<br />
Comparing voltage traces on Fig. 4 and 5, we can see, that<br />
for a sensor which is located under the heel, negative signal<br />
decreased. Voltage curve for metatarsal is less corrugated and<br />
it shows smaller vibration of measuring insole, but significantly<br />
increased value of a negative signal. Voltage curve for hallux<br />
under pressure increase more uniform, and the negative signal<br />
slightly decrease.<br />
Fig. 6. Piezoelectric voltage signal traces obtained on shoe insert<br />
– design no 3<br />
Rys. 6. Przebiegi piezoelektrycznego napięcia na wkładce do obuwia<br />
– konstrukcja nr 3<br />
Comparing the voltage character on Fig. 5 and 6, it is seen,<br />
that stiffeners introduction on bottom and top sensor area causes,<br />
that for first three sensors, we obtain voltage response mainly to<br />
foot pressure on the ground. For sensor placed on metatarsal,<br />
where large bending appears, negative voltage is still high. Obtained<br />
voltage values on design no. 3, except hallux, are smaller<br />
than for design no 1 and 2. A comparison of Fig. 4, 5, 6 it is seen,<br />
how the design of measuring insert affects to values and character<br />
of piezoelectric signal.<br />
To present influence of insert bending to electrical signal generated<br />
mainly from stress the following investigation was conducted.<br />
Measurement insert with both sides sensor stifness fastened<br />
to dynamometer IMADA DIGITAL FORCE GAUGE at the area<br />
of one sensor. The pressure was increased gradually up to 200 N.<br />
Then the sensor was kept under pressure and insole was bending<br />
nearby the sensor side. Afer that, pressure was gradually reduced<br />
to the starting point. Voltage trace on sensor during described<br />
above experiment, is shown on Fig. 7.<br />
25<br />
20<br />
15<br />
10<br />
Heel<br />
Medial arch<br />
Metatarsal<br />
Hallux<br />
U [V]<br />
5<br />
0<br />
-5<br />
-10<br />
-15<br />
0.0 0.2 0.4 0.6 0.8 1.0 1.2 1.4 1.6 1.8<br />
Time [s]<br />
Fig. 5. Piezoelectric voltage signal traces on shoe insert – design no 2<br />
Rys. 5. Przebiegi piezoelektrycznego napięcia na wkładce do obuwia<br />
– konstrukcja nr 2<br />
Fig. 7. Voltage trace on one sensor during pressure growth up to 200<br />
N, measuring insert bending nearby sensor and pressure decrease<br />
to the starting point<br />
Rys. 7. Przebieg napięcia na czujniku podczas wzrostu siły nacisku<br />
do 200 N, zginaniu wkładki pomiarowej w pobliżu czujnika i zmniejszaniu<br />
siły do punktu wyjścia<br />
26<br />
<strong>Elektronika</strong> 1/<strong>2<strong>01</strong>2</strong>
Voltage trace presented on Fig. 7 shows, that signal which is<br />
coming from increasing pressure gradually increases and decreases<br />
uniformly when pressure decrease. While measurnig insole<br />
was bending, opposite voltage direction occurred to voltage generated<br />
from pressure.<br />
Also, walking speed have influence on voltage curve and its<br />
character was investigated. Voltage curves on insole deesign no<br />
3, on the sensor located on metatarsal area, for high and slow<br />
walking speed of 4 and 1.4 km/h are shown on Fig. 8.<br />
U [V]<br />
10<br />
5<br />
0<br />
-5<br />
-10<br />
V=1.4 [km/h]<br />
V=4 [km/h]<br />
-15<br />
0.0 0.2 0.4 0.6 0.8 1.0 1.2 1.4 1.6 1.8 2.0 2.2<br />
Time [s]<br />
Fig. 8. Voltage trace on insole design no 3, on the sensor located on<br />
metatarsal area, for high and slow walking speed of 4 and 1.4 km/h<br />
Rys. 8. Przebieg napięcia na wkładce o konstrukcji nr 3, na czujniku<br />
umieszczonym w miejscu śródstopia, przy szybkim i powolnym chodzeniu<br />
z prędkością 4 km/h i 1,4 km/h<br />
U [V]<br />
6<br />
5<br />
4<br />
3<br />
2<br />
1<br />
0<br />
-1<br />
Arch of the healthy foot<br />
Arch of the flatfoot<br />
-2<br />
0.0 0.2 0.4 0.6 0.8 1.0 1.2<br />
Time [s]<br />
Fig. 9. Voltage traces on medial arch sensor for healthy foot and foot<br />
with stimulated flatfoot – shoe insole design no 3<br />
Rys. 9. Przebiegi napięć na stopie zdrowej i na stopie ze stymulowanym<br />
płaskostopiem, na czujniku umieszczonym w miejscu wklęśnięcia<br />
stopy zdrowej, na wkładce o konstrukcji nr 3<br />
As shown on Fig. 8, for slow walking speed, negative voltage<br />
is not observed, but it occurs for high walking speed. This phenomenon<br />
can be use for dynamic gait analysis.<br />
Presented above shoe insoles, where active element is a piezoelectric<br />
PVDF film, can be use to diagnose various foot disease,<br />
e.g. flatfoot. By introducing additional insert in medial arch area,<br />
flatfoot was simulated. To conduct this investigations, a shoe insole<br />
with design no 3 was used. Voltage traces recived from healthy<br />
foot and flatfoot at medial arch area, are shown on Fig. 9.<br />
Higher voltage signal is observe in case of flatfoot, than for heathy<br />
foot. By presented shoe insole, it will be possible to diagnose<br />
pathological foot deformations e.g. flatfoot.<br />
This condition leads to chronic bursitis, inflammation of joints<br />
ligaments, edema, pain, and sometimes prevent walking. Examinations<br />
can be performed in a dynamic way, for any long time.<br />
Summary<br />
The design of shoe insert has an influence to the shape and value<br />
of piezoelectric voltage, because its active element is a piezoelectric<br />
PVDF film, which is very sensitive to mechanical deformations.<br />
It is seen on Figs. 3–6.<br />
If measurements are mainly focus on foot pressure distribution<br />
on the ground e.g. flatfoot examinations, it will be well to use insole<br />
design no 3 with stiffened sensors surfaces. It is less sensitive<br />
than insole design no.1. Electrical signal value decrease, but foot<br />
bending and torsioning has smaller influence to its shape and value.<br />
Comparison: Fig. 4 and Fig. 6. Insert design no 1 should be<br />
chosen, if we want a full mapping of foot behavior by electrical<br />
signal during walking. It is very sensitive to any mechanical deformations.<br />
The measuring system developed by the authors, allows to<br />
conduct investigation of foot pathology like flatfoot, at any long<br />
time, in a dynamic way.<br />
Resetting system is important to conduct correct measurements,<br />
which assures that measurement system returns to the<br />
starting point after each step execution.<br />
For sensors calibration, relative pressure measurement of foot<br />
pressure seems most profitable e.g. in relation to heel pressure,<br />
what would largely reduce the influence of shoe insert design to<br />
results interpretation.<br />
Authors are working on radio transmission of electric signal<br />
values from insert placed in footwear to receiving station, where<br />
signal analysis will be conducted.<br />
Authors conduct investigations on further improvement of the<br />
system – eight points shoe insole, and also on adaptation of insole<br />
design to different foot pathologies tests.<br />
Authors wish to express their gratitude to the IET Cracow Division<br />
measurement laboratory staff, especially to Mr. Andrzej Cichocki,<br />
for his assistance while conducting the electric measurements<br />
and in editing this paper. This work has been supported<br />
by key project MNSDIAG, WND-POIG <strong>01</strong>.03.<strong>01</strong>-00-<strong>01</strong>4/08.<br />
References<br />
[1] Bryant A.R., Tinley P., Singer K.P.: Normal values of plantar pressure<br />
measurements determined using the EMED-SF system. Journal<br />
of American Podiatric Medical Association, Vol.°90, No.°6, 2000,<br />
pp. 295–299.<br />
[2] Cichy B, Wilk M.: Gait analysis in osteoarthritis of the hip, Med. Sci<br />
Monit, Vol.°12, No.°12, 2006, pp. 507–513.<br />
[3] Hurkmans H. L. P., et al., Validity of the Pedar Mobile system for<br />
vertical force measurement during a seven-hour perio. Journal of Bomechanics,<br />
Vol.°39, 2006, pp. 110–118.<br />
[4] Hessert M.J., Vyas M., Leach J.,Hu K., Lipsitz L. A., Novak V.: Foot<br />
pressure distribution during walking in young and old adults. BMC<br />
Geriatrics, Vol.°5, No.°8, 2005.<br />
[5] Kong K. and Tomizuka M.:Smooth and continuous human gait phase<br />
detection based on foot pressure patterns. in Proc. IEEE Int. Conf.<br />
Robot.Autom., 2008, pp. 3678–3683.<br />
<strong>Elektronika</strong> 1/<strong>2<strong>01</strong>2</strong> 27
Design and realization of a microfluidic capillary sensor<br />
based on a silicon structure and disposable optrodes<br />
(Projekt i realizacja mikrocieczowego czujnika kapilarnego opartego na przestrzennej<br />
strukturze krzemowej z wykorzystaniem włókien światłowodowych)<br />
dr inż. Zbigniew Szczepański 1) , dr inż. Michał Borecki 1) , dr inż. Dariusz Szmigiel 2) ,<br />
PhD Michael L. Korwin Pawlowski 3)<br />
1)<br />
Warsaw University of Technology, Institute of Microelectronics and Optoelectronics, Warsaw<br />
2)<br />
Institute of Electron Technology Warsaw, Devision of Silicon Nanostructure Technology, Piaseczno<br />
3)<br />
Département d’informatique et d’ingénierie, Université du Québec en Outaouais, Gatineau,Québec<br />
During the last years microfluidic sensors that use optical capillaries<br />
have gained an increasing importance due to their new<br />
applications as diagnostic tool in biotechnology, medicine and in<br />
environmental sciences. This was possible because the capillary<br />
enables multiparametric sensing [1–7] contrary to the classical<br />
optical fiber sensors [8], which find applications in physical measurements<br />
such as pressure and also magnetic field [9].<br />
In this paper the improvements in the design of microfluidic<br />
sensors that use local heating in optical capillaries as a base<br />
of multiparametric diagnostics is presented [4]. The application<br />
of local heating opened interesting new possibilities for the<br />
sensors, that do not use any chemical sensitive layers or reagents,<br />
while raising specific issues relating to their construction,<br />
materials and technology [5]. The mentioned sensors can be<br />
used for in situ diagnostic in medicine and veterinary and as<br />
biofuel usability testers [10–12].The proposed microfluidic capillary<br />
sensor consists of a stabilized-intensity light source unit,<br />
a testing head with replaceable optical capillary, a heater and<br />
a detection unit. The optical capillary performs the functions of<br />
a liquid sample holder and at the same time of a multiparametric<br />
sensing element. The sensor operates in a multiparametric sensing<br />
mode, monitoring, registering and processing the indirect<br />
information such as the index of refraction, the boiling point,<br />
the vapour pressure, the heat capacity, the heat of fusion, the<br />
viscosity, the surface tension of the liquid and turbidity changes<br />
in a thermally forced measuring cycle. The measuring cycle is<br />
initiated by applying local heating to the sample [5]. The measuring<br />
cycle is controlled indirectly by changes in optical signals<br />
and temperatures [10]. The raw optical data are processed<br />
by an optoelectronic circuits and fed to an information module,<br />
consisting of a personal computer equipped with data an acquisition<br />
function. For information processing an artificial neural<br />
network is used.<br />
The advantage of disposable capillary optrodes in liquid and<br />
fluid classification, are low total sample volume of the order of<br />
3 mm 3 that, is required for the analysis and the fact that washing<br />
of the sensor is not required, because the low-cost capillary can<br />
be disposable. The improvements in sensor construction compared<br />
with its previous versions are used of 3D silicon substrate<br />
structure and of a direct bonded copper (DBC) base.<br />
Sensor construction improvements<br />
The main part of microfluidic capillary sensor is a sensor head,<br />
that consists of the following elements:<br />
● a disposable optical capillary optrode with the liquid to be analysed,<br />
● a substrate for the capillary optrode with a local heater to change<br />
the temperature of the examined sample,<br />
● a set of optical fibres; one to input light from a local light source<br />
into the capillary and others to collect signals from the liquid,<br />
so that the light intensity variations can be monitored,<br />
● temperature sensors for temperature heater measurement,<br />
● a base for the mentioned above elements.<br />
28<br />
a) b)<br />
Fig. 1. Layout of silicon sensor head (a) and the heater (b)<br />
Rys. 1. Schemat krzemowego czujnika (a) głowica, (b) grzejnik<br />
The sensor substrate was designed on the base of a silicon<br />
wafer with the thickness of 900 μm, using silicon micromachining<br />
process, IC fabrication and hybrid techno+logies. The lay out of<br />
the silicon sensor substrate is shown in Fig. 1.<br />
The following elements are shown on Fig. 1: the V-grove for<br />
placement of the capillary, the rectangular groves for the optical<br />
fibres, the cavity of the heater, the heater resistive layer, aluminium<br />
metallization, the four rectangular holes and temperature<br />
sensors. The rectangular holes fulfil the role of thermal barriers to<br />
limit heat transfer from the heater area. The temperature sensors<br />
in a form of thin film resistors are deposited at the upper side and<br />
bottom side under the heater.<br />
The presented sensor design and technology takes into<br />
account the dimensional requirements for this sensor. The critical<br />
point of the optical capillary sensor construction is its reliable<br />
three dimensional positioning of the capillary optrode, in relation<br />
to the heater and of the optical fibres towards to capillary. The<br />
capillaries have to be positioned exactly 100 μm above the heater,<br />
taking into account the tolerances of the capillary’s diameter<br />
of ±20 μm. The source fibre and the receiver fibres ought to be<br />
coaxially positioned in relation to the capillary optrode. For the<br />
above reasons, the Si anisotropic etching was carried out in order<br />
to obtain V-groove profile with excellent dimensional control<br />
(Fig. 2a).<br />
a) b)<br />
Fig. 2. The cross section of V-grove (a) and rectangular grove (b)<br />
Rys. 2. Przekrój poprzeczny wydrążonych kanałów (a) w kształce litery<br />
V, (b) prostokątny<br />
<strong>Elektronika</strong> 1/<strong>2<strong>01</strong>2</strong>
Moreover IC technology allows the integration of the heater<br />
and temperature sensors with the silicon substrate. For realization<br />
of silicon sensor head, a silicon wafer with the (100) orientation<br />
and the thickness of 900 μm was used. Such thickness is<br />
appropriate for accommodation of the optical fibres and allows<br />
accommodate optical fibres and replaceable capillaries with outer<br />
diameters of 850 μm (Fig. 2b).<br />
The silicon wafer was oxidized in order to obtain a 100 nm<br />
SiO 2<br />
layer. Then it was covered with a Si 3<br />
N 4<br />
layer with the thickness<br />
of 100 nm, using an LPCVD process. Subsequently the<br />
double side photolithography was used to define the areas of<br />
capillary duct and 4 through the wafer slits. These slits fulfil the<br />
role of thermal barriers. The nitride mask layer was next opened<br />
using RIE plasma treatment, whereas the oxide layer was etched<br />
by means of wet chemical etching. In the next step the 550 μm<br />
depth cavity, V-shape capillary grove and rectangular slits were<br />
anisotropically etched at 80ºC, using KOH solution. After KOH<br />
etching the nitride mask was removed by wet etching and the etched<br />
surface was oxidized (~550 nm). In order to obtain thin film<br />
resistors with Al bond pads metallization at the both sides of silicon<br />
wafer, first RF magnetron sputter deposition of titanium was<br />
performed (300 nm thick) and then aluminium with the thickness<br />
of 500nm was deposited. Each metal layer was subsequently<br />
patterned using photolithography and wet processing. Straight<br />
line rails for the four the optical fibres placement have been made<br />
by means of the incising of the taped wafer using a rotary blade<br />
diamond saw. Finally the silicon wafer was diced into 30 × 30 mm<br />
pieces. In the Fig. 3 the realized functional silicon sensor bed<br />
structure is presented.<br />
Fig. 4. Layout of patterned DBC substrate<br />
Rys. 4. Układ podłoża DBC<br />
Fig. 3. Silicon sensor bed structure view<br />
Rys. 3. Podłożę czujnika krzemowego<br />
Two thin film resistors which act as temperature sensors were<br />
laser trimmed to obtain meander shape, what increases the accuracy<br />
of the temperature measurements. In the next step ultrasonic<br />
large diameter wire bonding process was made using 100 μm<br />
diameter aluminium wire, allowing for high density current flow<br />
through the heater.<br />
The realized silicon sensor head was assembled to patterned<br />
DBC alumina substrate, both side plated with 200 μm thick copper<br />
metallization (Fig. 4).<br />
The bonding pads were made using mechanical treatment,<br />
since photolithography was difficult to perform, due to the relatively<br />
thick copper metallization. The DBC substrate assures efficient<br />
heat transfer between the sensor head and the environment. In<br />
the centre of the DBC substrate, a square hole (12 × 12 mm) was<br />
made using laser drilling, to allow heat dissipation from the heater.<br />
The 3D silicon sensor head was connected with the DBC substrate<br />
using a conductive adhesive, dispensed around the edge<br />
of silicon structure. Such connection did not decrease of thermal<br />
resistance between the bottom side of silicon structure and the<br />
Fig. 5. Scheme of mechanical stabilization of the optical elements<br />
Rys. 5. Schemat mechanicznej stabilizacji elementów optycznych<br />
DBC metallization. To ensure repeatable position of the optical fibres<br />
and of the microfluidic capillary, mechanical stabilization has<br />
been applied (Fig. 5).<br />
In the sensor head assembled on the DBC substrate the temperature<br />
of the heater was measured, using a laser pyrometer<br />
and the thin film temperature sensors. Since the coefficient of<br />
the emission of the heater surface depends of temperature, so<br />
temperature measurements by means of pyrometer were made<br />
with an accuracy of ±10ºC.The better accuracy of the heater<br />
temperature measurement could be obtained using thin film temperature<br />
calibrated sensors. The temperature in the capillary was<br />
monitored by observing the boiling point of the various fluids filling<br />
the capillary. It was found that heater temperature had to be increased<br />
up to 180ºC, in order to obtain 100ºC inside the capillary.<br />
It was reached with heater power of ~5 W.<br />
Conclusions<br />
Capillary optical sensors are a novel instrument and method for<br />
classification of biological and chemical liquids and fluids with the<br />
advantage of a very small liquid sample that is needed for exa-<br />
<strong>Elektronika</strong> 1/<strong>2<strong>01</strong>2</strong> 29
mination. One intended application of such sensors is testing of<br />
biofuel usability for motor vehicles at a filling station. The capillary<br />
sensor was fabricated using silicon micromachining and IC<br />
technology. The applied technologies allowed for integration of<br />
the main sensor parts. High accuracy in 3D positioning of the heater<br />
in relation of the optical fibres, towards a capillary and good<br />
thermal control of the sample inside the capillary were obtained.<br />
The design of the sensor improved the accuracy of the dynamic<br />
optical measurements of the liquid under study.<br />
This work was supported by the European Union structural funds<br />
grant POIG nr <strong>01</strong>.03.<strong>01</strong>-00-<strong>01</strong>4/08-00 pt. „Mikro- i Nanosystemy<br />
w Chemii i Diagnostyce Biomedycznej – MNS DIAG” zadanie 2A.<br />
References<br />
[1] Weigl B.H., O.S. Wolbeis: Capillary optical sensors. Anal. Chem.66,<br />
1994. pp. 3323–3327.<br />
[2] Weigl B.H., G. Domingo, P. Laborre, J. Gerlach: Towards non and<br />
minimally microfluidics-basd diagnostic devices. Lab Chip. 8. 2008.<br />
pp. 1999–2<strong>01</strong>4.<br />
[3] Romaniuk R.: Applications of capillary optical fibres. Proc. SPIE<br />
6347. 2006.<br />
[4] Borecki M., et al.: Optoelectronic Capillary Sensors in Microfluidic<br />
and Point-of-Care Instrumentation. Sensors. 2<strong>01</strong>0; 10(4):3771-3797;<br />
http://www.mdpi.com/1424-8220/10/4/3771/<strong>pdf</strong>.<br />
[5] Borecki M., M.L. Korwin-Pawłowski, P. Wrzosek, J.Szmidt: Capillaries<br />
as the components photonic sensor and Microsystems. 2008.<br />
Mes.Sci.Technol. 19:065202.<br />
[6] Keller B.K., M.D. DeGrandpre, C.P. Palmer: Sensors and Actuators.<br />
B25. 2007. pp. 360–371.<br />
[7] Lippitisch M.E., S. Draxler, D. Kieslinger, H. Lehmann, B.H. Weigl:<br />
Applied Optics 35. 1996. pp. 3426–3431.<br />
[8] Gholamzadeh B., H. Nabovati: Fiber Optic Sensors. World Academy<br />
of Science, Engineering and Technology 42 2008. pp. 297–307.<br />
[9] Pustelny T., K. Barczak, K. Gut, J. Wojcik: Special optical fiber type D<br />
applied in optical sensor of electric currents. Optica Applicata, 34(4),<br />
2004, pp. 531–539.<br />
[10] Struk P., T. Pustelny, K. Gut, K. Gołaszewska, E. Kamińska, M. Ekielski,<br />
I. Pasternak, E. Łusakowska, and A. Piotrowska: Planar optical<br />
waveguides based on thin ZnO layers. Acta Physica Polonica A,<br />
116(3), 2009, pp. 414–418.<br />
[11] Borecki M., et al.: Intelligent Photonic Sensors for Application in Decentralized<br />
Wastewater Systems; in Waste Water – Evaluation and<br />
Management. Fernando Sebastián García Einschlag (Ed.), ISBN:<br />
978-953-307-233-3, InTech, (2<strong>01</strong>1); http://www.intechopen.com/articles/show/title/intelligent-photonic-sensors-for-application-in-de<br />
centralized-wastewater-systems.<br />
[12] Borecki M., M. Korwin-Pawłowski: Optical Capillary Sensors for Inteligent<br />
Microfluidic Sample Classification. in Nanosensors: Theory<br />
and Applications, ed. K. Lim, CRC Press, pp. 215-246, Boca Raton-<br />
London- New, York, (2<strong>01</strong>1).<br />
[13] Borecki M., M.L. Korwin-Pawlowski, M. Bebłowska, M. Szmidt, K.<br />
Urbańska, J. Kalenik, Ł. Chudzian, Z. Szczepański, K. Kopczyński,<br />
A. Jakubowski and J. Szmidt: Capillary Microfluidic Sensor for Determining<br />
the Most Fertile Period in Cows. Acta Physica Polonica A.<br />
118(6), 2<strong>01</strong>0, pp. 1093–1099.<br />
[14] Urbańska K.et al.: Vaginal fluid of cow differences in rut cycle with<br />
emphasis on most fertile period. Życie Weterynaryjne, 86(2), 2<strong>01</strong>1,<br />
pp. 127–129.<br />
A compact thermoelectric harvester<br />
for waste heat conversion<br />
(Kompaktowy termoelektryczny generator do pozyskiwania i przetwarzania<br />
ciepła odpadowego na energię elektryczną)<br />
dr inż. Piotr Dziurdzia, Akademia Górniczo-Hutnicza, Katedra Elektroniki, Kraków<br />
mgr inż. Karol Lichota, Knorr-Bremse Systemy dla Kolejowych Lokomocji PL Sp. z o.o.<br />
Ambient energy harvesters have been playing more and more important<br />
role in the electronic industry in recent years. Not so long ago,<br />
energy scavenging was treated in R & D laboratories with some timidity<br />
and used only in some niche applications. Nowadays, development<br />
of autonomous power sources for supplying microelectronic systems<br />
is strongly driven by market demands following recent advances in<br />
smart mobile equipment, wireless sensor networks (WSN), monitoring<br />
of industrial processes, etc. Since transmission lines have been<br />
replaced with wireless channels a long time ago, now the energy harvesters<br />
are removing the last obstacle on the way to developing quite<br />
autonomous electronic systems. By providing electrical voltage to the<br />
sensor nodes from harvested pieces of ambient energy (for instance:<br />
heat, light and vibrations) they do not need external sources of energy,<br />
for instance power mains or batteries, any more [1–3].<br />
For the last few years our team has been focused on developing<br />
of thermoelectric energy harvesters for supplying wireless sensor<br />
nodes. At the beginning, basing on the phenomena of Seebeck,<br />
Peltier, Joule and Thomson, an original model of thermoelectric<br />
generator was elaborated [4]. It was next subjected to simulations<br />
in order to investigate the maximum ratings of TEG against available<br />
heat power sources and different ambient conditions. In the<br />
next steps first prototypes of TEGs were designed and fabricated.<br />
Thermoelectric harvester<br />
As a rule, thermoelectric generators suffer from relatively low conversion<br />
efficiency (not exceeding 10%), so they are practically not<br />
applicable to large-scale systems, not to mention power stations.<br />
30<br />
On the other hand they seem to be promising solutions when they<br />
are used to harvesting some waste heat coming from industry<br />
processes or central heating systems.<br />
In recent years a lot of attention was paid to analyzing Peltier<br />
modules and efficiency of conversion thermal energy into electrical<br />
one. Our latest aim was to design a complete, independent device<br />
powering a WSN node. Since low power integrated circuits, like<br />
microcontrollers, transceivers and sensors have been commonly<br />
available for several years we focused especially on DC-DC converter<br />
section. Ideal solution should fulfill the followings objectives:<br />
– operate from extremely low voltages, from tens of mV – it is<br />
a must since it is desirable that energy harvesters could work<br />
properly even with very low (equaling to single Celsius degrees)<br />
temperature gradients between Peltier modules hot and<br />
cold sides. Such temperature differences, for typical commercially<br />
available thermoelectric modules, result in tens of mV<br />
output Seebeck voltage,<br />
– match load impedance to Peltier module internal resistance to<br />
extract maximum amount of power,<br />
– small and compact package, easily applicable to relatively simple<br />
applications,<br />
– very low quiescent current.<br />
Design considerations<br />
A recently released (December 2009) integrated circuit LTC3108<br />
from Linear Technology would presumably meet our expectation.<br />
It can operate from input voltage as low as 20 mV and power ex-<br />
<strong>Elektronika</strong> 1/<strong>2<strong>01</strong>2</strong>
Fig. 1. Communication interface between ATTiny2313V and SHT11<br />
Rys. 1. Schemat interfejsu komunikacyjnego między mikrokontrolerem<br />
ATiny2313V i czujnikiem SHT11<br />
ternal microcontroller via V LDO<br />
= 2.2 V or other devices (wireless<br />
transmitters, sensors etc) via two V OUT<br />
outputs with one of four<br />
regulated voltages. It draws 6 uA quiescent current and has input<br />
resistance (including step-up transformer and whole input circuit<br />
not only LTC3108) about 2.5 Ω [5].<br />
Even with the best converter one has to remember that energy<br />
harvesting is a low efficiency method and there is not too much<br />
power available. Therefore, all components should be aware of<br />
power dissipation and have both low current consumption and<br />
possibility to work in „power-save” mode (if not, µC should have<br />
possibility to temporarily turning them off). So, one has to carefully<br />
consider parameters of chosen devices (µC and sensor) in terms<br />
of power consumption. We decided to use Atmel ATTiny2313V<br />
µC from new designed low power family and SENSIRION SHT11<br />
sensor [6]. In fact this is not only sensor but also an A/D converter,<br />
an amplifier, a memory and a serial interface similar to I2C<br />
integrated in a single device. SHT11 could be used in meteorology<br />
station in WSN because of its low power consumption and<br />
good measuring properties. The least 12 bits for temperature and<br />
8 bits for data of humidity (the less bits the lower power consumption)<br />
are read by external microprocessor. SHT1x sensor family<br />
is common used in commercial application like: HVAC systems,<br />
meteorology stations, control and measurements systems, automotive<br />
and medical applications.<br />
Connection between µC and SHT11 is shown in Fig. 1. Although<br />
functionality of all parts is typical, what is worth consideration<br />
is the power balance and considerations of the designed system.<br />
Available energy and power estimation<br />
At first, our objective was to check whether the system will have<br />
enough power to run in constant manner. According to datasheets,<br />
average current consumption of SHT11 is 22 µA and the ATTiny<br />
2313V 20 µA (using 32 kHz internal oscillator). Let’s assume that<br />
Peltier module is one of Laird Technology TEG number 4532 and<br />
that the temperature difference between hot and cold side is 5 o C.<br />
In our laboratory we have checked that when applying such a gradient<br />
it results in output voltage about 94 mV. In Fig. 2 the output<br />
power dependence against temperature of the Peltier module hot<br />
side (the cold side was attached to a heat sink and could not be<br />
controlled) is shown. According to LT documentation [4] 94 mV of<br />
input voltage gives about 300 µA output current. It appeared that<br />
this is more than enough for constant work of the device. Such<br />
system can record measurements in a memory of a µC and store<br />
them for a long time.<br />
To achieve our main goal – the autonomous sensor network<br />
node – sufficient electrical power should be provided for supplying<br />
wireless transmitter. In this example for our calculations a Texas<br />
Instruments CC2520 ZigBee transmitter has been chosen. It requires<br />
18 mA while sending data, so it is obvious that it should work<br />
periodically in an estimated duty cycle. To get maximum pulse current<br />
which equals to I PULSE<br />
= 19.04 mA, all the load currents need to<br />
be added. Duration of transmission is 15 ms and this period of time<br />
Fig. 2. Output power against temperature of the Peltier module hot side<br />
Rys. 2. Moc wyjściowa w funkcji temperatury strony gorącej modułu<br />
Peltiera<br />
should allow free flow of data. Maximum voltage drop at the output<br />
is set to 0.5 V. LTC3108 has a capacitor tied to the V OUT<br />
output<br />
which is a temporary reservoir for the impulse load current. The<br />
appropriate values of capacitors that are able to store sufficient<br />
amount of energy can be calculated as in equation (1).<br />
I<br />
PULSE<br />
(<br />
mA<br />
)<br />
⋅<br />
t<br />
PULSE<br />
(<br />
ms<br />
)<br />
C<br />
OUT<br />
(<br />
µ<br />
F<br />
)<br />
=<br />
(1)<br />
<br />
dV<br />
(<br />
V<br />
)<br />
And after substituting we obtain (2).<br />
OUT<br />
19.04<br />
mA<br />
⋅<br />
15<br />
ms<br />
C OUT ( µ F<br />
)<br />
=<br />
=<br />
582<br />
µ<br />
F<br />
0,5<br />
V<br />
(2)<br />
So, in the designed energy harvester a 600 µF was chosen.<br />
To estimate how often the data can be transmitted, the following<br />
considerations should be carried out. The average spare current<br />
(supplied current minus consumption of ATTiny2313V and SHT11)<br />
is 300 µA – 42 µA = 258 µA. Therefore, the average supplied power<br />
equals to: 3.3 V * 258 µA = 851 µW, whereas the power that<br />
is required during transmission is 3.3 V * 19.04 µA = 62.8 mW.<br />
When we divide these two values of powers (851 µW/62.8 mW<br />
= 1.4%), this means that only 1.4% of required power is supplied<br />
by means of energy harvester. From that we can easily get a duty<br />
cycle: 15 ms/1.4% = 1.07 s.<br />
LTC3108 can be equipped also with some additional storage<br />
capacitor which is the main reservoir of energy in the circuit. By<br />
reducing frequency of transmitting one obtains additional energy<br />
which can be used in situations when Peltier module does not<br />
provide input voltage. In our solution a 0.1 F capacitor was chosen<br />
and the sending data frequency set to f = 0.5 Hz. The storage<br />
time can be calculated as in (3) and (4).<br />
( )<br />
C<br />
STORE<br />
V<br />
STORE<br />
−<br />
V<br />
OUT<br />
(3)<br />
t<br />
STORE<br />
=<br />
I<br />
⋅<br />
t<br />
⋅<br />
f<br />
PULSE<br />
PULSE<br />
( )<br />
TRANSMIT<br />
0,1<br />
F<br />
⋅<br />
5,25<br />
V<br />
−<br />
3,3<br />
V<br />
t STORE =<br />
=<br />
1373<br />
[<br />
s<br />
] (4)<br />
1<br />
19<br />
,04<br />
mA<br />
⋅<br />
15<br />
ms<br />
⋅<br />
0,5<br />
s<br />
The result is 1373 seconds and this is the period of time during<br />
which system can work without energy supplied from Peltier<br />
module.<br />
A mechanical assembly of the TEG and electronic system<br />
for energy harvesting are shown in Fig. 3 and Fig. 4 respectively.<br />
There is additional possibility to connect the node to a PC<br />
via RS243. Instead of storage capacitor there is a space left<br />
for battery button as an alternative solution for energy storage.<br />
The harvesters are currently used to supplying and testing of<br />
autonomous wireless link which will the topic of our upcoming<br />
publication.<br />
<strong>Elektronika</strong> 1/<strong>2<strong>01</strong>2</strong> 31
Fig. 3. Mechanical assembly of the TEG<br />
Rys. 3. Konstrukcja mechaniczna termogeneratora<br />
Conclusions<br />
Sensor networks with wireless communication are becoming more<br />
and more common. There have been already some low power wireless<br />
systems available on the market. The only missing point is<br />
a reliable power management system with DC-DC converter operating<br />
from tens of mV. The paper presented a device based on Peltier<br />
module and LTC3108 converter which can provide power pulses to<br />
wireless (ZigBee) transmitter and whole sensor network. This power<br />
can be delivered when the TEG is placed at only 5 o C temperature<br />
difference between hot and cold side. The device can be easily integrated<br />
with other application by means of a regulated output voltage.<br />
When power consumption alternates, the only requirement is to<br />
calculate proper duty cycle and correct value of C out<br />
capacitor.<br />
In our case the whole TEG dimensions are approximately 4 x 4<br />
x 4 cm and most of its volume is occupied by relatively small heat<br />
sink. Such a power source can supply a ZigBee sensor node for<br />
many years, practically much longer that the foreseen life cycle<br />
for the sensor network, moreover it does not need any inspecting<br />
or visiting on site for battery replacement. For example, assuming<br />
Fig. 4. Prototype electronic circuit for energy harvesting and power<br />
management<br />
Rys. 4. Prototypowy układ do pozyskiwania energii i zarządzania<br />
mocą<br />
temperature of the heat source of 40 o C, the designed energy harvester<br />
can deliver energy during a year round that is comparable<br />
to a 1.5 V 1 Ah battery.<br />
The work was supported by the National Centre for Research<br />
and Development (NCBiR) project grant No. R02 0073 06/2009.<br />
References<br />
[1] Joseph A. D.: Energy Harvesting Projects. Published by the IEEE CS<br />
and IEEE ComSoc, 1536-1268/05.<br />
[2] Beeby S., White N.: Energy Harvesting for Autonomous Systems.<br />
Artech House 2<strong>01</strong>0, ISBN-13: 978-1-59693-718-5.<br />
[3] Priya S., Inman D. J.: Energy Harvesting Technologies. Springer<br />
2009, ISBN 978-0-387-76463-4.<br />
[4] Mirocha A., Dziurdzia P.: Improved electrothermal model of the thermoelectric<br />
generator implemented in SPICE. Proc. of the International<br />
Conference on Signals and Electronic Systems, 14–17 Sept. 2008,<br />
Cracow, Poland, pp. 317–320.<br />
[5] Datasheet Linear Technology LTC3108, www.linear.com<br />
[6] Datasheet Sensirion SHT1x.<br />
[7] Salerno D.: Ultralow Voltage Energy Harvester Uses Thermoeletric<br />
Generator for Battery-free Wireless Sensors. LT Journal, 2<strong>01</strong>0.<br />
An investigation of the quality of the conductive lines<br />
deposited by inkjet printing on different substrates<br />
(Badanie jakości ścieżek przewodzących wytworzonych metodą druku<br />
strumieniowego na różnych podłożach)<br />
Ph.D Janusz Sitek 1) , M.Sc.Eng. Konrad Futera 1,5) , Darko Belavič 2,3,4) , Ph.D Marina<br />
Santo Zarnik 2,3,4) , M.Sc.Eng. Marek Kościelski 1) , Ph.D Krystyna Bukat 1) , M.Sc. Kamil<br />
Janeczek 1) , Ph.D Danjela Kuščer Hrovatin 2,4) , D.Sc.Eng. Małgorzata Jakubowska 5,6)<br />
1)<br />
Tele- and Radio Research Institute, Centre of Advance Technology, Warsaw, 2) Jozef Stefan Institute, Ljubljana, Slovenia<br />
3)<br />
HIPOT-RR, Otočec, Slovenia, 4) Centre of Excellence NAMASTE, Ljubljana, Slovenia<br />
5)<br />
Warsaw University of Technology, Faculty of Mechatronics, 6) Institute of Electronic Materials Technology, Warsaw<br />
A lot of telecommunications, medical, industrial automation<br />
and measurement equipment, as well as sensor applications,<br />
are currently in the process of miniaturizing their dimensions.<br />
The reliability requirements of electronic equipment and devices<br />
is also constantly on the rise. One of the miniaturization<br />
solutions is thick-film technology and 3D structures [1].<br />
Such devices require conductive lines to connect the different<br />
layers of simply manufactured devices. The fabrication of reliable,<br />
very narrow, conductive lines for thick-film and other<br />
structures is a crucial issue in the production of electronic<br />
components. Inkjet printing is a technology that could be ap-<br />
32<br />
plied for this. It is the element of printed electronics that belongs<br />
to one of the most important, emerging technologies of<br />
the moment [2].<br />
Inkjet printing, as a method for the deposition of conductivenanoparticle-based<br />
inks is a good solution for the fabrication<br />
of good quality and highly reliable electronic circuits. Inkjet<br />
printing is an additive (non-waste) low-temperature process,<br />
which makes it a low-cost and more environmentally friendly<br />
technology.<br />
In this paper an investigation of the quality of inkjet-printed<br />
conductive lines on different substrates is presented.<br />
<strong>Elektronika</strong> 1/<strong>2<strong>01</strong>2</strong>
Materials and printing system<br />
Three different types of substrates were used during the investigations:<br />
a pre-fired LTCC substrate (Du Pont 951), a green tape<br />
LTCC (Du Pont 951) and alumina (96% Al 2<br />
O 3<br />
). An ink based on<br />
nanosilver powder was used for the investigation [3]. It was a commercially<br />
available ink made in Poland by the Amepox Company.<br />
The test pattern on the substrates was made with a self-built<br />
InkJet printer system [4]. It allows a great deal of flexibility in the research<br />
work. It was designed and built at the Tele & Radio Research<br />
Institute (ITR). The issue was to design a flexible, low-cost printing<br />
system to support the material science investigation, technology optimization<br />
and new technology development. The printing system<br />
is based on the MicroDrop, piezoceramic PZT print head. It gives<br />
a wide spectrum of compatible inks. It is possible to use inks with<br />
a pH in the range 1–12 and viscosity 1–12 cPs [4, 5]. The nozzle<br />
diameters for this printer are 50 μm and 100 μm, and the drop volume<br />
is in the range from 35 pl to 85 pl. The print head has a heater<br />
that allows heating up the ink inside the nozzle up to 100˚C.<br />
Deposition conditions for the test pattern<br />
and conductive lines<br />
A special test-pattern design was used for the investigation of the<br />
quality of the conductive lines. It contains straight and circular lines to<br />
check their quality after different printing conditions (Fig. 1 and 2). The<br />
printing conditions for the test pattern’s straight lines were as follow:<br />
● the line No. 1 – a single overprint;<br />
● the line No. 2 – a double overprint in the same place;<br />
● the line No. 3 – a triple overprint in the same place;<br />
● the line No. 4 – a single overprint of two lines, next to one<br />
another, with a distance between them of 0.24 mm;<br />
● the line No. 5 – a single overprint of four lines, next to one another,<br />
with a distance between them of 0.10 mm and 0.20 mm;<br />
● the line No. 6 – a double overprint of four lines, next to one<br />
another, with a distance between them of 0.10 mm and<br />
0.18 mm, as shown in Fig. 2.<br />
a) b)<br />
A nozzle diameter of 100 μm and a dot spacing of 150 μm<br />
were used in the printing process. The print head impulse was<br />
set to 110 V and 50 μs. After the printing process the samples<br />
were dried on a heated printer stage. A drying temperature of<br />
60˚C was set up.<br />
Firing conditions<br />
The printed and dried samples were divided into two groups. The<br />
first group was fired at a low temperature (350°C) for one hour.<br />
The second group of samples was fired at a high temperature<br />
using the profile shown in Fig. 3. In detail: the pre-fired LTCC and<br />
alumina Al 2<br />
O 3<br />
substrates were fired with a „30-minutes-temperature<br />
profile”, using a peak firing temperature of 850°C (10 minutes).<br />
The green tape LTCC substrate was fired on the „Du Pont<br />
LTCC-temperature profile” with a peak firing temperature of 875°C<br />
(17 minutes).<br />
During the firing process the organic ingredients evaporated<br />
from the ink and the printed lines became conductive.<br />
Temperature (°C)<br />
1000<br />
900<br />
800<br />
700<br />
600<br />
500<br />
400<br />
300<br />
200<br />
100<br />
0<br />
0 20 40 60 80 100 120 140 160 180 200 220 240<br />
Time (minutes)<br />
Fig. 3. The firing profile. Rys. 3. Profil wypalania<br />
Geometry of the lines after drying and firing<br />
Fig. 1. Examples of printed and dried lines on: a) pre-fired LTCC,<br />
b) green tape LTCC<br />
Rys. 1. Przykłady nadrukowanych i wysuszonych ścieżek na:<br />
a) wstępnie wypalonej LTCC, b) surowej taśmie LTCC<br />
The lines’ geometry parameters were investigated after the firing<br />
processes at low and high temperatures. Optical and metallographic<br />
microscopes as well as an interferometric profilometer<br />
were used for the investigation.<br />
Examples of the optical microscopy observation results after<br />
firing at a low temperature were shown in Fig. 4. Blurred edges of<br />
the lines caused by the structure of the ceramic substrate were<br />
observed. The first layer of ink soaked in the porous substrate<br />
deforms the edge. The second layer of ink forms a line, and the<br />
solvents evaporate fast enough to prevent dots from spilling on<br />
the first layer.<br />
The best geometry parameter results for the group fired at low<br />
temperature were obtained for a pre-fired LTCC substrate dried at<br />
60°C during printing, line no. 3. This line had a triple overprint in<br />
the same place.<br />
a) b) c)<br />
Fig. 2. A test pattern for straight lines printing<br />
Rys. 2. Wzór testu do nadruku prostych ścieżek<br />
Fig. 4. The view of printed line no. 3 geometry on different substrates,<br />
dried at 60°C, after firing at 350°C: a) pre-fired LTCC, b) green tape<br />
LTCC, c) alumina Al 2<br />
O 3<br />
Rys. 4. Wygląd nadrukowanej linii nr 3 na różnych podłożach, suszonej<br />
w 60°C, po wypaleniu w 350°C: a) wstępnie wypalone LTCC,<br />
b) surowa taśma LTCC, c) ceramika alundowa Al 2<br />
O 3<br />
<strong>Elektronika</strong> 1/<strong>2<strong>01</strong>2</strong> 33
The examples of the optical microscopy observation results after<br />
firing at high temperature are shown in Fig. 5. The green tape<br />
material was not compatible with the silver nano-ink and the cofiring<br />
process. The shrinkage of the LTCC green tape during the<br />
firing process was so intense that the printed pattern was ripped<br />
out of the surface of the sample (Fig. 5b). The acceptable geometry<br />
parameters for the group fired at high temperature were obtained<br />
for the pre-fired LTCC and the alumina Al 2<br />
O 3<br />
substrates.<br />
The results of the Al 2<br />
O 3<br />
surface morphology before and after firing<br />
are presented in Fig. 6 and 7. The interferometric profilometer<br />
was used for measurements.<br />
a) b) c)<br />
The thicknesses of the investigated lines were between 4 and<br />
8 µm after ink-jet printing and drying and from 1.8 to 3.6 µm after<br />
firing. The width of the printed lines after firing was from 120 μm<br />
(line No. 1) to 340 μm (line No. 6). The best quality was observed<br />
for line No. 3 (3 rd from right), but some further improvement of the<br />
printing parameters is still necessary.<br />
Surface resistance of lines after drying<br />
and firing<br />
The lowest surface resistance of 4.5 mΩ/□ was achieved for line<br />
No. 3 (average width 0.285 mm, average hieght 3.6 µm), dried at<br />
60°C and fired at low temperature (350°C) for 1 hour on pre-fired<br />
LTCC. The lines fired at high temperature had surface resistances<br />
higher that 10 mΩ/□ (Table), and for wider lines (No. 3, 5 and 6)<br />
obtained better results.<br />
Surface resistances of lines (in mΩ/□) for test patterns fired at low (LT)<br />
and high temperature (HT)<br />
Rezystancja powierzchniowa ścieżek (w mΩ/□) dla testów wypalanych<br />
w niskiej (LT) i wysokiej temperaturze (HT)<br />
Fig. 5. The view of printed lines on different substrates after firing<br />
at high temperature: a) pre-fired LTCC, b) green tape LTCC, c) alumina<br />
Al 2<br />
O 3<br />
Rys. 5. Wygląd nadrukowanych linii na różnych podłożach po wypaleniu<br />
w wysokiej temperaturze: a) wstępnie wypalone LTCC, b) surowa<br />
taśma LTCC, c) ceramika alundowa Al 2<br />
O 3<br />
Fig. 6. Printed lines morphology on the alumina substrate before firing<br />
(sample G12C)<br />
Rys. 6. Morfologia nadrukowanych ścieżek na podłożu z ceramiki<br />
alundowej przed wypaleniem (próbka G12C)<br />
0 2 4 6 8 10 mm<br />
µm<br />
0<br />
55<br />
0.5<br />
50<br />
1<br />
1.5<br />
45<br />
2<br />
40<br />
2.5<br />
35<br />
3<br />
30<br />
3.5<br />
25<br />
4<br />
4.5<br />
20<br />
5<br />
15<br />
5.5<br />
10<br />
6<br />
5<br />
6.5<br />
0<br />
mm<br />
Fig. 7. Printed lines morphology on the alumina sample after firing<br />
(sample G12C)<br />
Rys. 7. Morfologia nadrukowanych ścieżek na podłożu z ceramiki<br />
alundowej po wypaleniu (próbka G12C)<br />
34<br />
0 2 4 6 8 10 mm<br />
0<br />
0.5<br />
1<br />
1.5<br />
2<br />
2.5<br />
3<br />
3.5<br />
4<br />
4.5<br />
5<br />
5.5<br />
6<br />
mm<br />
µm<br />
35<br />
30<br />
25<br />
20<br />
15<br />
10<br />
5<br />
0<br />
Substrate/<br />
line No.<br />
Pre-fired<br />
LTCC (LT)<br />
Green tape<br />
LTCC (LT)<br />
1 2 3 4 5 6<br />
51.6 42.5 4.5 7.1 7.0 –<br />
25.0 49.0 55.6 6.5 6.4 9.2<br />
Al 2<br />
O 3<br />
(LT) – – 16.6 Ω/□ 3.8 Ω/□ 6.4 Ω/□ 9.0 Ω/□<br />
Pre-fired<br />
LTCC (HT)<br />
– 29 16 37 10 14<br />
Al 2<br />
O 3<br />
(HT) – 24 23 33 34 18<br />
Summary<br />
The geometry and surface morphology as well as the surface<br />
resistance of the conductive lines were investigated to assess<br />
the quality of the lines deposited by inkjet printing on different<br />
substrates. Different lines structures, width and morphology were<br />
achieved by using different combinations of parameters. Some<br />
pads made by ink-jet printing were not homogenous, especially<br />
after firing at high temperature.<br />
The best quality of lines for the group fired at low temperature<br />
was obtained for the pre-fired LTCC substrate and line No.<br />
3. It had the best morphology and the smallest surface resistance<br />
of 4.5 mΩ/□. The best geometry parameter results for the group<br />
fired at high temperature were obtained for the pre-fired LTCC<br />
and alumina (Al 2<br />
O 3<br />
) substrates. It was observed that inkjet-printing<br />
deposition on green tape LTCC and then co-firing using the<br />
conditions of the LTCC-temperature profile is not a usable technology.<br />
The likely reason was the shrinkage of the LTCC material<br />
during firing. Some additional effort is necessary to improve the<br />
quality of the lines.<br />
References<br />
[1] Santo Zarnik M., Belavič D., Maček S.: Some Critical Steps in the<br />
Manufacturing of LTCC-based Pressure Sensors. MIDEM 2<strong>01</strong>0,<br />
Radenci, Slovenia.<br />
[2] Jakubowska M., Sitek J.: Drukowana <strong>Elektronika</strong> w Polsce. Monografia<br />
<strong>Instytut</strong>u Tele- i Radiotechnicznego, Praca zbiorowa, Warszawa<br />
2<strong>01</strong>0, ISBN: 978-83-926-599-1-4.<br />
[3] Nanosilver ink datasheet http://www.amepox-mc.com<br />
[4] Sitek J. et al.: Investigation of inkjet technology for printed organic<br />
electronics. <strong>Elektronika</strong> LII Nr 3/2<strong>01</strong>1, s. 112.<br />
[5] MicorDrop datasheet www.microdrop.de<br />
<strong>Elektronika</strong> 1/<strong>2<strong>01</strong>2</strong>
High temperature properties of thick-film<br />
and LTCC components<br />
(Wysokotemperaturowe właściwości elementów grubowarstwowych i LTCC)<br />
mgr inż. Damian Nowak, mgr inż. Mateusz Janiak, prof. dr hab. inż. Andrzej Dziedzic,<br />
dr inż. Tomasz Piasecki<br />
Politechnika Wrocławska, Wydział Elektroniki Mikrosystemów i Fotoniki<br />
There is an increased demand for electronics that can work in<br />
harsh environment involving high temperature. Applications include<br />
sensors and actuators for control in petroleum and geothermal<br />
industry, process monitoring and distributed control systems in<br />
automotive and aerospace [1–3]. Complete extreme high-temperature<br />
electronic systems require active devices as well as proper<br />
passive components (eg. resistors, capacitors, inductors).<br />
There comes also the requirement for further miniaturization and<br />
integration of electronic components. Thick-film and LTCC (low<br />
temperature co-fired ceramics) technologies are well-established<br />
and relatively low-cost fabrication method of passives. Thus, they<br />
represent promising fabrication techniques to meet the demands<br />
for devices that are miniaturized and operate at high temperature<br />
[4–7]. This paper presents manufacturing process of thick-film<br />
and LTCC resistors, planar inductors and interdigital capacitors<br />
as well as their chosen electrical and stability properties in a wide<br />
frequency and temperature range.<br />
Test structures fabrication<br />
Square planar inductors and interdigital capacitors were made on<br />
alumina (96% Al 2<br />
O 3<br />
, 635 µm thick) or fired LTCC (DP951, 300<br />
µm thick) substrates. The size of the fabricated components was<br />
3×3 mm 2 and 50 μm track width/50 μm spacing were designed.<br />
The inductors consist of 2 or 3 turns (Fig. 1). The structures were<br />
fabricated by photoimageable inks technique. Silver based paste<br />
(Ag 65, ITME Warsaw) was used for conductive paths [8]. The paste<br />
was deposited on the substrate by screen-printing (stainless<br />
screen 325 mesh). Then the ink was dried (90ºC, 10 min) and<br />
exposed to UV light (for 5 seconds) through a photomask with<br />
a proper patterns. The UV light causes polymerization of the photoimageable<br />
ink. Unpolymerized material was removed by spraying<br />
of developer (0.1% ethanolamine). Finally, the structures were<br />
fired in a belt furnace for 60 min with 850ºC peak temperature.<br />
The microresistors with regulated length have been made on<br />
LTCC (DP 951, 300 µm thick) substrates by combining of standard<br />
screen-printing and photoimageable techniques. Conductive<br />
paths were prepared from photosensitive ink as described<br />
above. The distances between electrodes, i.e. proper resistor<br />
length were designed as 90, 120 and 300 µm. The width of resistors<br />
was 200 µm. They were made of DP2021 (DuPont, 100<br />
ohm/sq.) or R490A (Heraeus, 10 ohm/sq.) pastes by printing<br />
through 325 mesh screen. The conductive and resistive paste<br />
were co-fired at 850ºC.<br />
Electrical measurements<br />
Resistors<br />
The HP Agilent 34970A multimeter interfaced to personal computer<br />
for data acquisition and presentation was used for measurements<br />
of dynamic resistance changes directly at elevated temperature<br />
(in-situ). The test structures were placed on hot plate<br />
equipped with spring probe needles and digital temperature controller.<br />
They were kept consecutively at 300, 400 and 500°C for<br />
minimum 72 hours. The data were collected every 15 minutes.<br />
Figures 2 and 3 present dynamic resistance changes of resistors.<br />
The elevated temperature caused decrease of resistance<br />
for the DP2021 resistors. The observed drift was about -1.75% at<br />
300°C. However, keeping at 400°C caused more significant changes<br />
of resistance up to -7%. The R490A resistors exhibit resistance<br />
drift about ±2% at 300°C and 400°C. At 500°C the resistance<br />
has changed about -15%.<br />
Fig. 2. Relative resistance changes, DP2021 resistors<br />
Rys. 2. Względne zmiany rezystancji, rezystory DP2021<br />
Fig. 1. Test structures – planar inductor and thick-film resistor<br />
(DP2021, 300 µm)<br />
Rys. 1. Struktury testowe – cewka planarna i rezystor grubowarstwowy<br />
(DP2021, 300 µm)<br />
Fig. 3. Relative resistance changes, R490A resistors<br />
Rys. 3. Względne zmiany rezystancji, rezystory R490A<br />
<strong>Elektronika</strong> 1/<strong>2<strong>01</strong>2</strong> 35
Fig. 4. Resistance changes vs electric field for DP2021 resistors<br />
Rys. 4. Względne zmiany rezystancji w funkcji natężenia pola, rezystory<br />
DP2021<br />
Fig. 6. Inductance changes at different temperatures<br />
Rys. 6. Zmiany indukcyjności w różnej temperaturze<br />
Fig. 5. Resistance changes vs surface power density for DP2021 resistors<br />
Rys. 5. Względne zmiany rezystancji w funkcji powierzchniowej gęstości<br />
mocy, rezystory DP2021<br />
The investigations of pulse durability of components were<br />
carried out. Voltage pulses were used for analysis of allowable<br />
electric field and next surface power density for microresistors in<br />
dependence of resistor dimensions and operating temperature<br />
[5]. Exposures to voltage pulses were realized with the aid of self<br />
made Programmed Pulse Generator [9]. There were chosen the<br />
rectangular pulses with duration time 20 μs and amplitude value<br />
from 1 to hundreds of volts. The durability was measured at room<br />
temperature as well as at elevated temperature to 500°C. As an<br />
example relative resistance changes are presented as a function<br />
of electrical field E (Fig. 4) and surface power density P (Fig. 5)<br />
– both above mentioned dependencies were calculated based on<br />
resistances and dimensions of microresistors.<br />
The test were carried out for 4 to 6 resistors with the same<br />
length at each temperature level. Generally, there was observed<br />
a decrease of allowable electric field (the criterion of 10% resistance<br />
change was assumed) with the temperature increase. However,<br />
at elevated temperature they were comparable. Moreover,<br />
shorter components exhibited higher durability to voltage pulses.<br />
Inductors and capacitors<br />
The electrical measurements of components were made at several<br />
temperature level in the frequency range from 10 kHz to<br />
110 MHz using HP Agilent 4292A impedance analyzer.<br />
Figures 6 and 7 present changes of inductance and quality<br />
factor of spiral square inductor (3 turns) at different temperature.<br />
The small changes of inductance were observed whereas Q-factor<br />
depends strongly on temperature. It is caused by typical for<br />
metals increase of parasitic series resistance of structure.<br />
36<br />
Fig. 7. Q-factor changes at different temperatures<br />
Rys. 7. Zmiany dobroci w różnej temperaturze<br />
Fig. 8. Capacitance changes at different temperatures<br />
Rys. 8. Zmiany pojemności w różnej temperaturze<br />
<strong>Elektronika</strong> 1/<strong>2<strong>01</strong>2</strong>
Figure 8 presents capacitance changes at different temperature<br />
for 3 × 3 mm 2 interdigital capacitor. The capacitance was increasing<br />
with the temperature, especially at lower frequency range.<br />
Table presents comparison of basic parameters of reactant<br />
components at chosen frequency.<br />
Comparison of basic parameters of components at different temperature<br />
Porównanie podstawowych parametrów elementów w różnej temperaturze<br />
T<br />
[ºC]<br />
L [nH]<br />
at 38 MHz<br />
Inductor<br />
R s<br />
[Ω]<br />
Q = ωL/R<br />
at 38 MHz<br />
C [pF]<br />
at 1 MHz<br />
Capacitor<br />
Q<br />
at 1 MHz<br />
25 111.83 4.29 6.33 2.73 585<br />
100 111.94 5.35 5.08 2.82 136<br />
200 111.97 6.7 4.02 – –<br />
250 112.<strong>01</strong> 7.5 3.62 2.97 34<br />
300 112.04 8.23 3.30 3.09 18<br />
350 112.09 8.91 3.05 3.3 9.5<br />
400 112.03 9.56 2.84 3.68 4.9<br />
450 111.88 10.23 2.65 4.15 3<br />
Conclusions<br />
This paper presents fabrication and basic electrical and stability<br />
properties of thick-film and LTCC microcomponents. The preliminary<br />
results show that they might be very interesting solution for<br />
harsh environment applications, however, further investigations<br />
have to be carried out.<br />
This work was supported by the Polish Ministry of Science<br />
and Higher Education, Grant no N N515 607 839. Damian Nowak<br />
is awarded with Fellowship co-financed by European Union within<br />
European Social Fund (EFS).<br />
References<br />
[1] Johannessen R.: Reliable Microelectronics for Harsh Environment<br />
Applications – Effects Of Thermal Stress and High Pressure. Doctoral<br />
dissertation, Faculty of Mathematics and Natural Science, University<br />
of Oslo, 2008.<br />
[2] Jacq C., Maeder T. and Ryser P.: Sensors and packages based on<br />
LTCC and thick-film technology for severe conditions. SĀDHANĀ<br />
– Academy Proceedings in Engineering Sciences, vol. 34 (2009),<br />
pp. 677–687.<br />
[3] Nowak D., Dziedzic A.: LTCC Package for high temperature applications.<br />
Microelectronics Reliab., vol. 51 (2<strong>01</strong>1), pp. 1241–1244.<br />
[4] Lahti M., Lantto V., Leppavuori S.: Planar inductors on an LTCC<br />
substrate realized by the gravure-offset-printing technique. IEEE<br />
Trans. on Components and Packaging Technol., vol.23 (2000),<br />
pp. 606–610.<br />
[5] Dziedzic A., Miś E., Rebenklau L., Wolter K.-J.: Geometrical and<br />
electrical properties of LTCC and thick-film microresistors. Microelectronics<br />
Int., vol. 22, no.1 (Jan. 2005), pp. 26–33.<br />
[6] Perrone R., Thust H., Drüe K.-H.: Progress in the Integration of planar<br />
and 3D Coils on LTCC by using photoimageable Inks. J. of Microelectronics<br />
and Electronic Packaging, vol. 2 (2005), pp. 155–161.<br />
[7] Miś E., Dziedzic A., Piasecki T., Kita J., Moos R.: Geometrical, electrical<br />
and stability properties of thick-film and LTCC microcapacitors.<br />
Microelectronics Int., vol.25 no 2 (2008), pp. 37–41.<br />
[8] Markowski P., Jakubowska M., Zwierkowska E., Danielkiewicz M.,<br />
Wolter K. J., Luniak M.: Properties of thick-film photoimageable inks<br />
for LTCC substrates. <strong>Elektronika</strong> (Warszawa). 2<strong>01</strong>1, R. 52, nr 3,<br />
pp. 109–111.<br />
[9] Dziedzic A., Golonka L.J., Kita J., Roguszczak H., Zdanowicz T.:<br />
Some remarks about „short” pulse behaviour of LTCC and thick-film<br />
Microsystems. Proc. 1st Eur. Microelectronics and Packaging Symp.,<br />
Prague (Czech Republic), June 2000, pp. 194–199.<br />
LTCC microfluidic chip with fluorescence based detection<br />
(Mikroprzepływowy fluorescencyjny czujnik ceramiczny wykonany<br />
techniką LTCC)<br />
mgr inż. Mateusz Czok, dr inż. Karol Malecha, prof. dr hab. inż. Leszek Golonka<br />
Wrocław University of Technology, Faculty of Microsystem Electronics and Photonics<br />
Nowadays miniaturization is present in many fields of science (electronics,<br />
medicine, biology and chemistry). Over the last few years<br />
many research into miniaturization and microfabrication were carried<br />
out. As a result the concepts of the micro-total analysis system (µTAS)<br />
and Lab-on-Chip (LoC) were proposed. These devices integrate several<br />
laboratory functionalities in a single miniature structure [1, 2].<br />
There are few technologies that can be applied in the realization of<br />
the LoC devices. For many years the most common used materials<br />
were silicon and glass wafers [3, 4]. As an alternative solution few<br />
other materials like PDMS (poly(dimethylsiloxane)) or PCB (Printed<br />
Circuit Boards) were used for microsystems fabrication [5, 6].<br />
The Low Temperature Co-fired Ceramics (LTCC) seems to be<br />
a suitable material to realize LoC devices. Channels, chambers,<br />
valves, electronic and optoelectronic components can be easily<br />
integrated in one LTCC module [7, 8]. It also has outstanding physical<br />
and chemical properties [9].<br />
The main motivation is to use the LTCC technology in the fabrication<br />
of the microfluidic chip, in which fluorescence detection of<br />
biological sample can be performed. The manufactured detection<br />
module consists of inexpensive and commonly available electronic<br />
components and PMMA (poly(methyl methacrylate)) optic<br />
fibres integrated with the LTCC microfluidic chip. It is made up of<br />
the microfluidic channel, cavities for fiber optics, miniature light<br />
emitting diode and photodetector.<br />
The LTCC microfluidic chip performance is investigated with<br />
several different concentrations of fluorescein solutions which<br />
are excited with 465 nm light source. The emitted fluorescent<br />
light is coupled into two separate optic fibres and its intensity is<br />
measured with two photodetectors (TSLG 257 and TCS 3414).<br />
The developed microfluidic structure can be assigned to detection<br />
of Gram-negative and Gram-positive bacteria.<br />
Fabrication process<br />
The LTCC technology was used for fabrication of a microfluidic<br />
system with fluorescence based detection. During manufacturing<br />
process twelve layers of DuPont 951 PX ceramic<br />
tapes were used. Thickness of each LTCC tape was equal to<br />
216 µm after firing. Channels, cavities, termination holes were<br />
cut with the Nd-YAG laser system. A simple electronic circuit<br />
was screen printed through a 325 mesh stainless steel screen<br />
at the bottom side of the microfluidic chip. The PdAg thick-film<br />
paste (DP 6146) was used for that this purpose. After laser cutting<br />
and screen printing all ceramic tapes were stacked and<br />
laminated using an isostatic press. The lamination process was<br />
carried out in a low pressure of 2 MPa and at a temperature of<br />
70°C for 10 minutes. Then the LTCC laminate was co-fired in<br />
a box furnace at a recommended firing profile with a peak temperature<br />
at 850°C.<br />
<strong>Elektronika</strong> 1/<strong>2<strong>01</strong>2</strong> 37
Fig. 1. Assembled LTCC device<br />
Rys. 1. Mikroprzepływowy czujnik fluorescencyjny wykonany techniką<br />
LTCC<br />
Results<br />
Fluorescence measurements of five different fluorescein concentrations<br />
were carried out to examine the quality of the LTCC<br />
microfluidic chip. Fluorescein is a well know fluorescent dye. It is<br />
widely used in biological and medical applications as a proteins<br />
and antibodies marker. The 98% pure ethyl alcohol was used in<br />
fluorescein solutions preparation. Ethanol is an organic solvent<br />
in which fluorescein can be readily dissolved. The maximum<br />
fluorescence solubility in ethanol solvent equals to 20 g/dm 3 at<br />
temperature of 20°C. Investigated solutions fluoresces green<br />
(520 nm) when is exposed to 465 nm excitation light.<br />
In order to examine the properties of the fabricated LTCC microfluidic<br />
chip, fluorescein concentrations from 0.02 to 0.32 g/dm 3<br />
were used. The Perfusor ® syringe pump was used to force the<br />
fluid flow in the microfluidic channel. Fluorescein concentrations<br />
were gradually changed in approximately 3 minutes time intervals.<br />
Between measurements microfluidic channel was purged<br />
with 98% pure ethyl alcohol. Each solution was illuminated with<br />
blue excitation light (465 nm) which was transmitted through the<br />
input fibre optic. As a result the green fluorescent light was emitted<br />
by the test solution. The fluorescence signal was coupled into<br />
two separate PMMA optical fibres and transmitted to appropriate<br />
photodetector (TSLG 257 and TCS 3414).<br />
Typical 5 V DC power supply was used to feed the LTCC microfluidic<br />
chip. Measurements of the TSLG 257 light-to-voltage<br />
converter output signal were performed with Agilent 344<strong>01</strong>A multimeter.<br />
As the TCS 3414 has a build-in analog to digital converter<br />
measured signal level is given in digital absolute unit. To avoid the<br />
temperature and light influence the experiment were carried out at<br />
room temperature in dark and air-conditioned room. Photodetectors<br />
responses to various test solutions are given in Fig. 3 and 4.<br />
Fig. 2. X-ray image of manufactured device<br />
Rys. 2. Zdjęcie RTG wykonanego urządzenia<br />
After co-firing three PMMA optic fibres with a diameter of 750<br />
µm were precisely positioned and glued into the LTCC module.<br />
Then the light source (LED HB3b-448ABD, Huey Jann Electronics<br />
Industry Co., Ltd.), photodetector (TSLG 257, TAOS) and passive<br />
electronic components were soldered on the LTCC microfluidic<br />
chip. The HB3b-448ABD is a super blue light emitting diode (LED)<br />
with a peak wavelength at λ p<br />
= 465 nm and the spectral halfwidth<br />
∆λ½ = 35 nm. The TSLG 257 is a high-sensitivity low-noise light to<br />
voltage converter that consists of a photodiode, an amplifier and<br />
a green filter combined in a single monolithic CMOS structure.<br />
The output voltage is proportional to light irradiance on the photodiode.<br />
The TLSG 257 has the maximum spectral responsivity at<br />
520 nm with the spectral halfwidth equal to 35 nm. The TCS 3414<br />
(TAOS) is used as an external digital light sensor for real-time<br />
measurement. The device includes an array of 16 filtered photodiodes<br />
(red, green, blue and clear channel) and analog-to-digital<br />
converters with programmable gain integrated on a single monolithic<br />
CMOS structure. The TCS 3414 contains analog-to-digital<br />
converter for each channel that integrates the currents from four<br />
photodiodes. Integration of all channels is made simultaneously<br />
and then the conversion results are transferred to the channel<br />
data registers.<br />
The assembled structure of the LTCC microfluidic chip with<br />
fluorescence based detection is presented in Fig. 1. An X-ray<br />
Computed Tomography was used to examine the PMMA optic fibres<br />
positioning precision and possible defects of the fabricated<br />
module. The X-ray image of manufactured device is presented in<br />
Fig. 2. As can be noticed optic fibres were precisely positioned<br />
and mounted. Moreover, delamination or LTCC layers misalignment<br />
were not observed.<br />
38<br />
Fig. 3. Photodetector (TSLG 257) response to various fluorescein<br />
concentrations<br />
Rys. 3. Odpowiedź fotodetektora (TSLG 257) dla różnych koncentracji<br />
fluoresceiny<br />
Fig. 4. Photodetector (TCS 3414) response to various fluorescein<br />
concentrations<br />
Fig. 4. Odpowiedź fotodetektora (TCS 3414) dla różnych koncentracji<br />
fluoresceiny<br />
<strong>Elektronika</strong> 1/<strong>2<strong>01</strong>2</strong>
The measured fluorescence intensity is proportional to the test<br />
solution concentration. In order to evaluate the measurement repeatability<br />
of fabricated microfluidic chip two measurement series<br />
were performed in 24 h interval. Obtained repeatability was better<br />
than 95%.<br />
The TCS 3414 response indicates high stability during realtime<br />
measurements for concentrations below 0.32 g/dm 3 . Moreover,<br />
the digital light sensor gave us additional information about<br />
signals levels measured by photodiodes with red, blue colour filter<br />
and the total light illumination. This could be used to evaluate<br />
the influence of the excitation light on the measured fluorescence<br />
signal.<br />
High signal fluctuation for 0.32 g/dm 3 concentration of test<br />
solution was observed. This could be caused by fluorescence<br />
self-quenching phenomenon. Its threshold value is close to the<br />
highest fluorescein concentration of the examined solutions.<br />
Summary<br />
The LTCC technology was applied for manufacturing of the microfluidic<br />
chip in which fluorescence detection of various fluorescein solutions<br />
can be performed. Moreover, light emiting diode, light-to-voltage<br />
converter and PMMA optic fibres were integrated on the chip.<br />
Inexpensive and commonly available electronic components<br />
(light emitting diode, photodetectors, PMMA fibre optics) were<br />
used to fabricate the detection module.<br />
The performance of the LTCC microfluidic chip was investigated<br />
with two separate photodetectors. Measured responses to<br />
several concentrations of fluorescein solution were proportional<br />
to the fluorescein concentration.<br />
Measurement repeatability was very high with less than 5%<br />
error. The TCS 3414 response indicates high stability in real-time<br />
measurements.<br />
The performed experiments have shown that it is possible to<br />
detect fluorescent signal inside the LTCC-based microfluidic chip.<br />
The developed LTCC microfluidic chip can be assigned to detection<br />
of Gram-negative and Gram-positive bacteria.<br />
The authors wish to thank Wroclaw University of Technology<br />
(grant no. 343 745) for the financial support.<br />
Karol Malecha fellowship is co-financed by European Union within<br />
European Social Fund (ESF).<br />
X-ray Computed Tomography pictures were carried out in the Laboratory<br />
for Interconnecting and Packaging Electronic Circuits,<br />
Wrocław University of Technology.<br />
References<br />
[1] Rivet C., Lee H., Hirsch A., Hamilton S., Lu H.: Microfluidics for medical<br />
diagnostics and biosensors. Chemical Engineering Science, Vol.<br />
66, 2<strong>01</strong>1, pp. 1490–1507.<br />
[2] Malecha K., Pijanowska D. G., Golonka L. J., Torbicz W.: LTCC microreactor<br />
for urea determination in biological fluids. Sensors and<br />
Actuators B: Chemical, Vol. 141, No. 1, 2009, pp. 3<strong>01</strong>–308.<br />
[3] Odijk M., Baumann A., Olthuis W., A. van den Berg, Karst U.: Electrochemistry-on-chip<br />
for on-line conversions in drug metabolism studies.<br />
Biosensors and Bioelectronics, Vol. 26, 2<strong>01</strong>0, pp. 1521–1527.<br />
[4] Radadia A. D., Salehi-Khojin A., Masel R. I., Shannon M. A.: The<br />
effect of microcolumn geometry on the performance of micro-gas<br />
chromatography columns for chip scale gas analyzers. Sensors and<br />
Actuators B, Vol. 150, 2<strong>01</strong>0, pp. 456–464.<br />
[5] Ziółkowska K., et al.: PDMS/glass microfluidic cell culture system<br />
for cytotoxicity tests and cells passage. Sensors and Actuators B:<br />
Chemical, Vol. 145, 2<strong>01</strong>0, pp. 533–542.<br />
[6] Gassmann S., Pagel L.: Fluidic systems in Printed Circuit Boards.<br />
IEEE International Symposium on Industrial Electronics, 2009,<br />
pp. 597-602.<br />
[7] Golonka L. J., et al.: LTCC based microfluidic system with optical<br />
detection. Sensors and Actuators B: Chemical, Vol. 111–112, 2005,<br />
pp. 396–402.<br />
[8] Misiakos K., et al.: Fully integrated monolithic optoelectronic transducer<br />
for real-time protein. Biosensors and Bioelectronics, Vol. 26,<br />
2<strong>01</strong>0, pp. 1528–1535.<br />
[9] Thelemann T., Fischer M., Muller J.: LTCC-based fluidic components<br />
for chemical applications. Journal of Microelectronics and Electronic<br />
Packaging, Vol. 4, 2007, pp. 167–172.<br />
Investigation of multiple degradation and rejuvenation<br />
cycles of electroluminescent thick film structures<br />
(Badanie powtarzanych cykli degradacji i regeneracji grubowarstwowych<br />
struktur elektroluminescencyjnych)<br />
mgr inż. MATEUSZ MROCZKOWSKI 1) , dr inż. MICHAŁ CIEŻ 2) , dr inż. JERZY KALENIK 1)<br />
1)<br />
Politechnika Warszawska, <strong>Instytut</strong> Mikroelektroniki i Optoelektroniki, 2) <strong>Instytut</strong> Technologii Elektronowej<br />
Copper doped zinc sulfide displays electroluminescent prosperities<br />
and it is used as a phosphor in thick film light emitting structures.<br />
Such electroluminescent structures, or alternating current<br />
electroluminescent devices (ACEL), are used as backlight for<br />
liquid crystal displays in portable electronic devices (cell phones,<br />
notebooks, PDAs, etc.) and as a source of light in the advertising<br />
industry. Unfortunately such structures are prone to degradation<br />
and have a limited life time [1, 2].<br />
Degraded electroluminescent thick film structures can be<br />
rejuvenated by annealing [1]. An attempt to investigate the possibility<br />
of repeated rejuvenation of degraded EL lamps was undertaken.<br />
The goal of this investigation is to better understand<br />
the mechanism of degradation and rejuvenation of thick film EL<br />
lamps and prolong their life time.<br />
Alternating Current Electroluminescent<br />
Devices (ACEL)<br />
Typical EL lamps are fabricated as a multi-layer thick film structures.<br />
A layer of phosphor, for example a copper doped zinc sulfide, is<br />
placed in between two layer of conductive materials. This makes<br />
this structure similar to a simple parallel-plate capacitor. Usually EL<br />
lamp structures consist of 4 layers: a layer of transparent conductive<br />
material, e.g. Indium Tin Oxide (ITO), a layer of phosphor, a layer of<br />
dielectric and a layer of metallic conductor, e.g. silver. The layer of<br />
transparent conductor is fabricated on a transparent substrate [1].<br />
In order to cause such structures to emit light alternating current<br />
must by applied. It is necessary that the value of applied electric<br />
field is above 1 MV/m or no light emission will be observed.<br />
Frequency of the alternating current is usually 100 Hz to 20 kHz.<br />
Fig. 1. Cross-section of a thick film electroluminescent lamp<br />
Rys. 1. Przekrój grubowarstwowej lampy elektroluminescencyjnej<br />
<strong>Elektronika</strong> 1/<strong>2<strong>01</strong>2</strong> 39
Test structures<br />
The test structures were prepared at Institute of Electron Technology,<br />
Division in Cracow. A set of DuPont Luxprint inks, dedicated<br />
to fabricate electroluminescent thick film structures, was utilized<br />
to prepare the test structures. A Luxprint 8152B ZnS:Cu based ink<br />
was applied to produce electroluminescent layer on ITO covered<br />
transparent polymer substrate. Conductive electrodes were screen<br />
printed with the use of a silver based ink. Both pastes were<br />
cured by drying at 130°C for 30 minutes in a box oven.<br />
Degradation<br />
Several mechanisms of degradation of EL phosphors have been<br />
discussed in the literature [1]. Most often it is suggested that degradation<br />
process involves S vacancy or doppant diffusion in ZnS<br />
lattice [2, 3]. Some authors suggest that mechanism that lower<br />
the efficiency of electron/hole injection may be of importance [4].<br />
Degradation causes luminance to decrease. These changes<br />
are a two phase process. The first phase is characterized by rapid<br />
decrease of luminance. In the second phase of degradation<br />
changes of luminance value are slower. Changes of luminance B<br />
as a function of time are given by equation (1).<br />
40<br />
B(t)/B(0) = a 1<br />
exp (-t/τ 1<br />
) + a 2<br />
exp (-t/τ 2<br />
) (1)<br />
Constants a 1<br />
and τ 1<br />
describe changes of luminance caused by<br />
moisture. Constants a 2<br />
and τ 2<br />
describe changes of luminance<br />
caused by decomposition of ZnS grains. Sum of a 1<br />
and a 2<br />
is always<br />
equal to one [5].<br />
The experiment<br />
During the experiment test samples were degraded by applying<br />
square-wave voltage of amplitude of 150 V and frequency of 4 or<br />
10 kHz. After a certain amount of time, samples were rejuvenated<br />
by annealing in temperature of 130°C for 2 hours. This process of<br />
degradation and rejuvenation was repeated.<br />
Results<br />
To characterize the influence of degradation on ACEL devices following<br />
parameters were measured: luminance, capacitance and<br />
emission spectra.<br />
Luminance<br />
For samples degraded at 4 kHz [pic. 2] and 10 kHz [pic. 3] rejuvenation<br />
was performed twice. Before first rejuvenation luminance<br />
of 10 kHz samples was 31% of initial value and of 4 kHz samples<br />
27% of initial value. After rejuvenation luminance increased to 51%<br />
of initial value for 10 kHz samples and 38% for 4 kHz samples.<br />
Before second rejuvenation luminance decreased to 33%<br />
(10 kHz samples) and 18% (4 kHz samples). After second rejuvenation<br />
luminance increased to 43% (10 kHz samples) and<br />
25% (4 kHz samples). Rejuvenation gave better results in case<br />
of 10 kHz samples. Important is the fact, that repeatable rejuvenation<br />
is possible.<br />
Fig. 2. Luminance as a function of time – 10 kHz samples<br />
Rys. 2. Luminancja w funkcji czasu – próbki starzone przy 10 kHz<br />
Fig. 3. Luminance as a function of time – 4 kHz samples<br />
Rys. 3. Luminancja w funkcji czasu – próbki starzone przy 4 kHz<br />
Emission spectrum<br />
During the experiment emission spectrum was observed. When<br />
spectrums measured before and after degradation and after rejuvenation<br />
were compared only differences were observed in the<br />
amount of energy emitted. No changes were observed in the shape<br />
of emission spectrum. This suggest that, during degradation,<br />
efficiency of light emission decreases, but there are no changes<br />
in the electronic band structure of the phosphor. Also the rejuvenation<br />
does not change the band structure.<br />
Capacitance<br />
Table shows results of capacitance measurements during degradation<br />
and rejuvenation. These measurements were performed<br />
for samples depredated at 10 kHz. No significant changes of capacitance<br />
was observed, so the value of the electric field applied<br />
to the structure is constant during the degradation and rejuvenation<br />
process.<br />
Capacitance of 10 kHz samples<br />
Pojemność próbek starzonych przy 10 kHz<br />
Time of measurement<br />
Capacitance [nF]<br />
Initial 2.058<br />
Before first rejuvenation 2.094<br />
After first rejuvenation 2.055<br />
Before second rejuvenation 2.046<br />
After second rejuvenation 2.051<br />
Conclusions<br />
● Decrease of luminance during degradation is a two phase process.<br />
● Annealing allows repeatable rejuvenation.<br />
● No significant changes of emission spectrum suggest no changes<br />
in the band structure of the phosphor.<br />
● No significant changes of capacitance exclude changes of value<br />
of the applied electric field as a reason of decrease of luminance.<br />
References<br />
[1] Stanley J., Yu Jiang, Bridges F., Carter SA, Ruhlen L.: Degradation<br />
and rejuvenation studies of AC electroluminescent ZnS:Cu,Cl phosphors.<br />
J. Phys.: Condens. Matter, 22, 2<strong>01</strong>0, pp. 0553<strong>01</strong>.<br />
[2] Hirabayashi K., Kozawaguchi H., Tsujiyama B.: Study on A-C Powder<br />
EL Phosphor Deterioration Factors. J. Electrochem. Soc., 130, 1983,<br />
pp. 2259–2263.<br />
[3] Lehmann W.: Hyper-Maintenance of Electroluminescence. J. Electrochem.<br />
Soc., 113, 1966, pp. 40–42.<br />
[4] Fischer A.G.: Electroluminescent Lines in ZnS Powder Particles.<br />
J. Electrochem. Soc., 110, 1963, pp. 733–748.<br />
[5] Porada Z., Cież M.: Model matematyczny opisujący wpływ procesów<br />
starzeniowych na parametry elektroluminescencyjne struktur<br />
grubowarstwowych. <strong>Elektronika</strong>, Vol. LI, No. 6, 2<strong>01</strong>0, pp. 123–125.<br />
<strong>Elektronika</strong> 1/<strong>2<strong>01</strong>2</strong>
Investigations of passive components embedded<br />
in printed circuit boards<br />
(Badania podzespołów biernych wbudowanych<br />
w płytki obwodów drukowanych)<br />
mgr inż. Wojciech Stęplewski 1) , mgr inż. Tomasz Serzysko 1) , dr Grażyna Kozioł 1) ,<br />
mgr inż. Kamil Janeczek 1) , prof. dr hab. inż. Andrzej Dziedzic 2)<br />
1)<br />
Tele and Radio Research Institute, Centre of Advanced Technology, Warsaw<br />
2)<br />
Wrocław University of Technology, Faculty of Microsystem Electronics and Photonics<br />
The concept of passive components embedded between inner<br />
layers of printed circuit board (PCB) was introduced many<br />
years ago. The first trials of embedded capacitors started at<br />
the end of sixties of the last century [1]. In the beginning of seventies<br />
started the applying of NiP layers for manufacturing of<br />
thin layer resistors [2]. Up to present day many materials which<br />
can be used for embedded passives were elaborated. But this<br />
technology is used in small range, especially in military and air<br />
electronics as well as in space electronics. Due to the increasing<br />
number of components which are now required to support<br />
a single active device, the passives are quickly becoming the<br />
major bottleneck in the general miniaturization trend which has<br />
become so important in today’s electronics world. The miniaturization<br />
of conventional passives reaches its limits and the<br />
next obvious choice is to embed the passive components into<br />
the PCB. This allows further miniaturization, has the potential<br />
to reduce cost and moreover exhibits superior electrical behavior<br />
with respect to the minimization of parasitic effects [3, 4].<br />
Despite unquestionable advantages which characterize the embedded<br />
elements, they are not generally used in the production<br />
of PCBs. As well the designing of electronic devices such as<br />
filters, generators, RFID systems and many others, which are<br />
composed of passive components, was not to this time used<br />
on larger scale and knowledge in this matter is still very poor.<br />
Embedding passives will permit to integrate these elements<br />
and whole structures into the PCB. The idea of packing more<br />
and more elements in PCBs by application and development<br />
of embedding passives technologies becomes a necessity for<br />
electronic equipment producers.<br />
Materials and structures<br />
Thin-film resistors<br />
In the investigations two types of materials with sheet resistance<br />
of 25 Ω/□ (thickness 0.4 µm) and 100 Ω/□ (thickness 0.1 µm)<br />
were used. Thin-film resistors were designed in three sizes, which<br />
were fabricated on ten specimens of the same size in configuration:<br />
1.5 mm × 4 squares, 1.0 mm × 2 squares, 0.5 mm × 1<br />
square, 1.0 mm × 2 squares.<br />
Thick-film resistors<br />
For manufacturing of the resistors the inks with sheet resistance<br />
200 Ω/□ (ED7100_200 Ω – carbon ink), 20 Ω/□ (ED7500_20 Ω –<br />
carbon-silver ink) and 5 kΩ/□ (ED7500_5 kΩ – carbon-silver ink)<br />
were used. These inks were applied by screen printing through<br />
yellow PET mesh (77T) using a capillary film with a thickness of<br />
25 µm. The resistors were designed in the form of bars, which are<br />
optimal for screen printing. The resistors had the same sizes as<br />
the afore mentioned thin-film resistors. The resistors were printed<br />
on Cu contacts (Fig. 1a), asymmetric Cu contacts (Fig. 1b) to<br />
compensate mechanical stresses [5], Cu contacts with protective<br />
Ni/Au coating (Fig. 1c) and Ag contacts (Electrodag PF-050 ink,<br />
Fig. 1d).<br />
a)<br />
b)<br />
c)<br />
d)<br />
Capacitors<br />
Cu contacts<br />
resistive layer<br />
asymmetric Cu contacts<br />
resistive layer<br />
contacts with protective coating Ni/Au<br />
resistive layer<br />
Ag layer<br />
resistive layer<br />
Cu contact<br />
Fig. 1. Type of contacts: a) Cu; b) asymmetric Cu; c) Cu with protective<br />
coating Ni/Au; d) Ag<br />
Rys. 1. Rodzaje pól kontaktowych: a) Cu; b) asymetryczne Cu;<br />
c) z warstwa ochronną Ni/Au; d) Ag<br />
FaradFlex BC24 M and BC12TM dielectric materials with basic<br />
parameters shown in Table 1 were used for fabrication of capacitors.<br />
Tabl. 1. Basic properties of used capacitance materials<br />
Tab. 1. Podstawowe parametry użytego materiału pojemnościowego<br />
Properties BC24 M BC12TM<br />
Dielectric thickness [µm] 24 12<br />
C P<br />
1 MHz/1 GHz [pF/cm 2 ] 180/160 700/600<br />
D K<br />
1 MHz/1 GHz 4.4/4.0 10/8.5<br />
Dielectric strength [kV/mil] 7.0+ 5.8<br />
<strong>Elektronika</strong> 1/<strong>2<strong>01</strong>2</strong> 41
Nine types of capacitors are designed with the following parameters:<br />
– BC24 M capacitances in the range of 1.5 pF (for a nominal<br />
electrodes area of 0.9 mm × 0.9 mm) to 352.8 pF (14 mm ×<br />
14 mm);<br />
– BC12TM capacitances in the range of 5.7 pF (0.9 mm ×<br />
0.9 mm) to 1372 pF (14 mm × 14 mm).<br />
Combined material for embedded resistors and capacitors<br />
The composite Ohmega/FaradFlex used in performed tests<br />
consisted of a thin film capacitive layer BC24 M with the thickness<br />
of 24 µm enclosed between two copper foils each with 35 µm<br />
thickness. Under one of the foils a NiP 25 Ω/square resistive layer<br />
is applied.<br />
For the investigation the test board containing the electronic<br />
circuit composed of capacitor and resistor forming a low-pass filter<br />
was designed. All resistors were designed with a width of 0.5 mm.<br />
The project included a correction to compensate for a resistance<br />
increase during the manufacturing processes by 15%.<br />
Results<br />
Impact of oxide treatment and lamination on resistance<br />
The most important manufacturing steps which have a significant<br />
influence on the parameters of embedded resistors are oxide<br />
treatment processes and lamination. Oxide treatment processes<br />
were carried out in an aggressive environment of which the main<br />
ingredient was sulfuric acid (J-KEM technology). During the lamination<br />
the devices were exposed to high pressure (30 bar) and<br />
high temperature (up to 180°C) [6]. The exemplary resistance<br />
changes after oxide treatment process and lamination are presented<br />
in Figures 3–7.<br />
Tabl. 2. Parameters of designed low-pass filters<br />
Tab. 2. Parametry zaprojektowanych filtrów dolnoprzepustowych<br />
Lp.<br />
R<br />
[kΩ]<br />
R<br />
length<br />
[mm]<br />
C<br />
[pF]<br />
C<br />
size<br />
[mm]<br />
cutoff frequency<br />
[kHz]<br />
1. 1.000 17.00 318.31 13.68 × 13.68 500.00<br />
2. 0.330 5.61 482.29 16.84 × 16.84 1 000.00<br />
3. 0.150 2.55 212.21 11.17 × 11.17 4 999.92<br />
4. 0.082 1.39 194.09 10.69 × 10.69 10 000.08<br />
5. 0.056 0.95 56.84 5.78 × 5.78 50 000.97<br />
Fig. 3. Example of resistance changes after J-KEM brown oxide processes<br />
and lamination, 25 Ω /□<br />
Rys. 3. Przykładowe zmiany rezystancji po procesie nakładania tlenków<br />
w technologii J-KEM i prasowaniu, 25 Ω /□<br />
Experimental<br />
The basic functional parameters of embedded passives like resistance<br />
and capacitance and their dependence on parameters<br />
of the manufacturing process were examined. The environmental<br />
tests in changing temperature were used additionally.<br />
The measurements of resistor resistance were made with<br />
the aid of Agilent 344<strong>01</strong>A laboratory multimeter. The four-point<br />
method which permits for the elimination of the measuring cable<br />
resistance on the measurement results was used.<br />
The capacitance of the capacitors was measured by the LCR<br />
HAMEG type HM8118 laboratory bridge which was equipped with<br />
the appropriate coaxial cables assembled in a configuration of<br />
three terminals 3T. This configuration reduces the effects of stray<br />
capacitance.<br />
The influence of climatic variation on the resistance value of<br />
resistors was investigated in the CTS-70/200 Climatic Chamber.<br />
The durability of PCBs with resistors were tested on thermal cycles<br />
with temperature changes in the range of -40…85˚C. The duration<br />
of one cycle was 8.5 hours. Figure 3 shows the scheme of<br />
the cycle. 120 exposure cycles were made.<br />
Fig. 2. Scheme of the temperature cycle<br />
Rys. 2. Schemat cykli temperaturowych<br />
42<br />
Temperature [ C]<br />
100<br />
80<br />
60<br />
40<br />
20<br />
0<br />
-20<br />
-40<br />
-60<br />
-80<br />
2˚C/min<br />
2˚C/min<br />
0 0,5 1 2 3 4 5 6 7 8 8,5<br />
0,5 h 0,5 h 3 h 0,5 h 3 h 0,5 h<br />
Time [h]<br />
Fig. 4. Example of resistance changes after J-KEM brown oxide processes<br />
and lamination, 100 Ω /□<br />
Rys. 4. Przykładowe zmiany rezystancji po procesie nakładania tlenków<br />
w technologii J-KEM i prasowaniu, 100 Ω /□<br />
Change of resistance [%]<br />
10<br />
5<br />
0<br />
-5<br />
-10<br />
-15<br />
20<br />
0 10 20 30 40<br />
1.5 mm 1.0 mm 0.5 mm 1.0 mm<br />
after oxides<br />
Number of resistor<br />
after laminaon<br />
Fig. 5. Example of resistance changes after J-KEM brown oxide processes<br />
and lamination, ED7100 200 Ω /□<br />
Rys. 5. Przykładowe zmiany rezystancji po procesie nakładania tlenków<br />
w technologii J-KEM i prasowaniu, ED7100 200 Ω /□<br />
<strong>Elektronika</strong> 1/<strong>2<strong>01</strong>2</strong>
Change of resistance [%]<br />
10<br />
5<br />
0<br />
-5<br />
-10<br />
-15<br />
-20<br />
0 10 20 30 40<br />
1.5 mm 1.0 mm 0.5 mm 1.0 mm<br />
after oxides<br />
Number of resistor<br />
after lamianation<br />
Change of resistance[%]<br />
NiP 25 ohm<br />
6<br />
NiP 100 ohm<br />
4<br />
2<br />
0<br />
-2<br />
-4<br />
-6<br />
-8<br />
-10<br />
-12<br />
1.5 mm 1.0 mm 0.5 mm 1.0 mm<br />
0 10 20 30 40<br />
Number of resistor<br />
Fig. 6. Example of resistance changes after J-KEM brown oxide processes<br />
and lamination, ED7500 20 Ω /□<br />
Rys. 6. Przykładowe zmiany rezystancji po procesie nakładania tlenków<br />
w technologii J-KEM i prasowaniu, ED7500 20 Ω /□<br />
Fig. 9. Example of resistance changes after double reflow soldering<br />
process, NiP 25 Ω /□ and 100 Ω /□<br />
Rys. 9. Przykładowe zmiany rezystancji po procesie dwukrotnego lutowania<br />
rozpływowego, NiP 25 Ω /□ and 100 Ω /□<br />
Change of resistance [%]<br />
10<br />
5<br />
0<br />
-5<br />
-10<br />
-15<br />
-20<br />
0 10 20 30 40<br />
1.5 mm 1.0 mm 0.5 mm 1.0 mm<br />
after oxides<br />
Number of resistor<br />
after lamination<br />
Change of resistance[%]<br />
6<br />
4<br />
2<br />
0<br />
-2<br />
-4<br />
-6<br />
ED7100_200ohm<br />
ED7500_20ohm<br />
ED7500_5kohm<br />
1.5 mm 1.0 mm 0.5 mm 1.0 mm<br />
0 10 20 30 40<br />
Number of resistor<br />
Fig. 7. Example of resistance changes after J-KEM brown oxide processes<br />
and lamination, ED7500 5 kΩ /□<br />
Rys. 7. Przykładowe zmiany rezystancji po procesie nakładania tlenków<br />
w technologii J-KEM i prasowaniu, ED7500 5 kΩ /□<br />
Fig. 10. Example of resistance changes after double reflow soldering<br />
process, ED7100, ED7500<br />
Rys. 10. Przykładowe zmiany rezystancji po procesie dwukrotnego<br />
lutowania rozpływowego, ED7100, ED7500<br />
Fig. 8. Reflow soldering profile<br />
Rys. 8. Profil lutowania rozpływowego<br />
The oxide treatment increased the resistance of thin-film resistors<br />
(Fig. 3–4). On the exposure of acid solution the thin resistive<br />
layer was slowly dissolving. As a result, there is a reduction of thickness.<br />
The influence of acid solution on thick-film resistors was<br />
significantly lower. The lamination process caused only a slight<br />
change in resistance of thin-film resistors. In the case of thick-film<br />
resistors the influence of this process was more significant. This<br />
is due to the phenomenon of an additional resistor curing under<br />
high pressure and temperature. Additional curing of the resistors<br />
at the lamination temperature reduced the changes resulting from<br />
the lamination process. In the investigations it was found that<br />
a second lamination process at a temperature of 180°C reduced<br />
the resistance changes to 1–2% without deterioration of resistor<br />
properties.<br />
The resistors were also exposed to a temperature profile simulating<br />
a lead-free reflow soldering process (Fig. 8). Maximum<br />
temperature on the PCB surface was about 250°C. It was done<br />
double reflow soldering process.<br />
Double reflow soldering did not cause changes in the case<br />
of thin-film resistor 25 Ω /□. Resistors made from the layers of<br />
100 Ω /□ had slight changes in the resistance between +2% and<br />
-2%. The 100 Ω /□ layer was four times thinner. Therefore in<br />
soldering process higher changes of resistance may reveal. Laminated<br />
thick film resistors were characterized by changes at<br />
the level of 2% in the case of carbon ink and 2…5% for carbonsilver<br />
inks.<br />
Environmental tests of resistors<br />
The Figures 11–14 present the change in resistance of embedded<br />
resistors after 120 thermal cycles in a climatic chamber.<br />
After 120 temperature cycles the increase of thin-film resistors<br />
resistance from 1–1.5% for the NiP layer 25 Ω /□ to 1.5–2.5% in<br />
the case of NiP layer 100 Ω /□ was noticed. Slightly smaller changes<br />
of 25 Ω /□ layer resistance in temperature cycles were likely<br />
a result of its greater thickness. The thick-film resistors with Cu<br />
contacts exhibit very large resistance changes, especially for the<br />
width of 0.5 mm. The use of the Ag or Ni/Au contact layers definitely<br />
improves the quality of connection between ink and contact.<br />
Significant worse quality of resistors with Cu contacts might result<br />
from poorer adhesion or chemical reactions between used inks<br />
and copper contacts. The use of special asymmetric Cu contacts<br />
did not meet their requirements (i.e. it did not compensate<br />
mechanical stresses during temperature cycles). The changes in<br />
resistance were significant and the highest in this case.<br />
<strong>Elektronika</strong> 1/<strong>2<strong>01</strong>2</strong> 43
Change of resistance [%]<br />
5<br />
4,5<br />
NiP 25 ohm<br />
NiP 100 ohm<br />
4<br />
3,5<br />
3<br />
2,5<br />
2<br />
1,5<br />
1<br />
0,5<br />
0<br />
1.5 mm 1.0 mm 0.5 mm 1.0 mm<br />
0 10 20 30 40<br />
Number of resistor<br />
Fig. 11. Example of resistance changes after 120 cycle climatic tests,<br />
NiP 25 Ω /□ and 100 Ω /□<br />
Rys. 11. Przykładowe zmiany rezystancji po 120 cyklach testów klimatycznych,<br />
NiP 25 Ω /□ and 100 Ω /□<br />
Change of resistance [%]<br />
100<br />
80<br />
60<br />
40<br />
20<br />
0<br />
Cu asymmetric Cu Au Ag<br />
-20<br />
1.5 mm 1.0 mm 0.5 mm 1.0 mm<br />
0 10 20 30 40<br />
Number of resistor<br />
Fig. 12. Example of resistance changes after 120 cycle climatic tests,<br />
ED7100 200 Ω /□<br />
Rys. 12. Przykładowe zmiany rezystancji po 120 cyklach testów klimatycznych,<br />
ED7100 200 Ω /□<br />
The best results were obtained for both type of thin-film resistors<br />
and for thick-film resistors printed on Ag and Ni/Au contact<br />
pads. The use of precise laser trimming in advance allows<br />
to achieve resistance values within a tolerance of 1% by taking<br />
into account the expected changes caused by the manufacturing<br />
steps.<br />
Generally, with a decrease of resistor size the obtained results<br />
were less reproducible and exhibited the largest variance. It is<br />
especially visible for the smallest resistors (with the 0.5 mm size).<br />
It was noticed both in technological processes as well as in the<br />
case of environmental tests. Together with the size decrease an<br />
impact of technological precision on the achieved results increased.<br />
This is mostly observable in the case of thick-film resistors.<br />
Effects of screen printing techniques inaccuracy such as resistor<br />
edges irregularity and ink distribution were caused by resistors<br />
behavior under conditions of technological operations or environmental<br />
exposures. The accuracy of technological operation<br />
depended on an engineer experience and a precision of used<br />
equipment.<br />
Embedded capacitors<br />
In the investigations the significant influence of the oxide treatment<br />
processes on the obtained value of capacity was not found<br />
out. Lamination process resulted in the change of capacitance up<br />
to the level of 1–3% for BC24 M materials. The reason of this phenomenon<br />
was probably a slight decrease in distance between the<br />
plates. In the case of BC12TM material the observed capacitance<br />
changes were slightly below 1%. The capacitance changes were<br />
mainly influenced by the alignment of the electrodes.<br />
Capacitors made of BC24 M had a smaller dispersion of capacitance<br />
and a higher reproducibility than capacitors made<br />
of BC12TM. In the case of the smallest capacitors (less than<br />
0.25 cm 2 , 45 pF for BC24 M and 175 pF for BC12TM) inaccuracies<br />
100<br />
Cu asymmetric Cu Au Ag<br />
12<br />
80<br />
10<br />
Change of resistance [%]<br />
60<br />
40<br />
20<br />
0<br />
-20<br />
1.5 mm 1.0 mm 0.5 mm 1.0 mm<br />
0 10 20 30 40<br />
Number of resistor<br />
Relative deviation [%]<br />
8<br />
6<br />
4<br />
2<br />
0<br />
1,5<br />
1,5<br />
1,5<br />
2,8<br />
2,8<br />
2,8<br />
5,5<br />
5,5<br />
5,5<br />
11,3<br />
11,3<br />
11,3<br />
22,1<br />
22,1<br />
22,1<br />
22,1<br />
45,0<br />
45,0<br />
45,0<br />
45,0<br />
45,0<br />
45,0<br />
88,2<br />
88,2<br />
180,0<br />
180,0<br />
352,8<br />
352,8<br />
Capacitance [pF]<br />
Fig. 13. Example of resistance changes after 120 cycle climatic tests,<br />
ED7500 20 Ω /□<br />
Rys. 13. Przykładowe zmiany rezystancji po 120 cyklach testów klimatycznych,<br />
ED7500 20 Ω /□<br />
Fig. 15. Capacitance after lamination, BC24 M material<br />
Rys. 15. Pojemność po prasowaniu, materiał BC24 M<br />
100<br />
80<br />
Cu asymmetric Cu Au Ag<br />
0<br />
-5<br />
5,7<br />
5,7<br />
5,7<br />
10,9<br />
10,9<br />
10,9<br />
21,4<br />
21,4<br />
21,4<br />
43,8<br />
43,8<br />
43,8<br />
85,8<br />
85,8<br />
85,8<br />
85,8<br />
175,0<br />
175,0<br />
175,0<br />
175,0<br />
175,0<br />
175,0<br />
343,0<br />
343,0<br />
700,0<br />
700,0<br />
1372,0<br />
1372,0<br />
Fig. 14. Example of resistance changes after 120 cycle climatic tests,<br />
ED7500 5 kΩ /□<br />
Rys. 14. Przykładowe zmiany rezystancji po 120 cyklach testów klimatycznych,<br />
ED7500 5 kΩ /□<br />
44<br />
Change of resistance [%]<br />
60<br />
40<br />
20<br />
0<br />
-20<br />
1.5 mm 1.0 mm 0.5 mm 1.0 mm<br />
0 10 20 30 40<br />
Number of resistor<br />
Relative deviation [%]<br />
-10<br />
-15<br />
-20<br />
-25<br />
-30<br />
Capacitance [pF]<br />
Fig. 16. Capacitance after lamination, BC12TM material<br />
Rys. 16. Pojemność po prasowaniu, materiał BC12TM<br />
<strong>Elektronika</strong> 1/<strong>2<strong>01</strong>2</strong>
of capacitor plate positioning resulted even in a few times larger<br />
difference between obtained and designed capacitance values<br />
than in the case of the capacitors with a relatively large electrode<br />
area (approximately 8% to 2% in the case of the capacitors made<br />
with BC24 M material). In order to achieve capacitance values<br />
with the highest possible accuracy the errors of capacitor electrodes<br />
alignment (photochemigraphy) and errors in the etching<br />
process (over etching, under etching) should be minimized.<br />
Combined Capacitance and Resistance Material<br />
The cut-off frequency of manufactured low-pass filters varied from<br />
-6.5% to -13.5% with regard to their designed values. Smaller<br />
values of frequency than designed one was caused mainly by<br />
higher capacitance values.<br />
It was found that changes in resistance of the resistive material<br />
25 Ω/□ in technological processes were at the level of 14…20%.<br />
These changes were comparable to the resistance changes of resistors<br />
produced with the Ohmega-Ply material. Achieved capacitances<br />
of the capacitors were around 7% higher than designed.<br />
Etched plates were size with high accuracy compatible with the<br />
design so the higher capacitance was resulted from the higher<br />
capacitance of used material. This is caused by either shorter<br />
distance between the plates, a value difficult to measure due to<br />
the very developed surface on the copper plate or a greater value<br />
of dielectric constant.<br />
lower ranges of resistance. The thick film technology allows to<br />
design resistors in a wide range of resistance (from some Ω to<br />
MΩ). The use of dielectric material additionally gives the possibility<br />
to place a significant percentage of the passive components<br />
inside the printed circuit boards. It allows to save space on the<br />
surface and to miniaturize the system. Expanding the embedding<br />
techniques also on inductive elements would even allow to design<br />
embedded low and high pass filters, filter units (amplifiers),<br />
decoupling capacitors and matching resistors in memory and<br />
processor sets, and even RFID systems and simple generators.<br />
The use of a new generation of materials in this technology is an<br />
important step towards full integration of passive components into<br />
the assembly substrate.<br />
Investigations were made as part of the Operational Programme<br />
Innovative Economy, 2007–2<strong>01</strong>3, the Priority of 1 Investigation<br />
and High Technology Development, Action 1.3<br />
supporting B+R Projects for entrepreneurs carried out by scientific<br />
units, 1.3.1 Development Projects. The agreement No: UDA-<br />
POIG.<strong>01</strong>.03.<strong>01</strong>-14-031/08-04 of 16.02.2009, Title of Project: „Technologia<br />
doświadczalna wbudowywania elementów rezystywnych<br />
i pojemnościowych wewnątrz płytki drukowanej”, Project No:<br />
POIG.<strong>01</strong>.03.<strong>01</strong>-00-031/08.<br />
0<br />
1,0 50,0 10,0 5,0 0,5<br />
Relave deviation [%]<br />
-5<br />
-10<br />
-15<br />
-20<br />
-25<br />
Frequency [MHz]<br />
Fig. 17. Calculated cut-off frequency of sample filters<br />
Rys. 17. Obliczona częstotliwość graniczna próbek filtrów<br />
Summary<br />
The combination of thin- and thick-film techniques for manufacturing<br />
embedded resistors allows a significant extension of the<br />
range of possible resistance values. The thin-film resistors give<br />
better accuracy, stability and high level of miniaturization in the<br />
References<br />
[1] J.S. Peiffer: „Embedded Passives: Debut in Prime Time”, Printed Circuit<br />
Design & Fab, <strong>01</strong> October 2009.<br />
[2] B. Mahler: „The Design and Use of NiP Embedded Thin-Film Resistive<br />
Materials for Series and Parallel Termination”, CircuiTree, Winter<br />
2<strong>01</strong>1, Vol. 24, No. 1.<br />
[3] W. Jillek, W.K.C. Yung: „Embedded components in printed circuit<br />
boards: a processing technology review”, Int. J. of Advanced Manufacturing<br />
(2005) 25, pp. 350–360.<br />
[4] S. O’Reilly, M. Duffy, T. O’Donnell, P. McCloskey, S.C. Ó Mathúna:<br />
„Integrated passives in advanced printed wiring boards”, Circuit<br />
World 27/4 [20<strong>01</strong>], pp. 22–25.<br />
[5] R.C. Snogren: „Embedded Passives in Printed Circuit Boards”, Defence<br />
Manufacturing Conference 2004.<br />
[6] W. Stęplewski, J. Borecki, G. Kozioł, A. Araźna, A. Dziedzic, P.<br />
Markowski: „Influence of selected constructional and technological<br />
factors on tolerance and stability of thin-film resistors embedded in<br />
PCBs”, <strong>Elektronika</strong>, Vol 52, No. 4, 2<strong>01</strong>1, pp 119–122.<br />
Przypominamy o prenumeracie miesięcznika <strong>Elektronika</strong> na <strong>2<strong>01</strong>2</strong> r.<br />
<strong>Elektronika</strong> 1/<strong>2<strong>01</strong>2</strong> 45
GENESI: Wireless Sensor Networks for structural monitoring<br />
(GENESI: Bezprzewodowa sieć sensorów do monitorowania strukturalnego)<br />
BE MEng Sc Brendan O’Flynn 1, 2, 3) , Dr. David Boyle 2, 3) , Dr. E. Popovici 1, 2, 3) ,<br />
Phd. Ing. Michele Magno 3, 4) , PhD C. Petrioli 5)<br />
1)<br />
Clarity CENTRE, 2) Tyndall National Institute, 3) University College Cork, Ireland<br />
4)<br />
University of Bologna Italy, 5) University of Rome, Italy<br />
The GENESI project has the ambitious goal of bringing WSN technology<br />
to the level where it can provide the core of the next generation<br />
of systems for structural health monitoring that are long<br />
lasting, pervasive and totally distributed and autonomous. Sensor<br />
nodes are being redesigned to overcome their current limitations,<br />
especially concerning energy storage and provisioning (we need<br />
devices with virtually infinite lifetime) and resilience to faults and interferences<br />
(for reliability and robustness). New software and protocols<br />
will be defined to fully take advantage of the new hardware,<br />
providing new paradigms for cross-layer interaction at all layers of<br />
the protocol stack and satisfying the requirements of a new concept<br />
of Quality of Service (QoS) that is application-driven, truly reflecting<br />
the end user perspective and expectations. The GENESI system<br />
will be deployed in two pilot deployments; namely the monitoring of<br />
a bridge (Pont de la Poya, Switzerland) and a metro tunnel (Metropolitana<br />
Linea B, Rome), both during and after construction.<br />
System requirement analysis<br />
GENESI (Green sEnsor NEtworks for Structural monItoring) [1]<br />
exhibits a range of system requirements from a variety of established<br />
and emerging technical scientific disciplines.<br />
The systems are required to be “Green” and Sustainable – The<br />
use of energy scavanging techniques (i.e. harnessing available<br />
environmental energy) to extend the lifetime of GENESI nodes<br />
will be employed. Realistic potential sources include solar and<br />
wind energy. A fuel cell or series of fuel cells, capable of providing<br />
significant amounts of energy, will also be integrated in the design<br />
of a novel power unit. This unit may also make use of integrated<br />
suitable battery cell(s) and/or other storage techniques (such as<br />
capacitors). It should provide sufficient energy to power the GE-<br />
NESI wireless sensor nodes for extended periods of time.<br />
In addition to developing novel hardware to address the challenge<br />
of providing a solution for structural health monitoring with<br />
virtually infinite lifetime, appropriate algorithms and networking<br />
protocols must be developed to facilitate these goals. The lowest<br />
possible amounts of energy should be consumed during periods<br />
of communication, algorithms and protocols should account for<br />
fluctuating available energy whilst exhibiting fault tolerance in the<br />
presence of malfunctioning devices and lossy channels. Finally,<br />
the overall system should ensure maintenance of suitable levels<br />
of quality of service.<br />
The GENESI nodes, with minimal maintenance from initial deployment,<br />
are required to have an operational lifespan extending<br />
to decades and the following characteristics:<br />
Portability – The intended use of the system requires that, during<br />
the construction phase, one of the desirable properties of the<br />
proposed GENESI system is that it should facilitate easy redeployment,<br />
or repositioning, of the nodes/sensors as construction<br />
work progresses. For example, when one section of monitored<br />
construction is complete, it should be easy for the sensor nodes<br />
to be moved to the next section, Alternatively, they should be reconfigured<br />
in their current position to allow for a different type<br />
of monitoring, for instance moving from a monitoring modality<br />
intended for the construction phase, to long term monitoring of<br />
the system in operation. This functionality should be considered<br />
thoroughly as the design of the system progresses. It will relate<br />
to both the physical aspects of the GENESI devices (form factor<br />
46<br />
– size, mass, connectors, packaging, etc.) and also the networking<br />
and dynamic reprogramming of the devices.<br />
Robustness – GENESI is intended for use in the monitoring of<br />
structures. As such, its field of deployment is naturally rugged. The<br />
devices must be packaged in accordance with the requirements<br />
of the deployment field. Therefore, the end system must be robust<br />
in terms of physical protection from the environment (against elements<br />
such as moisture, lightning, temperature extremes, etc.),<br />
and also exhibit robust physical features such as protection from<br />
impacts/shocks, large simple connectors, etc. In addition to protection<br />
and increased robustness of the GENESI node, the system<br />
architecture should ensure reliability against node failures. The system<br />
should be capable of detecting failures and malfunctioning<br />
system components, should support adequate actions to cope<br />
with problems, e.g. restarting devices and reconfiguring them. Itshould<br />
be self-healing and robust in case of permanent failure, e.g.<br />
by dynamically changing routes, reallocating application tasks.<br />
Flexibility – GENESI should be flexible enough in design to<br />
ensure that it is applicable to a wide range of structural monitoring<br />
scenarios beyond the pilot deployments. This will ensure maximum<br />
impact to the overall market.<br />
Maximization of end-user utility – The development of protocols<br />
and algorithms to ensure the highest levels of system responsiveness<br />
and end-user perceived service quality by fully exploiting the<br />
variable energy availability of harvesting devices.<br />
Interoperability with existing front-ends– the system should be<br />
compatible with the existing front-end provided by the end-user<br />
partners<br />
In summary, GENESI must provide a robust wireless sensor<br />
network for structural health monitoring that exhibits high levels<br />
of quality of service, dramatically enhanced network lifetime, minimal<br />
maintenance requirements, flexibility to a wide range of monitoring<br />
scenarios and dynamic configurability in the field. It must<br />
also be compatible with existing front-end structural monitoring<br />
solutions and significantly reduce overall costs for structural health<br />
monitoring in the field.<br />
GENESI Device Level Specification<br />
In order to facilitate rapid prototyping and experimentation with<br />
various interfaces, both to sensors and power solutions, a modular<br />
approach to the design of the final hardware platform has<br />
been adopted. To this end, a prototype of the GENESI node has<br />
been developed by Tyndall, and the core components of which<br />
are described in the following sections:<br />
Sensors<br />
The sensors to be used for the two initial deployment scenarios<br />
are of the “off-the-shelf” variety. The requirement exists for the<br />
development of sensor interface layers to correspond to the type<br />
of communication supported by the sensors themselves. 2, 3 and<br />
4-wire analogue, RS 485, RS 232 and SPI (digital) interfaces<br />
are required. Additionally, given the variety of supplies required<br />
for individual sensors – a number of power rails will be required.<br />
Similar interfacing must be achieved between the sensors, the<br />
motherboard and the smart power unit. In order to achieve the<br />
required 16-bit granularity for some of the sensors, an additional<br />
analog-to-digital converter (ADC) chip is required.<br />
<strong>Elektronika</strong> 1/<strong>2<strong>01</strong>2</strong>
RF and Microcontroller Requirements<br />
The primary enabling technologies of wireless sensor networks<br />
are low-power RF communication and microcontroller components.<br />
In keeping with design goals for the GENESI, state-of-theart<br />
and standard compliant (IEEE 802.15.4) radio transceivers<br />
are implemented in combination with an appropriate microcontroller<br />
(e.g. Texas Instruments MSP430). In order to comply with<br />
GENESI objectives of ultra-low power operation for extended<br />
node lifetime, the lowest power components are chosen in the<br />
design of the electronic hardware.<br />
RF Transceiver<br />
The IEEE 802.15.4 standard for low-rate wireless personal<br />
area networks (LR-WPAN) is the most prominent and applicable<br />
for use with wireless sensor networks [2], underpinning a range<br />
of higher level standards and specifications (including ZigBee<br />
[3], 6LoWPAN [4] and WirelessHART [5]). It provides optimal<br />
trade-offs with respect to range, data rates and power consumption,<br />
in comparison with other wireless communications technologies<br />
that could be applicable to the GENESI platform (such as<br />
Bluetooth, WiFi, etc.; which usually offer superior data rates for<br />
higher power cost over a shorter range). The standard originally<br />
(2003) prescribed two physical layers based upon direct sequence<br />
spread spectrum (DSSS) techniques – one working in the<br />
868 (Europe)/915 (North America) MHz bands, the other in the<br />
2.4 GHz band. In Europe, the 868 MHz band allowed for only<br />
one communications channel (with a transfer rate of 20 kbps<br />
(prior to the 2006 revision of the standard)), whereas the worldwide<br />
2.4 GHz band allows up to 16 channels with a transfer rate<br />
of 250 kbps.<br />
The decision for GENESI to function in the 2.4 GHz band was<br />
agreed based upon the need for a number of channels and reasonable<br />
data rates – thus ensuring the possibility to enhance quality<br />
of service and meet design requirements for the project. We are<br />
also investigating the possibility to add a second radio on GENE-<br />
SI platform operating in the 868 MHz band for specific application<br />
scenarios where 2.4 GHz band may suffer from severe interference<br />
(such as structural health monitoring in buildings).<br />
In choosing an appropriate RFIC, one is limited to those available<br />
commercially. The most well known transceiver in the WSN<br />
domain is the Texas Instruments CC2420 [6]. This transceiver<br />
supports the IEEE 802.15.4-2003 standard, operating in the 2.4<br />
GHz channel. Along with its successor, the CC2520, the Atmel<br />
AT86RF231 and the Analog Devices ADF7242, are all state-ofthe-art<br />
transceivers under consideration for the final GENESI system<br />
specification.<br />
Smart Power System<br />
From the perspective of power requirements<br />
for the GENESI system it is noticeable that<br />
industrial batteries on the market have a number<br />
of limitations from both the user and equipment<br />
perspective.<br />
Firstly, they represent an unpredictable<br />
source of power. A user can have a little advantage<br />
if he knows that the battery is about<br />
to run out of energy or how much operating<br />
time is left. Secondly, the device cannot determine<br />
if the battery, in its current state, is<br />
capable of supplying adequate power for an<br />
additional load (e.g. spinning up a hard disk<br />
in a laptop, turn on a flash-light in a camera,<br />
or start a burst radio transmission in a WSN).<br />
Finally,, battery chargers must be individually<br />
tailored for use with specific battery chemistry<br />
and may cause damage if used on different<br />
storage device.<br />
For these reasons, the specification of an<br />
enhanced battery (called the Smart Power System,<br />
see Figures) which can overcome the limitation of traditional<br />
batteries and jointly exploit the features of an energy harvester<br />
appears to be a winning approach. In this way, it is also possible<br />
to significantly improve the availability of power for the node; one<br />
of the most important factors towards the successful realisation of<br />
the GENESI sytem.<br />
Smart Energy Supply<br />
The GENESI Smart Power System has the following features:<br />
multi-harvester (wind, solar, thermal, etc.), multi-energy storage<br />
(e.g. super capacitor, batteries), intelligent interface to receive<br />
and provide information regarding energy availability, the fuel cell<br />
interface, and allow flexibility in operation.<br />
Energy harvesting devices convert ambient energy into electrical<br />
energy and it is possible to tailor the power source to satisfy<br />
the different power consumption requests various sensors and<br />
scenarios in which the nodes will be deployed.<br />
Depending on the scenario, a multi-harvesting unit able to<br />
convert energy from different kind of ambient source (solar, wind,<br />
thermal, etc.) is a good approach.<br />
The energy harvesting requirements are directly related to the<br />
average power consumption of the application and depend on the<br />
expected quality of service and use-case requirements (sensing<br />
rate, distance between nodes and transmission power, etc.). Moreover,<br />
the different modules or typology of harvesting depends<br />
on the environment where the node is deployed. (For example,<br />
the use of photovoltaic cells, in an underground scenario, may<br />
provide less power than other sources, such as thermal. The opposite<br />
is true when the WSN is deployed outdoors).<br />
Considering that one of the locations where the GENESI platform<br />
will be placed is a bridge, it has been decided that a windphotovoltaic<br />
energy harvester is an optimal choice for implementation.<br />
The choice of a modular and flexible architecture of the<br />
harvester facilitates the interface operation with the fuel cell section,<br />
but also with other energy transducers not originally planned<br />
in this project (i.e. piezoelectric, thermal ones).<br />
It is also expected that a significant amount of wind energy<br />
should be available in the tunnel deployment (due to air-conditioning<br />
and passing metro carriages), whereas, the photovoltaic<br />
energy may be in significantly lesser supply.<br />
The Smart Power System will dynamically select the harvesting<br />
source (if the node is provided with more harvesters) and will<br />
adjust the power conversion parameters to extend the node lifetime.<br />
In general, the harvested energy is stored in a super capacitor<br />
and/or battery. Capacitors are used when the application needs<br />
Block diagram of the GENESI Smart Power System<br />
Schemat blokowy inteligentnego zasilania systemu GENESI<br />
<strong>Elektronika</strong> 1/<strong>2<strong>01</strong>2</strong> 47
to provide huge energy spikes. Batteries leak less energy and are<br />
therefore used when the device needs to provide a steady flow of<br />
energy. However the GENESI smart battery system will use both<br />
of these solutions.<br />
A similar architecture to the proposed solution is described in<br />
[7]. The GENESI Smart Power Unit will go beyond the capabilities<br />
described therein, through the provision of the capability to<br />
recharge Li-ion batteries and incorporate electrochemical fuel cell<br />
technology. Futhermore, the GENESI system allows for the transfer<br />
of useful information pertaining to energy status from the unit<br />
to the main processor.<br />
Results and conclusions<br />
Based on the requirements elaborated, the specified system<br />
components have been integrated to form a functional prototype<br />
of the GENESI node. Early experimentation has proven feasible<br />
the integration of off-the-shelf sensors traditionally used in structural<br />
health monitoring with low-power RF and microcontroller<br />
components (i.e. a WSN “mote”). Furthermore, an embodiment of<br />
the smart power system (inclusive of energy harvesting capabilities<br />
and fuel cell technology) has been shown to power the unit.<br />
The prototype is currently under technical evaluation with respect<br />
to electrical characterisation (in various modes) and functionality.<br />
Detailed results will be presented in due course.<br />
The authors would like to acknowledge the support of Science<br />
Foundation Ireland (SFI) for funding the CLARITY CSET, the European<br />
Commission for funding the GENESI project, as well as<br />
Enterprise Ireland, Irelands Higher Education Authority (HEA)<br />
and the funding provided to the National Access Program (NAP)<br />
at the Tyndall National Institute by SFI, all of which have contributed<br />
to this work.<br />
References<br />
[1] (2<strong>01</strong>0) GENESI: Green sEnsor NEworks for Structural monItoring.<br />
[Online]. Available: http://genesi.di.uniroma1.it/<br />
[2] IEEE 802.15.4: Wireless Medium Access Control (MAC) and Physical<br />
Layer (PHY) Specifications for Low-Rate Wireless Personal Area<br />
Networks (LR-WPANs) (2003), 3 Park Avenue, New York, USA:<br />
IEEE.<br />
[3] ZigBee Specification v1.0: ZigBee Specification (2005), San Ramon,<br />
CA, USA: ZigBee Alliance.<br />
[4] Hui J., P. Thubert: Compression Format for IPv6 Datagrams over<br />
IEEE 802.l5.4-Based Networks. RFC 6282, Internet Eng. Task Force,<br />
Sept. 2<strong>01</strong>1.<br />
[5] (2009) HART Communication Foundation. [Online]. Available: http://<br />
www.hartcomm.org/<br />
[6] CC2420 Datasheet. [Online]. Available: http://focus.ti.com/lit/ds/symlink/cc2420.<strong>pdf</strong><br />
[7] Tan Y.K., S.K. Panda: Energy Harvesting from Hybrid Indoor Ambient<br />
Light and Thermal Energy Sources for Enhanced Performance of<br />
Wireless Sensor Nodes. IEEE Transactions on Industrial Electronics,<br />
vol.58, in-press, 2<strong>01</strong>1.<br />
Mechanical and thermal properties of SiC<br />
– ceramics substrate interface<br />
(Mechaniczne oraz cieplne właściwości połączenia między strukturą<br />
SiC a podłożem ceramicznym)<br />
dr hab. inż. Ryszard Kisiel 1) , dr inż. ZBIGNIEW Szczepański 1) , dr inż. Piotr Firek 1) ,<br />
dr inż. MAREK Guziewicz 2) , dr inż. ARKADIUSZ Krajewski 3)<br />
1)<br />
Warsaw University of Technology, Institute of Microelectronics and Optoelectronics, Warsaw<br />
2)<br />
Institute of Electron Technology, Warsaw 3) Warsaw University of Technology, Faculty of Production Engineering, Warsaw<br />
Silicon carbide created new possibilities for high power and high<br />
temperature electronics due to its unusual physical properties,<br />
which are not attainable in conventional silicon semiconductor<br />
material. It has been demonstrated that SiC based power devices<br />
are able to operate at temperatures as high as 450°C [1, 2]. To realize<br />
the high temperature functions of SiC power devices, the development<br />
of high temperature packaging technologies becomes<br />
more and more important. Packaging technologies play main role<br />
in high power and high temperature electronics since they have<br />
an essential effect for the reliability of SiC power devices [8, 9].<br />
One of the main problems of high power package is die bonding<br />
technology, which ought to assure not only mechanically reliable<br />
connection between SiC die and substrate, but also good electrical<br />
conductivity and high thermal conductivity. The latter feature is<br />
especially critical for power devices because it allows for effective<br />
heat transfer from power chip to the package.<br />
State-of-the-art technologies for interconnecting Si power devices<br />
involve attaching one terminal of the semiconductor die to<br />
a heat-sinking substrate with solder alloy or with an electrically<br />
conductive adhesive, while the other terminals are bonded by<br />
aluminum or gold wires as well as flip chip technology. Such interconnection<br />
technologies have several limitations in high-temperature<br />
operation because solder alloys/conductive adhesives<br />
usually have low melting/degradation temperatures. By changing<br />
substrate material is possible to increase heat dissipation. So, the<br />
package with DBC substrate is very good solution for high power<br />
application, since such package significantly improves heat dissipation<br />
and therefore is widely used in high power SiC modules.<br />
48<br />
Investigations of new techniques are necessary for high temperature<br />
and high power SiC devices.<br />
Taking into account mentioned above requirements, only a few<br />
of the known die bonding technologies can fulfill the demands of<br />
high both temperature and power. In this paper, the main attention<br />
was focused on technical problems connected with two die bonding<br />
technologies: low temperature joining technique (LTJT) with the use<br />
of micro- or nanosilver paste [1–4], and modifies hard soldering process<br />
based on Au-Sn and Au-Ge solder alloys [7–9]. LTJT is a process<br />
involving the sintering of micro- and nanosized metal particles.<br />
This die bonding technology, from among various chip attachment<br />
method, characterizes the highest thermal conductivity (240 W/mK),<br />
the lowest electrical resistivity (1.6 × 10 -6 Ωcm), low Young’s modulus<br />
(96 Pa), and the highest operating temperature (theoretical operation<br />
capability up to 960ºC) [6]. Porous microstructure of the sintered<br />
silver layer and low Young’s modulus are profitable, since it helps<br />
thermo-mechanical stresses to relieve. Once the interconnection is<br />
formed, the bonding material is close to be pure metal. Because Ag<br />
is mainly used for this purpose, it will not melt until joint temperature<br />
reaches 961°C. By using nano Ag pastes (particles range 30 nm)<br />
the SiC-substrate interface can be formed by sintering at relatively<br />
low temperature, 275…300°C. Die bonding technology with the use<br />
of low temperature sintering of micro- and nanoscale silver pastes<br />
was previously used in our own investigations concerning assembly<br />
of SiC on DBC substrates [12, 13]. Our current work is concentrated<br />
on using microsized Ag pastes for attachment SiC power die to DBC<br />
substrate, instead of Ag nano pastes. The cost of microsized Ag<br />
powder is significantly less than nanosized Ag powder.<br />
<strong>Elektronika</strong> 1/<strong>2<strong>01</strong>2</strong>
Application of hard solders based on gold alloys is interesting<br />
alternative of packaging method, especially for SiC devices with<br />
aluminum metallization [7]. From among well known solders, only<br />
AuGe and AuSn can fulfill high temperature requirements. To do<br />
this, substrate and SiC aluminum contacts should be solderable.<br />
It is possible if SiC die and substrate contacts are Au covered.<br />
However, very often SiC dies have Al metallization due to its low<br />
electrical resistivity, good adhesion to die and low cost. In this case<br />
soldering is not possible. The properties of top Al layer onto SiC<br />
can be changed by gold stud bump bonding process. To realize<br />
hard soldering for such devices, modification of die bonding process<br />
is necessary. This modification concerns SiC chips preparation<br />
by means of gold stud bump technology [10]. Gold stud bump<br />
technology is commonly used in flip chip bonding technology and<br />
it can be easily used even on single chips with high bonding speed<br />
[10]. When gold bumps will be realized on Al bond pad of SiC die,<br />
then soldering process with the use of high melting temperature<br />
solder alloy Au82Ge12 (eutectic temperature = 356ºC) can be implemented.<br />
This assembly technology will be investigated in future<br />
series of experiments. Both die bonding technology mentioned<br />
above were used in our investigations.<br />
Experimental procedure<br />
To perform the experiments test samples were prepared. As substrate,<br />
the direct bonded copper substrate (DBC) size 10 × 10 mm<br />
was used. The DBC substrate consists of 0.62 mm thick Al 2<br />
O 3<br />
ceramic<br />
plate sandwiched between two pieces of 0.2 mm Cu plates<br />
thermally bonded to ceramic. Cu top layer of DBC was electroplated<br />
by Ni (3 µm thick) and Au (1 µm thick) layers. Main advantages<br />
of such substrate are high thermal and electrical conductivity due<br />
to thick copper layer and very close to SiC die coefficient of thermal<br />
expansion. Additionally in preliminary experiments, instead of SiC<br />
die the DBC substrate size 3 × 3 mm were used with NiAu metallization.<br />
So, in fact of preliminary experiments, DBC size 3 × 3 mm<br />
was attached to DBC substrate size 10 × 10 mm using LTJT.<br />
In this bonding technology usually silver paste is used, which<br />
was made by mixing silver microparticles and organic binder. However,<br />
during sintering process at the temperature above 250ºC,<br />
organic binder didn’t burn out completely. So, binder system has<br />
to be selected very carefully, to avoid such problems. In our investigations,<br />
we applied a novel approach, by using silver microparticles<br />
without organic additives. The silver powder series AX20LC<br />
(manufactured by AMEPOX MICROelectronics, Łódź, Poland)<br />
was used in experiments. It was deposit on bond pads of DBC<br />
substrate by stencil printing. The stencil was made of Kapton foil<br />
with the thickness of 50 µm. Such process is not very easy in realization<br />
and therefore requires training and experience. Next the<br />
DBC test structures size 3 × 3 mm with metallization Ni/Au were<br />
sintered to DBC substrates size 10 × 10 mm with the use of the<br />
low temperature sintering of silver micro particles in air or in high<br />
vacuum. The parameters of performed processes are presented<br />
in Table 1.<br />
Tabl. 1. The adhesion of DBC structures size 3 × 3 mm to DBC substrate<br />
size 10 × 10 mm after received<br />
Tab.1. Adhezja testowych struktur DBC o wymiarach 3 × 3 mm do podłoża<br />
DBC o wymiarach 10 × 10 mm bezpośrednio po procesie łączenia<br />
Test no<br />
Pressure<br />
[MPa]<br />
Joining parameters<br />
Temp.<br />
[°C]<br />
Time<br />
[min]<br />
Way of<br />
heating<br />
Shear force after<br />
sintering [MPa]<br />
1 0.28 350 30 slowly 0.57<br />
2 3.0 350 30 rapid 2.5<br />
3 3.1 350 30 slowly 8.15<br />
4 2,7 350 30 rapid 2.42<br />
5 2.9 350 50 slowly 10.3<br />
6 2.9 350 40 slowly 10.9<br />
Results and Discussion<br />
The influence of LTJT process parameters on adhesion between<br />
DBC structures size 3 × 3 mm to DBC substrate 10 × 10 mm were<br />
also presented in Tab.1 (last column). It can be observed that for<br />
process temperature 350°C the adhesion is strongly correlated<br />
with pressure applied between joining parts and with way of heating.<br />
Two ways of sample heating were realized: by slow heating,<br />
i.e. heating from room temperature up to 350°C with temperature<br />
ramp 6°C/min, and rapid heating by placing the test sample directly<br />
to 350°C. The best results were obtained when pressure<br />
above 3 MPa were applied a joining parts were heated from room<br />
temperature up to joining temperature 350ºC. By rapid placing<br />
joining parts directly in temperature 350ºC the adhesion was significantly<br />
less.<br />
To check the reliability of prepared joints the ageing process<br />
was performed. So, the next series of test samples were jointed<br />
by applying pressure above 3 MPa and temperature 350ºC with<br />
30 min ageing by slow heating. To check the quality of die-substrate<br />
quality, the shear tension range 3 MPa was applied to DBC<br />
structures 3 × 3 mm. Any destruction of joints were observed. Next<br />
the samples were aged 350ºC &24 h in air and adhesion was<br />
again measured. The adhesion after ageing test was dramatically<br />
low, below 0.05 MPa in all cases. Both surfaces after shear test,<br />
performed just after sintering, and after ageing in 350°C&24h in<br />
air were shown in Fig. 1. Fig. 1a shows that cracks occurs in sintered<br />
Ag layer. In majority of surface there were good connection,<br />
only on some areas porous surfaces are seen. Never the less, the<br />
adhesion of presented sample was above 8 MPa. After ageing<br />
test, the joining surface is different, Fig. 1b. There is areas where<br />
continuous thin Ag layer adhere very well to DBC substrate and<br />
some areas are where sintered Ag has poor cohesion and crack<br />
occur through this plane.<br />
The cohesion cracks in nano Ag sintered joints were observed<br />
by other researches [14]. They observed that the delamination<br />
process occurs between the die or substrate metallization and<br />
the silver layer itself. However, observation the cracking surfaces<br />
on both parts shows that thin Ag layer (thickness few micrometers)<br />
adhere very well to both Au layer of DBC. So in the next series<br />
of experiments the thinner layer of Ag between joining parts<br />
was applied and sintering processes were done in vacuum oven<br />
350°C &30 min with pressure 15 MPa. It was found that adhesion<br />
between parts after vacuum sintering is above 3 MPa. Next the<br />
joined samples were aged in air 350°C&24 h. The adhesion after<br />
ageing was again below 0.05 MPa.<br />
So in the next series of experiments the processes were performed<br />
in vacuum and the sintering temperatures were increased<br />
to 500 and 550°C and ageing time was increased to 2 h. During sintering<br />
the pressure 15 MPa was applied. Such prepared samples<br />
were annealing at 350°C and adhesion was measured before ageing<br />
and in time interval as presented in Tabl. 2. The adhesion was<br />
check temporary by applying test shear force range 3 MPa to sample<br />
size 3 × 3 mm 2 . Samples sintered 550°C &2 h and 500°C &2 h<br />
in vacuum survived the shear test 508 h and 125 h, respectively.<br />
a) b)<br />
Fig.1. The top surface of DBC after shear test performed after sintering<br />
(a) and ageing 350°C (b)<br />
Rys. 1. Powierzchnia struktury DBC po teście ścinania: przed starzeniem<br />
(a) i po starzeniu w temperaturze 350°C (b)<br />
<strong>Elektronika</strong> 1/<strong>2<strong>01</strong>2</strong> 49
Next, the adhesion was measured in the destructive test. For samples<br />
sintered 400°C & 1 h in air and subsequent sintering in vacuum<br />
in temperatures 550 or 500°C the shear strength was above<br />
12.3 MPa and 18.1 MPa, respectively.<br />
Tabl. 2. The adhesion between DBC substrates with Au metallization made<br />
by micro Ag sintering process<br />
Tab. 2. Stabilność adhezji struktur DBC z metalizacja Au po procesie<br />
zgrzewania wysokotemperaturowego<br />
Test<br />
No<br />
Sample<br />
preparation<br />
0 h<br />
[MPa]<br />
After<br />
50 h<br />
After<br />
125 h<br />
After<br />
200 h<br />
After<br />
508 h<br />
1 550°C&2h >3 >3 >3 >3 11.2<br />
2<br />
400°C&1h<br />
+550°C&2h<br />
>3 >3 >3 >12.3<br />
3 500°C&2h >3 >3 >3<br />
4<br />
400°C&1h<br />
+500°C&2h<br />
> 3 >3 18.1<br />
So, by increasing the sintering temperature of micrometer size<br />
Ag powder up to 550 or 500°C it was possible to create joints between<br />
two DBC substrates with Au top layer with good adhesion.<br />
The further investigations are necessary to decrease sintering<br />
temperature below 500°C and to check if such high temperature<br />
can destroy SiC semiconductor properties or other elements of<br />
SiC package.<br />
Conclusions<br />
In this paper, there was present the realization of assembly of SiC<br />
samples to DBC substrate (Direct Bonding Copper Substrate with<br />
200 µm Cu metallization Ni/Au covered) by low-temperature sintering<br />
of micro scale Ag powder. In the experiments DBC test samples<br />
size 3 × 3 mm 2 (in place of SiC die) were assembled to DBC<br />
substrate size 10 × 10 mm 2 using following methods: a) sintering<br />
by Ag powder with Ag microparticles in air by applying temperature<br />
and pressure, b) sintering by Ag powder with Ag microparticles<br />
using temperature, pressure and high vacuum. Methods „a” and<br />
„b” permit to obtain very good adhesion range 8…10 MPa after<br />
sintering. However after ageing test at temperature 350°C in air<br />
the adhesion fall down dramatically. By increasing sintering temperature<br />
up to 500…550°C and sintering in vacuum range 1.3 Pa<br />
(method „b”) the adhesion is satisfactory, even when ageing time<br />
at 350°C was increased up to 508 h. Destructive tests show that<br />
by sintering samples in vacuum and applying temperature range<br />
500°C the adhesion between two DBC substrates (Au plated) can<br />
be significantly higher than 10 MPa for exploitation temperatures<br />
up to 350°C. Further experiments will be performed for the long<br />
term stability of adhesion at temperatures 350°C or higher.<br />
The work was supported by The National Centre for Research<br />
and Development, NCBiR, Poland (Grant no N N515 499240).<br />
References<br />
[1] Rudzki J., R. Eisek: Low Temperature Joining Technique for Better<br />
Reliability of Power Electronic Modules. Mictrotherm 2007,<br />
pp. 159–166.<br />
[2] Dun-ji Yu, Xu Chen et..al: Applying Anand model to low temperature<br />
sintered nanoscale silver paste chip attachment. Materials and Design.<br />
3D (2009), pp. 45’74–45’79.<br />
[3] John Guofeng Bai, Jian Yin et…al: High Temperature Operation<br />
of SiC Power Devices by Low Temperature Sintered Silver Die-Attachment.<br />
IEEE Transactions on Advanced Packaging. Vol. 30. No 3.<br />
August 2007, pp. 506–509.<br />
[4] John G. Boi Jesus N. Calato, Gou Quan: Processing and Characterization<br />
of Nanosilver Pastes for Die Attaching SiC Devices. IEEE<br />
Trabsactions on Electronic Packaging Nanofacturing. Vol. 30, No. 4,<br />
October 2009, pp. 241–245.<br />
[5] Tsuashi Fundki, Juan Carlos Bonda et…al: Power Conversion with SiC<br />
Devices at Extremely High Ambient Temperatures. IEEE Transactions<br />
on Power Electronics. Vol. 22, No. 4, July 2007, pp. 1321–1329.<br />
[6] Pugi Ning, Thomas Guangyin Lei et…al: A Novel High Temperatures<br />
Planar Package for SiC Multichip Phase-Leg Power Module.<br />
IEEE Transactions on Power Electronics. Vol. 25, No. 8, August<br />
2<strong>01</strong>0, pp. 2059–2067.<br />
[7] Fenggum Lang, Yusuke Hayashi et…al: Novel Three Dimensional<br />
Packaging Method for Al Metalized SiC power Devices. IEEE Transactions<br />
on Advanced Packaging. Vol. 32, No. 4, November 2009,<br />
pp. 773–779.<br />
[8] Fenggum Lang, Yusuke Hayashi et…al: Joint Reliability of Double<br />
Side Package SiC Power Devices to DBC Substrate with High Temperature<br />
Solders. Proceedings of 10 th Electronics Packaging Technology<br />
Conference. 2008, pp. 897–902.<br />
[9] Fenggum Lang, Satashi Tanimato et…al: Long-Term Joint Reliability<br />
of SiC Power Devices at 330ºC. Proceedings of European Microelectronics<br />
and Packaging Technologies. June 2009, pp. 1–5.<br />
[10] Klein M., H. Opperman, R. Kalicki, H. Reichl: “Single Chip Bumping<br />
and Reliability for Chip Process” Microelectronics Reliability. Vol. 39,<br />
No. 9, 1999, pp. 1389–1397.<br />
[11] Szczepański Z., R. Kisiel: „SiC Substrate Connections for High Temperature<br />
Applications” XXXII International Conference of IMAPS-<br />
CPMT IEEE Poland, September 2008.<br />
[12] Szczepański Z., R. Kisiel: Packaging Technologies for SiC Power<br />
Devices. XXXIV International Conference of IMAPS-CPMT IEEE Poland.<br />
September 2<strong>01</strong>0.<br />
[13] Kisiel R., M. Guziewicz, Z. Szczepański: An Overview of Materials<br />
and Bonding Techniques for Inner Connections in SiC High Power<br />
and High Temperature Devices. 33 rd International Spring Seminar on<br />
Electronics Technology ISSE’2<strong>01</strong>0. Warszawa. May 2<strong>01</strong>0.<br />
[14] Rudzki J., Hinken R., Poech H.: Thermal Impedance Test Method for<br />
Detecting Packaging Failures in Silver Sintering Technology. Official<br />
Proceedings MicroTherm 2<strong>01</strong>1, Łódź, Poland, ISBN 978-83-932197-<br />
0–4 pp. 217–222.<br />
50<br />
<strong>Elektronika</strong> 1/<strong>2<strong>01</strong>2</strong>
Analysis of pulse durability of thin-film and polymer<br />
thick-film resistors embedded in printed circuit boards<br />
(Analiza odporności impulsowej grubo- i cienkowarstwowych rezystorów<br />
wbudowanych w płytki obwodów drukowanych)<br />
inż. Adam Kłossowicz 1) , prof. dr hab. inż. Andrzej Dziedzic 1) , inż. Paweł Winiarski 1) ,<br />
mgr inż. Wojciech Stęplewski 2) , dr Grażyna Kozioł 2)<br />
1)<br />
Faculty of Microsystem Electronics and Photonics, Wroclaw University of Technology<br />
2)<br />
Tele and Radio Research Institute, Warsaw<br />
Traditional passives are three-dimensional discrete components,<br />
soldered through or onto surface. They occupy significant part of<br />
top/bottom surface (up to 50% of the surface area) and increase<br />
thickness and weight of electronic circuits/systems. The embedded<br />
passives (resistors, capacitors and/or inductors – Fig. 1) are<br />
more and more used in multichip module (MCM) technologies.<br />
They are fabricated among others in Low Temperature Co-fired<br />
Ceramics (LTCC) substrates or PCBs. The embedded passives in<br />
comparison to traditional ones are essentially two-dimensional elements<br />
that become part of the internal layers of a PCB or LTCC<br />
substrate increasing its thickness only of around several µm.<br />
Shifting of passives into substrate can increase a free space of<br />
PCB for active components and improve packaging density. The<br />
embedded passive technology (EPT) is incited by many factors<br />
such as the need for higher packaging density, lower production<br />
costs and better electrical properties.<br />
EPT permits for distance reduction between components<br />
(which leads to reduction of parasitics, less crosstalk and enhance<br />
transmission quality) and improving of electrical performance<br />
especially in higher frequencies (because of lower loss and lower<br />
noise yield). One should note, that EPT can also simplify the assembly<br />
process and reduce assembly cost (for example embedded<br />
passives has not problem with positioning). By using embedded<br />
passives we can lower material cost by reducing the number<br />
of discrete passives, flux, and solder paste. Nowadays technology<br />
allows to embedding both thick-film and thin-film resistors.<br />
Pulse durability is an important parameter of passive components<br />
and active devices. In general, the susceptibility to high<br />
voltage pulses and electrostatic discharges has been investigated<br />
for thin- and thick-film resistors for more than 30 years [1, 2].<br />
Such investigations can be performed with the aid of single or<br />
series of „long” pulses (rectangular shape surges with 1 to 20 ms<br />
duration) [3, 4] or by the series of „short” voltage pulses (with duration<br />
from several hundred nanoseconds up to several hundred<br />
microseconds, eg. [5]). One should note that a pulse voltage trimming<br />
method has been developed to realize a noncut trimming of<br />
cermet and LTCC thick-film resistors without any damage to the<br />
resistor surface [6–11], especially for very small devices. Moreover,<br />
because low-ohm thick film resistors are widely used to protect<br />
telecommunication network equipment against lighting surge<br />
voltages therefore these investigations are applied for overstress<br />
characterization of low sheet resistance thick-film systems under<br />
standard telecommunication waveforms [12]. Such behaviour is<br />
also important in case of electric fuses [13], electrical interconnections<br />
(through-metalized vias) manufactured in thick-film technology<br />
[14] or thick-film initiators for automotive applications [15].<br />
This paper characterizes experimentally, compares and analyzes<br />
pulse durability (determined by calculating the maximum nondestructive<br />
electric field, maximum nondestructive surface power<br />
density or maximum non destructive volume power density) of<br />
thin-film and polymer thick-film resistors made on the surface or<br />
embedded in Printed Circuit Boards (PCBs) [16, 17]. Investigated<br />
test structures were made of nickel–phosphorus (Ni-P) alloy<br />
Fig. 1. Preview of typical multichip module with embedded passives<br />
Rys. 1. Przykładowy wygląd płytki wielowarstwowej z zagrzebanymi<br />
elementami biernymi<br />
or polymer thick-film resistive inks on FR-4 laminate with similar<br />
sheet resistance (25 Ω/sq or 100 Ω/sq for Ni-P alloys and 20 Ω/sq<br />
or 200 Ω/sq for polymer thick-film inks).<br />
Investigated structures<br />
Thin-film (TF) resistors<br />
Test structures were fabricated in processes based on Ohmega-Ply<br />
technologies [16]. Structure (Fig. 2) is made of resistive<br />
foil with sheet resistance 25 Ω/sq (0.4 µm thick) and 100 Ω/sq<br />
(0.1 µm thick) embedded between two layers. Upper layer is copper<br />
foil (from 17.5 to 35 µm thick). Those thin layers are on dielectric<br />
subtract made of standard laminate FR-4. The fabrication<br />
process involves: electroplating nickel-phosphorus on copper foil,<br />
lamination formed foil on FR-4 and subtractive methods for defining<br />
shape and dimension of resistor. In experiment rectangular<br />
resistor was used, theirs width and length was determined in two<br />
Fig. 2. Simulation of embedded resistor<br />
Rys. 2. Symulacja rezystora zagrzebanego<br />
<strong>Elektronika</strong> 1/<strong>2<strong>01</strong>2</strong> 51
etching processes. The dimension were from 0.25 to 1.5 mm width<br />
and aspect ratio (n = length/width) between 1 and 4. Part of<br />
tested structures was coated with Resin Coated Copper (RCC)<br />
or Laser Drillable Prepreg (LDP) 2 × 10⁶ to gain protection from<br />
environmental conditions and simulate multilayer PCBs.<br />
Polymer Thick – film (PTF) resistors<br />
Resistors (Fig. 2) were manufactured in standard additive thickfilm<br />
polymer technique. The resistive inks were applied onto conductive<br />
contacts. Inks have sheet resistance: 20 Ω/sq (ED7500_<br />
20 Ω – carbon-silver) and 200 Ω/sq (ED7100_200 Ω – carbon).<br />
All fabricated resistors have thickness around 11 µm, rectangular<br />
shape, width from 0.5 to 1.5 mm and aspect ratio 1 to 4. All of<br />
them were covered with RCC cladding. The resistors were printed<br />
on Cu contacts, in some cases with protective Ni/Au coating and<br />
Ag contacts Electrodag PF-050 ink [17].<br />
Pulse durability<br />
Measurement system<br />
The research was conducted by using self-made pulse generator<br />
GIHV-1 (rectangular pulses with duration t imp<br />
from 10 µs to 10 s,<br />
time between pulses T from 10 ms to 10 s and pulse amplitude<br />
from 5 to 1500 V), laboratory multimeter and a personal computer<br />
(Fig. 3). The measurements of resistor resistance were made with<br />
the aid of Agilent 344<strong>01</strong>A laboratory multimeter.<br />
Fig. 3. Measurement system. Rys. 3. System pomiarowy<br />
Measurement procedure<br />
There is no one general method to measure pulse durability, so<br />
it is hard to define parameters and criterion of experimental procedure.<br />
Nevertheless we determined failure criterion for resistor<br />
as changing of resistance after stress more than ±10% of initial<br />
value or visible structural damage. To determine pulse durability<br />
the following parameters were calculated:<br />
E max<br />
– maximum nondestructive electric field:<br />
(1)<br />
P max<br />
– maximum nondestructive power:<br />
(2)<br />
P S<br />
– maximum nondestructive surface power density:<br />
(3)<br />
P V<br />
– maximum nondestructive volume power density:<br />
(4)<br />
52<br />
where: V – largest non-destructive pulse amplitude, R after<br />
– resistance<br />
of resistor after pulse stress; l – length of resistor; w – width<br />
of resistor; t – thickness of resistor.<br />
The experiment was divided into two parts. In the first part<br />
component was stressed by two identical pulses, and its resistance<br />
was measured after short time. If resistance change was smaller<br />
than ±10% the amplitude was increased by 2% and procedure<br />
was repeated. This process was conducted until the failure criterion<br />
was achieved.<br />
Parameters of the pulse for constant time of pulse were following:<br />
t imp<br />
= 1 ms, T = 1 s, number of pulses N = 2, V – dependent<br />
of resistor type.<br />
Parameters of experiment pulses with various duration were<br />
following: t imp<br />
= 10 µs, 100 µs, 1 ms, 10 ms, 100 ms, 1 s, 10 s;<br />
T = 1 s for t imp<br />
< 1 s and 10 s for t imp<br />
= 10 s; N = 2, V – dependent<br />
of resistor type.<br />
Results<br />
Pulse durability for constant pulse duration<br />
After all experiments the parameters were calculated and part of<br />
them is presented. Pulse durability is depended on the dimension<br />
of resistor, type of cladding, sheet resistance and contact<br />
material.<br />
Pulse durability of TF resistors<br />
The maximum non-destructive pulse amplitude decreases for TF<br />
resistors with reduced length and width of components. However<br />
other parameters increase their values when dimensions of resistors<br />
decrease. Cladding affects pulse durability. Coated structures<br />
have better durability than uncovered ones (Fig. 4). In most<br />
cases the LPD 2×10⁶ cladding gives the best pulse durability.<br />
Resistors fabricated from 100 Ω/sq foil have larger values of V<br />
and E max<br />
, but smaller values of P max<br />
, P S<br />
and P V<br />
than those made<br />
of 25 Ω/sq foil (Figs. 5 and 6). This is connected with thickness<br />
of resistive foil.<br />
Pulse durability of PTF resistors<br />
PTF resistors exhibit weaker dependence of pulse durability on<br />
resistor dimension. Structures made of 200 Ω/sq inks have nearly<br />
twice higher values of parameters than 20 Ω/sq ones (Figs. 7–9).<br />
Moreover resistors printed on Ag and Au contacts have better pulse<br />
durability in comparison with Cu contacts.<br />
Tabl. 1. Comparison of pulse durability of TF and PTF resistor for t imp<br />
= 1 ms<br />
Tab. 1. Porównanie odporności impulsowej rezystorów cienko- i grubowarstwowych<br />
dla t imp<br />
= 1 ms<br />
width: aspect ratio: 1 4<br />
0.5 mm<br />
1.5 mm<br />
0.5 mm<br />
1.5 mm<br />
TF resistors (100 Ω/sq)<br />
cladding: no 2×10⁶ RCC no 2×10⁶ RCC<br />
E max<br />
[V/mm] 35.0 55.0 55.0 30.5 49.8 46.3<br />
P V<br />
[W/mm 3 ] 9.2E+5 1.4E+6 1.6E+6 1.7E+5 2.5E+5 2.6E+5<br />
E max<br />
[V/mm] 27.3 52.7 52.7 26.5 45.4 47.5<br />
P V<br />
[W/mm 3 ] 7.4E+4 2.2E+5 2.4E+5 6.8E+4 1.8E+5 2.1E+5<br />
PTF resistors (200 Ω/sq)<br />
contact: Cu Ag Au Cu Ag Au<br />
E max<br />
[V/mm] 47.0 74.0 76.0 72.0 72.8 75.0<br />
P V<br />
[W/mm 3 ] 6.4E+2 1.4E+3 2.4E+3 1.3E+3 1.4E+3 1.6E+3<br />
E max<br />
[V/mm] 48.0 78.0 71.3 64.2 74.5 72.9<br />
P V<br />
[W/mm 3 ] 7.4E+2 1.5E+3 1.6E+3 1.6E+3 1.5E+3 1.6E+3<br />
In general TF resistors have smaller values of all parameters<br />
than PTF ones, except of P V<br />
which is approximately 2 orders<br />
higher (Figs. 6 and 9, Tabl. 1).<br />
<strong>Elektronika</strong> 1/<strong>2<strong>01</strong>2</strong>
E max<br />
[V/mm]<br />
80<br />
70<br />
60<br />
50<br />
40<br />
30<br />
20<br />
10<br />
0<br />
none 2x10⁶ RCC none 2x10⁶ RCC none 2x10⁶ RCC<br />
1 sq<br />
2 sq<br />
4 sq<br />
0.25 mm<br />
0.5 mm<br />
1 mm<br />
1.5 mm<br />
E max<br />
[V/mm]<br />
45<br />
40<br />
35<br />
30<br />
25<br />
20<br />
15<br />
10<br />
5<br />
0<br />
Cu Ag Au Cu Ag Au Cu Ag Au<br />
1 sq<br />
2 sq<br />
4 sq<br />
0.5 mm<br />
0.75 mm<br />
1 mm<br />
1.5 mm<br />
Fig. 4. Maximum nondestructive electric field, TF resistors (25 Ω/sq),<br />
t imp<br />
= 1 ms<br />
Rys. 4. Maksymalne nieniszczące pole elektryczne rezystory cienkowarstwowe<br />
(25 Ω/kw), t imp<br />
= 1 ms<br />
Fig. 7. Maximum nondestructive electric field, PTF resistors (20 Ω/sq),<br />
t imp<br />
= 1 ms<br />
Rys. 7. Maksymalne nieniszczące pole elektryczne rezystory grubowarstwowe<br />
(20 Ω/kw), t imp<br />
= 1 ms<br />
2,0x10 6 4 sq<br />
P V<br />
[W/mm 3 ]<br />
1,8x10 6<br />
1,6x10 6<br />
1,4x10 6<br />
1,2x10 6<br />
1,0x10 6<br />
8,0x10 5<br />
6,0x10 5<br />
4,0x10 5<br />
2,0x10 5<br />
0,0<br />
0.25 mm<br />
0.5 mm<br />
1 mm<br />
1.5 mm<br />
none 2x10⁶ RCC none 2x10⁶ RCC none 2x10⁶ RCC<br />
1 sq<br />
2 sq<br />
P V<br />
[W/mm 3 ]<br />
1,5x10 3<br />
1,0x10 3<br />
5,0x10 2<br />
0,0<br />
0.5 mm<br />
0.75 mm<br />
1 mm<br />
1.5 mm<br />
Cu Ag Au Cu Ag Au Cu Ag Au<br />
1 sq<br />
2 sq<br />
2,0x10 3 4 sq<br />
Fig. 5. Maximum nondestructive volume power density TF resistors<br />
(25 Ω/sq), t imp<br />
= 1 ms<br />
Rys. 5. Maksymalna nieniszcząca objętościowa gęstość mocy rezystory<br />
cienkowarstwowe (25 Ω/kw), t imp<br />
= 1 ms<br />
Fig. 8. Maximum nondestructive volume power density PTF resistors<br />
(20 Ω/sq), t imp<br />
= 1 ms<br />
Rys. 8. Maksymalna nieniszcząca objętościowa gęstość mocy rezystory<br />
grubowarstwowe (20 Ω/kw), t imp<br />
= 1 ms<br />
3,5x10 5 4 sq<br />
3,0x10 5<br />
2,5x10 5<br />
0.25 mm<br />
0.5 mm<br />
1 mm<br />
1.5 mm<br />
2,0x10 3<br />
0.5 mm<br />
0.75 mm<br />
1 mm<br />
1.5 mm<br />
2,5x10 3 4 sq<br />
P V<br />
[W/mm 3 ]<br />
2,0x10 5<br />
1,5x10 5<br />
1,0x10 5<br />
5,0x10 4<br />
P V<br />
[W/mm 3 ]<br />
1,5x10 3<br />
1,0x10 3<br />
5,0x10 2<br />
0,0<br />
none 2x10⁶ RCC none 2x10⁶ RCC none 2x10⁶ RCC<br />
1 sq<br />
2 sq<br />
0,0<br />
Cu Ag Au Cu Ag Au Cu Ag Au<br />
1 sq<br />
2 sq<br />
Fig. 6. Maximum nondestructive volume power density TF resistors<br />
(100 Ω/sq), t imp<br />
= 1 ms<br />
Rys. 6. Maksymalna nieniszcząca objętościowa gęstość mocy rezystory<br />
cienkowarstwowe (100 Ω/kw), t imp<br />
= 1 ms<br />
Fig. 9. Maximum nondestructive volume power density PTF resistors<br />
(200 Ω/sq), t imp<br />
= 1 ms<br />
Rys. 9. Maksymalna nieniszcząca objętościowa gęstość mocy rezystory<br />
grubowarstwowe (200 Ω/kw), t imp<br />
= 1 ms<br />
<strong>Elektronika</strong> 1/<strong>2<strong>01</strong>2</strong> 53
Pulse durability for various pulse duration<br />
Pulse durability is decreasing very quickly with increase of pulse<br />
duration (Tabl. 2 and 3). There is power relationship between pulse<br />
duration and E max<br />
, P S<br />
and P V<br />
.<br />
Tabl. 2. Maximum nondestructive electric field E max<br />
[V/mm] versus pulse<br />
duration, TF and PTF resistors<br />
Tab. 2. Maksymalne nieniszczące pole elektryczne E max<br />
[V/mm] w funkcji<br />
czasu trwania impulsu, rezystory cienko- i grubowarstwowe<br />
E max<br />
t imp<br />
[ms]<br />
TF, 2×1 mm<br />
cladding<br />
PTF 2×1 mm<br />
contact<br />
none 2×10⁶ RCC Cu Au Ag<br />
E max<br />
[V/mm]<br />
10 3<br />
10 2<br />
10 1<br />
PTF - Cu<br />
PTF- Ag<br />
PTF - Au<br />
TF - none<br />
TF- 2x10⁶<br />
TF - RCC<br />
0.<strong>01</strong> 5.6 10.8 11.8 47.0 44.6 42.3<br />
0.1 4.0 7.9 7.5 17.3 17.1 15.9<br />
1 3.1 5.1 5.0 7.1 7.0 6.9<br />
10 1.8 2.7 2.5 3.8 3.6 3.4<br />
100 1.0 1.5 1.3 2.4 2.2 2.1<br />
1000 0.6 0.8 0.7 1.2 1.2 1.0<br />
10 0<br />
10 -3 10 -2 10 -1 10 0 10 1 10 2 10 3 10 4<br />
t imp<br />
[ms]<br />
Fig. 10. Maximum non destructive electric field for PTF (200 Ω/sq)<br />
and TF (100 Ω/sq) 2×1 mm resistors, versus pulse duration<br />
Rys. 10. Maksymalne nieniszczące pole elektryczne w funkcji czasu<br />
trwania impulsu dla rezystorów grubowarstwowych (200 Ω/kw)<br />
i cienkowarstwowych (100 Ω/kw) o wymiarach 2×1 mm<br />
10000 0.5 0.6 0.6 0.9 1.1 0.8<br />
Tabl. 3. Maximum nondestructive volume power density P V<br />
[W/mm 3 ] versus<br />
pulse duration, TF and PTF resistors<br />
Tab. 3. Maksymalna nieniszcząca objętościowa gęstość mocy P V<br />
[W/mm 3 ]<br />
w funkcji czasu trwania impulsu, rezystory cienko- i grubowarstwowe<br />
P V<br />
t imp<br />
[ms]<br />
TF, 2×1 mm<br />
cladding<br />
PTF, 2×1 mm<br />
contact<br />
none 2×10⁶ RCC Cu Ag Au<br />
0.<strong>01</strong> 2.9E+5 1.1E+6 1.4E+6 5.9E+4 4.6E+4 5.4E+4<br />
P V [W/mm 3 ]<br />
10 6<br />
10 5<br />
10 4<br />
10 3<br />
10 2<br />
PTF - Cu<br />
PTF- Ag<br />
PTF - Au<br />
TF - none<br />
TF- 2x10⁶<br />
TF - RCC<br />
approximation of TF<br />
approximation of PTF<br />
54<br />
0.1 1.6E+5 5.8E+5 5.6E+5 7.7E+3 6.9E+3 7.8E+3<br />
1 9.1E+4 2.1E+5 2.1E+5 1.5E+3 1.4E+3 1.5E+3<br />
10 2.9E+4 6,1E+4 5.9E+4 3.9E+2 3.9E+2 3.5E+2<br />
100 1.1E+4 1.9E+4 1.7E+4 1.4E+2 1.3E+2 1.2E+2<br />
1000 3.9E+3 5.0E+3 4.9E+3 4.0E+1 4.1E+1 3.1E+1<br />
10000 2.3E+3 3.0E+3 2.8E+3 2.1E+1 3.0E+1 1.9E+1<br />
Shapes of E max<br />
= f (t imp<br />
) and P V<br />
= f (t imp<br />
) characteristics are similar<br />
for all tested structures. Both kind of resistors exhibit powerlike<br />
characteristics for shorter pulses and almost constant values<br />
for longer ones (Figs. 10 and 11).<br />
The characteristics P V<br />
= f (t imp<br />
) in the range of pulse duration<br />
from 10 µs to 10 ms were fitted by the following equation:<br />
(5)<br />
Fitted values of b parameter are given in Table 4.<br />
Tabl. 4. Fitted values of b parameter<br />
Tab. 4. Oszacowane wartości współczynnika b<br />
Type of resistor Value Type of resistor Value<br />
TF – uncovered 0.327 PTF – Cu 0.725<br />
TF – LDP 2×10⁶ 0.423 PTF – Ag 0.692<br />
TF – RCC 0.456 PTF – Au 0.729<br />
Therefore the b parameter for TF resistors is very close to 0.4<br />
and for PTF ones very close to 0.7.<br />
10 1<br />
10 -3 10 -2 10 -1 10 0 10 1 10 2 10 3 10 4 10 5<br />
t imp<br />
[ms]<br />
Fig. 11. Approximation of maximum nondestructive volume power<br />
density for PTF (200 Ω/sq) and TF (100 Ω/sq) 2×1 mm resistors, versus<br />
pulse duration<br />
Rys. 11. Przybliżenie maksymalnej nieniszczącej objętościowej gęstości<br />
mocy w funkcji czasu trwania impulsu dla rezystorów grubowarstwowych<br />
(200 Ω/kw) i cienkowarstwowych (100 Ω/kw) o wymiarach<br />
2×1 mm<br />
Conclusions<br />
The research for pulse durability for resistors embedded in printed<br />
circuit boards was conducted. Thin-film and polymer thickfilm<br />
resistors were tested. Based on our research the influence<br />
of fabrication process and used materials on pulse stability was<br />
discovered. The structures coated with LDP 2×10⁶ cladding and<br />
PTF resistors made on Ag contacts have the best pulse durability.<br />
Additionally smaller TF resistors have better pulse durability than<br />
larger ones. In PTF this dependence was not observed. Moreover<br />
PTF resistors have higher values of measured parameters<br />
than TF components. Relying on results of research with variable<br />
duration of pulse, values of parameters and time of pulse, power<br />
relationship was ascertained. By analyzing and approximating<br />
those characteristics relative value of parameter was obtained,<br />
it is relatively equal to 0.4 and 0.7 for TF and PTF resistors. The<br />
results can be used to determine safety parameters of work conditions<br />
for devices with this type of components.<br />
Acknowledgement<br />
Investigations were made as a part of the Operational Programme<br />
Innovative Economy (2007–2<strong>01</strong>3), the Priority1, Action 1.3,<br />
Subaction 1.3.1, Developmental Programme „Technologia do-<br />
<strong>Elektronika</strong> 1/<strong>2<strong>01</strong>2</strong>
świadczalna wbudowywania elementów rezystywnych i pojemnościowych<br />
wewnątrz płytki drukowanej”, The agrement No:<br />
UDA-POIG.<strong>01</strong>.03.<strong>01</strong>-14-031/08-00 of 16.02.2009 r. Project No:<br />
POIG.<strong>01</strong>.03.<strong>01</strong>-14-031/08 and statutory activity of Wroclaw University<br />
of Technology.<br />
References<br />
[1] C.H. Seager, G.E. Pike; Electrical field induced changes in thick<br />
film resistors, Proc. Int. Microelectronics Symp. (ISHM-USA) 1976,<br />
p. 115–122.<br />
[2] J.-P. Constantin et al.; Effect of surge voltages on thin and thick film<br />
resistors, Proc. 2 nd Int. Microelectronics Conf. (ISHM-Japan), 1982,<br />
p. 51–55.<br />
[3] J.M. Kozłowski, M. Tańcula; The influence of electrical pulses on thick<br />
film (Du Pont 1421 Birox) resistors, Electrocomponent Science and<br />
Technology, vol. 9 (1982), p. 185–189.<br />
[4] R.F. Szeloch et al.; Computer controlled step-stress method for thick<br />
film resistive layers testing, Proc. RELECTRONIC`88 (7 th Symp. on<br />
Reliability in Electronics), Budapest 1988, p. 606–610.<br />
[5] D. Bonfert et al.; Electrical stress on film resistive structures on different<br />
substrates, Proc. 34 th ISSE Conf., Tatranska Lomnica (Slovakia),<br />
May 2<strong>01</strong>1.<br />
[6] T. Tobita, H. Takasago; New trimming technique for a thick film resistor<br />
by the pulse voltage method, IEEE Trans. on Comp., Hybr., and<br />
Manuf. Technol, vol. CHMT-14 (1991), p. 613–617.<br />
[7] J. Muller et al.; Trimming of buried resistors in LTCC-circuits, Proc.<br />
33 rd ISHM Nordic Conf., Helsingor (Denmark) 1996, p. 166–173.<br />
[8] J. Kita et al.; Pulse durability of polymer, cermet and LTCC thick-film<br />
resistors, Proc. 12 th Eur. Microelectronics and Packaging Conf., Harrogate,<br />
1999, p. 313–319.<br />
[9] A. Dziedzic et al.; Some remarks about “short” pulse behaviour of<br />
LTCC microsystems, Proc. 1 st Eur. Microelectronics Packaging and<br />
Interconnection Symp., Prague, 2000, p. 194–199.<br />
[10] W. Ehrhardt, H. Thust; Trimming of thick-film resistors by energy of<br />
high voltage pulses and its influence on microstructure, Proc. 13 th Eur.<br />
Microelectronics and Packaging Conf., Strasbourg, 20<strong>01</strong>,p. 403–407.<br />
[11] A. Dziedzic et al.; Advanced electrical and stability characterization<br />
of untrimmed and variously trimmed thick-film and LTCC resistors,<br />
Microelectronics Reliab., vol. 46 (2006), p. 352–359.<br />
[12] S. Vasudevan; Effect of design parameters on overstress characterization<br />
of thick film resistors for lighting surge protection, Proc. 1997<br />
Int. Symp. on Microelectronics (IMAPS-US), 1997, p. 634–640.<br />
[13] A.R. Batchelor, J.R. Smith; Time-current characteristic of miniature<br />
zinc-element electric fuses for automotive applications, IEE Proc.<br />
– Sci. Meas. Technol., vol. 146 (1999), p. 210–216.<br />
[14] D. Ortolino et al.; Investigation of the short-time high-current behaviour<br />
of vias manufactured in hybrid thick-film technology, Microelectronics<br />
Reliab., vol. 51 (2<strong>01</strong>1), p. 1257–1263.<br />
[15] W. Smetana, R. Reicher, H. Homolka; Improving reliability of thick<br />
film initiators for automotive applications based on FE-analyses, Microelectronics<br />
Reliab., vol.45 (2005), p. 1194–12<strong>01</strong>.<br />
[16] A. Dziedzic et al.; Wybrane właściwości elektryczne i stabilność elementów<br />
biernych wbudowanych w płytki obwodów drukowanych,<br />
Przegląd Elektrotechniczny, 87 (2<strong>01</strong>1), no. 10, p. 39–44.<br />
[17] W. Stęplewski et al.; Investigations of passive components embedded<br />
in printed circuit boards, Proc. 35 th IMAPS/CPMT Poland Int.<br />
Conference, Gdańsk-Sobieszewo, Sept. 2<strong>01</strong>1.<br />
Analysis of long-term stability of thin-film and polymer<br />
thick-film resistors embedded in Printed Circuit Boards<br />
(Analiza stabilności długoczasowej rezystorów cienkowarstwowych<br />
oraz polimerowych rezystorów grubowarstwowych wbudowanych<br />
w płytki obwodów drukowanych)<br />
inż. Paweł Winiarski 1) , prof. dr hab. inż. Andrzej Dziedzic 1) , inż. Adam Kłossowicz 1) ,<br />
mgr inż. Wojciech Stęplewski 2) , dr Grażyna Kozioł 2)<br />
1)<br />
Politechnika Wrocławska, Wydział Elektroniki Mikrosystemów i Fotoniki<br />
2)<br />
<strong>Instytut</strong> Tele- i Radiotechniczny, Centrum Zaawansowanych Technologii,Warszawa<br />
Embedded passives play a major role in miniaturisation of electronic<br />
circuits, where e.g. MCM or HDI technologies [1] can be<br />
used. In most cases resistors represent the majority of passive<br />
components used on a circuit board. Besides size aspects, there<br />
are other very important issues like tolerance, reliability and<br />
long-term stability of components, especially in specialized applications.<br />
Technology and production processes are extensively<br />
studied and improved. However, to determine real reliability of<br />
fabricated components proper measuring methods are needed.<br />
To analyze stability of the resistors an accelerated ageing process<br />
can be used. Treating resistors with elevated temperature<br />
(or/and humidity) allows (in quite short time) obtain long-term behaviour<br />
of tested samples referred to a few years of service [2].<br />
Test structures<br />
The thin-film resistors were fabricated on FR-4 laminate in accordance<br />
with Ohmega-Ply® techno-logy [3, 4]. In this technique firstly<br />
thin layer of Nickel-Phosphorous alloy is electroplated on copper<br />
foil, afterwards this composite foil called RCM (resistor-conductor<br />
material) is laminated to FR-4 substrate. Finally copper circuitry and<br />
planar resistors are realized by subtractive processes. Two types<br />
of resistive foil were used for fabrication of structures with sheet<br />
resistance 25 Ω/sq and 100 Ω/sq (with thickness 0.4 μm and 0.1 μm<br />
respectively). The rectangular resistors, with width from 0.25 mm to<br />
1.5 mm and aspect ratio n=l/w between 1 and 4, were designed and<br />
fabricated. Moreover, to investigate embedded resistors, part of the<br />
samples was covered with two types of cladding – Resin Coated<br />
Copper (RCC) or Laser Drillable Prepreg (LDP) 2 × 10⁶. The cladding<br />
gives additional protection from environ-mental conditions.<br />
The PTF resistors were made using a standard thick-film<br />
method [5]. To fabricate resistors three types of resistive inks were<br />
used, with sheet resistance 20 Ω/sq, 200 Ω/sq and 5 kΩ/sq (with<br />
thickness about 11 μm). Alike to Ni-P ones a rectangular resistors<br />
were fabricated, with similar width from 0.5 mm to 1.5 mm and<br />
same aspect ratio n between 1 and 4. However, in this case all<br />
samples were covered only with RCC cladding, but in turn two types<br />
of contact interlayer (between resistor and copper lead) were<br />
investigated – copper (Cu) contacts and gold (Au) ones.<br />
Measurement procedure<br />
The In-Situ method [6] was used to determine stability of resistors,<br />
where measurements were done during ageing process. In this<br />
case test samples were placed on a hot plate treated with constant<br />
temperature – 100, 130 or 160°C for Ni-P resistors, 100 and 130°C<br />
for polymer ones. A Pt100 sensor was used to monitor and control<br />
temperature on the plate. Structures were equipped with needle<br />
probes, which were connected to Agilent 34970A multimeter. The<br />
selector collected data every 10 minutes (during 30…170 h) and<br />
sent them to personal computer for data acquisition and presentation.<br />
An idea of measurement system is shown in Fig. 1.<br />
<strong>Elektronika</strong> 1/<strong>2<strong>01</strong>2</strong> 55
Selector<br />
Agilent<br />
HP 34970A<br />
10 1<br />
10 0<br />
1sq - 100°C<br />
1sq - 130°C<br />
1sq - 160°C<br />
4sq - 100°C<br />
4sq - 130°C<br />
4sq - 160°C<br />
Computer<br />
T=100, 130, 160°C<br />
(heater)<br />
Substrate Resistor Pt100<br />
R/R 0<br />
[%]<br />
10 -1<br />
Fig. 1. Schema of measurement system<br />
Rys. 1. Schemat systemu pomiarowego<br />
Results<br />
Measurement results are collected and analyzed, and chosen<br />
ones are presented below. The stability of resistors was determined<br />
based on relative resistance changes during ageing tests. A<br />
normalized percentage resistance changes were calculated by:<br />
(1)<br />
Figures present mean values for clarity.<br />
Ni-P resistors<br />
Resistance drifts of tested thin-film resistors in the time domain<br />
are shown in Figs. 2–4.<br />
R/R 0<br />
[%]<br />
10 1<br />
10 0<br />
10 -1<br />
10 -2<br />
1sq - 100°C<br />
1sq - 130°C<br />
1sq - 160°C<br />
4sq - 100°C<br />
4sq - 130°C<br />
4sq - 160°C<br />
10 -1 10 0 10 1 10 2<br />
t [h]<br />
Fig. 2. Relative resistance changes for uncladded Ni-P 25 Ω/sq resistors<br />
Rys. 2. Względne zmiany rezystancji dla rezystorów Ni-P 25 Ω/kw bez<br />
pokrycia<br />
10 1<br />
1sq - 100°C<br />
1sq - 130°C<br />
1sq - 160°C<br />
4sq - 100°C<br />
10 0 4sq - 130°C<br />
4sq - 160°C<br />
R/R 0<br />
[%]<br />
10 -1<br />
10 -2<br />
10 -1 10 0 10 1 10 2<br />
t [h]<br />
Fig. 4. Relative resistance changes for Ni-P 25 Ω/sq – with RCC cladding<br />
Rys. 4. Względne zmiany rezystancji dla rezystorów Ni-P 25 Ω/kw pokrytych<br />
warstwą RCC<br />
The results revealed a square-root-of-time dependence of resistance<br />
changes. A single ageing mechanism occurs here, which<br />
can be described by following equation [7]:<br />
(2)<br />
where A is the pre-exponential constant characteristic for particular<br />
ageing mechanism, t – time, n is the time dependence (and is<br />
about 0.5), E is the activation energy, k is the Boltzmann constant<br />
and T is the temperature.<br />
In temperature domain results can be presented by Arrhenius<br />
law. Figs. 5–7 present resistance changes after 30 h of ageing<br />
process.<br />
R/R 0<br />
[%]<br />
10 1 1sq<br />
4sq<br />
10 0<br />
10 -1<br />
10 -2<br />
2,0 2,2 2,4 2,6 2,8 3,0 3,2 3,4<br />
1/T·10 3 [1/K]<br />
Fig. 5. Arrhenius plot – Ni-P uncladded resistors<br />
Rys. 5. Wykres Arrheniusa dla resystorów Ni-P bez pokrycia<br />
R/R 0<br />
[%]<br />
10 1 1sq<br />
4sq<br />
10 0<br />
10 -1<br />
Fig. 3. Relative resistance changes for Ni-P 25 Ω/sq – with LDP 2 × 10⁶<br />
cladding<br />
Rys. 3. Względne zmiany rezystancji dla rezystorów Ni-P 25 Ω/kw pokrytych<br />
warstwą LDP 2 × 10⁶<br />
56<br />
10 -2<br />
10 -1 10 0 10 1 10 2<br />
t [h]<br />
10 -2<br />
2,0 2,2 2,4 2,6 2,8 3,0 3,2 3,4<br />
1/T·10 3 [1/K]<br />
Fig. 6. Arrhenius plot – Ni-P resistors with LDP 2 × 10⁶ cladding<br />
Rys. 6. Wykres Arrheniusa dla resystorów Ni-P pokrytych warstwą<br />
LDP 2 × 10⁶<br />
<strong>Elektronika</strong> 1/<strong>2<strong>01</strong>2</strong>
R/R 0<br />
[%]<br />
10 1 1sq<br />
4sq<br />
10 0<br />
10 -1<br />
10 -2<br />
2,0 2,2 2,4 2,6 2,8 3,0 3,2 3,4<br />
1/T·10 3 [1/K]<br />
Fig. 7. Arrhenius plot – Ni-P resistors with RCC cladding<br />
Rys. 7. Wykres Arrheniusa dla resystorów Ni-P pokrytych warstwą<br />
RCC<br />
Activation energy of ageing process can be calculated using<br />
the approximation of results presented on Arrhenius plots<br />
R/R 0<br />
[%]<br />
10<br />
8<br />
6<br />
1sq - 100°C<br />
1sq - 130°C<br />
4sq - 100°C<br />
4sq - 130°C<br />
4<br />
2<br />
0<br />
-2<br />
-4<br />
-6<br />
-8<br />
-10<br />
0 20 40 60 80 100 120 140<br />
t [h]<br />
Fig. 9. Relative resistance changes for polymer resistors – 20 Ω/sq<br />
– Cu contacts<br />
Rys. 9. Względne zmiany rezystancji dla rezystorów polimerowych<br />
20 Ω/kw z kontaktami Cu<br />
(3)<br />
where activation energy is a slope of linear function, which fits<br />
results. Computed values are shown below in Tabl.<br />
Activation energy of Ni-P 25 Ω/sq resistors.<br />
Energie aktywacji rezystorów Ni-P 25 Ω/sq<br />
cladding without LDP 2x10⁶ RCC<br />
length 1sq 4sq 1sq 4sq 1sq 4sq<br />
E [eV] 0.40 0.42 0.34 0.33 0.27 0.27<br />
R/R 0<br />
[%]<br />
14<br />
12<br />
10<br />
8<br />
6<br />
4<br />
2<br />
1sq - 100°C<br />
1sq - 130°C<br />
4sq - 100°C<br />
4sq - 130°C<br />
The changes of FR-4 laminate and cladding materials were<br />
observed (colour becomes darker). It refers to test samples treated<br />
by temperatures higher than 100°C (eg. structures without<br />
cladding and covered by RCC cladding are shown in Fig. 8).<br />
a)<br />
100°C 130°C 160°C<br />
0<br />
-2<br />
0 20 40 60 80 100 120<br />
t [h]<br />
Fig. 10. Relative resistance changes for polymer resistors – 200 Ω/sq<br />
– Cu contacts.<br />
Rys. 10. Względne zmiany rezystancji dla rezystorów polimerowych<br />
200 Ω/kw z kontaktami Cu<br />
b)<br />
Fig. 8. Photography of aged structures a) without cladding, b) with<br />
RCC cladding<br />
Rys. 8. Fotografia starzonych struktur a) niepokrytych, b) pokrytych<br />
warstwą RCC<br />
PTF resistors<br />
The polymer thick-film resistors revealed a quite different behaviour<br />
than Ni-P ones. Depending on sample parameters and ageing<br />
condition resistance drift goes to negative or positive value.<br />
Therefore only results in time domain can be shown (Figs. 9–14).<br />
These resistors could not handle temperature above 130°C – resistor<br />
material melted and expanded.<br />
R/R 0<br />
[%]<br />
0<br />
-2<br />
-4<br />
-6<br />
-8<br />
-10<br />
-12<br />
-14<br />
-16<br />
-18<br />
-20<br />
1sq - 100°C<br />
1sq - 130°C<br />
4sq - 100°C<br />
4sq - 130°C<br />
0 20 40 60 80 100<br />
t [h]<br />
Fig. 11. Relative resistance changes for polymer resistors -5 kΩ/sq<br />
– Cu contacts<br />
Rys. 11. Względne zmiany rezystancji dla rezystorów polimerowych<br />
5 kΩ/kw z kontaktami Cu<br />
<strong>Elektronika</strong> 1/<strong>2<strong>01</strong>2</strong> 57
R/R 0<br />
[%]<br />
Fig. 12. Relative resistance changes for polymer resistors – 20 Ω/sq<br />
– Au contacts<br />
Rys. 12. Względne zmiany rezystancji dla rezystorów polimerowych<br />
20 Ω/kw z kontaktami Au<br />
R/R 0<br />
[%]<br />
Fig. 13. Relative resistance changes for polymer resistors – 200 Ω/sq<br />
– Au contacts<br />
Rys. 13. Względne zmiany rezystancji dla rezystorów polimerowych<br />
200 Ω/kw z kontaktami Au<br />
R/R 0<br />
[%]<br />
Fig. 14. Relative resistance changes for polymer resistors – 5 kΩ/sq<br />
– Au contacts.<br />
Rys. 14. Względne zmiany rezystancji dla rezystorów polimerowych<br />
5 kΩ/kw z kontaktami Au<br />
58<br />
0,0<br />
-0,5<br />
-1,0<br />
-1,5<br />
-2,0<br />
-2,5<br />
-3,0<br />
-3,5<br />
-4,0<br />
0 10 20 30 40 50 60 70 80<br />
0<br />
-1<br />
-2<br />
-3<br />
-4<br />
-5<br />
0<br />
-1<br />
-2<br />
-3<br />
-4<br />
-5<br />
-6<br />
t [h]<br />
1sq - 100°C<br />
1sq - 130°C<br />
4sq - 100°C<br />
4sq - 130°C<br />
0 20 40 60 80 100 120 140 160 180<br />
t [h]<br />
1sq - 100°C<br />
1sq - 130°C<br />
4sq - 100°C<br />
4sq - 130°C<br />
-7<br />
0 20 40 60 80 100<br />
Conclusion<br />
t [h]<br />
1sq - 100°C<br />
1sq - 130°C<br />
4sq - 100°C<br />
4sq - 130°C<br />
The results showed quite different behaviour for both groups of<br />
resistors. In case of Ni-P thin-film resistors, their geometry almost<br />
not affects long-term stability. However, the type of encapsulation<br />
and ageing temperature significantly affect observed resistance<br />
drift. Measurement results revealed the square-root-of-time de-<br />
pendence of the resistance changes. In the temperature domain<br />
resistance drift, can be described by the Arrhenius equation.<br />
The extrapolations of these results determine activation energies<br />
of ageing mechanism for each tested sample. According to these<br />
results a single ageing mechanism can be defined, which is<br />
characterized by set of parameters n, E and A for each kind of<br />
structures. One should add that similar parameters time to time<br />
were reported for thick-film resistors (for example authors of paper<br />
[8] have found n very close to 0.5 and E = 0.46 ± 0.02 eV<br />
for DP 1400 resistors aged in the temperature range from 125 to<br />
250°C). The observations made after ageing processes, suggest<br />
that changes, occurred in resistor during thermal exposition, are<br />
caused by some interactions between resistive material and surrounding<br />
films. Applying cladding gives additional protection from<br />
environment and improves stability at higher ageing temperature,<br />
but in turn rather decreases it near room temperature (probably<br />
as a result of stress release after lamination process).<br />
Such simple extrapolation is almost impossible for polymer<br />
thick-film resistors, where depending on sample type and ageing<br />
conditions the relative resistance changes versus ageing time are<br />
positive or negative. For this reason, behaviour of these resistors<br />
cannot be explained using a single ageing mechanism, the problem<br />
is more complex and should take into account also additional<br />
curing of polymer thick-film resistors during ageing at relatively<br />
high temperature (in comparison with 180°C applied for standardcuring<br />
these PTF resistors). In the case of these structures the<br />
interface between resistive films and termination materials plays<br />
very important role on stability. Applying gold contacts significantly<br />
improves reliability, but in general the changes observed for polymer<br />
thick-film resistors are larger than for thin-film ones. Usually<br />
the highest resistance changes for PTF resistors occur during first<br />
20 hours of ageing process – after this period of time further resistance<br />
drifts are much smaller or proceed with linear relationship.<br />
Aforesaid, pre-ageing process phenomenon can be used to enhance<br />
stability of polymer thick-film resistor.<br />
Investigations were made as part of the Operational Programme<br />
Innovative Economy, 2007–2<strong>01</strong>3, the Priority of 1 Investigation and<br />
High Technology Development, Action 1.3 supporting B + R Projects<br />
for entrepreneurs carried out by scientific units, 1.3.1 Development<br />
Projects. The agreement No: UDA-POIG.<strong>01</strong>.03.<strong>01</strong>-14-031/08-<br />
04 of 16.02.2009, Title of Project: „Technologia doświadczalna<br />
wbudowywania elementów rezystywnych i pojemno-ściowych wewnątrz<br />
płytki drukowanej”, Project No: POIG.<strong>01</strong>.03.<strong>01</strong>-00-031/08,<br />
and statutory activity of Wrocław University of Technology.<br />
References<br />
[1] Dziedzic A.: Electrical and structural investigations in reliability characterization<br />
of modern passives and passive integrated components.<br />
Microelectronics Reliability, 42 (2002), pp. 709–719.<br />
[2] Khanna P.K., Bhatnagar S.K., Gust W.: On the thermally accelerated<br />
ageing of thick film resistors. Physica Status Solidi (a) 143, K33<br />
(1994), pp. 15–18.<br />
[3] www.ohmega.com (Ohmega Technologies Inc. website), 21-08-2<strong>01</strong>0.<br />
[4] Dziedzic A., Kłossowicz A., Winiarski P., Nitsch K., Piasecki T., Kozioł<br />
G., Stęplewski W.: Wybrane właściwości elektryczne i stabilność elementów<br />
biernych wbudowanych w płytki obwodów drukowanych.<br />
Przegląd Elektrotechniczny, 87 (2<strong>01</strong>1), no. 10, pp. 39–44.<br />
[5] Stęplewski W., Serzysko T., Kozioł G., Janeczek K., Dziedzic A.:<br />
Investigations of passive components embedded in printed circuit<br />
boards. Proc. 35th International Conference of IMAPS – IEEE CPMT<br />
Poland,Gdańsk-Sobieszewo, September, 2<strong>01</strong>1.<br />
[6] De Schepper L., De Ceuninck W., Stulens H.,. Stals L.M., Vanden<br />
Berghe R., Demolder S.: A new approach to the study of the intrinsic<br />
ageing kinetics of thick film resistors. Hybrid Circuits, No. 23, September<br />
1990, pp. 5–13.<br />
[7] Coleman M.: Ageing mechanisms and stability in thick film resistors.<br />
4th European Hybrid Microelectronics Conference 1983, Copenhagen,<br />
pp. 20–30.<br />
[8] Morten B., Prudenziati M.: Thermal ageing of thick-film resistors. Hybrid<br />
Circuits, no.3 (Autumn 1983, pp. 24–26.<br />
<strong>Elektronika</strong> 1/<strong>2<strong>01</strong>2</strong>
Impedance spectroscopy as a diagnostic tool<br />
of degradation of Solid Oxide Fuel Cells<br />
(Spektroskopia impedancyjna jako narzędzie diagnostyczne degradacji<br />
tlenkowych ogniw paliwowych)<br />
mgr inż. Konrad Dunst, dr inż. Sebastian Molin, dr hab. inż. Piotr Jasiński<br />
Politechnika Gdańska, Wydział Elektroniki, Telekomunikacji i Informatyki<br />
Solid oxide fuel cell (SOFC) is an electrochemical device that converts<br />
chemical potential energy directly into electrical power. In<br />
comparison with a traditional combustion process, the SOFCs offer<br />
greater efficiency, reliability and environmental friendliness [1].<br />
The SOFCs have a great potential to generate power from a wide<br />
range of fuels: hydrogen, carbon monoxide, hydrocarbons and<br />
alcohols. However, when operated, the fuel cells usually degrade.<br />
The nature of this process depends on the type of the applied<br />
fuel and materials used to fabricate the SOFC. In particular, when<br />
hydrocarbons are used as a fuel, a carbon can deposit inside the<br />
anode structure [2]. The deposited carbon may cause a complete<br />
degradation of the fuel cell.<br />
Further development of the SOFCs requires investigation of<br />
degradation process during fuel cells operation. Among the fuel<br />
cell diagnostic tools, AC impedance spectroscopy is a powerful<br />
technique [3]. This method allows obtaining information about different<br />
electrode processes, namely, oxygen reduction reaction<br />
kinetics, mass transfer and electrolyte resistance losses [4]. Selection<br />
of the appropriate experimental conditions (temperature,<br />
pressure and flow rate) may provide information extracted from<br />
the impedance spectra about the performance losses from the<br />
each fuel cell element separately [3,5].<br />
Different electrode processes reveal unique characteristic<br />
frequencies, which depend on cell structure, materials used for<br />
SOFC fabrication and testing conditions. For example, in case of<br />
the anode supported cells with LSM ((La 0.75<br />
Sr 0.25<br />
) 0.95<br />
MnO 3<br />
) cathode<br />
operated at 750°C it was found [6], that the characteristic frequencies<br />
for the cathode processes are at ~25 kHz and ~500 Hz.<br />
At ~4 kHz occurs charge transfer reaction related with the anode.<br />
Characteristic frequency responsible for gas diffusion resistance<br />
is located at around 50 Hz, while at ~4 Hz a gas conversion process<br />
can be seen.<br />
In this study the impedance spectroscopy is used for degradation<br />
evaluation of the anode supported SOFC. Both, commercially<br />
available and fabricated, anode supported SOFCs were tested.<br />
The fuel cells were operated in hydrogen and in methane. The experimental<br />
conditions were selected to obtain fast SOFC degradation.<br />
The changes in impedance spectra due to instability were<br />
correlated with the element of the SOFC, which was responsible<br />
for the cell degradation.<br />
Experimental<br />
Anode supports were fabricated using powders of NiO (J.T.<br />
Baker) and YSZ (Zr 0.84<br />
Y 0.16<br />
O x<br />
) (Tosoh). A typical anode cermet<br />
composition of 60 vol% of nickel and 40 vol% of YSZ was exploited.<br />
In order to obtain sufficient final porosity of anodes for<br />
ease fuel diffusion, a 20 vol% of pore former (graphite (Sigma-Aldrich))<br />
was added to cermet powders. The mixture was<br />
ball-milled (Fritsch Pulverisette 7) for 12 hours and iso-axially<br />
pressed (150 MPa) into pellets (16 mm in diameter). The pellets<br />
were pre-sintered at 1050°C for 4 h, followed by slurry spraying<br />
of 10 µm thick YSZ electrolyte and co-sintering at temperature of<br />
1400°C for 4h. Finally, the LNF (LaNi 0.6<br />
Fe 0.4<br />
O 3<br />
) paste was brushpainted<br />
on the electrolyte and the cells were fired at 1100°C for<br />
Fig. 1. Cross-section of the fabricated SOFC<br />
Rys. 1. Przekrój wytworzonego tlenkowego ogniwa paliwowego<br />
Fig. 2. Equivalent circuit model for the SOFC<br />
Rys. 2. Obwód zastępczy tlenkowego ogniwa paliwowego<br />
2 h. It is known that lanthanum from the cathode may react with<br />
zirconium from electrolyte, what leads to performance degradation<br />
of the SOFC. Therefore, frequently a ceria buffer layer is<br />
fabricated between the electrolyte and cathode, which was omitted<br />
in this study to accelerate the fuel cell degradation. A crosssection<br />
of the fabricated SOFC is shown in Fig. 1.<br />
Commercially available and fabricated SOFCs were characterized<br />
by impedance spectroscopy.For this purpose a Solartron<br />
SI1260 impedance analyzer was coupled with a Solartron SI1287<br />
potentiostat/galvanostat. Measurements were carried on unloaded<br />
fuel cells with the amplitude of 5 mV in the frequency range<br />
from 100 mHz to 300 kHz.<br />
Measured spectra were fitted using ZView software to an<br />
equivalent circuit shown in Fig. 2.The circuit, which is frequently<br />
applied circuit for SOFCs analysis [3], consists of a serial connection<br />
of inductance, resistance, and the serial combination of<br />
the three parallel circuits consisting of resistance and constant<br />
phase element (CPE). The inductance L1 is related to connecting<br />
wires, the serial resistance R1 corresponds to ohmic losses, while<br />
parallel connections of the resistance and CPE represent different<br />
electrode processes [6]. Characteristic frequency for each electrode<br />
process was calculated using equation 1:<br />
1<br />
f = ,<br />
(1)<br />
2πRC<br />
where, R and C are the resistance and the capacitance of the<br />
electrode process, respectively.<br />
<strong>Elektronika</strong> 1/<strong>2<strong>01</strong>2</strong> 59
Results and discussion<br />
Fabricated SOFCs<br />
The fabricated fuel cells were tested in hydrogen at temperature<br />
of 800°C. The fuel cell performance plots are shown in Fig. 3.<br />
The power density decreases after 17 h of fuel cell operation by<br />
25%. However, from the plots it is not possible to acquire detailed<br />
degradation mechanism of the SOFC. Therefore, the impedance<br />
spectroscopy was employed to look for additional information.<br />
Impedance spectra measured just after reduction (marked<br />
as initial) and after 17 hours of fuel cell operation are shown<br />
in Fig. 4. Obtained spectra were fitted using equivalent circuit<br />
presented in Fig. 2. The most representing data are presented<br />
in Tabl. 1. Namely, the resistances (R1, R2, R3, R4), which are<br />
directly correlated with the fuel cell performance and characteristic<br />
frequencies (f1, f2, f3, f4) calculated using eq. 1, which help<br />
correlating the responsible process with the degradation phenomena.<br />
The biggest changes occur at characteristic frequencies<br />
of ~8 kHz – ~4 kHz (f2). Together with f2, the R2 resistance<br />
significantly changes, too. As expected, those changes are connected<br />
with degradation of the cathode. At this range, the characteristic<br />
frequencies are related to cathode phenomena, i.e.<br />
oxygen adsorption and charge transfer reaction.<br />
The increase of resistance is related with interaction between<br />
electrolyte and cathode. As a result, low conductive La 2<br />
Zr 2<br />
O 7<br />
and SrZrO 3<br />
phases are formed at the interface of electrolyte and<br />
cathode, what significantly decrease the length of the triple phase<br />
boundary. Other types of degradation cannot be seen from the<br />
results presented in Fig. 4.<br />
In other to investigate the anode degradation a commercial<br />
fuel cell will be used. In this case the ceria buffer layer was fabricated<br />
between electrolyte and cathode, what significantly diminish<br />
cathode degradation.<br />
Fig. 3. Current-voltage and current-power density plots of the fabricated<br />
SOFC operated in hydrogen at 800°C<br />
Rys. 3. Charakterystyki prądowo-napięciowe oraz prądowo-mocowe<br />
wytworzonych ogniw paliwowych, zmierzone w wodorze w temperaturze<br />
800°C<br />
Tabl. 1. Fitting results of the fabricated fuel cell operated in hydrogen<br />
at 800°C<br />
Tab. 1. Parametry obwodów zastępczych dla wytworzonego ogniwa paliwowego<br />
zbadanego w wodorze w temperaturze 800°C<br />
fabricated<br />
SOFC<br />
R1 R2<br />
(Ω cm 2 ) (Ω cm 2 )<br />
f2<br />
(Hz)<br />
R3<br />
(Ω cm 2 )<br />
f3<br />
(Hz)<br />
R4<br />
(Ω cm 2 )<br />
f4<br />
(Hz)<br />
hydrogen<br />
800°C<br />
0 h 0.025 0.164 8449 0.306 950.9 0.117 8.0<br />
17 h 0.027 0.258 3642 0.355 988.8 0.122 12.6<br />
Fig. 5. Impedance spectra of the commercial SOFC in hydrogen at 600°C<br />
Rys. 5. Widma impedancyjne komercyjnych ogniw paliwowych, zmierzone<br />
w wodorze w temperaturze 600°C<br />
Tabl. 2. Fitting results of the commercial fuel cell operated in hydrogen and<br />
dry methane at 600°C<br />
Tab. 2. Parametry obwodów zastępczych dla komercyjnych ogniw paliwowych<br />
zbadanych w wodorze oraz suchym metanie w temperaturze 600°C<br />
R1 R2<br />
(Ω cm 2 ) (Ω cm 2 )<br />
f2<br />
(Hz)<br />
R3<br />
(Ω cm 2 )<br />
f3<br />
(Hz)<br />
R4<br />
(Ω cm 2 )<br />
f4<br />
(Hz)<br />
Fig. 4. Impedance spectra of the fabricated SOFC in hydrogen at 800°C<br />
Rys. 4. Widma impedancyjne wytworzonych ogniw paliwowych,<br />
zmierzone w wodorze w temperaturze 800°C<br />
commercial SOFC<br />
hydrogen<br />
600°C<br />
methane<br />
600°C<br />
0 h 0.555 0.550 1667.8 0.467 43.8 5.12 0.55<br />
61 h 0.552 0.550 1848.2 0.466 43.1 5.14 0.57<br />
0 h 0.303 0.772 716.2 0.330 26.8 5.15 0.54<br />
70 h 5.2<strong>01</strong> 0.837 525.9 0.373 14.3 5.22 0.38<br />
60<br />
<strong>Elektronika</strong> 1/<strong>2<strong>01</strong>2</strong>
Commercial SOFCs<br />
Operation of the fuel cell under the relatively low temperature and<br />
dry methane may cause carbon deposition, which in result should<br />
provide fast anode degradation. Therefore, the commercial<br />
SOFC was tested at temperature of 600°C in hydrogen and in dry<br />
methane. In either case the anode was in-situ reduced at 800°C.<br />
The impedance spectra of the commercial SOFC tested in dry<br />
methane at temperature of 600°C are shown in Fig. 6. The ohmic<br />
resistance has increased significantly after 70 hours of fuel cell operation.<br />
According to the results obtained from the fitting procedure<br />
(Tabl. 2), the R1 increased from 0.303 Ω cm 2 to 5.2<strong>01</strong> Ω cm 2 . This is<br />
associated with carbon formation in the anode structure, what leads<br />
to deterioration of the electrical contact. It can be noted (see Tabl. 2)<br />
that, the characteristic frequencies changed at low frequencies, what<br />
may be related to the gas diffusion and the gas conversion processes.<br />
Pores in the anode become clogged with carbon, which limits the<br />
diffusion and make length of the triple phase boundary shorter.<br />
Conclusion<br />
In this paper the nature of the degradation of the fuel cells was<br />
studies by the impedance spectroscopy. The fuel cells were tested<br />
in the experimental conditions, which allow obtaining fast fuel<br />
cell performance degradation. The impedance spectra and the<br />
parameters obtained from the fitting of the spectra to the equivalent<br />
circuit were correlated with degradation of the fuel cell elements<br />
– anode or cathode.<br />
The project was supported by the Voivodship Fund for Environmental<br />
Protection and Water Management in Gdansk – project<br />
RX-03/43/2<strong>01</strong>1.<br />
Fig. 6. Impedance spectra of the commercial SOFC in dry methane<br />
at 600°C<br />
Rys. 6. Widma impedancyjne komercyjnych ogniw paliwowych, zmierzone<br />
w suchym metanie w temperaturze 600°C<br />
The impedance spectra of the fuel cells operated in hydrogen<br />
at 600°C are shown in Fig. 5. Nearly no changes in the spectra<br />
are observed. This is also confirmed by the results obtained from<br />
fitting the spectra to equivalent circuit (Tabl. 2). None of the fitted<br />
elements changed significantly their values. Those results demonstrate<br />
good stability of the commercial fuel cells in hydrogen.<br />
References<br />
[1] Zhu W. Z., Deevi S. C.: A review on the status of anode materials<br />
for solid oxide fuel cells. Materials Science and Engineering, A362,<br />
2003, pp. 228–239.<br />
[2] Koh J. H., Yoo Y. S., Park J. W., Lim H. C.: Carbon deposition and<br />
cell performance of Ni-YSZ anode support SOFC with methane fuel.<br />
Solid State Ionics, 149, 2002, pp. 157–166.<br />
[3] Huang Q. A., Hui R., Wang B., Zhang J.: A review of AC impedance<br />
modeling and validation in SOFC diagnosis, Electrochimica Acta, 52,<br />
2007, pp. 8144–8164.<br />
[4] Wagner R.: Solid Oxide Fuel Cells (SOFC) in: Macdonald J. R., Barsoukov<br />
E., Impedance Spectroscopy, Theory, Experiment, and Applications.<br />
John Willey & Sons, 2005, pp. 530–537.<br />
[5] Nielsen J., Mogensen M.: SOFC LSM:YSZ cathode degradation inducted<br />
by moisture: An impedance spectroscopy study. Solid State<br />
Ionics, 189, 2<strong>01</strong>1, pp. 74–81.<br />
[6] Hauch A., Mogensen M.: Ni/YSZ electrode degradation studied by<br />
impedance spectroscopy Effects of gas cleaning and current density.<br />
Solid State Ionics, 181, 2<strong>01</strong>0, pp. 745–753.<br />
Analysis of electromagnetic couplingsin hybrid circuit<br />
made on austenitic metal substrate<br />
(Analiza sprzężeń elektromagnetycznych w układach hybrydowych<br />
wykonanych na podłożach ze stali austenitycznej)<br />
dr inż. Wiesław SABAT, dr inż. Dariusz KLEPACKI, dr inż. Kazimierz KAMUDA<br />
Politechnika Rzeszowska, Zakład Systemów <strong>Elektronicznych</strong> i Telekomunikacyjnych<br />
The fast progress in material technology, new compositions of<br />
dielectric inks allowed to realizations of hybrid structures on<br />
metal substrates. The technological materials from DuPont,<br />
ESL or Heraeus make possible to print different pastes on substrates<br />
from rustless steel (austenitic, ferritic), aluminium or platinum.<br />
The elaborated technological applications (in the most<br />
cases) allow to realization of heating elements (HOS – Heaters<br />
on Steel), electronic structures (COS – Circuits on Steel, TFOS<br />
– Thick Film on Steel) as well as sensors structures for special<br />
applications.<br />
There are a lot of dielectric inks especially dedicated for those<br />
applications. For example – 3500N for ferritic steels S430 and<br />
S444 from DuPont, 4916 for austenitic steel S304 and 4924 for<br />
ferritic steel S430 from ESL or SD1000 SD2000 for ferritic steel<br />
S430 and IP211 dedicated to sensor applications and steels S430<br />
or S446 from Heraeus.<br />
This growing interest of the above-mentioned applications leads<br />
to necessity of research in EMC area. The good knowledge<br />
about mechanisms of disturbance propagation processes is the<br />
basis of good designed final product.<br />
Parasitic elements of paths’ system<br />
The application of rustless steel, aluminium or platinum as substrate<br />
material in microelectronic hybrid circuits leads to creation<br />
of typical microstrip structure for path-substrate system<br />
(Fig. 1) [1, 2].<br />
<strong>Elektronika</strong> 1/<strong>2<strong>01</strong>2</strong> 61
Fig. 1. Structure of microelectronic hybrid circuit made on the metalsubstrate<br />
Rys. 1. Struktura mikroelektronicznego układu hybrydowego wykonanego<br />
na podłożu metalowym<br />
In the above-mentioned configuration the nearness of each<br />
path in relation to ground (determined by thickness of the dielectric<br />
paste) is cause of shorting effect of electric field lines to the<br />
conducted structure of substrate. This effect leads to decrease of<br />
electrical flux value in neighboring paths – then the small values<br />
of parasitic capacitances are observed [2].<br />
The three types of test circuits with different geometrical configuration<br />
were made for realization of experimental investigations<br />
(determination of per-unit-length parameters in planar structures<br />
made on metal substrates) – Fig. 2. The metal substrates fromaustenitic<br />
steel of 304 type (1 mm thick) were selected. The 4916<br />
paste from DuPont (dedicated to austenitic steel) was applied to<br />
insulation layer. On such prepared substrates the test paths were<br />
printed for verification of calculation procedures. The conductive<br />
paths were made on the basis of silver-platinum paste 6305 from<br />
Koartan characterized by low dielectric loss (3 mΩ/□).<br />
The calculations of capacitances between path systems<br />
– for parametrically changed mutual distance and width of paths<br />
– have been made using elaborated numerical procedures for<br />
determination of parasitic parameters with reference ground [4].<br />
The obtained calculation results of equivalent capacitance C z<br />
for<br />
two parallel paths (with constant width) indicate that the value of<br />
capacitance between paths is independent on their mutual distance<br />
(Fig. 3). This effect is a consequence of very near placement<br />
of path’s system in relation to the ground plane as well as small<br />
value of mutual capacitance C M<br />
. It is confirmed by computer simulations<br />
and experimental verification.<br />
2500<br />
2000<br />
1500<br />
1000<br />
500<br />
0<br />
C z , pF/m<br />
A<br />
- calculated<br />
- measured<br />
B<br />
S C =11 pF/m<br />
=0.2%<br />
s,mm<br />
0.1<br />
0.5<br />
1.0<br />
w, mm<br />
0 0,5 1 1,5 2 2,5 3<br />
Fig. 4. Influence of paths width change on capacitance value C z<br />
between configuration of two mutually parallel path systems<br />
Rys. 4. Wpływ zmiany szerokości ścieżek na wartość pojemności C z<br />
pomiędzy układem dwóch wzajemnie równoległych ścieżek<br />
0,3<br />
L z,<br />
H/m<br />
- obliczenia<br />
- pomiar<br />
0,25<br />
s, mm<br />
0.5<br />
Fig. 2. Test path systems with different geometrical parameters made<br />
on metal stainless substrate (sort 304 – AISI)<br />
Rys. 2. Testowe układy ścieżek o różnych parametrach geometrycznych<br />
wykonanych na metalowym podłożu ze stali nierdzewnej (gatunek<br />
304 – AISI)<br />
10000<br />
1000<br />
100<br />
10<br />
1<br />
0,1<br />
C z, pF/m<br />
C M<br />
w, mm<br />
5.0<br />
0.5<br />
0.1<br />
- calculated<br />
- measured<br />
0,2<br />
0 1 2 3 4 w, mm 5<br />
Fig. 5. Influence of paths width change on equivalent inductance value<br />
L z between configuration of two mutually parallel path<br />
Rys. 5. Wpływ zmiany szerokości ścieżek na wartość indukcyjności<br />
L z pomiędzy układem dwóch wzajemnie równoległych ścieżek<br />
1<br />
0,1<br />
L z ,<br />
H/m<br />
- calculated<br />
- measured<br />
w, mm<br />
0.5<br />
0,<strong>01</strong><br />
0 2 4 6 8 s, mm 10<br />
0,<strong>01</strong><br />
0 1 2 3 4 s, mm 5<br />
Fig. 3. Influence of paths distance change on equivalent and mutual<br />
capacitance values C z<br />
and C M<br />
between configuration of two mutually<br />
parallel path system<br />
Rys. 3. Wpływ zmiany odległości ścieżek na wartość wypadkowej<br />
i wzajemnej pojemności C z<br />
i C M<br />
pomiędzy układem dwóch wzajemnie<br />
równoległych ścieżek<br />
Fig. 6. Influence of paths distance change on equivalent inductance<br />
value L z between configuration of two mutually parallel path systems<br />
Rys. 6. Wpływ zmiany odległości ścieżek na wartość indukcyjności<br />
L z pomiędzy układem dwóch wzajemnie równoległych ścieżek<br />
62<br />
<strong>Elektronika</strong> 1/<strong>2<strong>01</strong>2</strong>
The increase of paths width has a very big influence on capacitance<br />
value regarding to the substrate (Fig. 4 – curve A) and on<br />
value of equivalent capacitance C z (Fig. 4 – curve B). The value<br />
of capacitance C z is linear dependent on paths width.<br />
The ability of paths’ system for energy accumulation in magnetic<br />
filed is described by the second parasitic parameter – inductance.<br />
For determination of its changes range for typical geometrical<br />
parameters of path systems the experimental investigations<br />
were carried out using above-described test circuits.<br />
The increase of equivalent inductance connected with<br />
increase of mutual distance between paths is caused by value<br />
decreasing of mutual inductance between analyzed paths (with<br />
constant self-inductance). The dynamics of changes of equivalent<br />
inductance for small distances between paths is result<br />
of significant decrease of mutual inductance for the smallest<br />
distances between them [3].<br />
The decrease of equivalent inductance for two parallel paths is<br />
a consequence of decrease of self-inductance value of path with<br />
their width increasing (Fig. 6).<br />
Analysis of electromagnetic couplings<br />
Analysis of electromagnetic couplings in mutual coupled paths’<br />
system requires solution of telegraph equation:<br />
For specification of propagation process of electrical signals<br />
in microcircuits made on metal substrate the test circuits were<br />
designed and made. They allowed to analyze of signal penetration<br />
with taking into consideration the parasitic elements in path<br />
systems.<br />
The significant reduction of disturbances levelwhich penetrate<br />
between path systems can be obtained by using of conductive<br />
substrate as ground plane. The conducted simulations and experimental<br />
investigations for test circuits confirmed such thesis.<br />
The influence of system configuration on crosstalk reduction in<br />
passive path- active path circuit was analyzed for the simplest<br />
configuration of three paths where crosstalk effect was observed<br />
(Fig. 8).<br />
a)<br />
U G<br />
Z<br />
R<br />
1<br />
I<br />
1 1 2 2<br />
I<br />
U1 3 4 4 U2<br />
3<br />
3<br />
U3 M’ M”<br />
4<br />
L<br />
A<br />
I<br />
I<br />
A’<br />
U<br />
R<br />
R<br />
2<br />
4<br />
( )<br />
( )<br />
⎧ ∂u<br />
z,t<br />
∂i<br />
z,t<br />
⎪−<br />
= R ⋅ i( z,t)<br />
+ L<br />
∂z<br />
∂t<br />
⎨<br />
(1)<br />
⎪ ∂i( z,t)<br />
∂u<br />
( )<br />
( z,t)<br />
− = G ⋅u<br />
z,t + C<br />
⎩ ∂z<br />
∂t<br />
b)<br />
A-A’<br />
W s W s<br />
1<br />
3<br />
W M<br />
M’<br />
H17 (1.4<strong>01</strong>6)<br />
where u (z, t), i (z, t) are voltage and current vectors, respectively<br />
and R, G, L, C – matrices of parameters of parasitic elements of<br />
paths’ system.<br />
For three or more paths (with given boundary conditions)<br />
the solution of telegraph equation is possible by transformation<br />
of equation system (1). It allows to decoupling of voltage and current<br />
vectors which are determined by impedance and admittance<br />
matrices [3–5]:<br />
( ) ( )<br />
( )<br />
( ) ( ) ( )<br />
−1<br />
+<br />
−<br />
⎪⎧<br />
U<br />
⎪⎧<br />
m<br />
z = TU<br />
⋅U<br />
z U z = Z<br />
CT<br />
I<br />
exp − γ ⋅ z ⋅ I<br />
m<br />
+ exp γ⋅<br />
z ⋅ Im<br />
⎨ ⇒ ⎨<br />
−1<br />
+<br />
− (2)<br />
⎪⎩ Im( z) = TI<br />
⋅ I( z)<br />
⎪⎩ I( z) = TI( exp ( −γ⋅<br />
z ) ⋅ I<br />
m−<br />
exp ( γ⋅<br />
z)<br />
⋅ Im<br />
)<br />
( ) ( )<br />
+<br />
−1<br />
⎡I<br />
⎤<br />
m ⎡ ZC<br />
+ ZS<br />
TI<br />
ZC<br />
− ZS<br />
TI<br />
⎤ ⎡US<br />
⎤<br />
⎢ ⎥ = ⎢<br />
⋅ (3)<br />
−<br />
( ) ( ) ( ) ( )<br />
⎥ ⎢ ⎥<br />
⎢⎣<br />
I ⎥⎦<br />
⎣ ZC<br />
− ZS<br />
TI<br />
exp − γL<br />
ZC<br />
+ Z<br />
m<br />
S<br />
TI<br />
exp γL<br />
⎦ ⎣UL<br />
⎦<br />
c)<br />
A-A’<br />
W M<br />
W s W<br />
1 2<br />
H17 (1.4<strong>01</strong>6)<br />
Fig. 8. Test circuits configuration (M’ – reference path/layer): a) wiring<br />
diagram (Z 1<br />
= 50 Ω, R 2<br />
= R 4<br />
= 150 Ω, R 3<br />
= 1 MΩ) λ = 0.1 m, b) one-layered<br />
circuit (w = 0.5 mm, s = 0.5 mm, w M<br />
= 0.5 mm), c) two-layered circuit<br />
(w = 0.5 mm, w M<br />
= 50 mm)<br />
Rys. 8. Konfiguracja układów testowych (M’ – ścieżka/warstwa odniesienia):<br />
a) schemat połączeń (Z 1<br />
= 50 Ω, R 2<br />
= R 4<br />
= 150 Ω, R 3<br />
= 1 MΩ)<br />
λ = 0.1 m, b) układ jednowarstwowy (w = 0.5 mm, s = 0.5 mm,<br />
w M<br />
= 0.5 mm), c) układ dwuwarstwowy (w = 0.5 mm, w M<br />
= 50 mm)<br />
M’<br />
where T U<br />
i T I<br />
are matrices allowed to make diagonal of matrices<br />
+ −<br />
Z i Y, U S<br />
i U L<br />
– voltage vectors of supply sources, Im i I m – searched<br />
vectors of integration constants determined on the basis<br />
of boundary conditions, γ means propagation constant, L – path<br />
length, Z S<br />
i Z L<br />
– impedance vector loaded paths’ system and Z C<br />
is<br />
the matrix of wave impedance of paths’ system.<br />
s<br />
w<br />
s=0.5mm, w=0.5mm<br />
a)<br />
100 mm<br />
b)<br />
Fig. 7. Test circuits for analysis of electrical signal process propagation<br />
in mutually parallel path systems: a) geometrical parameters,<br />
b) physical structure of test circuit<br />
Rys. 7. Układy testowe do analizy procesu propagacji sygnałów elektrycznych<br />
w układach wzajemnie równoległych ścieżek: a) parametry<br />
geometryczne, b) fizyczna struktura układu testowego<br />
Fig. 9. Time courses calculated for test circuit in configuration from<br />
the Figure 8b. (U1 – beginning of active path, U3 – near crosstalk, U4<br />
– far crosstalk)<br />
Rys. 9. Symulowane Przebiegi czasowe dla układu testowego o konfiguracji<br />
z rysunku 8b (U1 – początek ścieżki czynnej, U3 – przesłuch<br />
bliski, U4 – przesłuch daleki)<br />
<strong>Elektronika</strong> 1/<strong>2<strong>01</strong>2</strong> 63
Fig. 10. Time courses measured for test circuit in configuration from<br />
the Figure 8b<br />
Rys. 10. Przebiegi czasowe zmierzone dla konfiguracji układu testowego<br />
z rysunku 8b<br />
Fig. 11. Time courses measured for test circuit in configuration from<br />
the figure 8c<br />
Rys. 11. Przebiegi czasowe zmierzone dla konfiguracji układu testowego<br />
z rysunku 8c<br />
The trapezoidal pulse generated by AFG3252 arbitrary signals<br />
generator (with following parameters: 5 V level, rising time<br />
τ r<br />
and falling time τ f<br />
equal 2.5 ns, duration time – 40 ns and<br />
repetition time equals 200 ns) was used for analysis of propagation<br />
processes. The level of crosstalk generated on the end<br />
of passive path was assumed as reference point in analysis.<br />
For measurements of time courses the oscilloscope MSO4104<br />
with active probes TAP1500 from Tektronix was used.Active and<br />
passive layer were loaded at the end by resistors R 2<br />
and R 4<br />
(value – 150 Ω in SMD version, package 0603). This value is<br />
near to wave impedance value of the considered path systems<br />
(Zoe = 135 Ω − differential impedance, Zoo = 129 Ω − common<br />
impedance). The passive path at the beginningwas loaded by<br />
resistor R 3<br />
= 1 MΩ.<br />
Using conductive plane of substrate as ground plane allows to<br />
significant reduction of crosstalk level generated in passive path<br />
(Fig. 11). The reduction of 25 dB of crosstalk level was obtained<br />
in the case of tested configuration (where active and passive path<br />
had width and mutual distance equal 0.5 mm and were electromagnetically<br />
coupled on distance 0.1 m) in relation to configuration<br />
where ground path was placed in the same plane as active<br />
and passive layer (Fig.10).<br />
Conlusions<br />
The specific properties of hybrid structures realized on metal<br />
substrates (determined by distance of conductive paths in relation<br />
to substrate) are cause of increase of parasitic elements<br />
values in path systems in relation to conductive substrate and<br />
decrease of those parameters between them. The results of calculations<br />
and measurements indicate that values of capacitance,<br />
self and mutual inductance of paths’ system is strongly dependent<br />
on their geometrical parameters.Such systems are transmission<br />
microstrip structures in relation to conductive substrate.<br />
Taking into account those properties the significant reduction of<br />
disturbances level which penetrate by parasitic elements of path<br />
systems can be obtained. However, the one-layered or multilayered<br />
circuits without using the conductive plane as ground<br />
plane can be generate high level of crosstalk. Those effect are<br />
very important from electromagnetic compatibility and signal integrity<br />
point of view.<br />
Equipment purchased in the project No POPW.<strong>01</strong>.03.00-18-<strong>01</strong>2/09<br />
from the Structural Funds, The Development of Eastern Poland<br />
Operational Programme co-financed by the European Union, the<br />
European Regional Development Fund.<br />
References<br />
[1] Kaiser K. L.: Transmission Lines, Matching and Crosstalk. CRC<br />
Press 2006.<br />
[2] Paul C.R., Analysis of Multiconductor Transmission Lines.John Wiley<br />
& Sons Ltd 2008.<br />
[3] Sabat W., Klepacki D., Kamuda K., Kalita W.: Application of Operational<br />
Method in Analysis of Electromagnetic Couplings in Mutual<br />
Coupled Path Systems of Planar Structures. Electronics Systemintegration<br />
Technology Conference, 2008. ESTC 2008. 2nd, s. 1107–<br />
1110, 2008.<br />
[4] Sabat W.: Uwarunkowania propagacji zakłóceń przewodzonych<br />
w hybrydowych strukturach mikroelektronicznych. PhD Thesis, Politechnika<br />
Rzeszowska, Rzeszów 2002 (in Polish).<br />
[5] Caniggia S., Maradei F.: Signal Integrity and Radiated Emission<br />
of High-Speed Digital Systems. John Wiley & Sons Ltd 2008.<br />
64<br />
<strong>Elektronika</strong> 1/<strong>2<strong>01</strong>2</strong>
EMC Aspects in microelectronics structures made<br />
in LTCC technology<br />
(Zagadnienia EMC w mikroelektronicznych strukturach wytwarzanych<br />
w technologii LTCC)<br />
dr inż. Wiesław SABAT, dr inż. Dariusz KLEPACKI, dr hab. inż. Włodzimierz KALITA, prof. PRz<br />
Politechnika Rzeszowska, Zakład Systemów <strong>Elektronicznych</strong> i Telekomunikacyjnych<br />
prof. Ing. Stanislav SLOSARČÍK, CSc; Ing. Michal JURČIŠIN, dr Ing. Pavol CABÚK<br />
Technická Univerzita v Košiciach, Fakulta elektrotechniky a informatiky, Katedra technológií v elektronike, Slovenská Republika<br />
The fast development of LTCC technology (Low Temeperature<br />
Cofired Ceramic) is observed in relation to realization of multilayered<br />
hybrid structures. It is applied for manufacturing of wide<br />
range of microelectronic circuits, especially MCM-C structures<br />
(Multi Chip Module on Ceramics) which are used in different<br />
areas of industry. The multilayered structures, sensors, microsystems,<br />
passive elements, microwave elements can be found in<br />
telecommunication, informatics, radioengineering, mechatronics,<br />
transport, etc. The possibility of creation of channels and cavities<br />
inside of LTCC module allows to realization of chemical microreactors,<br />
hydraulic systems in microscale (together with pumps and<br />
valves), fuel cells, flat plasma displays, sensors of physical quantities<br />
and systems applied in biotechnology and medicine [1, 2].<br />
Parasitic elements of paths’ system<br />
The calculations of mutual capacitance C M<br />
and effective inductance<br />
L z<br />
(for two parallel paths system with parametrically changed<br />
the mutual distance „s” and paths width „w”) were made using<br />
elaborated PACAPIND program. They allowed to determine range<br />
of parameters changes of parasitic elements in typical LTCC<br />
structure for three basic configurations.<br />
For experimental investigations (determination of per-unitlength<br />
parameters) the test circuits were made in configuration<br />
of mutual parallel path systems (Fig. 1) on the basis of silver<br />
conductive paste HF612Ag and LTCC substrate 943PX from<br />
DuPont.<br />
The test circuits were made in three configurations: onelayered,<br />
two-layered with ground plane (microstrip configurations)<br />
and layered with the same thickness of substrate layer (strip configuration)<br />
– Fig. 2.<br />
The obtained results of calculations (experimentally confirmed)<br />
show that change of mutual distance and width of paths<br />
– especially for the smallest values those parameters – has a big<br />
Fig. 2. Geometrical parameters of the test path systems and their<br />
configurations<br />
Rys. 2. Parametry geometryczne układów testowych wraz z ich konfiguracjami<br />
100<br />
50<br />
CM, pF/m<br />
- calculated<br />
- measured<br />
S C =1.0 pF/m<br />
20<br />
10<br />
w, mm<br />
5.0<br />
0.5<br />
0.1<br />
0 2 4 6 8 s, mm 10<br />
Fig. 1. Test path systems implemented in Department of Technologies<br />
in Electronics at Technical University of Košice<br />
Rys. 1. Układ testowy wykonany w Katedrze Technologii <strong>Elektronicznych</strong><br />
Technicznego Uniwersytetu w Koszycach<br />
Fig. 3. Influence of geometrical parameters changes in path system<br />
on capacitance value C M<br />
for DuPont 943PX ceramics with thickness<br />
h = 4.5 mm and ε r<br />
= 7.8 for constant value of path width „w” with<br />
change of their mutual distance „s”<br />
Rys. 3. Wpływ zmian parametrów geometrycznych układu ścieżek<br />
na wartość pojemności C M<br />
dla ceramiki DuPont 943PX o grubości<br />
h = 4.5 mm i ε r<br />
= 7.8 dla stałej szerokości ścieżek „w” przy zmianie<br />
wzajemnej odległości „s”<br />
<strong>Elektronika</strong> 1/<strong>2<strong>01</strong>2</strong> 65
3<br />
2<br />
L'eff, µH/m<br />
- calculated<br />
- measured<br />
S C=40 nH/m<br />
ϕ 2 =0.1%<br />
w, mm<br />
0.1<br />
0.5<br />
a)<br />
UG<br />
Z<br />
R<br />
1<br />
I<br />
1 1 2 2<br />
I<br />
U1 3 4 4 U2<br />
3<br />
3<br />
U3 M’ M”<br />
4<br />
A<br />
I<br />
I<br />
U<br />
R<br />
R<br />
2<br />
4<br />
1<br />
0<br />
s, mm<br />
0 2 4 6 8 10<br />
5.0<br />
b)<br />
A-A’<br />
W s W s<br />
1<br />
L<br />
W M<br />
3 M’<br />
A’<br />
Fig. 4. Influence of geometrical parameters changes in path system<br />
on effective inductance value Leff for DuPont 943PX ceramics with<br />
thickness h = 4.5 mm for constant value of path width „w” with change<br />
of their mutual distance „s”<br />
Rys. 4. Wpływ zmian parametrów geometrycznych układu ścieżek<br />
na wartość indukcyjności L eff<br />
dla ceramiki DuPont 943PX o grubości<br />
h = 4.5 mm dla stałej szerokości ścieżek „w” przy zmianie wzajemnej<br />
odległości „s”<br />
influence on value of parasitic capacitance and inductance. From<br />
the point of view of signal integrity the reduction of mutual capacitance<br />
value between “disturbing” and “disturbed” circuit leads to<br />
measurable crosstalk reduction between non-associated logically<br />
circuits.<br />
Analysis of electromagnetic couplings<br />
in mutually coupled paths<br />
The level of disturbances penetration between paths is in significant<br />
way dependent on geometrical, electrical physical factors of<br />
planar structures [3]. For influence determination of the abovementioned<br />
factors on effectiveness of disturbance propagation<br />
in mutually coupled paths systems the simulation and experimental<br />
investigations were carried out. For the selected configurations<br />
(Fig. 5) with different geometrical parameters the propagation<br />
process of trapezoidal pulse (generated by AFG3052<br />
generator: amplitude – 5 Vpp, changed raising and falling time<br />
τ r<br />
= τ f<br />
– from 2.5 to 10 ns) with using parasitic elements of paths<br />
was analyzed.<br />
The determination of parameter matrices of parasitic elements<br />
for analyzed geometrical configuration of paths’ system is the basis<br />
of simulations [5].<br />
The knowledge about their values is the main element for creation<br />
of transmission line model. For example, matrices of capacitances,<br />
inductances and resistances (calculated using elaborated<br />
PACAPIND) for paths configuration from Fig. 5a (thickness<br />
of substrate after firing h = 0.45 mm, dielectric constant of LTCC<br />
ceramics ε r<br />
= 7.8) are equal:<br />
Fig. 5. Geometrical parameters of test path systems<br />
Rys. 5. Parametry geometryczne testowego układu ścieżek<br />
66<br />
a)<br />
b)<br />
c)<br />
d)<br />
e)<br />
f)<br />
w<br />
M<br />
w s w, s, w M,<br />
0.5 0.5 2.0<br />
0.5 0.5 1.0<br />
50 mm<br />
mm mm mm<br />
0.5<br />
0.5<br />
0.5<br />
0.5<br />
0.5<br />
1.0<br />
0.5<br />
0.5<br />
0.5<br />
0.5<br />
0.5<br />
0.5<br />
c)<br />
A-A’<br />
Fig. 6. Test circuits configuration: a) wiring diagram (Z 1<br />
= 50 Ω,<br />
R 2<br />
= R4 = 150 Ω, R 3<br />
= 1 MΩ, λ = 0.05 m, b) one-layered circuit<br />
(w = 0.5 mm, s = 0.5 mm, w M<br />
= 0.5 mm), c) two-layered circuit with<br />
ground layer (w = 0.5 mm, w M<br />
= 50 mm)<br />
Rys. 6. Układ testowy: a) schemat układu (Z1 = 50 Ω, R2 = R4 = 150 Ω,<br />
R3 = 1 M Ω, l = 0,05 m, b) układ jednowarstwowy (w = 0,5 mm,<br />
s = 0,5 mm, w M<br />
= 0,5 mm), c) układ dwuwarstwowy z płaszczyzną<br />
masy (w = 0,5 mm, w M<br />
= 50 mm)<br />
Fig. 7. Simulated waveforms of near–end crosstalk U 3<br />
in passive<br />
path, for different values of rise an fall time of slope for trapezoidal<br />
test pulse<br />
Rys. 7. Symulowane przebiegi bliskiego przesłuchu U3 w ścieżce<br />
biernej dla różnych czasów narastania i opadania trapezowego impulsu<br />
testowego<br />
⎡ 49.8<br />
C = ⎢<br />
⎣−<br />
39.7<br />
⎡908.5<br />
L = ⎢<br />
⎣399.5<br />
⎡4.7<br />
R = ⎢<br />
⎣1.1<br />
W M<br />
W s W<br />
1 2<br />
− 39.7⎤<br />
79.3<br />
⎥ ⎦<br />
399.5⎤<br />
689.2<br />
⎥ ⎦<br />
1.1⎤<br />
Ω<br />
4.7 ⎥<br />
⎦<br />
/ m<br />
pF / m<br />
nH / m<br />
Those matrices are input data to the program which allowed to<br />
analysis of propagation process of electrical signals in mutually<br />
coupled paths systems.<br />
The influence of changes of rising and falling time of trapezoidal<br />
signal slope on crosstalk level U 3<br />
generated in passive<br />
path (Fig. 6a) was analyzed for test circuit in configuration from<br />
Fig. 6b. The obtained results are presented in Fig. 7 (simulations)<br />
and Fig. 8 (experimental verification).<br />
M’<br />
<strong>Elektronika</strong> 1/<strong>2<strong>01</strong>2</strong>
Fig. 8. Measured waveforms of near–end crosstalk U 3<br />
in passive path,<br />
for different values of rise an fall time of slope for trapezoidal test<br />
pulse<br />
Rys. 8. Zmierzone przebiegi bliskiego przesłuchu U3 w ścieżce biernej<br />
dla różnych czasów narastania i opadania trapezowego impulsu<br />
testowego<br />
Fig. 9. Measured courses of near-end U 3<br />
and far-end U 4<br />
crosstalk in<br />
passive path for one-layered circuit<br />
Rys. 9. Zmierzone przebiegi bliskiego (U3) I dalekiego (U4) przesłuchu<br />
w ścieżce biernej w układzie jednowarstwowym<br />
The change of configuration from one- to two-layered with<br />
ground layer (Fig. 6) is the characteristic example, which shows<br />
influence of geometrical factors on crosstalk level generated<br />
in system of coupled paths. The basic test circuit was characterized<br />
by following dimensions: length L = 0.05 m, width<br />
w = 0.5 mm and mutual distance s = 0.5 mm for one-layered<br />
circuit (Fig. 6b) and two-layered with ground layer (Fig. 6c). The<br />
influence of configuration changes on crosstalk level U 3<br />
generated<br />
in passive path was analyzed with constant value of changes<br />
speed of test signal (2 V/s).<br />
The small differences between calculations and measurements<br />
are caused by the fact that paths’ shapes were modeled<br />
as „ideal” (with straight edges).<br />
Conclusions<br />
In the case of considered microelectronic structures made in<br />
LTCC technology, the geometrical factors (in connection with<br />
physical parameters) determine parameter values of parasitic<br />
Fig. 10. Measured courses of near-end U 3<br />
and far-end U 4<br />
crosstalk<br />
in passive path for two-layered circuit with ground layer<br />
Rys. 10. Zmierzone przebiegi bliskiego (U3) I dalekiego (U4) przesłuchu<br />
w ścieżce biernej w układzie dwuwarstwowym z płaszczyzną<br />
masy<br />
elements in path’s system. Change of length, width, thickness,<br />
mutual distance of paths, thickness of substrate as well as paths<br />
configuration has a big influence on values of capacitance,<br />
inductance, resistance and conductance of paths’ system. The<br />
specific properties of LTCC technology which allow to obtain<br />
much more integration scale in relation to classical thick-film<br />
technology are cause higher values of per-unit-length parameters<br />
of the conductive structures. For near placed paths the<br />
value of parasitic capacitance can be equal from 100 pF/m to<br />
150 pF/m as well as the effective inductance for the narrowest<br />
paths can be from the range 1…3 µH/m. Those non-zero values<br />
of parasitic parameters are responsible for penetration<br />
of electrical signals between particular parts of circuit. The part<br />
of signal which penetrates by parasitic capacitances and inductances<br />
is received as disturbance. This problem is especially important<br />
– as results of simulations and measurements show – for<br />
fast-changed signals and signals with frequency over 100 kHz,<br />
where parasitic elements are simple medium for penetration<br />
of electric signals. The effectiveness of disturbances penetration<br />
is significant dependent on parameters values of parasitic elements<br />
exist in real-world paths systems.<br />
Equipment purchased in the project No POPW.<strong>01</strong>.03.00-18-<strong>01</strong>2/09<br />
from the Structural Funds, The Development of Eastern Poland<br />
Operational Programme co-financed by the European Union, the<br />
European Regional Development Fund.<br />
References<br />
[1] Slosarcik S., Pietriková A., Banský J.: Základy Technológii v elektronike.<br />
Vienala, 2006.<br />
[2] Golonka L.: Zastosowania ceramiki LTCC w mikroelektronice. Oficyna<br />
Wydawnicza Politechniki Wrocławskiej, 20<strong>01</strong>.<br />
[3] Sabat W.: Uwarunkowania propagacji zakłóceń przewodzonych<br />
w hybrydowych strukturach mikroelektronicznych. Rozprawa doktorska,<br />
Politechnika Rzeszowska, Rzeszów 2002.<br />
[4] Sabat W., Klepacki D., Kamuda K. Kalita W.: Application of Operational<br />
Method in Analysis of Electromagnetic Couplings in Mutual<br />
Coupled Path Systems of Planar Structures. Electronics Systemintegration<br />
Technology Conference, 2008. ESTC 2008. 2nd, s. 1107–<br />
1110, 2008;<br />
[5] Caniggia S., Maradei F.: Signal Integrity and Radiated Emission<br />
of High-Speed Digital Systems. John Wiley & Sons Ltd 2008.<br />
<strong>Elektronika</strong> 1/<strong>2<strong>01</strong>2</strong> 67