Executive Summary - The Chalkboard Project
Executive Summary - The Chalkboard Project
Executive Summary - The Chalkboard Project

Create successful ePaper yourself
Turn your PDF publications into a flip-book with our unique Google optimized e-Paper software.
<strong>Executive</strong> <strong>Summary</strong><br />
INTRODUCTION<br />
In July 2003, five of Oregon’s larger charitable foundations established<br />
“Foundations for a Better Oregon,” a new organization created to facilitate<br />
collaboration on an integrated set of projects to improve the state of Oregon.<br />
<strong>The</strong>se are known collectively as the <strong>Chalkboard</strong> <strong>Project</strong>, an effort to share best<br />
practices, broaden perspectives, and bring the citizens of Oregon together to help<br />
ensure a superior Kindergarten-12 th grade (K-12) public education system.<br />
Before the <strong>Project</strong> can proceed with a discussion of issues related to K-12<br />
education in Oregon, the sponsors—and the citizens they intend to engage—need<br />
a solid understanding of the system’s existing conditions. This paper describes the<br />
existing condition of the system but does not offer solutions. Policy<br />
responses—in the areas of improving student achievement, system accountability,<br />
and finance—are the purpose of forthcoming reports.<br />
<strong>The</strong> report is structured around the three focus areas of the <strong>Chalkboard</strong><br />
<strong>Project</strong>: quality, accountability, and finance.<br />
FINDINGS ON QUALITY<br />
In an April 2004 statewide poll conducted by the <strong>Chalkboard</strong> <strong>Project</strong>, 36<br />
percent of Oregonians characterized the state’s K-12 “somewhat good” while only<br />
9 percent viewed the system as “very good”. Despite this unexceptional<br />
assessment, Oregonians have high expectations for K-12 with 80 percent<br />
believing Oregon should be at least among the very best K-12 systems in the<br />
country.<br />
Assessing the quality of the K-12 system is complicated and requires an<br />
examination of a wide array of indicators related to the system’s context, its<br />
inputs and processes, and its outputs. <strong>The</strong> purpose of this report is to describe and<br />
document where Oregon stands on key indicators. In forthcoming <strong>Chalkboard</strong><br />
reports, we will debate vigorously which factors matter and why. Below, we<br />
outline our key findings on the condition of Oregon K-12 system.<br />
• Oregon’s student profile has changed considerably in recent years<br />
and will change even more in the years to come. (See Appendix,<br />
Section 1.) Since 1989-90, increases in total enrollment in Oregon’s<br />
public K-12 schools have been relatively slow, growing at an annual<br />
average rate of 1.1 percent. However, enrollment of students of<br />
Hispanic origin increased at an annual rate of more than 10 percent and,<br />
by the 2003-04 school year, these students represented 13 percent of the<br />
public school population. Meanwhile, students with physical and mental<br />
<strong>Chalkboard</strong> <strong>Project</strong> ECONorthwest / CEPR September 2004 Page 1
disabilities served under the federal Individual with Disabilities<br />
Education Act (IDEA) increased at an annual rate of 2.8 percent during<br />
1991-2001—or at about two and half times faster than the rate of growth<br />
for overall enrollment.<br />
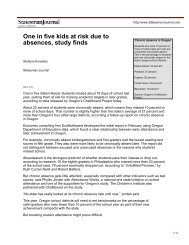
• Student absenteeism is comparatively high in Oregon. (See<br />
Appendix, Section 2.) Multiple surveys and data sources suggest<br />
Oregon’s K-12 system has an unrecognized problem with absenteeism.<br />
In background surveys of school officials for national (NAEP) and<br />
international (TIMSS) exams, Oregon schools officials expressed much<br />
higher concern about absenteeism than their peers in other states.<br />
Moreover, Oregon’s average daily attendance—as reported to the<br />
National Center on Education Statistics—is low relative to counts of<br />
student enrollment.<br />
• Oregon’s dropout rate has fallen in recent years but still ranks<br />
relatively high nationally. (See Appendix, Section 3.) Oregon’s<br />
dropout rate fell from 5.8 percent in 1991-92 to 4.4 percent in 2002-03.<br />
In 2002-03, dropout rates for Hispanic (9.1 percent) and black students<br />
(9.0 percent) are more than double those estimated for white students<br />
(3.6 percent) and Asian students (3.8 percent). However, national<br />
comparisons from the 2000-01 school year (the most recent available)<br />
show Oregon’s high school dropout rate ranked 11 th .<br />
• Oregon’s schools are safe and orderly relative to schools in some<br />
other states. (See Appendix, Section 4.) <strong>The</strong> incidence of physical<br />
violence toward teachers or other students is relatively low in Oregon.<br />
Moreover, surveys of school officials suggest that problems with general<br />
classroom misbehavior do not stand out from the national norms.<br />
• Oregon’s public K-12 system relies on fewer staff than most states.<br />
Class sizes are high. (See Appendix, Section 5.) Oregon, like many<br />
other Western states, operates a K-12 system with fewer teachers and<br />
fewer non-teaching staff. In fall 2000, Oregon had 19.4 students for<br />
every full-time equivalent teacher and 19.5 students for every nonteacher<br />
staff member. <strong>The</strong> U.S. averages were 16.0 and 17.0,<br />
respectively. Oregon’s student-to-staff ratios declined slightly from fall<br />
1992 levels. <strong>The</strong> high student-to-teacher ratios translate into larger class<br />
sizes. Oregon is consistently in the top five states nationally on most<br />
measures of class size.<br />
• Survey suggests facilities and instructional materials are lacking for<br />
mathematics and science. (See Appendix, Section 6.) A 1999 survey of<br />
school officials—conducted as part of an international mathematics and<br />
science assesssment—indicated only 11 percent of Oregon students<br />
attended schools with a “high availability of school resources for<br />
mathematics and science instruction.” <strong>The</strong> same survey found<br />
that—nationwide—an average 37 percent of students attended schools<br />
Page 2 September 2004 ECONorthwest / CEPR <strong>Chalkboard</strong> <strong>Project</strong>
with high availability of mathematics resources and 34 percent attended<br />
schools with a high availability of science resources.<br />
• While Oregon teacher attrition rates are slightly better than the<br />
national average, over one-third of new teachers leave the profession<br />
by the fifth year. Close examination of federal survey data for more<br />
than 50,000 teachers nationwide suggests that teacher shortages are not<br />
attributable to surges in retirements and enrollments. Steady, high<br />
attrition rates, where teachers are leaving education for a variety of<br />
reasons, are a better explanation for the constant demand for new<br />
teachers. At the national level, 13 percent of teachers leave the<br />
profession within one year; 29 percent leave after three years; and 39<br />
percent leave after five years. 1 Based on data from the Oregon Quality<br />
Assurance in Teaching project, Oregon teachers leave the profession at a<br />
rate of 10 percent after the first year, 21 percent after two years, 33<br />
percent after four years and 37 percent after five years. 2 While slightly<br />
better than the national average, this figure means Oregon must prepare<br />
and induct a significant number of new teachers each year.<br />
• Enrollment rates in alternatives to traditional public schools are low<br />
relative to other states. (See Appendix, Section 7.) <strong>The</strong> national<br />
average for students attending private schools has hovered around 10<br />
percent for the last 30 years. Comparatively Oregon's private school<br />
enrollment has increased slightly from 5.8 percent in 1990-91 to 6.7<br />
percent in 2002-03. Oregon’s public school enrollment dropped from<br />
93.2 percent in 1990-91 to 91.2 percent in 1997-98. Notably, many<br />
students in Oregon's largest school district resorted to alternative<br />
education options. In 1990-91, 85.8 percent of students within the<br />
Portland Public School district attended PPS schools; in 2002-03 this<br />
number was down to 83.5 percent. In addition to increased private<br />
school enrollment, the decrease was also caused by many parents<br />
exercising their right to home school. Oregon's approximately 12,500<br />
home school students in 2002-03 comprised 2.1 percent of the total<br />
student population, up from about 1 percent in the early 90's, and<br />
exceeding the national average of 1.7 percent. In 1999, Oregon enacted<br />
its first charter school legislation. In the fall of 2002, 25 charter schools<br />
served over 2000 Oregon youths. However, to date only 0.2 percent of<br />
Oregon students are enrolled in charter schools, compared to the national<br />
average of 1.2 percent.<br />
• Oregon is closer to attaining the status of a “top performing” system<br />
in mathematics and science than in other core subject areas. (See<br />
Appendix, Section 8.) An analysis of National Assessment of<br />
Educational Progress (NAEP) scores shows Oregon students do<br />
relatively better on mathematics and science assessments—compared to<br />
their U.S. peers—than they do on reading and writing. For example, on<br />
the most recent NAEP 8 th grade tests in mathematics (2003), only seven<br />
<strong>Chalkboard</strong> <strong>Project</strong> ECONorthwest / CEPR September 2004 Page 3
states could claim higher average scores than Oregon. In the most recent<br />
8 th grade NAEP science exam (2000), students in only five states<br />
outperformed Oregon’s students. Somewhat less encouraging are the 4 th<br />
grade NAEP science scores, which show students in 14 states<br />
outperforming Oregon students. <strong>The</strong> NAEP findings are consistent with<br />
conclusions of the 1999 Third International Math and Science Study<br />
assessments (TIMSS), which reported Oregon’s 8 th graders scoring<br />
above the US average.<br />
• Achievement scores on reading are average at best. (See Appendix,<br />
Section 9.) <strong>The</strong> NAEP assessments for reading present a different<br />
picture than those for mathematics and science. For example, in the<br />
most recent 4 th grade reading assessment (2003), students in 19 states<br />
could claim higher average scores than Oregon students. Findings for<br />
the 8 th grade reading exam found 12 states outperforming Oregon.<br />
• Writing scores tell different stories at 4 th and 8 th grade. (See<br />
Appendix, Section 10.) <strong>The</strong> most recent NAEP writing exam (2002)<br />
showed 4 th grade students in 20 states outperforming Oregon students.<br />
By contrast, on the 8 th grade exam only three states outperformed<br />
Oregon.<br />
• Oregon’s racial and ethnic achievement gaps have many facets. (See<br />
Appendix, Sections 8-10.) A number of preceding studies have<br />
identified achievement gaps between white, black, Hispanic, and Asian<br />
students as a top concern for Oregon’s K-12 system. Achievement gaps<br />
exist between whites and non-Asian minority students in every subject<br />
and grade level. However, the scores suggest that some gaps are more<br />
pronounced than others. For example, on the NAEP 8 th grade<br />
mathematics, the gap narrows because Oregon’s black students<br />
significantly outperformed black students in other states while Oregon’s<br />
white students underperformed relative to white students in other states.<br />
Hispanic students, Oregon’s fastest growing group of students,<br />
demonstrate significantly lower scores across the board than Oregon<br />
white students; however, their scores are generally comparable to<br />
Hispanics across the nation.<br />
• Oregon students who attend schools in central cities tend to<br />
outperform students from central cities in other states. Oregon<br />
students in suburbs and rural areas show comparable achievement<br />
to their peers living in similar locations. (See Appendix, Sections 8-<br />
10.) On the eight most recent state-level NAEP exams (two grade levels<br />
in mathematics, reading, writing, and science), Oregon students who<br />
attended schools in central cities 3 outperformed their central-city peers<br />
on six of the eight exams. Oregon students attending suburban and rural<br />
schools showed levels of achievement similar to comparable students in<br />
other states. <strong>The</strong> exceptions: 4 th grade rural students underperformed<br />
Page 4 September 2004 ECONorthwest / CEPR <strong>Chalkboard</strong> <strong>Project</strong>
elative to their rural peers on the NAEP writing assessment while 8 th<br />
grade rural students outperformed their peers on the science exam.<br />
• Students from low-income families appear to fare better in Oregon<br />
than students from low-income families in other states. Meanwhile,<br />
Oregon students from middle- and upper-income families appear to<br />
underachieve on a number of assessments. (See Appendix, Sections<br />
8-10.) Oregon students who are eligible for free or reduced price lunches<br />
(a proxy for students in low-income families) outperformed similarly<br />
eligible students across the country on six of the eight most recent<br />
NAEP assessments. By contrast, students deemed ineligible for the<br />
federal school lunch program underperformed relative to similar<br />
students on four of the eight recent assessments. Varying school<br />
policies for enrolling children in the federal school lunch program might<br />
explain some of the differences between the Oregon and the national<br />
achievement averages for this subpopulation as could the relatively<br />
smaller gap between poor, middle class, and upper income in Oregon.<br />
• While Oregon’s statewide SAT test scores during the past decade<br />
have placed it first or second in the nation among states where over<br />
half of the students take the SAT, a breakdown of scores by student<br />
ethnicity reveals Oregon’s white students rank closer to the middle<br />
than the top in their performance. (See Appendix, Section 11.) This<br />
phenomenon can best be explained by the differences in demographics<br />
between Oregon and the rest of the states where a sizeable number of<br />
students take the SAT. <strong>The</strong>se states tend to be in the northeast, southeast,<br />
and west. <strong>The</strong>se states are much more ethnically and economically<br />
diverse than Oregon. States with ethnic makeups more similar to<br />
Oregon’s tend to be in the Midwest where the ACT is dominant.<br />
<strong>The</strong>refore, Oregon is not compared to these states. Many of the states to<br />
which Oregon’s SAT scores are compared have been actively<br />
encouraging more low-income and minority-group students to take the<br />
SAT. <strong>The</strong>se students’ scores have been lower than those of white<br />
students from middle-class or higher economic backgrounds. <strong>The</strong>refore,<br />
Oregon’s overall average SAT score ranks the state highly in part<br />
because of differences between Oregon and other states in terms of the<br />
composition of the test-taking populations.<br />
• A breakdown of SAT test scores by student ethnicity reveals mixed<br />
results. (See Appendix, Section 11.) When the scores of Oregon<br />
Hispanic, African American and Asian American students are compared<br />
to those obtained by their peers in a group of high-participation states<br />
that have ethnically diverse student populations, results are mixed. <strong>The</strong>se<br />
states include California, Florida, Massachusetts, New Jersey, New<br />
York, Pennsylvania and Florida. Generally, Oregon’s Hispanic students<br />
obtained tests scores roughly equal to the national average for their<br />
Hispanic peers. Oregon’s African American students received math,<br />
<strong>Chalkboard</strong> <strong>Project</strong> ECONorthwest / CEPR September 2004 Page 5
verbal and composite scores that significantly exceeded those of their<br />
peers in each of the selected states and nationwide. However, very few<br />
Oregon African-Americans take the SAT. Finally, Oregon’s Asian<br />
American students scored noticeably below national averages in their<br />
verbal, math and composite scores. <strong>The</strong> participation rates for minority<br />
students are at low levels relative to their representation in the high<br />
school population and the participation of white students.<br />
FINDINGS ON ACCOUNTABILITY<br />
Oregonians believe the responsibility for providing K-12 services should be<br />
close to home. When asked about the appropriate roles of various governing<br />
entities for everything from curriculum development and testing standards to<br />
funding levels and the length of the school year, Oregonians believed local<br />
actors—school boards, principals, teachers, and local taxpayers—should have a<br />
stronger role in decision-making than state- or federal-level policymakers.<br />
Despite this preference, Oregon K-12 policymaking has gradually shifted control<br />
away from the local level during the past 15 years. Below we outline our key<br />
findings on the nature of Oregon’s governance structure and its implications for<br />
system accountability.<br />
• Oregon’s K-12 governance structure has shifted from local to<br />
increased state control. <strong>The</strong> passage of local property tax limitations<br />
through Ballot Measure 5 in 1990 ushered in a change in K-12 finance<br />
and governance. Along with curbs in the growth of property tax<br />
revenues came a dramatic shift in the primary responsibility for funding<br />
public education from the local governments (school districts) to the<br />
state government. As the state assumed increasing responsibility for<br />
funding, the legislature and state-level agencies claimed a larger role in<br />
setting educational goals and standards. As a consequence, Oregon’s<br />
public school system has evolved from one of the most locally<br />
controlled in the nation to one with considerable state involvement and<br />
direction in a number of important areas.<br />
• Two policies opened an era of increased centralization of K-12<br />
policy. In the 1991, the Oregon legislature adopted two important<br />
policies that set the state on the course of greater impact on local<br />
educational practices. First, the Oregon Educational Act for the 21st<br />
Century established a new set of standards and assessments for student<br />
learning. Second, the enactment of a state-level funding formula<br />
equalized the amount of resources available per student after adjusting<br />
for certain special needs. In combination, these two measures<br />
constrained program and fiscal discretion, two of the hallmarks of local<br />
control.<br />
• Oregon implemented centralized policymaking with little<br />
coordination. Oregon made its transition to centralization with no<br />
Page 6 September 2004 ECONorthwest / CEPR <strong>Chalkboard</strong> <strong>Project</strong>
systematic examination or redesign of governance structures. Authority<br />
shifted within the system, with state-level entities (i.e., Oregon<br />
Department of Education, State Board of Education, and the Governor<br />
and Legislature) garnering a new level of influence while local<br />
authorities (i.e., school boards and school-level administrators and<br />
teachers) struggled to understand their role in this new, ill-defined<br />
system. While policymakers espoused support for local control, actions<br />
at the state level belied such support. Schools experienced the worst of<br />
both worlds in some respects, being on the receiving end of state policies<br />
that constrained local discretion while simultaneously being told that the<br />
goal of state policies was to give schools the flexibility to solve<br />
problems locally.<br />
• Absence of clearly defined state and local responsibilities has<br />
hindered progress on K-12 standards. <strong>The</strong> net effect of Oregon’s<br />
loosely coupled accountability system is that state policy goals do not<br />
necessarily get achieved. For example, the Oregon Educational Act for<br />
the 21st Century set ambitious goals for student learning. While progress<br />
has been made at the third grade level and to a lesser degree at the fifth<br />
grade level in English and math, in no way has achievement of the law’s<br />
original broad and ambitious goals been accomplished. <strong>The</strong> type of<br />
systemic redesign envisioned by authors of the act has yet to occur.<br />
FINDINGS ON FINANCE<br />
No feature of the Oregon K-12 system has captured more stakeholder and<br />
media interest in recent years than finance. <strong>The</strong> increased focus is due, in part, to<br />
the centralized nature of the finance decision, which today rests primarily with the<br />
state legislature. Moreover, during this most recent economic downturn, resources<br />
have been highly unstable, and in districts across the state, administrators have<br />
threatened and, in some cases delivered, shortened school years.<br />
Given Oregon’s centralized and highly charged debates about K-12 funding, it<br />
should come as no surprise that a recent statewide poll found funding issues<br />
topped Oregonians’ concerns about the K-12 system. While Oregonians tend to<br />
agree that funding is important, they disagree on whether the system has adequate<br />
resources to deliver a quality product. <strong>The</strong> recent <strong>Chalkboard</strong> poll found 52<br />
percent of Oregonians believed “public schools just do not have enough money”<br />
while 40 percent believed schools “did not have a funding problem”.<br />
To shed light on the finance debate, we evaluate the system with respect to its<br />
adequacy, stability, and equity. We outline our key findings below:<br />
• Oregon’s K-12 spending as a percent of total personal income<br />
declined throughout the 1990s and fell below the U.S. average in<br />
2002-03. (See Appendix, Section 12.) In the 1989-90 school year,<br />
Oregonians spent 4.8 percent of their total personal incomes on current<br />
<strong>Chalkboard</strong> <strong>Project</strong> ECONorthwest / CEPR September 2004 Page 7
K-12 expenditures—compared to U.S. average of 4.1 percent. Since<br />
then Oregon’s K-12 spending did not keep pace with personal income<br />
growth and, by 2002-03, K-12 spending equaled 4.0 percent of personal<br />
income—below the U.S. average (4.2 percent).<br />
• Throughout the state, growth in spending on special instruction 4<br />
significantly outpaced growth in spending on regular instruction.<br />
(See Appendix, Section 12.) During 1992-2000, spending per student<br />
(fall enrollment) on regular instruction grew at an annual average rate of<br />
2 percent, which is below the national rate of inflation. However,<br />
spending per student on special instructional programs--defined broadly<br />
in this report to include programs targeted to students with mental and<br />
physical disabilities, English language learners, and students at risk of<br />
dropping out of school--grew at an average annual rate of 14 percent. In<br />
1992, Oregon K-12 schools spent an average of $443 per fall enrollee<br />
(measured across all students regardless of whether they received such<br />
services) on special education programs. By 2000, the system spent<br />
$1,231 per student.<br />
• Oregon salaries and benefits measured on a per student basis are<br />
close to the national average; Salaries and benefits measured per<br />
full-time equivalent staff member are high relative to other states.<br />
(See Appendix, Section 13.) In school year 2001-02, Oregon spent $2.44<br />
billion and $1.02 billion on benefits for all staff in the K-12 system.<br />
Measured on a per student basis, Oregon spent $6,267 per student on<br />
salaries and benefits, almost identical to the national average of $6,272.<br />
However, as discussed previously, Oregon employs relatively few staff,<br />
which implies salaries and benefits per staff member are above average.<br />
Oregon’s salaries average $42,453 per full-time staff member, which<br />
ranked 14 th nationally. Benefit expenditures total $17,684 per full-time<br />
staff member, which ranked 1 st nationally and is 11 percent higher than<br />
second-place Wisconsin. Taken together, expenditures on the total<br />
compensation package average $60,137 per full-time employee, which<br />
ranked 8 th nationally.<br />
• Spending per student on instruction is slightly below the national<br />
average. (See Appendix, Section 14.) In 2001-02, Oregon spent $4,490<br />
per student or $265 less than the national average.<br />
• Spending per student on “other support services” is well above the<br />
national average. (See Appendix, Section 14.) Oregon spent $467 per<br />
student on other support services in 2001-02, which is well above the<br />
national average ($264 per student). Other support services include<br />
expenses for the business support staff, payroll, financial accounting,<br />
internal auditing, purchasing, and warehousing. <strong>The</strong> Oregon Secretary<br />
of State recently audited spending behavior in a number of districts<br />
across the state and recommended a variety of cost-cutting strategies<br />
Page 8 September 2004 ECONorthwest / CEPR <strong>Chalkboard</strong> <strong>Project</strong>
including bulk purchasing, seeking in-kind contributions and donations,<br />
and sharing the cost of certain specialized staff.<br />
• Spending per student has been highly unstable in recent school<br />
years. (See Appendix, Section 14.) Between the 2001-02 and 2002-03<br />
school years, Oregon’s spending per student fell 6.1 percent from $7,713<br />
to $7,242 (estimated). <strong>The</strong> estimated decline would not only be the<br />
largest percentage decline measured between those two years, it would<br />
also be the second largest annual decline measured by any state since the<br />
1989-90 school year. We estimate Oregon had the 9 th most volatile<br />
school finance system in the country (measured by year-to-year state<br />
level changes) since 1989-90. Again, much of the instability occurred<br />
during the most recent economic downturn. <strong>The</strong> K-12 system’s heavy<br />
reliance on Oregon’s income tax revenues underlies the problem.<br />
• Oregon’s state funding formula increased equity in spending per<br />
student across the state. (See Appendix, Section 14.) Together with<br />
the transfer of primary funding responsibility to the state came a policy<br />
to equalize resources available to students in different districts. At the<br />
end of a decade-long process, Oregon’s K-12 finance system has<br />
become one of the most equitable in the country. With equity come<br />
challenges, the greatest of which is a loss of local control over school<br />
resources. Taxpayers’ fiscal connections to their local schools<br />
increasingly run through the state legislature, so an individual school<br />
district’s interest in increasing resources is often tied to state-level<br />
approval of the K-12 budget.<br />
1 <strong>Summary</strong> Notes: Presentation on Oregon Teacher Supply/Demand at the Oregon Arts & Sciences Summit,<br />
4/25/02. Retrieved September 15, 2004 from http://www.ous.edu/aca/supplydemandnotes.htm.<br />
2 Ibid.<br />
3 As defined by the US Census.<br />
4 For the purposes of this estimate, we define special instruction to include programs designed for students<br />
with physical or mental disabilities, English-learning students, and students at risk of dropping out of high<br />
school.<br />
<strong>Chalkboard</strong> <strong>Project</strong> ECONorthwest / CEPR September 2004 Page 9