Physical Geography - Climate
Physical Geography - Climate
Physical Geography - Climate

Create successful ePaper yourself
Turn your PDF publications into a flip-book with our unique Google optimized e-Paper software.
Making Connections Textbook Assignment:<br />
<strong>Physical</strong> <strong>Geography</strong> - <strong>Climate</strong><br />
1) Read Chapter 13 in Making Connections. Check your understanding of this topic by<br />
defining the terms in bold letters that appear throughout this chapter. It is important<br />
to understand these terms in order to utilize them correctly throughout this unit of the<br />
course. If you would like an official definition for each term, they are listed in the<br />
glossary at the back of the textbook.<br />
2) There are six factors that affect climate (pages 145-153 in your text). Note the phrase<br />
LOWER Near Water which might help you remember them on a test or exam.<br />
a) Describe the effect of latitude on climate using Figure 13-2 on page 146.<br />
b) How do ocean currents affect climate What happens if a cold and a warm ocean<br />
current meet<br />
c) Using Figure 13-5 on page 149 for reference, explain how the prevailing winds<br />
affect climate.<br />
d) Elevation and relief are related, but affect different characteristics of climate.<br />
Elevation can be explained with the statement, “The __________________ you<br />
go, the _______________ it gets”.<br />
e) Using appropriate terminology from the relief section (pages 150-151), explain<br />
why it rains to much in Vancouver.<br />
f) “Bodies of water have a moderating effect on land temperatures.” Explain how<br />
this is accomplished.<br />
3) Name the three types of precipitation. In each case, something happens to a mass of<br />
moist air. What is it that happens What are the three different causes<br />
4) a) In which climate region do we live<br />
b) Describe the climate (not weather) of this region based on your own experiences.<br />
Use descriptive words instead of statistics (e.g., “winters are not very cold, but it rains a<br />
lot”).<br />
c) Look at the climate statistics for the city closest to you that is shown on page 157.<br />
Try to see how your climate experiences are reflected in the numerical data. Why does<br />
this only work well if you describe your climate, rather than your weather
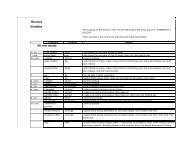
5) Fill in the chart below using the tips on page 156 and the climographs on page 157.<br />
Location<br />
Average<br />
Temp.(°C)<br />
Temp. Range<br />
(C°)<br />
Total Precip.(mm)<br />
Season of<br />
Maximum Precip.<br />
Continental or<br />
Maritime<br />
Moncton<br />
Timmins<br />
Resolut<br />
e<br />
Toronto<br />
Yellowkni<br />
fe<br />
Regina<br />
Prince<br />
George<br />
Vancouv<br />
er<br />
6) Fill in the last two lines of the chart above using the data below. In which climate<br />
region is each station located Explain how you reached your decision.<br />
STATION A Jan Feb Mar Apr May Jun July Aug. Sept Oct Nov Dec Yr<br />
Avg temp. (°C) -14 -11 -5 4 10 14 16 15 10 4 -6 -12 2.1<br />
Avg precip. (mm) 23 15 16 22 43 76 101 70 47 18 16 19 466<br />
STATION B Jan Feb Mar Apr May Jun July Aug. Sept Oct Nov Dec Yr<br />
Avg temp. (°C) -9 -8 -3 3 9 15 19 18 13 7 2 -6 5.0<br />
Avg precip. (mm) 120 96 117 101 91 93 103 81 81 106 114 126 1229