You also want an ePaper? Increase the reach of your titles
YUMPU automatically turns print PDFs into web optimized ePapers that Google loves.
2008<br />
<strong>Fact</strong> <strong>Book</strong>
Contents<br />
2 CCA at a Glance<br />
4 Australia<br />
6 New Zealand & Fiji<br />
8 Indonesia & PNG<br />
10 Food & Services<br />
12 Pacific Beverages Joint Venture<br />
13 Shareholder Information
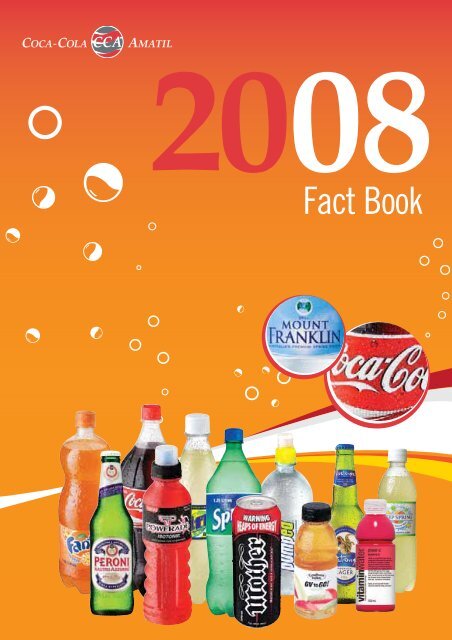
Welcome to the 2008 CCA <strong>Fact</strong> <strong>Book</strong><br />
CCA is one of the largest bottlers of non-alcoholic<br />
ready-to-drink beverages in the Asia-Pacific region and<br />
one of the six major <strong>Coca</strong>-<strong>Cola</strong> bottlers in the world.<br />
CCA’s diversified product portfolio includes carbonated soft<br />
drinks, water, sports and energy drinks, fruit juice, coffee<br />
and packaged ready-to-eat fruit and vegetable products.<br />
Pacific Beverages, CCA’s 50/50 joint venture with SABMiller,<br />
manufactures and markets a range of premium beers in<br />
Australia and New Zealand, and sells and distributes the<br />
premium spirits portfolio of Beam Global Wines and Spirits.<br />
CCA employs more than 15,000 people and has<br />
access to 265 million consumers through over<br />
700,000 active customers.<br />
265<br />
million<br />
consumers<br />
1
CCA at a Glance as at 31 December 2008<br />
Australia<br />
% of<br />
2008 Financial summary A$m CCA<br />
Trading revenue 2,491.8 61%<br />
EBIT 1 488.4 68%<br />
Net segment assets 2 1,174.2 34%<br />
CCA Market Share<br />
Carbonated beverages<br />
Key brands:<br />
Coke, Diet Coke, 56%<br />
Coke Zero<br />
Category growth<br />
(3 yrs): 0.3%<br />
Bottled water<br />
Key brands:<br />
Mt Franklin, Pump,<br />
Glaceau<br />
Category growth<br />
(3 yrs): 8.5%<br />
Sports<br />
Key brands:<br />
Powerade<br />
Category growth<br />
(3 yrs): 4.7%<br />
Juice<br />
Key brands:<br />
Goulburn Valley<br />
Category growth<br />
(3 yrs): -3.3%<br />
Energy<br />
Key brands:<br />
Mother<br />
Category growth<br />
(3 yrs): 44.7%<br />
27%<br />
47%<br />
1%<br />
12%<br />
Volume market share data relates to the grocery and convenience channel,<br />
non-alcoholic, ready-to-drink.<br />
New Zealand & Fiji<br />
% of<br />
2008 Financial summary A$m CCA<br />
Trading revenue 445.6 11%<br />
EBIT 1 83.4 12%<br />
Net segment assets 2 438.9 13%<br />
CCA Market Share (NZ)<br />
Carbonated beverages<br />
Key brands:<br />
Coke, Sprite, Fanta 74%<br />
Category growth<br />
(3 yrs): 2.5%<br />
Bottled water<br />
Key brands:<br />
Pump, Kiwi Blue<br />
Category growth<br />
(3 yrs): -0.4%<br />
Sports<br />
Key brands:<br />
Powerade, E2<br />
Category growth<br />
(3 yrs): 15.0%<br />
Juice<br />
Key brands:<br />
Keri<br />
Category growth<br />
(3 yrs): 1%<br />
Energy<br />
Key brands:<br />
Lift Plus, Relentless<br />
Category growth<br />
(3 yrs): 5.5%<br />
37%<br />
88%<br />
17%<br />
21%<br />
Volume market share data relates to the grocery and petroleum channels,<br />
non-alcoholic, ready-to-drink.<br />
2
Indonesia & PNG<br />
% of<br />
2008 Financial summary A$m CCA<br />
Trading revenue 577.8 14%<br />
EBIT 1 50.6 7%<br />
Net segment assets 2 326.6 9%<br />
CCA Market Share (Indonesia)<br />
Carbonated beverages<br />
Key brands:<br />
Sprite, Fanta, Coke 95%<br />
Category growth<br />
(3 yrs): 7.0%<br />
Food & Services<br />
% of<br />
2008 Financial summary A$m CCA<br />
Trading revenue 576.2 14%<br />
EBIT 1 90.8 13%<br />
Net segment assets 2 1,509.9 44%<br />
CCA Market Share (SPC Ardmona)<br />
Packaged fruit<br />
Key brands:<br />
Goulburn Valley, SPC<br />
Category growth<br />
(3 yrs): 0.4%<br />
57%<br />
Bottled water<br />
Key brands:<br />
Ades<br />
Category growth<br />
(3 yrs): 10.0%<br />
1%<br />
Fruit snacks<br />
Key brands:<br />
Goulburn Valley, SPC<br />
Category growth<br />
(3 yrs): 5.9%<br />
74%<br />
Sports<br />
Key brands:<br />
Powerade<br />
Category growth<br />
(3 yrs): 13.0%<br />
4%<br />
Tinned tomatoes<br />
Key brands:<br />
Ardmona, SPC<br />
Category growth<br />
(3 yrs): 6.8%<br />
34%<br />
Juice<br />
Key brands:<br />
Minute Maid<br />
Category growth<br />
(3 yrs): 13.0%<br />
Energy<br />
Key brands:<br />
EXTRAJOSS Strike<br />
Category growth<br />
(3 yrs): 8.0%<br />
RTD Tea<br />
Key brands:<br />
Frestea<br />
Category growth<br />
(3 yrs): 5.0%<br />
1%<br />
Australia (as at 31 December 2008)<br />
Key <strong>Fact</strong>s<br />
Australia<br />
Production facilities 9<br />
Production lines 38<br />
Warehouses 20<br />
Employees (FTE) 3,650<br />
Stock keeping units 529<br />
Number of coolers (approx) 111,000<br />
Number of customers (approx) 83,000<br />
Financials<br />
2004 2005 2006 2 2007 2008<br />
Revenue ($ million) 2041.6 2159.0 2198.9 2399.5 2491.8<br />
Volume (million unit cases) 322.9 322.0 310.4 318.6 315.1<br />
Revenue per unit case $6.32 $6.70 $7.08 $7.53 $7.91<br />
EBIT ($ million) 1 432.5 425.2 397.3 446.0 488.4<br />
EBIT margin 1 21.2% 19.7% 18.1% 18.6% 19.6%<br />
Capex to revenue 6.3% 7.9% 2.8% 5.4% 5.1%<br />
1 Pre-significant items<br />
2 Results exclude Neverfail, Quirks and Grinders businesses from 2006 following the formation of<br />
Food and Services segment.<br />
2041.6<br />
2159.0<br />
2198.9<br />
2399.5<br />
2491.8<br />
432.5<br />
425.2<br />
397.3<br />
446.0<br />
488.4<br />
04 05<br />
06 07 08<br />
Revenue $m<br />
04 05 06 07<br />
EBIT $m<br />
08<br />
Carbonated<br />
Beverages<br />
Bottled<br />
Water<br />
Sports<br />
Drinks<br />
4
Category Mix<br />
unit cases<br />
Package Mix<br />
unit cases<br />
Channel Mix<br />
unit cases<br />
Sugar CSDs (62%)<br />
Non-sugar CSDs (20%)<br />
Bottled water (12%)<br />
Sports (3%)<br />
Juice (1%)<br />
Energy (1%)<br />
Other (1%)<br />
PET (55%)<br />
Cans (27%)<br />
Fountain (15%)<br />
Other (3%)<br />
Supermarkets (51%)<br />
Convenience & Leisure (49%)<br />
Australian Beverage Market*<br />
unit cases<br />
CSDs (59%)<br />
Juice (23%)<br />
Bottled water (11%)<br />
Sports (2%)<br />
RTD Tea (1%)<br />
Energy (1%)<br />
Flavoured milk (0.4%)<br />
Other (2.6%)<br />
* Non-alcoholic, ready-to-drink<br />
Juice<br />
Energy<br />
Drinks<br />
Flavoured<br />
Milk<br />
5
New Zealand & Fiji (as at 31 December 2008)<br />
Key <strong>Fact</strong>s<br />
NZ Fiji<br />
Production facilities 5 1<br />
Production lines 13 4<br />
Warehouses 4 3<br />
Employees (FTE) 1,286 255<br />
Stock keeping units 411 133<br />
Number of coolers (approx) 26,000 4,200<br />
Number of customers (approx) 17,000 3,300<br />
Financials<br />
2004 2005 2006 2007 2008<br />
Revenue ($ million) 427.2 451.9 416.3 454.3 445.6<br />
Volume (million unit cases) 67.7 67.1 65.7 66.7 67.4<br />
Revenue per unit case $6.31 $6.73 $6.34 $6.81 $6.61<br />
EBIT ($ million) 81.9 70.8 65.1 77.8 83.4<br />
EBIT margin 19.2% 15.7% 15.6% 17.1% 18.7%<br />
Capex to revenue 5.4% 5.8% 14.0% 10.6% 8.0%<br />
427.2<br />
451.9<br />
416.3<br />
454.3<br />
445.6<br />
81.9<br />
70.8<br />
65.1<br />
77.8<br />
83.4<br />
04 05 06 07<br />
08<br />
04 0405<br />
06 07 08<br />
Revenue $m<br />
EBIT $m<br />
6<br />
Carbonated<br />
Beverages<br />
Juice
Category Mix<br />
New Zealand<br />
unit cases<br />
Package Mix<br />
New Zealand<br />
unit cases<br />
Channel Mix<br />
New Zealand<br />
unit cases<br />
Sugar CSDs (54%)<br />
Non-sugar CSDs (16%)<br />
Juice (10%)<br />
Bottled water (7%)<br />
Sports (4%)<br />
Energy (2%)<br />
Other (7%)<br />
PET (73%)<br />
Cans (11%)<br />
Fountain (12%)<br />
Other (4%)<br />
Supermarkets (56%)<br />
Convenience & Leisure (44%)<br />
New Zealand Beverage Market*<br />
unit cases<br />
CSDs (57%)<br />
Juice (24%)<br />
Bottled water (10%)<br />
Flavoured milk (3%)<br />
Energy (3%)<br />
Sports (3%)<br />
* Non-alcoholic, ready-to-drink<br />
Bottled<br />
Water<br />
Sports<br />
Drinks<br />
Energy<br />
Drinks<br />
7
Indonesia & PNG (as at 31 December 2008)<br />
Key <strong>Fact</strong>s<br />
Indonesia PNG<br />
Production facilities 10 1<br />
Production lines 33 6<br />
Warehouses 115 8<br />
Employees (FTE) 7,663 568<br />
Stock keeping units 118 92<br />
Number of coolers (approx) 126,000 10,600<br />
Number of customers (approx) 630,000 11,000<br />
Financials<br />
2004 2005 2006 2007 2008<br />
Revenue ($ million) 419.8 427.9 470.8 491.8 577.8<br />
Volume (million unit cases) 113.1 124.0 110.7 118.7 128.2<br />
Revenue per unit case $3.71 $3.45 $4.25 $4.14 $4.51<br />
EBIT ($ million) 32.4 41.6 17.6 36.8 50.6<br />
EBIT margin 7.7% 9.7% 3.7% 7.5% 8.8%<br />
Capex to revenue 6.1% 9.0% 8.2% 7.1% 10.1%<br />
17.6<br />
419.8<br />
577.8<br />
50.6<br />
427.9<br />
32.4<br />
470.8<br />
491.8<br />
41.6<br />
36.8<br />
04 05 06 07<br />
Revenue $m<br />
08<br />
04 05 06 07<br />
EBIT $m<br />
08<br />
One Way<br />
Packs<br />
(OWP)<br />
Returnable<br />
Glass Bottles<br />
(RGB)<br />
RTD<br />
Tea<br />
8
Category Mix<br />
Indonesia<br />
unit cases<br />
sDs<br />
Package Mix<br />
Indonesia<br />
unit cases<br />
Channel Mix<br />
Indonesia<br />
unit cases<br />
CSDs (78%)<br />
RTD Tea (16%)<br />
Bottled water (5%)<br />
Sports (1%)<br />
RGB (48%)<br />
PET (30%)<br />
Cans (19%)<br />
Fountain & Other (3%)<br />
Traditional (74%)<br />
Modern Foodstores (19%)<br />
HORECA (7%)<br />
ar<br />
Indonesian Beverage Market*<br />
unit cases<br />
Bottled water (61%)<br />
RTD Tea (13%)<br />
CSDs (9%)<br />
Energy (2%)<br />
Sports (4%)<br />
Juice (4%)<br />
Other (7%)<br />
* Non-alcoholic, ready-to-drink<br />
Sports<br />
Drinks<br />
Energy<br />
Drinks<br />
Water<br />
& Juice<br />
9
Food & Services (as at 31 December 2008)<br />
The Food & Services business includes SPC Ardmona, Neverfail, Quirks Refrigeration and Grinders Coffee.<br />
SPC Ardmona 2008 sales revenue is approximately 80% of total Food & Services sales revenue.<br />
Key <strong>Fact</strong>s<br />
SPC<br />
Ardmona<br />
Neverfail<br />
Quirks<br />
Grinders<br />
Production facilities 5 5 – 1<br />
Production lines 51 5 – 4<br />
Warehouses 4 6 – 4<br />
Employees (FTE) 1,048 264 160 74<br />
Stock keeping units<br />
– Domestic 1,389 5 – 1,115<br />
– International 769 – – –<br />
Financials<br />
2005 1<br />
10 Months 2006 2 2007 2008<br />
Revenue ($ million) 351.9 555.7 586.2 576.2<br />
EBIT ($ million) 3 42.2 82.8 87.0 90.8<br />
EBIT margin 3 12.0% 14.9% 14.8% 15.8%<br />
Capex to revenue 6.2% 18.8% 12.0% 9.7%<br />
1 Represents SPC Ardmona only<br />
2 Food & Services segment established from 2006<br />
3 Pre-significant items<br />
555.7<br />
586.2<br />
576.2<br />
351.9<br />
82.8<br />
87.0<br />
90.8<br />
42.2<br />
05 06 07<br />
08<br />
Revenue $m<br />
05 06 07<br />
EBIT $m<br />
08<br />
Packaged<br />
Fruit<br />
Tinned<br />
Tomatoes<br />
Baked Beans<br />
& Spaghetti<br />
10
Category Mix<br />
SPC Ardmona<br />
Box Quantities 1<br />
sDs<br />
Package Mix<br />
SPC Ardmona<br />
Box Quantities<br />
Channel Mix<br />
SPC Ardmona<br />
Box Quantities<br />
Packaged Fruit (37%)<br />
Tinned Tomatoes (14%)<br />
Baked Beans & Spaghetti (13%)<br />
Fruit Snacks (12%)<br />
Spreads (4%)<br />
Other (20%)<br />
Cans (61%)<br />
Plastic (25%)<br />
Glass (8%)<br />
Other (6%)<br />
Grocery Branded (36%)<br />
International (22%)<br />
Food Service (16%)<br />
Private Label (15%)<br />
Industrial (5%)<br />
Other (6%)<br />
Market Position<br />
SPC Ardmona<br />
Packaged Fruit 1<br />
Fruit Snacks 1<br />
Tinned Tomatoes 1<br />
Baked Beans & Spaghetti 2<br />
Spreads 2<br />
1. Canning industry standard, 825g can in a 24 can carton.<br />
Fruit<br />
Snacks<br />
Spreads<br />
Coffee &<br />
Water<br />
11
Pacific Beverages (as at 31 December 2008)<br />
Key <strong>Fact</strong>s<br />
Employees 363<br />
Beer SKUs 18<br />
Spirit & RTD SKUs 181<br />
Number of customers 24,000<br />
Category Mix<br />
unit cases<br />
Pacific Beverages is the 50:50 joint venture between<br />
<strong>Coca</strong>-<strong>Cola</strong> <strong>Amatil</strong> and SABMiller plc, one of the world's leading<br />
brewers, to manufacture and market premium beer in Australia<br />
and New Zealand. The major premium beer brands in the<br />
Pacific Beverages portfolio include Peroni Nastro Azzurro,<br />
Grolsch, Miller Genuine Draft, Miller Chill, Pilsner Urquell,<br />
Bluetongue and Bondi Blonde.<br />
Pacific Beverages also sells and distributes the premium<br />
spirits portfolio of Beam Global Wines and Spirits in<br />
Australia and manufactures Jim Beam and <strong>Cola</strong> in Australia<br />
and New Zealand. Major brands include Jim Beam, Canadian<br />
Club, Makers Mark, The Macallan, Highland Park and The<br />
Famous Grouse.<br />
Australian Alcoholic Beverage Market<br />
runit cases<br />
Alcoholic RTDs (70%)<br />
Beer (19%)<br />
Spirits (11%)<br />
Beer (69%)<br />
Wine (15%)<br />
RTDs/Cider (14%)<br />
Spirits (2%)<br />
12<br />
Beer<br />
Alcoholic<br />
RTDs<br />
Spirits
Senior Management<br />
Terry Davis - Age 51<br />
Group Managing Director<br />
Joined CCA in November 2001 after 14 years<br />
in the global wine industry<br />
Warwick White – Age 47<br />
Managing Director – Australasia<br />
24 years experience in the <strong>Coca</strong>-<strong>Cola</strong> System,<br />
rejoined CCA in November 2002<br />
Peter Kelly – Age 43<br />
Managing Director – Asia<br />
20 years experience in the <strong>Coca</strong>-<strong>Cola</strong> System,<br />
joined CCA in 1993<br />
George Adams – Age 42<br />
Managing Director – New Zealand & Fiji<br />
13 years experience in the <strong>Coca</strong>-<strong>Cola</strong> System,<br />
joined CCA in December 2003<br />
John Seward – Age 52<br />
Managing Director – Indonesia & PNG<br />
10 years experience in the <strong>Coca</strong>-<strong>Cola</strong> System,<br />
joined CCA in August 2004<br />
Steve Perkins – Age 53<br />
Managing Director (Acting) – Food & Services<br />
28 years in the <strong>Coca</strong>-<strong>Cola</strong> System, previously<br />
CFO – Food & Services<br />
Nessa O’Sullivan – Age 44<br />
Chief Financial Officer – Operations<br />
Joined CCA in May 2005<br />
Ken McKenzie – Age 58<br />
Chief Financial Officer – Statutory & Compliance<br />
Joined CCA in 1985<br />
13
Share Registry & Other Enquiries<br />
For enquiries about CCA shares:<br />
Link Market Services Limited<br />
Locked Bag A14<br />
Sydney South NSW 1235<br />
Ph: 61 2 8280 7121<br />
Fx: 61 2 9287 0303<br />
Email: registrars@linkmarketservices.com.au<br />
For enquiries about the operations<br />
of the Company:<br />
Investor Relations<br />
71 Macquarie Street<br />
Sydney NSW 2000<br />
Ph: 61 2 9259 6159<br />
Fx: 61 2 9259 6614<br />
Email: aus_investor_relations@anz.ccamatil.com<br />
For enquiries about American<br />
Depositary Receipts (ADR):<br />
The Bank of New York Mellon<br />
Shareowner Services<br />
P.O. Box 358016<br />
Pittsburgh, PA 15252-8016<br />
Toll Free (domestic): 1 888 BNYADRS<br />
International: 1 201 680 6825<br />
Email: shrrelations@bnymellon.com<br />
<strong>Coca</strong>-<strong>Cola</strong> <strong>Amatil</strong> Limited<br />
ABN: 26 004 139 397<br />
www.ccamatil.com


