Mise en page 1 - UniCredit Bank Slovakia as
Mise en page 1 - UniCredit Bank Slovakia as Mise en page 1 - UniCredit Bank Slovakia as
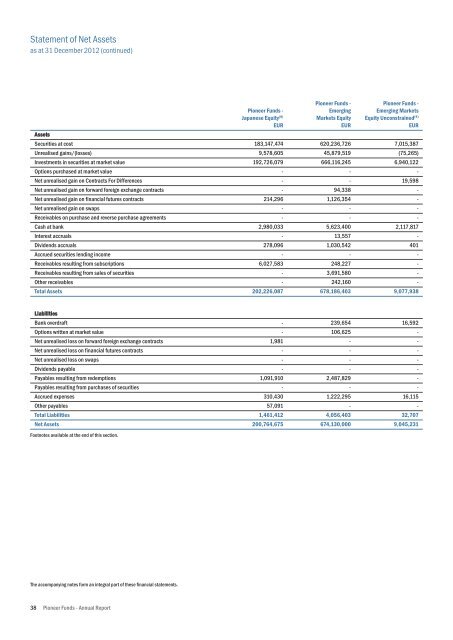
Statement of Net Assets as at 31 December 2012 (continued) Assets Securities at cost Unrealised gains/(losses) Investments in securities at market value Options purchased at market value Net unrealised gain on Contracts For Differences Net unrealised gain on forward foreign exchange contracts Net unrealised gain on financial futures contracts Net unrealised gain on swaps Receivables on purchase and reverse purchase agreements Cash at bank Interest accruals Dividends accruals Accrued securities lending income Receivables resulting from subscriptions Receivables resulting from sales of securities Other receivables Total Assets Pioneer Funds - Japanese Equity (8) EUR 183,147,474 9,578,605 192,726,079 - - - 214,296 - - 2,980,033 - 278,096 - 6,027,583 - - 202,226,087 Pioneer Funds - Emerging Markets Equity EUR 620,236,726 45,879,519 666,116,245 - - 94,338 1,126,354 - - 5,623,400 13,557 1,030,542 - 248,227 3,691,580 242,160 678,186,403 Pioneer Funds - Emerging Markets Equity Unconstrained (9) EUR 7,015,387 (75,265) 6,940,122 - 19,598 - - - - 2,117,817 - 401 - - - - 9,077,938 Liabilities Bank overdraft Options written at market value Net unrealised loss on forward foreign exchange contracts Net unrealised loss on financial futures contracts Net unrealised loss on swaps Dividends payable Payables resulting from redemptions Payables resulting from purchases of securities Accrued expenses Other payables Total Liabilities Net Assets - - 1,981 - - - 1,091,910 - 310,430 57,091 1,461,412 200,764,675 239,654 106,625 - - - - 2,487,829 - 1,222,295 - 4,056,403 674,130,000 16,592 - - - - - - - 16,115 - 32,707 9,045,231 Footnotes available at the end of this section. The accompanying notes form an integral part of these financial statements. 38 Pioneer Funds - Annual Report
Statement of Net Assets as at 31 December 2012 (continued) Assets Securities at cost Unrealised gains/(losses) Investments in securities at market value Options purchased at market value Net unrealised gain on Contracts For Differences Net unrealised gain on forward foreign exchange contracts Net unrealised gain on financial futures contracts Net unrealised gain on swaps Receivables on purchase and reverse purchase agreements Cash at bank Interest accruals Dividends accruals Accrued securities lending income Receivables resulting from subscriptions Receivables resulting from sales of securities Other receivables Total Assets Pioneer Funds - Emerging Europe and Mediterranean Equity EUR 453,814,916 48,602,986 502,417,902 - - - - - - 9,176,947 2,551 224,760 - 547,773 - - 512,369,933 Pioneer Funds - Asia (Ex. Japan) Equity EUR 104,281,898 6,308,401 110,590,299 - - - - - - 1,615,767 27 5,144 - 148,660 2,149,862 66,121 114,575,880 Pioneer Funds - Latin American Equity EUR 74,290,229 (2,718,069) 71,572,160 - - - - - - 222,397 16 315,191 - 28,384 327,616 - 72,465,764 Liabilities Bank overdraft Options written at market value Net unrealised loss on forward foreign exchange contracts Net unrealised loss on financial futures contracts Net unrealised loss on swaps Dividends payable Payables resulting from redemptions Payables resulting from purchases of securities Accrued expenses Other payables Total Liabilities Net Assets - - - - - - 1,167,333 - 947,589 556 2,115,478 510,254,455 4,193,360 - - - - - 1,455,827 - 231,160 5,069 5,885,416 108,690,464 48,381 - 50,006 - - - 95,896 - 155,295 323 349,901 72,115,863 The accompanying notes form an integral part of these financial statements. Pioneer Funds - Annual Report 39
- Page 1 and 2: Annual Report 31 December 2012 (Aud
- Page 3 and 4: Table of Contents Annual Commentary
- Page 5 and 6: Table of Contents Pioneer Funds - E
- Page 7 and 8: Table of Contents Pioneer Funds - L
- Page 9 and 10: Pioneer Funds Annual Report 2012 An
- Page 11 and 12: Pioneer Funds Annual Report 2012 An
- Page 13 and 14: Risk Disclosure (continued) Sub-Fun
- Page 15 and 16: Risk Disclosure (continued) Sub-Fun
- Page 17 and 18: Risk Disclosure (continued) Sub-Fun
- Page 19 and 20: Risk Disclosure (continued) Maximum
- Page 21 and 22: Statement of Net Assets as at 31 De
- Page 23 and 24: Statement of Net Assets as at 31 De
- Page 25 and 26: Statement of Net Assets as at 31 De
- Page 27 and 28: Statement of Net Assets as at 31 De
- Page 29 and 30: Statement of Net Assets as at 31 De
- Page 31 and 32: Statement of Net Assets as at 31 De
- Page 33 and 34: Statement of Net Assets as at 31 De
- Page 35 and 36: Statement of Net Assets as at 31 De
- Page 37 and 38: Statement of Net Assets as at 31 De
- Page 39: Statement of Net Assets as at 31 De
- Page 43 and 44: Statement of Net Assets as at 31 De
- Page 45 and 46: Statement of Operations and Changes
- Page 47 and 48: Statement of Operations and Changes
- Page 49 and 50: Statement of Operations and Changes
- Page 51 and 52: Statement of Operations and Changes
- Page 53 and 54: Statement of Operations and Changes
- Page 55 and 56: Statement of Operations and Changes
- Page 57 and 58: Statement of Operations and Changes
- Page 59 and 60: Statement of Operations and Changes
- Page 61 and 62: Statement of Operations and Changes
- Page 63 and 64: Statement of Operations and Changes
- Page 65 and 66: Statement of Operations and Changes
- Page 67 and 68: Statement of Unit Statistics as at
- Page 69 and 70: Statement of Unit Statistics as at
- Page 71 and 72: Statement of Unit Statistics as at
- Page 73 and 74: Statement of Unit Statistics as at
- Page 75 and 76: Statement of Unit Statistics as at
- Page 77 and 78: Statement of Unit Statistics as at
- Page 79 and 80: Statement of Unit Statistics as at
- Page 81 and 82: Statement of Unit Statistics as at
- Page 83 and 84: Statement of Unit Statistics as at
- Page 85 and 86: Statement of Unit Statistics as at
- Page 87 and 88: Statement of Unit Statistics as at
- Page 89 and 90: Statement of Unit Statistics as at
Statem<strong>en</strong>t of Net Assets<br />
<strong>as</strong> at 31 December 2012 (continued)<br />
Assets<br />
Securities at cost<br />
Unrealised gains/(losses)<br />
Investm<strong>en</strong>ts in securities at market value<br />
Options purch<strong>as</strong>ed at market value<br />
Net unrealised gain on Contracts For Differ<strong>en</strong>ces<br />
Net unrealised gain on forward foreign exchange contracts<br />
Net unrealised gain on financial futures contracts<br />
Net unrealised gain on swaps<br />
Receivables on purch<strong>as</strong>e and reverse purch<strong>as</strong>e agreem<strong>en</strong>ts<br />
C<strong>as</strong>h at bank<br />
Interest accruals<br />
Divid<strong>en</strong>ds accruals<br />
Accrued securities l<strong>en</strong>ding income<br />
Receivables resulting from subscriptions<br />
Receivables resulting from sales of securities<br />
Other receivables<br />
Total Assets<br />
Pioneer Funds -<br />
Japanese Equity (8)<br />
EUR<br />
183,147,474<br />
9,578,605<br />
192,726,079<br />
-<br />
-<br />
-<br />
214,296<br />
-<br />
-<br />
2,980,033<br />
-<br />
278,096<br />
-<br />
6,027,583<br />
-<br />
-<br />
202,226,087<br />
Pioneer Funds -<br />
Emerging<br />
Markets Equity<br />
EUR<br />
620,236,726<br />
45,879,519<br />
666,116,245<br />
-<br />
-<br />
94,338<br />
1,126,354<br />
-<br />
-<br />
5,623,400<br />
13,557<br />
1,030,542<br />
-<br />
248,227<br />
3,691,580<br />
242,160<br />
678,186,403<br />
Pioneer Funds -<br />
Emerging Markets<br />
Equity Unconstrained (9)<br />
EUR<br />
7,015,387<br />
(75,265)<br />
6,940,122<br />
-<br />
19,598<br />
-<br />
-<br />
-<br />
-<br />
2,117,817<br />
-<br />
401<br />
-<br />
-<br />
-<br />
-<br />
9,077,938<br />
Liabilities<br />
<strong>Bank</strong> overdraft<br />
Options writt<strong>en</strong> at market value<br />
Net unrealised loss on forward foreign exchange contracts<br />
Net unrealised loss on financial futures contracts<br />
Net unrealised loss on swaps<br />
Divid<strong>en</strong>ds payable<br />
Payables resulting from redemptions<br />
Payables resulting from purch<strong>as</strong>es of securities<br />
Accrued exp<strong>en</strong>ses<br />
Other payables<br />
Total Liabilities<br />
Net Assets<br />
-<br />
-<br />
1,981<br />
-<br />
-<br />
-<br />
1,091,910<br />
-<br />
310,430<br />
57,091<br />
1,461,412<br />
200,764,675<br />
239,654<br />
106,625<br />
-<br />
-<br />
-<br />
-<br />
2,487,829<br />
-<br />
1,222,295<br />
-<br />
4,056,403<br />
674,130,000<br />
16,592<br />
-<br />
-<br />
-<br />
-<br />
-<br />
-<br />
-<br />
16,115<br />
-<br />
32,707<br />
9,045,231<br />
Footnotes available at the <strong>en</strong>d of this section.<br />
The accompanying notes form an integral part of these financial statem<strong>en</strong>ts.<br />
38 Pioneer Funds - Annual Report


