Mise en page 1 - UniCredit Bank Slovakia as
Mise en page 1 - UniCredit Bank Slovakia as Mise en page 1 - UniCredit Bank Slovakia as
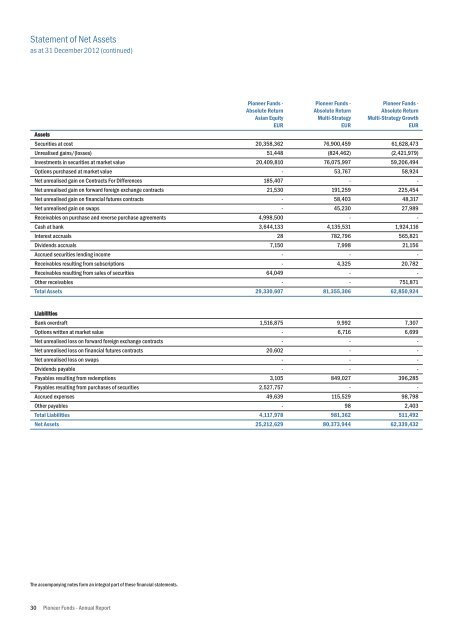
Statement of Net Assets as at 31 December 2012 (continued) Assets Securities at cost Unrealised gains/(losses) Investments in securities at market value Options purchased at market value Net unrealised gain on Contracts For Differences Net unrealised gain on forward foreign exchange contracts Net unrealised gain on financial futures contracts Net unrealised gain on swaps Receivables on purchase and reverse purchase agreements Cash at bank Interest accruals Dividends accruals Accrued securities lending income Receivables resulting from subscriptions Receivables resulting from sales of securities Other receivables Total Assets Pioneer Funds - Absolute Return Asian Equity EUR 20,358,362 51,448 20,409,810 - 185,407 21,530 - - 4,998,500 3,644,133 28 7,150 - - 64,049 - 29,330,607 Pioneer Funds - Absolute Return Multi-Strategy EUR 76,900,459 (824,462) 76,075,997 53,767 - 191,259 58,403 45,230 - 4,135,531 782,796 7,998 - 4,325 - - 81,355,306 Pioneer Funds - Absolute Return Multi-Strategy Growth EUR 61,628,473 (2,421,979) 59,206,494 58,924 - 225,454 48,317 27,989 - 1,924,116 565,821 21,156 - 20,782 - 751,871 62,850,924 Liabilities Bank overdraft Options written at market value Net unrealised loss on forward foreign exchange contracts Net unrealised loss on financial futures contracts Net unrealised loss on swaps Dividends payable Payables resulting from redemptions Payables resulting from purchases of securities Accrued expenses Other payables Total Liabilities Net Assets 1,516,875 - - 20,602 - - 3,105 2,527,757 49,639 - 4,117,978 25,212,629 9,992 6,716 - - - - 849,027 - 115,529 98 981,362 80,373,944 7,307 6,699 - - - - 396,285 - 98,798 2,403 511,492 62,339,432 The accompanying notes form an integral part of these financial statements. 30 Pioneer Funds - Annual Report
Statement of Net Assets as at 31 December 2012 (continued) Assets Securities at cost Unrealised gains/(losses) Investments in securities at market value Options purchased at market value Net unrealised gain on Contracts For Differences Net unrealised gain on forward foreign exchange contracts Net unrealised gain on financial futures contracts Net unrealised gain on swaps Receivables on purchase and reverse purchase agreements Cash at bank Interest accruals Dividends accruals Accrued securities lending income Receivables resulting from subscriptions Receivables resulting from sales of securities Other receivables Total Assets Pioneer Funds - Global Multi-Asset (5) EUR 99,328,090 4,825,367 104,153,457 - - - 127,565 - - 10,800,794 249,128 56,472 - 29,783 1,039,695 151 116,457,045 Pioneer Funds - Multi Asset Real Return EUR 22,293,340 1,696,553 23,989,893 25,154 - - 38,763 - - 5,305,634 100,543 14,093 - 5,466 26,779 - 29,506,325 Pioneer Funds - Euroland Equity EUR 891,632,688 91,206,180 982,838,868 - - - - - - 14,463,235 187 987,750 - 8,620,524 - 2 1,006,910,566 Liabilities Bank overdraft Options written at market value Net unrealised loss on forward foreign exchange contracts Net unrealised loss on financial futures contracts Net unrealised loss on swaps Dividends payable Payables resulting from redemptions Payables resulting from purchases of securities Accrued expenses Other payables Total Liabilities Net Assets 23,330 - 49,318 - - - 372,921 - 241,154 773 687,496 115,769,549 2,774,354 - 11,946 - - - 1,269 278,087 217,409 - 3,283,065 26,223,260 - - 233,629 - - - 985,656 - 1,349,281 6,188 2,574,754 1,004,335,812 Footnotes available at the end of this section. The accompanying notes form an integral part of these financial statements. Pioneer Funds - Annual Report 31
- Page 1 and 2: Annual Report 31 December 2012 (Aud
- Page 3 and 4: Table of Contents Annual Commentary
- Page 5 and 6: Table of Contents Pioneer Funds - E
- Page 7 and 8: Table of Contents Pioneer Funds - L
- Page 9 and 10: Pioneer Funds Annual Report 2012 An
- Page 11 and 12: Pioneer Funds Annual Report 2012 An
- Page 13 and 14: Risk Disclosure (continued) Sub-Fun
- Page 15 and 16: Risk Disclosure (continued) Sub-Fun
- Page 17 and 18: Risk Disclosure (continued) Sub-Fun
- Page 19 and 20: Risk Disclosure (continued) Maximum
- Page 21 and 22: Statement of Net Assets as at 31 De
- Page 23 and 24: Statement of Net Assets as at 31 De
- Page 25 and 26: Statement of Net Assets as at 31 De
- Page 27 and 28: Statement of Net Assets as at 31 De
- Page 29 and 30: Statement of Net Assets as at 31 De
- Page 31: Statement of Net Assets as at 31 De
- Page 35 and 36: Statement of Net Assets as at 31 De
- Page 37 and 38: Statement of Net Assets as at 31 De
- Page 39 and 40: Statement of Net Assets as at 31 De
- Page 41 and 42: Statement of Net Assets as at 31 De
- Page 43 and 44: Statement of Net Assets as at 31 De
- Page 45 and 46: Statement of Operations and Changes
- Page 47 and 48: Statement of Operations and Changes
- Page 49 and 50: Statement of Operations and Changes
- Page 51 and 52: Statement of Operations and Changes
- Page 53 and 54: Statement of Operations and Changes
- Page 55 and 56: Statement of Operations and Changes
- Page 57 and 58: Statement of Operations and Changes
- Page 59 and 60: Statement of Operations and Changes
- Page 61 and 62: Statement of Operations and Changes
- Page 63 and 64: Statement of Operations and Changes
- Page 65 and 66: Statement of Operations and Changes
- Page 67 and 68: Statement of Unit Statistics as at
- Page 69 and 70: Statement of Unit Statistics as at
- Page 71 and 72: Statement of Unit Statistics as at
- Page 73 and 74: Statement of Unit Statistics as at
- Page 75 and 76: Statement of Unit Statistics as at
- Page 77 and 78: Statement of Unit Statistics as at
- Page 79 and 80: Statement of Unit Statistics as at
- Page 81 and 82: Statement of Unit Statistics as at
Statem<strong>en</strong>t of Net Assets<br />
<strong>as</strong> at 31 December 2012 (continued)<br />
Assets<br />
Securities at cost<br />
Unrealised gains/(losses)<br />
Investm<strong>en</strong>ts in securities at market value<br />
Options purch<strong>as</strong>ed at market value<br />
Net unrealised gain on Contracts For Differ<strong>en</strong>ces<br />
Net unrealised gain on forward foreign exchange contracts<br />
Net unrealised gain on financial futures contracts<br />
Net unrealised gain on swaps<br />
Receivables on purch<strong>as</strong>e and reverse purch<strong>as</strong>e agreem<strong>en</strong>ts<br />
C<strong>as</strong>h at bank<br />
Interest accruals<br />
Divid<strong>en</strong>ds accruals<br />
Accrued securities l<strong>en</strong>ding income<br />
Receivables resulting from subscriptions<br />
Receivables resulting from sales of securities<br />
Other receivables<br />
Total Assets<br />
Pioneer Funds -<br />
Absolute Return<br />
Asian Equity<br />
EUR<br />
20,358,362<br />
51,448<br />
20,409,810<br />
-<br />
185,407<br />
21,530<br />
-<br />
-<br />
4,998,500<br />
3,644,133<br />
28<br />
7,150<br />
-<br />
-<br />
64,049<br />
-<br />
29,330,607<br />
Pioneer Funds -<br />
Absolute Return<br />
Multi-Strategy<br />
EUR<br />
76,900,459<br />
(824,462)<br />
76,075,997<br />
53,767<br />
-<br />
191,259<br />
58,403<br />
45,230<br />
-<br />
4,135,531<br />
782,796<br />
7,998<br />
-<br />
4,325<br />
-<br />
-<br />
81,355,306<br />
Pioneer Funds -<br />
Absolute Return<br />
Multi-Strategy Growth<br />
EUR<br />
61,628,473<br />
(2,421,979)<br />
59,206,494<br />
58,924<br />
-<br />
225,454<br />
48,317<br />
27,989<br />
-<br />
1,924,116<br />
565,821<br />
21,156<br />
-<br />
20,782<br />
-<br />
751,871<br />
62,850,924<br />
Liabilities<br />
<strong>Bank</strong> overdraft<br />
Options writt<strong>en</strong> at market value<br />
Net unrealised loss on forward foreign exchange contracts<br />
Net unrealised loss on financial futures contracts<br />
Net unrealised loss on swaps<br />
Divid<strong>en</strong>ds payable<br />
Payables resulting from redemptions<br />
Payables resulting from purch<strong>as</strong>es of securities<br />
Accrued exp<strong>en</strong>ses<br />
Other payables<br />
Total Liabilities<br />
Net Assets<br />
1,516,875<br />
-<br />
-<br />
20,602<br />
-<br />
-<br />
3,105<br />
2,527,757<br />
49,639<br />
-<br />
4,117,978<br />
25,212,629<br />
9,992<br />
6,716<br />
-<br />
-<br />
-<br />
-<br />
849,027<br />
-<br />
115,529<br />
98<br />
981,362<br />
80,373,944<br />
7,307<br />
6,699<br />
-<br />
-<br />
-<br />
-<br />
396,285<br />
-<br />
98,798<br />
2,403<br />
511,492<br />
62,339,432<br />
The accompanying notes form an integral part of these financial statem<strong>en</strong>ts.<br />
30 Pioneer Funds - Annual Report


