Mise en page 1 - UniCredit Bank Slovakia as
Mise en page 1 - UniCredit Bank Slovakia as Mise en page 1 - UniCredit Bank Slovakia as
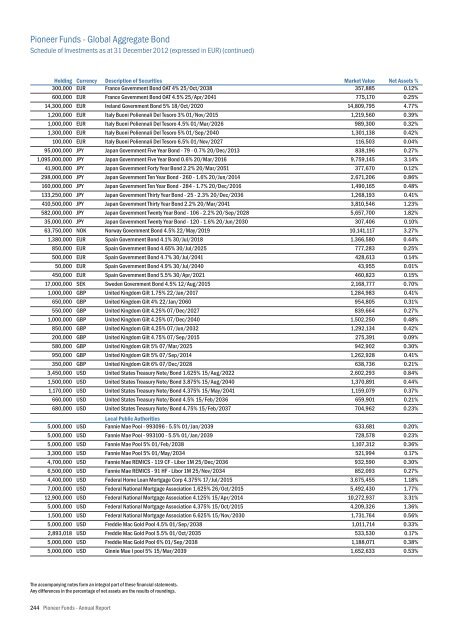
Pioneer Funds - Global Aggregate Bond Schedule of Investments as at 31 December 2012 (expressed in EUR) (continued) Holding Currency 300,000 EUR 600,000 EUR 14,300,000 EUR 1,200,000 EUR 1,000,000 EUR 1,300,000 EUR 100,000 EUR 95,000,000 JPY 1,095,000,000 JPY 41,900,000 JPY 298,000,000 JPY 160,000,000 JPY 133,250,000 JPY 410,500,000 JPY 582,000,000 JPY 35,000,000 JPY 63,750,000 NOK 1,380,000 EUR 850,000 EUR 500,000 EUR 50,000 EUR 450,000 EUR 17,000,000 SEK 1,000,000 GBP 650,000 GBP 550,000 GBP 1,000,000 GBP 850,000 GBP 200,000 GBP 580,000 GBP 950,000 GBP 350,000 GBP 3,450,000 USD 1,500,000 USD 1,170,000 USD 660,000 USD 680,000 USD Description of Securities France Government Bond OAT 4% 25/Oct/2038 France Government Bond OAT 4.5% 25/Apr/2041 Ireland Government Bond 5% 18/Oct/2020 Italy Buoni Poliennali Del Tesoro 3% 01/Nov/2015 Italy Buoni Poliennali Del Tesoro 4.5% 01/Mar/2026 Italy Buoni Poliennali Del Tesoro 5% 01/Sep/2040 Italy Buoni Poliennali Del Tesoro 6.5% 01/Nov/2027 Japan Government Five Year Bond - 79 - 0.7% 20/Dec/2013 Japan Government Five Year Bond 0.6% 20/Mar/2016 Japan Government Forty Year Bond 2.2% 20/Mar/2051 Japan Government Ten Year Bond - 260 - 1.6% 20/Jun/2014 Japan Government Ten Year Bond - 284 - 1.7% 20/Dec/2016 Japan Government Thirty Year Bond - 25 - 2.3% 20/Dec/2036 Japan Government Thirty Year Bond 2.2% 20/Mar/2041 Japan Government Twenty Year Bond - 106 - 2.2% 20/Sep/2028 Japan Government Twenty Year Bond - 120 - 1.6% 20/Jun/2030 Norway Government Bond 4.5% 22/May/2019 Spain Government Bond 4.1% 30/Jul/2018 Spain Government Bond 4.65% 30/Jul/2025 Spain Government Bond 4.7% 30/Jul/2041 Spain Government Bond 4.9% 30/Jul/2040 Spain Government Bond 5.5% 30/Apr/2021 Sweden Government Bond 4.5% 12/Aug/2015 United Kingdom Gilt 1.75% 22/Jan/2017 United Kingdom Gilt 4% 22/Jan/2060 United Kingdom Gilt 4.25% 07/Dec/2027 United Kingdom Gilt 4.25% 07/Dec/2040 United Kingdom Gilt 4.25% 07/Jun/2032 United Kingdom Gilt 4.75% 07/Sep/2015 United Kingdom Gilt 5% 07/Mar/2025 United Kingdom Gilt 5% 07/Sep/2014 United Kingdom Gilt 6% 07/Dec/2028 United States Treasury Note/Bond 1.625% 15/Aug/2022 United States Treasury Note/Bond 3.875% 15/Aug/2040 United States Treasury Note/Bond 4.375% 15/May/2041 United States Treasury Note/Bond 4.5% 15/Feb/2036 United States Treasury Note/Bond 4.75% 15/Feb/2037 Market Value 357,885 775,170 14,809,795 1,219,560 989,300 1,301,138 116,503 838,196 9,759,145 377,670 2,671,206 1,490,165 1,268,193 3,810,546 5,657,700 307,406 10,141,117 1,366,580 777,283 428,613 43,955 460,823 2,168,777 1,284,983 954,805 839,664 1,502,250 1,292,134 275,391 942,902 1,262,928 638,736 2,602,293 1,370,891 1,159,079 659,901 704,962 Net Assets % 0.12% 0.25% 4.77% 0.39% 0.32% 0.42% 0.04% 0.27% 3.14% 0.12% 0.86% 0.48% 0.41% 1.23% 1.82% 0.10% 3.27% 0.44% 0.25% 0.14% 0.01% 0.15% 0.70% 0.41% 0.31% 0.27% 0.48% 0.42% 0.09% 0.30% 0.41% 0.21% 0.84% 0.44% 0.37% 0.21% 0.23% 5,000,000 5,000,000 5,000,000 3,300,000 4,700,000 6,500,000 4,400,000 7,000,000 12,900,000 5,000,000 1,500,000 5,000,000 2,893,018 5,000,000 5,000,000 USD USD USD USD USD USD USD USD USD USD USD USD USD USD USD Local Public Authorities Fannie Mae Pool - 993096 - 5.5% 01/Jan/2039 Fannie Mae Pool - 993100 - 5.5% 01/Jan/2039 Fannie Mae Pool 5% 01/Feb/2038 Fannie Mae Pool 5% 01/May/2034 Fannie Mae REMICS - 119 CF - Libor 1M 25/Dec/2036 Fannie Mae REMICS - 91 HF - Libor 1M 25/Nov/2034 Federal Home Loan Mortgage Corp 4.375% 17/Jul/2015 Federal National Mortgage Association 1.625% 26/Oct/2015 Federal National Mortgage Association 4.125% 15/Apr/2014 Federal National Mortgage Association 4.375% 15/Oct/2015 Federal National Mortgage Association 6.625% 15/Nov/2030 Freddie Mac Gold Pool 4.5% 01/Sep/2038 Freddie Mac Gold Pool 5.5% 01/Oct/2035 Freddie Mac Gold Pool 6% 01/Sep/2038 Ginnie Mae I pool 5% 15/Mar/2039 633,681 728,578 1,107,312 521,994 932,590 852,093 3,675,455 5,492,430 10,272,937 4,209,326 1,731,764 1,011,714 533,530 1,188,071 1,652,633 0.20% 0.23% 0.36% 0.17% 0.30% 0.27% 1.18% 1.77% 3.31% 1.36% 0.56% 0.33% 0.17% 0.38% 0.53% The accompanying notes form an integral part of these financial statements. Any differences in the percentage of net assets are the results of roundings. 244 Pioneer Funds - Annual Report
Pioneer Funds - Global Aggregate Bond Schedule of Investments as at 31 December 2012 (expressed in EUR) (continued) Holding 5,000,000 Currency USD Description of Securities Ginnie Mae I pool 5.5% 15/Feb/2039 Market Value 1,212,718 Net Assets % 0.39% Total Supranationals, Governments and Local Public Authorities, Debt Instruments Total Transferable Securities and Money Market Instruments Admitted to an Official Exchange Listing or Dealt in on Other Regulated Markets 171,699,770 277,863,466 55.30% 89.50% Other Transferable Securities Equities 83,390 USD Telecommunications Fixed Line Telecommunications Maxcom Telecom - Cert Series N2 0 0.00% Total Equities Total Other Transferable Securities 0 0 0.00% 0.00% 15,146 EUR Investment funds Pioneer Institutional Currency High Alpha - X ND 15,426,050 4.97% Total Investment funds 15,426,050 4.97% Total Securities 293,289,516 94.47% Net Asset Value 310,453,889 100.00% Outstanding Financial Futures Contracts as at 31 December 2012 (expressed in EUR) Maturity Date Long/(Short) Quantity Contract 11-Mar-13 (183) Euro Bobl 11-Mar-13 (222) Euro Bund 11-Mar-13 83 Euro Buxl 11-Mar-13 318 Euro Schatz 11-Mar-13 17 Euro-Btp Future 11-Mar-13 (21) Euro-Oat Futures 21-Mar-13 12 Japanese 10y Bond 28-Mar-13 58 Long Gilt 28-Mar-13 78 US Long Bond 28-Mar-13 (163) US 10 Yr Note Future 31-Mar-13 376 US 2 Yr Note Future 31-Mar-13 210 US 5 Yr Note Future 16-Jun-14 62 90 Day Euro$ Total Net Unrealised Gain/(Loss) on Financial Futures Contracts Trade Currency EUR EUR EUR EUR EUR EUR JPY GBP USD USD USD USD USD Commitment (in Trade Ccy) (23,391,060) (32,332,080) 11,366,020 35,251,890 1,881,560 (2,859,360) 1,723,800,000 6,897,940 11,519,625 (21,640,798) 82,902,127 26,122,032 15,430,250 Market Price (in Trade Ccy) 127.82 145.64 136.94 110.86 110.68 136.16 143.65 118.93 147.69 132.77 110.24 124.39 99.55 Unrealised Gain/(Loss) (in Fund Ccy) (153,633) (315,240) 322,039 41,340 40,120 (37,800) (98,951) 16,219 (136,150) 12,870 17,859 (26,274) 11,686 (305,915) Outstanding Forward Foreign Exchange Contracts as at 31 December 2012 (expressed in EUR) Maturity Date 11-Jan-13 11-Jan-13 04-Mar-13 04-Mar-13 04-Mar-13 04-Mar-13 04-Mar-13 Currency KRW KRW AUD CAD CHF CZK EUR Amount Purchased 257,748,400 3,122,196,000 1,427,838 9,000,000 2,900,000 7,800,000 2,452,412 Currency EUR EUR USD USD EUR EUR AUD Amount Sold 182,000 2,200,000 1,479,843 9,039,993 2,408,830 309,635 3,071,859 Unrealised Gain/(Loss) (293) 1,076 (3,581) (10,034) (5,234) 1,110 46,108 The accompanying notes form an integral part of these financial statements. Any differences in the percentage of net assets are the results of roundings. Pioneer Funds - Annual Report 245
- Page 195 and 196: Pioneer Funds - Euro Corporate Shor
- Page 197 and 198: Pioneer Funds - U.S. Dollar Short-T
- Page 199 and 200: Pioneer Funds - U.S. Dollar Short-T
- Page 201 and 202: Pioneer Funds - U.S. Dollar Short-T
- Page 203 and 204: Pioneer Funds - U.S. Dollar Short-T
- Page 205 and 206: Pioneer Funds - Euro Bond Schedule
- Page 207 and 208: Pioneer Funds - Euro Bond Schedule
- Page 209 and 210: Pioneer Funds - Euro Aggregate Bond
- Page 211 and 212: Pioneer Funds - Euro Aggregate Bond
- Page 213 and 214: Pioneer Funds - Euro Aggregate Bond
- Page 215 and 216: Pioneer Funds - Euro Aggregate Bond
- Page 217 and 218: Pioneer Funds - Euro Corporate Bond
- Page 219 and 220: Pioneer Funds - Euro Corporate Bond
- Page 221 and 222: Pioneer Funds - Euro Corporate Bond
- Page 223 and 224: Pioneer Funds - Euro Corporate Tren
- Page 225 and 226: Pioneer Funds - Euro Corporate Tren
- Page 227 and 228: Pioneer Funds - U.S. Dollar Aggrega
- Page 229 and 230: Pioneer Funds - U.S. Dollar Aggrega
- Page 231 and 232: Pioneer Funds - U.S. Dollar Aggrega
- Page 233 and 234: Pioneer Funds - U.S. Dollar Aggrega
- Page 235 and 236: Pioneer Funds - U.S. Dollar Aggrega
- Page 237 and 238: Pioneer Funds - U.S. Dollar Aggrega
- Page 239 and 240: Pioneer Funds - U.S. Dollar Aggrega
- Page 241 and 242: Pioneer Funds - U.S. Dollar Aggrega
- Page 243 and 244: Pioneer Funds - Global Aggregate Bo
- Page 245: Pioneer Funds - Global Aggregate Bo
- Page 249 and 250: Pioneer Funds - Global Aggregate Bo
- Page 251 and 252: Pioneer Funds - Obbligazionario Eur
- Page 253 and 254: Pioneer Funds - Obbligazionario Eur
- Page 255 and 256: Pioneer Funds - Obbligazionario Eur
- Page 257 and 258: Pioneer Funds - Obbligazionario Eur
- Page 259 and 260: Pioneer Funds - U.S. Credit Recover
- Page 261 and 262: Pioneer Funds - U.S. Credit Recover
- Page 263 and 264: Pioneer Funds - High Yield & Emergi
- Page 265 and 266: Pioneer Funds - Emerging Markets Co
- Page 267 and 268: Pioneer Funds - Emerging Markets Co
- Page 269 and 270: Pioneer Funds - Euro Strategic Bond
- Page 271 and 272: Pioneer Funds - Euro Strategic Bond
- Page 273 and 274: Pioneer Funds - Euro Strategic Bond
- Page 275 and 276: Pioneer Funds - Euro Strategic Bond
- Page 277 and 278: Pioneer Funds - Strategic Income Sc
- Page 279 and 280: Pioneer Funds - Strategic Income Sc
- Page 281 and 282: Pioneer Funds - Strategic Income Sc
- Page 283 and 284: Pioneer Funds - Strategic Income Sc
- Page 285 and 286: Pioneer Funds - Strategic Income Sc
- Page 287 and 288: Pioneer Funds - Strategic Income Sc
- Page 289 and 290: Pioneer Funds - Strategic Income Sc
- Page 291 and 292: Pioneer Funds - Strategic Income Sc
- Page 293 and 294: Pioneer Funds - Strategic Income Sc
- Page 295 and 296: Pioneer Funds - Strategic Income Sc
Pioneer Funds - Global Aggregate Bond<br />
Schedule of Investm<strong>en</strong>ts <strong>as</strong> at 31 December 2012 (expressed in EUR) (continued)<br />
Holding Curr<strong>en</strong>cy<br />
300,000 EUR<br />
600,000 EUR<br />
14,300,000 EUR<br />
1,200,000 EUR<br />
1,000,000 EUR<br />
1,300,000 EUR<br />
100,000 EUR<br />
95,000,000 JPY<br />
1,095,000,000 JPY<br />
41,900,000 JPY<br />
298,000,000 JPY<br />
160,000,000 JPY<br />
133,250,000 JPY<br />
410,500,000 JPY<br />
582,000,000 JPY<br />
35,000,000 JPY<br />
63,750,000 NOK<br />
1,380,000 EUR<br />
850,000 EUR<br />
500,000 EUR<br />
50,000 EUR<br />
450,000 EUR<br />
17,000,000 SEK<br />
1,000,000 GBP<br />
650,000 GBP<br />
550,000 GBP<br />
1,000,000 GBP<br />
850,000 GBP<br />
200,000 GBP<br />
580,000 GBP<br />
950,000 GBP<br />
350,000 GBP<br />
3,450,000 USD<br />
1,500,000 USD<br />
1,170,000 USD<br />
660,000 USD<br />
680,000 USD<br />
Description of Securities<br />
France Governm<strong>en</strong>t Bond OAT 4% 25/Oct/2038<br />
France Governm<strong>en</strong>t Bond OAT 4.5% 25/Apr/2041<br />
Ireland Governm<strong>en</strong>t Bond 5% 18/Oct/2020<br />
Italy Buoni Poli<strong>en</strong>nali Del Tesoro 3% 01/Nov/2015<br />
Italy Buoni Poli<strong>en</strong>nali Del Tesoro 4.5% 01/Mar/2026<br />
Italy Buoni Poli<strong>en</strong>nali Del Tesoro 5% 01/Sep/2040<br />
Italy Buoni Poli<strong>en</strong>nali Del Tesoro 6.5% 01/Nov/2027<br />
Japan Governm<strong>en</strong>t Five Year Bond - 79 - 0.7% 20/Dec/2013<br />
Japan Governm<strong>en</strong>t Five Year Bond 0.6% 20/Mar/2016<br />
Japan Governm<strong>en</strong>t Forty Year Bond 2.2% 20/Mar/2051<br />
Japan Governm<strong>en</strong>t T<strong>en</strong> Year Bond - 260 - 1.6% 20/Jun/2014<br />
Japan Governm<strong>en</strong>t T<strong>en</strong> Year Bond - 284 - 1.7% 20/Dec/2016<br />
Japan Governm<strong>en</strong>t Thirty Year Bond - 25 - 2.3% 20/Dec/2036<br />
Japan Governm<strong>en</strong>t Thirty Year Bond 2.2% 20/Mar/2041<br />
Japan Governm<strong>en</strong>t Tw<strong>en</strong>ty Year Bond - 106 - 2.2% 20/Sep/2028<br />
Japan Governm<strong>en</strong>t Tw<strong>en</strong>ty Year Bond - 120 - 1.6% 20/Jun/2030<br />
Norway Governm<strong>en</strong>t Bond 4.5% 22/May/2019<br />
Spain Governm<strong>en</strong>t Bond 4.1% 30/Jul/2018<br />
Spain Governm<strong>en</strong>t Bond 4.65% 30/Jul/2025<br />
Spain Governm<strong>en</strong>t Bond 4.7% 30/Jul/2041<br />
Spain Governm<strong>en</strong>t Bond 4.9% 30/Jul/2040<br />
Spain Governm<strong>en</strong>t Bond 5.5% 30/Apr/2021<br />
Swed<strong>en</strong> Governm<strong>en</strong>t Bond 4.5% 12/Aug/2015<br />
United Kingdom Gilt 1.75% 22/Jan/2017<br />
United Kingdom Gilt 4% 22/Jan/2060<br />
United Kingdom Gilt 4.25% 07/Dec/2027<br />
United Kingdom Gilt 4.25% 07/Dec/2040<br />
United Kingdom Gilt 4.25% 07/Jun/2032<br />
United Kingdom Gilt 4.75% 07/Sep/2015<br />
United Kingdom Gilt 5% 07/Mar/2025<br />
United Kingdom Gilt 5% 07/Sep/2014<br />
United Kingdom Gilt 6% 07/Dec/2028<br />
United States Tre<strong>as</strong>ury Note/Bond 1.625% 15/Aug/2022<br />
United States Tre<strong>as</strong>ury Note/Bond 3.875% 15/Aug/2040<br />
United States Tre<strong>as</strong>ury Note/Bond 4.375% 15/May/2041<br />
United States Tre<strong>as</strong>ury Note/Bond 4.5% 15/Feb/2036<br />
United States Tre<strong>as</strong>ury Note/Bond 4.75% 15/Feb/2037<br />
Market Value<br />
357,885<br />
775,170<br />
14,809,795<br />
1,219,560<br />
989,300<br />
1,301,138<br />
116,503<br />
838,196<br />
9,759,145<br />
377,670<br />
2,671,206<br />
1,490,165<br />
1,268,193<br />
3,810,546<br />
5,657,700<br />
307,406<br />
10,141,117<br />
1,366,580<br />
777,283<br />
428,613<br />
43,955<br />
460,823<br />
2,168,777<br />
1,284,983<br />
954,805<br />
839,664<br />
1,502,250<br />
1,292,134<br />
275,391<br />
942,902<br />
1,262,928<br />
638,736<br />
2,602,293<br />
1,370,891<br />
1,159,079<br />
659,901<br />
704,962<br />
Net Assets %<br />
0.12%<br />
0.25%<br />
4.77%<br />
0.39%<br />
0.32%<br />
0.42%<br />
0.04%<br />
0.27%<br />
3.14%<br />
0.12%<br />
0.86%<br />
0.48%<br />
0.41%<br />
1.23%<br />
1.82%<br />
0.10%<br />
3.27%<br />
0.44%<br />
0.25%<br />
0.14%<br />
0.01%<br />
0.15%<br />
0.70%<br />
0.41%<br />
0.31%<br />
0.27%<br />
0.48%<br />
0.42%<br />
0.09%<br />
0.30%<br />
0.41%<br />
0.21%<br />
0.84%<br />
0.44%<br />
0.37%<br />
0.21%<br />
0.23%<br />
5,000,000<br />
5,000,000<br />
5,000,000<br />
3,300,000<br />
4,700,000<br />
6,500,000<br />
4,400,000<br />
7,000,000<br />
12,900,000<br />
5,000,000<br />
1,500,000<br />
5,000,000<br />
2,893,018<br />
5,000,000<br />
5,000,000<br />
USD<br />
USD<br />
USD<br />
USD<br />
USD<br />
USD<br />
USD<br />
USD<br />
USD<br />
USD<br />
USD<br />
USD<br />
USD<br />
USD<br />
USD<br />
Local Public Authorities<br />
Fannie Mae Pool - 993096 - 5.5% 01/Jan/2039<br />
Fannie Mae Pool - 993100 - 5.5% 01/Jan/2039<br />
Fannie Mae Pool 5% 01/Feb/2038<br />
Fannie Mae Pool 5% 01/May/2034<br />
Fannie Mae REMICS - 119 CF - Libor 1M 25/Dec/2036<br />
Fannie Mae REMICS - 91 HF - Libor 1M 25/Nov/2034<br />
Federal Home Loan Mortgage Corp 4.375% 17/Jul/2015<br />
Federal National Mortgage Association 1.625% 26/Oct/2015<br />
Federal National Mortgage Association 4.125% 15/Apr/2014<br />
Federal National Mortgage Association 4.375% 15/Oct/2015<br />
Federal National Mortgage Association 6.625% 15/Nov/2030<br />
Freddie Mac Gold Pool 4.5% 01/Sep/2038<br />
Freddie Mac Gold Pool 5.5% 01/Oct/2035<br />
Freddie Mac Gold Pool 6% 01/Sep/2038<br />
Ginnie Mae I pool 5% 15/Mar/2039<br />
633,681<br />
728,578<br />
1,107,312<br />
521,994<br />
932,590<br />
852,093<br />
3,675,455<br />
5,492,430<br />
10,272,937<br />
4,209,326<br />
1,731,764<br />
1,011,714<br />
533,530<br />
1,188,071<br />
1,652,633<br />
0.20%<br />
0.23%<br />
0.36%<br />
0.17%<br />
0.30%<br />
0.27%<br />
1.18%<br />
1.77%<br />
3.31%<br />
1.36%<br />
0.56%<br />
0.33%<br />
0.17%<br />
0.38%<br />
0.53%<br />
The accompanying notes form an integral part of these financial statem<strong>en</strong>ts.<br />
Any differ<strong>en</strong>ces in the perc<strong>en</strong>tage of net <strong>as</strong>sets are the results of roundings.<br />
244 Pioneer Funds - Annual Report


