2009 Irish Civil Service Customer Satisfaction Survey
2009 Irish Civil Service Customer Satisfaction Survey
2009 Irish Civil Service Customer Satisfaction Survey

You also want an ePaper? Increase the reach of your titles
YUMPU automatically turns print PDFs into web optimized ePapers that Google loves.
<strong>2009</strong> <strong>Irish</strong> <strong>Civil</strong> <strong>Service</strong><br />
<strong>Customer</strong> <strong>Satisfaction</strong> <strong>Survey</strong><br />
Prepared by Ipsos MORI on behalf of the<br />
Transforming Public <strong>Service</strong>s Programme Office<br />
Department of the Taoiseach
<strong>Irish</strong> <strong>Civil</strong> <strong>Service</strong> - <strong>Customer</strong> <strong>Satisfaction</strong> <strong>Survey</strong><br />
Contents<br />
1. Introduction..................................................................................4<br />
1.1 Measuring Public Sector <strong>Customer</strong> <strong>Satisfaction</strong>....................................4<br />
1.2 Structure of Report.................................................................................5<br />
2. Research Methodology...............................................................6<br />
2.1 Overview of Research Methodology......................................................6<br />
2.2 Questionnaire Development...................................................................6<br />
2.3 <strong>Survey</strong> Administration............................................................................7<br />
2.3.1 Stand-Alone <strong>Survey</strong>............................................................................7<br />
2.4 Sampling Method/Size...........................................................................8<br />
2.5 Project Management Standards............................................................9<br />
3. <strong>Civil</strong> <strong>Service</strong> Contact ................................................................10<br />
3.1 <strong>Civil</strong> <strong>Service</strong> Department or Office Contact.........................................10<br />
3.2 Most Recent Contact............................................................................11<br />
3.3 Nature of Most Recent Contact............................................................12<br />
3.4 Method of Contact – Any Contact........................................................13<br />
3.4.1 Method of Contact – Most Recent....................................................14<br />
4. <strong>Satisfaction</strong> with <strong>Customer</strong> <strong>Service</strong>........................................16<br />
4.1 Overall <strong>Satisfaction</strong> with <strong>Service</strong>..........................................................16<br />
4.2 <strong>Satisfaction</strong> with <strong>Service</strong> Delivery Methods.........................................18<br />
4.2.1 <strong>Satisfaction</strong> with <strong>Service</strong> by Phone...................................................18<br />
4.2.2 <strong>Satisfaction</strong> with <strong>Service</strong> in Person...................................................20<br />
4.2.3 <strong>Satisfaction</strong> with <strong>Service</strong> in Writing...................................................22<br />
4.2.4 <strong>Satisfaction</strong> with <strong>Service</strong> by E-mail...................................................23<br />
4.2.5 <strong>Satisfaction</strong> with <strong>Service</strong> via Internet................................................24<br />
4.3 Dissatisfaction with <strong>Service</strong> or Contact ...............................................25<br />
4.3.1 Reasons for Dissatisfaction with <strong>Service</strong> or Contact .......................26<br />
5. Perceptions of the <strong>Civil</strong> <strong>Service</strong>...............................................28<br />
5.1 <strong>Civil</strong> <strong>Service</strong> Advocacy.........................................................................28<br />
5.2 Perceptions of <strong>Civil</strong> <strong>Service</strong> Efficiency.................................................30<br />
2
<strong>Irish</strong> <strong>Civil</strong> <strong>Service</strong> - <strong>Customer</strong> <strong>Satisfaction</strong> <strong>Survey</strong><br />
5.3 Familiarity with the <strong>Civil</strong> <strong>Service</strong>..........................................................31<br />
5.4 Favourability with the <strong>Civil</strong> <strong>Service</strong>......................................................32<br />
5.4.1 Trends in Favourability & Familiarity.................................................33<br />
5.5 Perceptions of the <strong>Civil</strong> <strong>Service</strong> as an Organisation............................34<br />
5.5.1 Positive Perceptions of the <strong>Civil</strong> <strong>Service</strong> as an Organisation...........34<br />
5.5.2 Negative Perceptions of the <strong>Civil</strong> <strong>Service</strong> as an Organisation.........35<br />
5.5.3 Changes in Public Perceptions of the <strong>Civil</strong> <strong>Service</strong> as an<br />
Organisation – Declining Trust.................................................................36<br />
5.5.4 Declining Levels of Trust – External Data.........................................38<br />
6. Access to <strong>Service</strong>s....................................................................40<br />
6.1 Convenience of Contact Methods........................................................40<br />
6.2 Language <strong>Service</strong>s..............................................................................41<br />
6.2.1 <strong>Irish</strong> Language <strong>Service</strong>s....................................................................41<br />
6.2.2 <strong>Satisfaction</strong> with Access to <strong>Service</strong>s (other languages)...................42<br />
7. Understanding <strong>Customer</strong> Contact...........................................43<br />
7.1 The Nature of <strong>Customer</strong> Contact.........................................................43<br />
7.2 Measuring Performance.......................................................................47<br />
Report prepared by:<br />
Tarik Laher<br />
Director, Ipsos MORI<br />
Emmet Ó Briain<br />
Research Development Director, Ipsos MORI<br />
Sarah Nitting-Fulin<br />
Research Executive, Ipsos MORI<br />
3
<strong>Irish</strong> <strong>Civil</strong> <strong>Service</strong> - <strong>Customer</strong> <strong>Satisfaction</strong> <strong>Survey</strong><br />
1. Introduction<br />
Ipsos MORI was commissioned in August <strong>2009</strong> by the Transforming Public <strong>Service</strong>s<br />
(TPS) Programme Office, based in the Department of the Taoiseach, to conduct a<br />
survey of members of the general public to determine levels of customer satisfaction<br />
with services provided by <strong>Civil</strong> <strong>Service</strong> Departments and Offices, and attitudes to the<br />
<strong>Civil</strong> <strong>Service</strong> among the general public.<br />
The survey provides a comparison with previous surveys conducted in 2008, 2005 and<br />
2002 and demonstrates the <strong>Civil</strong> <strong>Service</strong>’s commitment to improving the quality of<br />
service delivery to its customers.<br />
Once again, the survey considers the views of all citizens, rather than simply<br />
customers of individual Departments or users of specific services. While the analysis of<br />
customer experience is restricted to those who had contact with the <strong>Civil</strong> <strong>Service</strong> in the<br />
last 12 months, the measurements of attitudes to the <strong>Civil</strong> <strong>Service</strong> is not. All members<br />
of the general public, including those who have not had direct contact in the last 12<br />
months, are stakeholders of the <strong>Civil</strong> <strong>Service</strong>. Even those without contact may have<br />
perceptions of its performance in terms of customer service and this provides valuable<br />
context to the interpretation of customer attitudes to service delivery.<br />
1.1 Measuring Public Sector <strong>Customer</strong> <strong>Satisfaction</strong><br />
There are a number of features of customer satisfaction in a public sector context that<br />
distinguish it from private sector customer satisfaction research. The challenge for the<br />
<strong>Civil</strong> <strong>Service</strong> is to balance distinct, and often competing, factors relating to value for<br />
money for citizens with high quality, accessible services for customers.<br />
Firstly, customer surveys are exclusively concerned with clients’ satisfaction with the<br />
delivery of services at an operational level. However, citizen surveys could consider<br />
issues such as whether certain services should be provided by the public sector at all.<br />
Secondly, for customers and users, their priorities are for a better service, even though,<br />
as citizens, they may also recognise that resources may be better used elsewhere.<br />
There are also a number of features of public services that make them different from<br />
private sector services, and which reduce the usefulness of direct comparison between<br />
the public and private sectors.<br />
Many commercial models of service quality focus on the aim of increasing consumption<br />
4
<strong>Irish</strong> <strong>Civil</strong> <strong>Service</strong> - <strong>Customer</strong> <strong>Satisfaction</strong> <strong>Survey</strong><br />
of services and increasing customer loyalty whereas, for certain public services, these<br />
considerations are in theory less relevant, as customers may be obliged to consume<br />
the services (such as regulatory services) or where a reduction in consumption would<br />
be preferred (e.g. health and social welfare).<br />
An important consideration in evaluating customer satisfaction in the <strong>Civil</strong> <strong>Service</strong> is<br />
that the range of impacts on the image of public services is likely to be wider than for<br />
private services. In particular, expectations of public services are not only influenced by<br />
direct communications from the service, or even what the media says about the<br />
service, but also the reputation of the Government and politicians generally. While it is<br />
generally agreed that the impact of these factors will be relatively minor when asking<br />
about very specific service elements, it can have an impact on aggregate ratings and<br />
on public perceptions of the <strong>Civil</strong> <strong>Service</strong> as a whole.<br />
1.2 Structure of Report<br />
The report begins with a discussion of the methodology employed for the survey before<br />
turning to a description of the results. The report concludes with a review of the main<br />
findings of the research and recommendations arising from the research.<br />
Throughout the report, results are presented firstly at an overall aggregate level before<br />
highlighting significant differences between particular subgroups. Generally, results of<br />
individual subgroups are not reported where no significant differences exist between<br />
the attitudes, opinions or other results of groups. Results of individual subgroups are<br />
also not reported where subgroup sample sizes are insufficiently large to permit reliable<br />
inferences to be drawn.<br />
Results of other studies are also included in Section 5.4.4 to provide context for<br />
declining levels of trust that are evident in Ireland at present.<br />
5
<strong>Irish</strong> <strong>Civil</strong> <strong>Service</strong> - <strong>Customer</strong> <strong>Satisfaction</strong> <strong>Survey</strong><br />
2. Research Methodology<br />
2.1 Overview of Research Methodology<br />
This section sets out details of the methodology employed and interviewing approach<br />
used by Ipsos MORI during the <strong>Irish</strong> <strong>Civil</strong> <strong>Service</strong> <strong>Customer</strong> <strong>Satisfaction</strong> <strong>Survey</strong>. The<br />
research reported in this document was undertaken by Ipsos MORI, an independent<br />
research company based in Dublin. The nature and importance of the research project<br />
demanded robust statistical information as an output, so that the attitudes and<br />
perceptions of customers and their experiences of interaction with Government<br />
Departments and Offices could be measured reliably. Thus, the agreed methodology<br />
was a quantitative survey conducted face-to-face with a nationally representative<br />
sample of the general public.<br />
2.2 Questionnaire Development<br />
At the outset of the project, Ipsos MORI and the project steering team met to agree the<br />
principal objectives of the research and to prioritise question areas for inclusion in the<br />
research. It was agreed that question areas from previous surveys remained relevant<br />
and should be retained so that progress could be reliably measured. These included:<br />
contact with <strong>Civil</strong> <strong>Service</strong> Departments and Offices, frequency and nature of contact,<br />
satisfaction with customer experience, satisfaction with specific contact methods,<br />
convenience of contact methods, general perceptions of the <strong>Civil</strong> <strong>Service</strong> as an<br />
organisation, customer advocacy of the <strong>Civil</strong> <strong>Service</strong>, as well as reasons for customer<br />
dissatisfaction and recommendations for future improvements in service delivery.<br />
6
<strong>Irish</strong> <strong>Civil</strong> <strong>Service</strong> - <strong>Customer</strong> <strong>Satisfaction</strong> <strong>Survey</strong><br />
2.3 <strong>Survey</strong> Administration<br />
The survey was conducted by Ipsos MORI using face-to-face interviewing. All<br />
interviews were conducted by trained Ipsos MORI field interviewers, who are all<br />
accredited by the Interviewer Quality Control Scheme (IQCS), an independent<br />
organisation which works with researchers and research clients to ensure the highest<br />
standards of data collection in professional research.<br />
The method of administration employed - face-to-face personal interviewing - has<br />
obvious advantages over alternative approaches, such as telephone and selfcompletion,<br />
as it allows for greater probing of the respondents’ responses to get more<br />
detailed and accurate answers.<br />
2.3.1 Stand-Alone <strong>Survey</strong><br />
When conducted in 2002 and 1997, the <strong>Civil</strong> <strong>Service</strong> customer survey was conducted<br />
as part of a syndicated omnibus survey, whereby a representative sample of the<br />
general population are surveyed on a variety of topics for a variety of clients to provide<br />
cost-efficiencies to those placing questions on the survey. However, in 2005,<br />
recognising the importance of the study, a stand-alone survey was preferred as a more<br />
reliable and appropriate approach. On an omnibus survey, questions could be included<br />
(i) at any position in the survey, whereby the quality of responses to questions towards<br />
the end of a longer survey can suffer due to respondent fatigue, and (ii) alongside other<br />
unrelated areas such as product purchase behaviour that may distract the respondent.<br />
This stand-alone approach has subsequently been retained for the 2008 and <strong>2009</strong><br />
surveys.<br />
7
<strong>Irish</strong> <strong>Civil</strong> <strong>Service</strong> - <strong>Customer</strong> <strong>Satisfaction</strong> <strong>Survey</strong><br />
2.4 Sampling Method/Size<br />
Interviews were conducted during September and October <strong>2009</strong>, at 100 different<br />
sampling points in the Republic of Ireland.<br />
A total of 2,007 interviews were completed with adults aged 18 and older. A sample of<br />
this size provides robust data at an aggregate level and for certain sub-group analyses<br />
(e.g. most recent contact, age, socio-economic group, etc). The table below illustrates<br />
the representative nature of a sample of different sizes. For example, if the results of a<br />
survey of 2,000 people show that 70% of the public have a favourable opinion of the<br />
<strong>Civil</strong> <strong>Service</strong>, the range which the true figure would lie, if all the population had been<br />
interviewed would be +/- 2 points (i.e. somewhere between 68% and 72%), 95 times<br />
out of 100. In fact, the “true” figure is more likely to lie at the mid-point of the range,<br />
rather than at either extreme.<br />
Sampling tolerances applicable to results at<br />
or near these percentages (based on 95% confidence level)<br />
Sample Size 10/90% 30/70% 50%<br />
+% +% +%<br />
1,000 2 3 3<br />
1,200 2 3 3<br />
2,000 1 2 2<br />
The same quotas as last year were applied to ensure that the sample was<br />
representative of the population and that data was comparable. The applied quotas<br />
were as follow:<br />
• 2 gender quotas (male, female),<br />
• 4 age bands (18-24, 25-39, 40-55, 55+),<br />
• 4 region quotas (Dublin, Rest of Leinster, Munster and Connaught / Ulster),<br />
• 2 Socio-Economic Group quotas (ABC1, C2DE).<br />
8
<strong>Irish</strong> <strong>Civil</strong> <strong>Service</strong> - <strong>Customer</strong> <strong>Satisfaction</strong> <strong>Survey</strong><br />
2.5 Project Management Standards<br />
ISO 20252:2006<br />
All aspects of this survey were conducted in accordance with the ISO 20252:2006<br />
quality standard, the first quality management systems standard laid down by the<br />
internationally recognised International Standards Organisation to be dedicated solely<br />
to market, opinion and social research. It supersedes the ISO 9001:2000 standard that<br />
we previously held, and provides absolute assurance of quality throughout the<br />
business. Ipsos MORI is the first market research company in Ireland to hold this<br />
standard.<br />
MRS Code of Conduct<br />
As members of the Market Research Society, we adhere to a strict code of conduct<br />
that encompasses not only quality standards, but also ethical and legislative principles.<br />
This helps to provide confidence in our findings for our clients, our respondents, and<br />
our own industry.<br />
9
<strong>Irish</strong> <strong>Civil</strong> <strong>Service</strong> - <strong>Customer</strong> <strong>Satisfaction</strong> <strong>Survey</strong><br />
3. <strong>Civil</strong> <strong>Service</strong> Contact<br />
This first chapter of results examines the level and nature of contact members of the<br />
public had with the <strong>Civil</strong> <strong>Service</strong> in the 12 months preceding the survey. These results<br />
detail which Departments or Offices were contacted by customers, how frequently<br />
these Departments/Offices were contacted and the means used to make contact.<br />
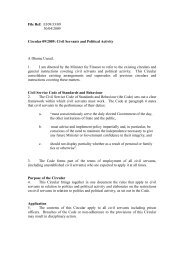
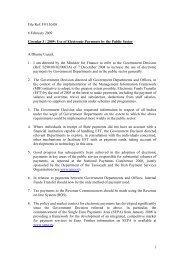
3.1 <strong>Civil</strong> <strong>Service</strong> Department or Office Contact<br />
Any Contact with Govt. Departments in past 12 months<br />
Q. For each of the <strong>Civil</strong> <strong>Service</strong> Departments and Offices I read out, can you tell me whether or not you have<br />
had any contact with them over the past 12 months:<br />
6<br />
Any Contact<br />
49%<br />
Dept of Social & Family Affairs<br />
26%<br />
Revenue Commissioners<br />
11%<br />
Dept of Foreign Affairs<br />
Dept of Health & Children<br />
Dept of Environment Heritage & Local Govt<br />
Dept of Education & Science<br />
Dept of Agriculture & Food<br />
Dept of Transport<br />
Dept Ent Trade & Employment<br />
Land Registry/Property Registration<br />
Authority<br />
5%<br />
5%<br />
5%<br />
4%<br />
4%<br />
3%<br />
3%<br />
2%<br />
Base: All Respondents (2,007)<br />
All other contacts at 1% or less<br />
Contact with any <strong>Civil</strong> <strong>Service</strong> Department/Office has shown little change in the last<br />
year, with 49% of the general public interviewed stating that they have had any contact<br />
with any Government Department or Office in the last 12 months compared to 48% in<br />
2008 and 46% in 2005. The most frequently contacted Department is the Department<br />
of Social & Family Affairs, contacted by 26% of all respondents (22% in 2008). The<br />
next most frequently contacted Departments/Offices are the Office of the Revenue<br />
Commissioners (11%), the Department of Foreign Affairs (including the Passport<br />
Office) (5%), the Department of Health and Children (5%) and the Department of<br />
Environment, Heritage and Local Government (5%). No other <strong>Civil</strong> <strong>Service</strong> Department<br />
or Office was contacted by more than 4% of respondents.<br />
In terms of frequency of contact, the average number of contacts with a Department or<br />
Office is between 2 and 4 times by each customer.<br />
10
<strong>Irish</strong> <strong>Civil</strong> <strong>Service</strong> - <strong>Customer</strong> <strong>Satisfaction</strong> <strong>Survey</strong><br />
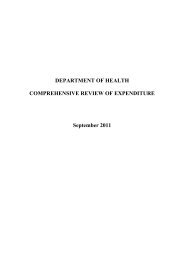
3.2 Most Recent Contact<br />
Most Recent Contact with a Govt. Department<br />
Q. Which Government Dept or Office did you contact most recently<br />
9<br />
Dept of Social & Family Affairs<br />
44%<br />
Office of Revenue Commissioners<br />
15%<br />
Dept of Foreign Affairs<br />
6%<br />
Dept of Env. Heritage & Local Govt<br />
6%<br />
Dept of Agriculture & Food<br />
6%<br />
Dept of Education & Science<br />
5%<br />
Dept of Health & Children<br />
4%<br />
All other contacts at 3% or less<br />
Base: All who had any contact with a Govt Dept/Office in the last 12 months (n=992)<br />
Respondents were asked with which Department they had their most recent contact.<br />
The purpose of this question is to ensure that respondents’ perceptions of <strong>Civil</strong> <strong>Service</strong><br />
customer delivery is captured through reference to a specific service contact (i.e. their<br />
most recent contact), rather than an accumulation of experiences. This provides for a<br />
more focussed and accurate evaluation of the user’s experience.<br />
In terms of most recent contact, a similar pattern to that of overall contact can be seen.<br />
Of all who had contact with the <strong>Civil</strong> <strong>Service</strong> in the past 12 months, the Department<br />
most contacted recently is the Department of Social and Family Affairs which was<br />
contacted by almost half (44%) of all <strong>Civil</strong> <strong>Service</strong> customers. The Office of the<br />
Revenue Commissioners was contacted most recently by 15% of all <strong>Civil</strong> <strong>Service</strong><br />
customers. These two Departments alone account for almost 60% of all recent<br />
contacts.<br />
The Department of Foreign Affairs, the Department of the Environment, Heritage &<br />
Local Government and the Department of Agriculture & Food were each contacted<br />
most recently by 6% of <strong>Civil</strong> <strong>Service</strong> customers.<br />
11
<strong>Irish</strong> <strong>Civil</strong> <strong>Service</strong> - <strong>Customer</strong> <strong>Satisfaction</strong> <strong>Survey</strong><br />
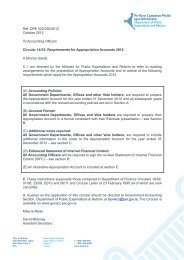
3.3 Nature of Most Recent Contact<br />
Nature Most Recent Contact<br />
Q. Thinking about your most recent contact with a <strong>Civil</strong> <strong>Service</strong> Dept or Office, which of the following best<br />
describes the nature of this contact<br />
12<br />
Enquiring about a particular<br />
service/entitlement/application<br />
32%<br />
Seeking general information<br />
22%<br />
Carrying out a transaction<br />
17%<br />
Seeking payment/collecting<br />
allowance<br />
14%<br />
Providing Information<br />
10%<br />
Querying the<br />
meaning/accuracy in<br />
documentation received<br />
Other<br />
3%<br />
2%<br />
Base: All who had any contact with a Govt Dept/Office in the last 12 months (n=992 in <strong>2009</strong>)<br />
Those who had contact with a <strong>Civil</strong> <strong>Service</strong> Department/Office were also asked for the<br />
reason for their most recent contact. The most popular reason for contact is to enquire<br />
about a particular service/entitlement/application (32%). A further 22% contacted a<br />
Department or Office to seek general information. 17% of customers made contact to<br />
carry out a transaction and 14% of customers were seeking a payment or collecting an<br />
allowance, an increase from 10% in <strong>2009</strong>.<br />
12
<strong>Irish</strong> <strong>Civil</strong> <strong>Service</strong> - <strong>Customer</strong> <strong>Satisfaction</strong> <strong>Survey</strong><br />
3.4 Method of Contact – Any Contact<br />
Methods Ever Used For Contact (05-09)<br />
Q. Which other methods have you ever used<br />
16<br />
By phone<br />
In person<br />
In writing<br />
Through e-mail<br />
Via Internet<br />
By Fax<br />
12%<br />
15%<br />
18%<br />
12%<br />
16%<br />
12%<br />
1%<br />
3%<br />
4%<br />
41%<br />
34%<br />
37%<br />
40%<br />
55%<br />
53%<br />
68%<br />
71%<br />
81%<br />
<strong>2009</strong><br />
2008<br />
2005<br />
Base: All who had any contact with a Govt Dept/Office in the last 12 months (n=992 in <strong>2009</strong>, n=973 in 2008, n=564 in 2005)<br />
In terms of ‘any’ methods used to contact Government Departments and Offices, 68%<br />
of those who had contacted the <strong>Civil</strong> <strong>Service</strong> had contact by phone, compared to 71%<br />
of respondents in 2008 and 81% of respondents in 2005. Thus, while telephone<br />
remains the most used method of contact in the past 12 months, the proportion of<br />
customers using the telephone is falling.<br />
In contrast, the proportion of respondents contacting Government Departments/Offices<br />
in person since 2005 is rising. In <strong>2009</strong>, 55% of those who had contacted Government<br />
Departments/Offices in the past 12 months had done so in person, compared to 53% in<br />
2008 and 41% in 2005.<br />
The explanation for this shift in patterns of contact is likely to be caused by a<br />
combination of the increase in the proportion of customers contacting the Department<br />
of Social & Family Affairs, whose customers predominantly rely on personal contact,<br />
and the decrease in those contacting the Office of the Revenue Commissioners, whose<br />
customers are more likely to contact the Office by phone.<br />
The proportion of customers contacting Government Departments/Offices in writing is<br />
also falling. In <strong>2009</strong>, 34% of customers had contact with Departments/Offices in writing,<br />
compared to 37% in 2008 and 40% in 2005.<br />
In 2005, the level of contacts by e-mail and via the Internet was much higher than in<br />
13
<strong>Irish</strong> <strong>Civil</strong> <strong>Service</strong> - <strong>Customer</strong> <strong>Satisfaction</strong> <strong>Survey</strong><br />
2002 and 1997. However, this level of electronic contact plateaued in 2008, as<br />
displayed in the graph above. In <strong>2009</strong>, we see a return to the 2005 levels of contact via<br />
the Internet, with 12% claiming to have contacted the <strong>Civil</strong> <strong>Service</strong> via the Internet in<br />
<strong>2009</strong>. As in 2008, there is a small decrease in <strong>2009</strong> in the proportion of respondents<br />
who are using e-mail to contact Departments and Offices. This might be explained, in<br />
some way, by the proportionate increase in contacts ‘in person’ as a result of the<br />
greater levels of contact generally with the Department of Social and Family Affairs.<br />
3.4.1 Method of Contact – Most Recent<br />
Method of Most Recent Contact (05-09)<br />
Q. Thinking about this most recent contact, did you mainly deal with the relevant Department or Office by<br />
telephone, in writing, by e-mail, via a website or in person<br />
15<br />
By phone<br />
41%<br />
43%<br />
57%<br />
In person<br />
25%<br />
41%<br />
36%<br />
In writing<br />
Via Internet<br />
4%<br />
5%<br />
2%<br />
12%<br />
13%<br />
11%<br />
<strong>2009</strong><br />
2008<br />
2005<br />
Through e-mail<br />
2%<br />
2%<br />
4%<br />
Base: All who had any contact with a Govt Dept/Office in the last 12 months (n=992 in <strong>2009</strong>, n=973 in 2008, n=564 in 2005)<br />
The <strong>2009</strong> survey results show that contact in person is now as popular as contact by<br />
phone as a method of most recent contact. This year, 41% of respondents had their<br />
most recent contact by phone, the same proportion that had contact in person. This<br />
represents a significant shift from 2005 when more than twice as many respondents<br />
had contact by phone (57%) as had contact in person (25%).<br />
However, this is not especially surprising, given the consistent increase in the<br />
proportion of customers whose most recent contact was with the Department of Social<br />
and Family Affairs and, as discussed above, the decrease in recent contact with<br />
Revenue.<br />
Other forms of contact remain low for customers’ most recent contact. Most recent<br />
contact in writing (12%) is comparable to the 2008 (13%) and 2005 (11%) figures.<br />
14
<strong>Irish</strong> <strong>Civil</strong> <strong>Service</strong> - <strong>Customer</strong> <strong>Satisfaction</strong> <strong>Survey</strong><br />
Electronic forms of contact also remain low for most recent contact, with only 4% of<br />
respondents’ most recent contact coming via Internet and 2% through e-mail.<br />
15
<strong>Irish</strong> <strong>Civil</strong> <strong>Service</strong> - <strong>Customer</strong> <strong>Satisfaction</strong> <strong>Survey</strong><br />
4. <strong>Satisfaction</strong> with <strong>Customer</strong> <strong>Service</strong><br />
This second chapter of results examines customers’ satisfaction with the level of<br />
service received from a <strong>Civil</strong> <strong>Service</strong> Department or Office in the 12 months preceding<br />
the survey. These results detail the levels of satisfaction with the overall service<br />
received and customers’ satisfaction with individual aspects of particular methods of<br />
service delivery (i.e. by phone, in person, etc.). <strong>Customer</strong> suggestions for<br />
improvements to individual service delivery methods are also identified.<br />
All questions on satisfaction are based on the responses of the 992 respondents who<br />
had contact with a <strong>Civil</strong> <strong>Service</strong> Department or Office in the preceding twelve months.<br />
4.1 Overall <strong>Satisfaction</strong> with <strong>Service</strong><br />
Overall <strong>Satisfaction</strong> with <strong>Service</strong> (05-09)<br />
Q. Thinking of the most recent contact you had with a <strong>Civil</strong> <strong>Service</strong> Department or Office – overall how<br />
satisfied or dissatisfied were you with the service you received<br />
11<br />
Very Satisfied<br />
Neither Satisfied nor Dissatisfied<br />
Very Dissatisfied<br />
Fairly Satisfied<br />
Fairly Dissatisfied<br />
Don't know<br />
% All<br />
satisfied<br />
<strong>2009</strong><br />
37%<br />
41%<br />
5%<br />
8% 1%<br />
7%<br />
78%<br />
2008<br />
44%<br />
36%<br />
5% 6% 8%<br />
1%<br />
80%<br />
2005<br />
42% 36%<br />
6% 6%<br />
9% 1%<br />
78%<br />
Base: All who had any contact with a Govt Dept/Office in the last 12 months (n=992 in <strong>2009</strong>, n=973 in 2008, n=564 in 2005)<br />
Overall satisfaction (very/fairly satisfied) with service received by respondents is 78%,<br />
which is consistent with the 2008 (80%) and 2005 (78%) survey results. However,<br />
there is a significant decrease in the proportion of respondents who are very satisfied<br />
with the service they received (37% of respondents claimed to be very satisfied<br />
against 44% in 2008). The proportion of those who are very or fairly dissatisfied (15%)<br />
with the level of service received has remained consistent compared to both the 2008<br />
(14%) and 2005 (15%) surveys.<br />
Respondents were also asked about their service expectations, prior to the most recent<br />
16
<strong>Irish</strong> <strong>Civil</strong> <strong>Service</strong> - <strong>Customer</strong> <strong>Satisfaction</strong> <strong>Survey</strong><br />
contact they had with a <strong>Civil</strong> <strong>Service</strong> Department or Office.<br />
Meeting <strong>Service</strong> Expectations (08-09)<br />
Q. Thinking of the most recent contact you had with a <strong>Civil</strong> <strong>Service</strong> Department or Office – was the service<br />
you received , better than expected, the same as expected or worse than expected<br />
22<br />
Better than expected Same as expected Worse than expected Don't know<br />
<strong>2009</strong><br />
21% 61%<br />
15% 3%<br />
2008<br />
26%<br />
56% 15%<br />
3%<br />
Base: All who had any contact with a Govt Dept/Office in the last 12 months (n=992 in <strong>2009</strong>, n=973 in 2008)<br />
The proportion of respondents whose experience was better than expected (21%) in<br />
<strong>2009</strong> is lower than in 2008 (26%). However, as in 2008, the proportion of respondents<br />
whose experience was better than expected (21%) remains significantly greater than<br />
the proportion of respondents whose experience was worse than expected (15%).<br />
This decrease in the proportion of respondents whose expectations were exceeded<br />
may be a function of either perceived diminished standards of delivery in <strong>2009</strong> or<br />
increased customer expectations.<br />
17
<strong>Irish</strong> <strong>Civil</strong> <strong>Service</strong> - <strong>Customer</strong> <strong>Satisfaction</strong> <strong>Survey</strong><br />
4.2 <strong>Satisfaction</strong> with <strong>Service</strong> Delivery Methods<br />
As well as measuring overall levels of satisfaction with the service received,<br />
respondents were also asked about how satisfied they were with particular service<br />
attributes specific to the method that was used in their most recent contact. <strong>Satisfaction</strong><br />
with service by each method is now discussed in turn.<br />
4.2.1 <strong>Satisfaction</strong> with <strong>Service</strong> by Phone<br />
<strong>Satisfaction</strong> with <strong>Service</strong> by Phone<br />
Q. Thinking of the most recent contact you had by phone, please tell me how satisfied or dissatisfied you<br />
were with the following (ranked by mean score)<br />
Very Satisfied Fairly Satisfied Neither Satisfied nor Dissatisfied<br />
Fairly Dissatisfied Very Dissatisfied Don’t know/No answer<br />
25<br />
% All<br />
Satisfied<br />
Helpfulness of staff<br />
31%<br />
41%<br />
7% 4% 3% 15%<br />
72%<br />
Manner in which staff explained issues/provided<br />
information<br />
30%<br />
40%<br />
6% 5% 4%<br />
15%<br />
70%<br />
Knowledge of staff<br />
28%<br />
41%<br />
8% 6% 4% 14%<br />
69%<br />
Quality of advice / information received<br />
27%<br />
41%<br />
7% 6% 4%<br />
14%<br />
69%<br />
Ease of finding telephone number<br />
29%<br />
39%<br />
5% 8% 4%<br />
15%<br />
68%<br />
Speed /efficiency with which query dealt with<br />
25%<br />
38%<br />
7%<br />
9% 6%<br />
14%<br />
63%<br />
Speed with which phone answered<br />
18%<br />
33%<br />
5%<br />
19%<br />
10%<br />
15%<br />
51%<br />
Voicemail service<br />
5%<br />
17%<br />
11% 6% 6%<br />
55%<br />
22%<br />
Telephone menu / automated telephone services<br />
8%<br />
21%<br />
11%<br />
8%<br />
10%<br />
42%<br />
29%<br />
Amount of time left holding<br />
14%<br />
24%<br />
9%<br />
22%<br />
14%<br />
17%<br />
38%<br />
Base: All Respondents who had any contact with a Govt Dept by phone in the past 12 months (n=675)<br />
As in 2008, satisfaction levels with various aspects of service by phone are generally<br />
high. The aspects of service by phone which have the highest levels of satisfaction<br />
relate to staff service, such as the helpfulness of staff (72% satisfied), the manner in<br />
which staff explained issues/provided information (70%), knowledge of staff (69%), and<br />
the quality of advice/information received (69%). However, compared to 2008, there<br />
are significant decreases in the proportion of respondents who are very satisfied with<br />
each of these aspects of service by phone.<br />
Dissatisfaction with certain aspects of phone contact has also risen considerably since<br />
2008. The highest level of overall dissatisfaction expressed is for the amount of time<br />
left holding, with which 36% of phone customers were very/fairly dissatisfied in <strong>2009</strong><br />
compared to 26% in 2008. 29% of phone customers were dissatisfied with the speed<br />
with which the phone was answered, compared to 22% in 2008. As in 2008, a large<br />
18
<strong>Irish</strong> <strong>Civil</strong> <strong>Service</strong> - <strong>Customer</strong> <strong>Satisfaction</strong> <strong>Survey</strong><br />
cohort of respondents gave no answer or did not know how to respond with regard to<br />
voicemail services and automated telephone services. This is most likely because they<br />
had no experience of these features.<br />
Finally, in relation to phone service, phone customers were asked to identify one<br />
aspect that most needs improving, based on their most recent contact by phone. The<br />
results are displayed in the chart below.<br />
<strong>Service</strong> by Phone - Improvements Required<br />
Q. Thinking about the most recent contact you had by phone, what ONE thing from this list do you think<br />
most needs improving<br />
26<br />
Amount of time left holding<br />
20%<br />
Speed with which phone answered<br />
Telephone menu / automated telephone<br />
services<br />
Speed /efficiency with which query dealt with<br />
Ease of finding telephone number<br />
6%<br />
7%<br />
7%<br />
12%<br />
Helpfulness of staff<br />
Knowledge of staff<br />
Manner in which staff explained<br />
issues/provided information<br />
Quality of advice / information received<br />
Voicemail service<br />
4%<br />
4%<br />
3%<br />
2%<br />
2%<br />
Nothing needs improving<br />
Don't Know<br />
17%<br />
17%<br />
Base: All Respondents who had any contact by phone with a Govt Dept in the past 12 months (n=675)<br />
The aspects of phone service most frequently identified as requiring improvement echo<br />
those aspects that recorded the highest levels of dissatisfaction, that is, the amount of<br />
time left holding (20%) and the speed with which the phone was answered (12%). As in<br />
previous surveys, timeliness of services represents a recurring concern for phone<br />
customers.<br />
17% of respondents said that nothing needs improving and a further 17% were unable<br />
to identify any required improvements.<br />
19
<strong>Irish</strong> <strong>Civil</strong> <strong>Service</strong> - <strong>Customer</strong> <strong>Satisfaction</strong> <strong>Survey</strong><br />
4.2.2 <strong>Satisfaction</strong> with <strong>Service</strong> in Person<br />
<strong>Satisfaction</strong> with <strong>Service</strong> in Person<br />
Q. Thinking of the most recent contact you had in person, please tell me how satisfied or dissatisfied you<br />
were with the following (ranked by mean score)<br />
31<br />
Helpfulness of staff<br />
Location of Department/Office<br />
Knowledge of staff<br />
Quality of advice / information received<br />
Manner in which staff explained issues<br />
Public service area facilities<br />
Design and layout of forms<br />
Help received in filling out forms<br />
Privacy of Conversation/transaction<br />
Speed/efficiency with which query<br />
was addressed<br />
Hours of Business<br />
Queuing System<br />
Very Satisfied<br />
Neither Satisfied nor Dissatisfied<br />
Very Dissatisfied<br />
21%<br />
16%<br />
26%<br />
26%<br />
22%<br />
19%<br />
38%<br />
33%<br />
36%<br />
34%<br />
32%<br />
30%<br />
25%<br />
34%<br />
38%<br />
37%<br />
34%<br />
41%<br />
36%<br />
41%<br />
36%<br />
38%<br />
37%<br />
39%<br />
12%<br />
4% 5%<br />
8%<br />
Fairly Satisfied<br />
Fairly Dissatisfied<br />
Don’t know/No answer<br />
9%<br />
7%<br />
7%<br />
7%<br />
14%<br />
7%<br />
7%<br />
6% 5% 5% 10%<br />
11%<br />
7%<br />
14%<br />
13%<br />
14%<br />
6% 6%<br />
8%<br />
7% 2%<br />
7% 5% 5% 10%<br />
5% 7% 5% 10%<br />
4%<br />
38%<br />
13%<br />
5%<br />
8%<br />
7%<br />
6%<br />
10%<br />
11%<br />
16%<br />
9%<br />
11%<br />
11%<br />
12%<br />
10%<br />
All<br />
Satisfied<br />
%<br />
74%<br />
75%<br />
73%<br />
72%<br />
70%<br />
70%<br />
59%<br />
41%<br />
63%<br />
61%<br />
62%<br />
53%<br />
Base: All Respondents who had any contact in person with a Govt Dept in the past 12 months (n=548)<br />
With regard to satisfaction with service received in person, there are again relatively<br />
high levels of satisfaction with service attributes relating to staff, such as the<br />
helpfulness (74%) and knowledge (73%) of staff. As with services received by phone,<br />
there is less overall satisfaction with the timeliness of delivery. For example, more than<br />
one in every five (21%) customers were dissatisfied with the speed/efficiency with<br />
which queries were addressed. However, some of this dissatisfaction may relate to the<br />
physical environment associated with services delivered in person, as represented by<br />
the 27% of customers who were dissatisfied overall with the queuing system.<br />
While phone customers are significantly less likely to be very satisfied with aspects of<br />
the service than they were in 2008, as discussed in the previous section, this is not the<br />
case for ‘in person’ customers. Thus, the proportion of customers very satisfied with the<br />
helpfulness of staff and the knowledge of staff received in person has not decreased to<br />
the same extent as it has for phone customers.<br />
There is also evidence that there is lower dissatisfaction with certain aspects of service<br />
received in person in <strong>2009</strong>. In 2008, there was a substantial minority (21%) of these<br />
customers who were dissatisfied with the quality of advice/information received.<br />
However, in <strong>2009</strong>, only 12% were dissatisfied with the quality of advice and information<br />
received.<br />
20
<strong>Irish</strong> <strong>Civil</strong> <strong>Service</strong> - <strong>Customer</strong> <strong>Satisfaction</strong> <strong>Survey</strong><br />
‘In person’ customers were also asked to identify one aspect of service that most<br />
needs improving, based on their most recent contact in person. The results are<br />
displayed in the chart below.<br />
<strong>Service</strong> in Person – Improvements Required<br />
Q. Thinking of the most recent contact you had in person, what ONE thing from this list do you think<br />
most needs improving<br />
Queuing System<br />
Speed/efficiency with which query was addressed<br />
Hours of Business<br />
Quality of advice/information received<br />
Design and layout of forms<br />
Public <strong>Service</strong> Area Facilities<br />
Knowledge of staff<br />
Manner in which staff explained issues/provided information<br />
Helpfulness of staff<br />
Privacy of conversation/transaction<br />
Location of Department/Office<br />
Help received in filling out forms<br />
Other<br />
Nothing needs improving<br />
Don’t Know<br />
1%<br />
2%<br />
2%<br />
3%<br />
3%<br />
4%<br />
5%<br />
5%<br />
6%<br />
7%<br />
7%<br />
10%<br />
11%<br />
14%<br />
19%<br />
31<br />
Base: All Respondents who had any contact in person with a Govt Dept in the past 12 months (n=548)<br />
Again, timeliness features strongly in the improvements required. 14% of ‘in person’<br />
customers identify the queuing system and 10% of customers identify the<br />
spend/efficiency with which queries were addressed as the aspects most requiring<br />
improvements.<br />
Just under one-fifth (19%) of respondents said that nothing needs improving and a<br />
further 11% were unable to identify an aspect that needs improvement.<br />
21
<strong>Irish</strong> <strong>Civil</strong> <strong>Service</strong> - <strong>Customer</strong> <strong>Satisfaction</strong> <strong>Survey</strong><br />
4.2.3 <strong>Satisfaction</strong> with <strong>Service</strong> in Writing<br />
<strong>Satisfaction</strong> with <strong>Service</strong> in Writing<br />
Q. Thinking of the most recent contact you had in writing, please tell me how satisfied or dissatisfied you<br />
were with the following (ranked by mean score)<br />
27<br />
Very Satisfied<br />
Neither Satisfied nor Dissatisfied<br />
Very Dissatisfied<br />
Fairly Satisfied<br />
Fairly Dissatisfied<br />
Don’t know/No answer<br />
% All<br />
Satisfied<br />
Ease of finding correct<br />
address/contact<br />
person<br />
29%<br />
43%<br />
4%<br />
2%<br />
1%<br />
22%<br />
72%<br />
Clarity of language<br />
used in written<br />
communication<br />
21%<br />
46%<br />
4%<br />
4%<br />
1%<br />
24%<br />
67%<br />
Quality of<br />
advice/information<br />
received<br />
20%<br />
40%<br />
6% 6%<br />
3%<br />
25%<br />
60%<br />
Speed and efficiency<br />
of response to query<br />
20%<br />
40%<br />
5%<br />
8% 6%<br />
22%<br />
60%<br />
Design and layout of<br />
forms<br />
19%<br />
22%<br />
8% 25%<br />
3%<br />
24%<br />
41%<br />
Base: All Respondents who had any contact in writing with a Govt Dept in the past 12 months (n=340)<br />
Turning to customer satisfaction with service in writing, the chart above suggests lower<br />
levels of user engagement overall with service in writing compared with customer<br />
experiences of service by phone or in person, as evidenced by the high level of nonresponse<br />
(don’t know or no answer) on service attributes. While service by phone or in<br />
person revealed relatively high levels of satisfaction with staff attributes, customer-staff<br />
interaction does not apply to the same degree with service in writing.<br />
In 2008, the aspect of service in writing that attracts the highest level of dissatisfaction<br />
(15%) was the speed and efficiency of response to their query. However, in <strong>2009</strong>, 28%<br />
of customers were dissatisfied with the design and layout of forms.<br />
This is reflected in the improvements required as identified by customers who had<br />
contact in writing, 27% of whom identified the design and layout of forms as the<br />
improvement most required. At best, poor design and layout of forms poses a<br />
psychological burden to users. At worst, it can render services inaccessible to users<br />
with poor numeracy or literacy skills.<br />
22
<strong>Irish</strong> <strong>Civil</strong> <strong>Service</strong> - <strong>Customer</strong> <strong>Satisfaction</strong> <strong>Survey</strong><br />
4.2.4 <strong>Satisfaction</strong> with <strong>Service</strong> by E-mail<br />
<strong>Satisfaction</strong> with <strong>Service</strong> by E-Mail<br />
Q. Thinking of the most recent contact you had through e-mail, please tell me how satisfied or dissatisfied<br />
you were with the following (ranked by mean score)<br />
32<br />
Very Satisfied<br />
Neither Satisfied nor Dissatisfied<br />
Very Dissatisfied<br />
Fairly Satisfied<br />
Fairly Dissatisfied<br />
Don’t know/No answer<br />
% All<br />
Satisfied<br />
Clarity of language<br />
used in e-mail<br />
29%<br />
27%<br />
2% 2% 3%<br />
37%<br />
56%<br />
Ease of finding<br />
correct e-mail<br />
address/contact<br />
35%<br />
19%<br />
1% 6% 3%<br />
36%<br />
45%<br />
Quality of<br />
advice/information<br />
received<br />
20%<br />
26%<br />
3% 4% 7%<br />
39%<br />
46%<br />
Speed/efficiency of<br />
response to query<br />
21%<br />
27%<br />
3% 5%<br />
8%<br />
37%<br />
48%<br />
Base: All Respondents who had any contact through email with a Govt Dept in the past 12 months (n=115)<br />
As discussed above, the level of customer contact by e-mail remains low compared to<br />
service by phone or in person. While satisfaction with aspects of service by e-mail is<br />
also lower than most aspects of service by phone or person, there is relatively little<br />
dissatisfaction expressed for the different factors of service related to e-mail. The large<br />
proportions of “don’t know” responses may be a function of the lower level of<br />
engagement associated with this contact method, which may encourage less<br />
consideration by users.<br />
However, as this method becomes more popular, it may be useful to prioritise<br />
improvements to those aspects of e-mail service with which customers are particularly<br />
dissatisfied. 9% of e-mail customers were very dissatisfied or fairly dissatisfied with the<br />
quality of advice/information received. 13% of e-mail customers were very dissatisfied<br />
or fairly dissatisfied with the speed and efficiency of response to their query, compared<br />
to 8% in the 2008 survey.<br />
Nonetheless, despite the fact that relatively low numbers of customers have made<br />
contact with a Government Department or Office by e-mail, these users appear broadly<br />
satisfied overall, indicating that the use of such services can yield positive results in<br />
terms of an efficient user experience.<br />
23
<strong>Irish</strong> <strong>Civil</strong> <strong>Service</strong> - <strong>Customer</strong> <strong>Satisfaction</strong> <strong>Survey</strong><br />
4.2.5 <strong>Satisfaction</strong> with <strong>Service</strong> via Internet<br />
<strong>Satisfaction</strong> with <strong>Service</strong> via Internet<br />
Q. Thinking of the most recent contact you had via Internet, please tell me how satisfied or dissatisfied<br />
you were with the following (ranked by mean score)<br />
37<br />
Very Satisfied<br />
Neither Satisfied nor Dissatisfied<br />
Very Dissatisfied<br />
Fairly Satisfied<br />
Fairly Dissatisfied<br />
Don’t know/No answer<br />
% All<br />
Satisfied<br />
Ease of finding website<br />
Ease of using service<br />
Efficiency of service<br />
Information/documents available on website<br />
Ease of downloading material<br />
Clarity of on-line forms<br />
Presentation of website<br />
Speed of response of service or follow up<br />
Quality of advice/information received<br />
Comprehensiveness of service<br />
Speed/efficiency of response to query<br />
43%<br />
35%<br />
34%<br />
37%<br />
33%<br />
34%<br />
33%<br />
29%<br />
31%<br />
30%<br />
29%<br />
16%<br />
16%<br />
14% 3% 3% 37%<br />
3% 2% 1%<br />
43%<br />
3%<br />
1% 43%<br />
20%<br />
18%<br />
17%<br />
23%<br />
5% 1% 2%<br />
4% 3% 1%<br />
7% 3% 1%<br />
5% 2% 3%<br />
35%<br />
41%<br />
39%<br />
35%<br />
12% 2% 3% 3%<br />
50%<br />
21%<br />
15%<br />
3% 5% 2%<br />
5% 3% 3%<br />
38%<br />
44%<br />
15% 1% 5% 3%<br />
46%<br />
57%<br />
51%<br />
50%<br />
57%<br />
51%<br />
50%<br />
55%<br />
41%<br />
52%<br />
45%<br />
45%<br />
Ease of navigating website<br />
32%<br />
20% 3% 6% 3%<br />
36%<br />
52%<br />
Base: All Respondents who had any contact via Internet with a Govt Dept in the past 12 months (n=119)<br />
As with service by e-mail, a much smaller number of respondents had experience of<br />
service via Internet compared to traditional methods of customer service. Given the<br />
relatively small number of <strong>Civil</strong> <strong>Service</strong> customers who had contact via Internet, it<br />
would be unreliable to derive strong conclusions from their experience.<br />
Compared to 2008 results, there are significantly higher levels of satisfaction with<br />
almost every aspect of service via Internet. There are also extremely low levels of<br />
dissatisfaction associated with individual aspects of service. 9% of respondents were<br />
dissatisfied with the ease of navigating websites and 8% were dissatisfied with the<br />
speed/efficiency of responses to queries. However, there is very little dissatisfaction<br />
with website design or the efficiency of service delivery.<br />
Typical forms of customer contact via Internet, such as the submission of an online<br />
form or a request for information through a Departmental website, do not necessarily<br />
require response from, or involve contact with, <strong>Civil</strong> <strong>Service</strong> officials and, as such, are<br />
significantly less interactive than other forms of contact. This lack of interactivity may<br />
encourage less consideration by users of the quality of specific aspects of the service<br />
delivery, hence the high levels of non-response depicted above.<br />
Once again, despite the low numbers of customers that have made contact via the<br />
internet, their positive experiences augur well for the potential of this channel, where<br />
appropriate.<br />
24
<strong>Irish</strong> <strong>Civil</strong> <strong>Service</strong> - <strong>Customer</strong> <strong>Satisfaction</strong> <strong>Survey</strong><br />
4.3 Dissatisfaction with <strong>Service</strong> or Contact<br />
Dissatisfaction with Any Aspect of <strong>Service</strong> or Contact<br />
(08-09) - All respondents<br />
Q. Have you been very or fairly dissatisfied with any aspect of service/contact you received from a <strong>Civil</strong><br />
<strong>Service</strong> Department or office in the past 12 months<br />
42<br />
Yes<br />
No<br />
<strong>2009</strong><br />
15%<br />
85%<br />
2008<br />
17% 83%<br />
Base: All respondents (n=2,007 in <strong>2009</strong>, n=2,002 in 2008)<br />
Following exploration of their most recent contact with <strong>Civil</strong> <strong>Service</strong> Departments or<br />
Offices, all respondents were then asked if they had been very or fairly dissatisfied with<br />
any aspect of service received from a <strong>Civil</strong> <strong>Service</strong> Department or Office in the past 12<br />
months. 15% of all respondents said that had been dissatisfied with some aspect of<br />
service received from a <strong>Civil</strong> <strong>Service</strong> Department or Office in the past 12 months,<br />
compared to 17% in 2008. However, this change is not statistically significant.<br />
<strong>Customer</strong>s’ reasons for dissatisfaction and other potential motivations for unfavourable<br />
perceptions of customer service from <strong>Civil</strong> <strong>Service</strong> Departments or Offices were then<br />
explored in greater detail. This was an open ended-question. As such, respondents<br />
were not presented with or prompted for specific response items and were encouraged<br />
to provide further details regarding the specific reasons for their dissatisfaction.<br />
These open-ended answers were coded thematically. The first step was to create a<br />
code frame of verbatim comments, from which recurring themes could be identified<br />
through systematic coding. Having coded the verbatim comments of respondents, it is<br />
also possible to examine the quantitative distribution of themes across the sample of<br />
dissatisfied respondents. By collating reasons for dissatisfaction across contact<br />
methods and service encounters, it is possible to identify the common drivers of<br />
dissatisfaction for <strong>Civil</strong> <strong>Service</strong> customers. This quantitative distribution is presented,<br />
along with exemplary verbatim comments.<br />
25
<strong>Irish</strong> <strong>Civil</strong> <strong>Service</strong> - <strong>Customer</strong> <strong>Satisfaction</strong> <strong>Survey</strong><br />
4.3.1 Reasons for Dissatisfaction with <strong>Service</strong> or Contact<br />
Reasons for Dissatisfaction with <strong>Service</strong> or Contact<br />
41<br />
Q. Can you tell me more about the reasons why you were dissatisfied<br />
(%) = 2008 data<br />
(All > 2%)<br />
Process too slow<br />
Attitude of staff/rushed<br />
Waiting time on phone/holding time/automated service<br />
Lack of knowledge of staff<br />
15%<br />
19%<br />
19%<br />
30% (26%)<br />
(20%)<br />
(21%)<br />
(18%)<br />
Provided wrong information<br />
10%<br />
Not entitled to benefit/pension/disappointing outcome<br />
Poor customer care/staff not trained to deal with customers<br />
Lack of privacy<br />
Office not clearly laid out /poor queuing system<br />
Not enough staff on duty<br />
No response to written query/email/phone message<br />
Lack of communication between staff/Depts<br />
One person dealing with enquiry/not passed around<br />
7%<br />
7%<br />
7%<br />
6%<br />
5%<br />
4%<br />
4%<br />
2%<br />
(9%)<br />
(13%)<br />
(11%)<br />
(7%)<br />
(3%)<br />
Base: All respondents dissatisfied with any aspect of service/contact in the past 12 months (n=311)<br />
As illustrated above, and reflecting the survey results on satisfaction discussed<br />
previously, the main reasons for dissatisfaction identified by respondents relate to the<br />
timeliness of service delivery, as well as the speed and quality of response by staff.<br />
The comparative results from the 2008 are also displayed above and demonstrate the<br />
consistency of the main drivers of customer satisfaction and dissatisfaction.<br />
30% of customers identify the speed of the process as a reason for dissatisfaction with<br />
a specific contact. A further 19% of customers identify being rushed by staff as a<br />
reason for dissatisfaction and the same proportion (19%) of customers identify waiting<br />
time and holding time on the phone. Thus, customers tend to identify aspects relating<br />
to the timeliness of service delivery as one of the main reasons for dissatisfaction. Of<br />
course, there is often more than one reason for a dissatisfactory service encounter, as<br />
the quotation below demonstrates:<br />
“My wife asked for XXXX Allowance and her file got lost. It took six months to find and<br />
when I rang, most of the staff were quite rude over the phone until I got talking to the<br />
right person. Phone calls were not returned and I had to keep ringing back until I was<br />
able to deal with a supervisor.”<br />
In 2008, qualitative analysis of these verbatim responses showed that there were two<br />
fundamental explanations for customer dissatisfaction. Firstly, dissatisfaction occurred<br />
when a satisfactory explanation for a particular decision was not forthcoming or when<br />
26
<strong>Irish</strong> <strong>Civil</strong> <strong>Service</strong> - <strong>Customer</strong> <strong>Satisfaction</strong> <strong>Survey</strong><br />
there was no guidance on next steps for the customer. This can be characterised as an<br />
unresolved contact and was seen by customers as failure at an interpersonal level by<br />
the official dealing with them. This is captured in the thematic analysis by<br />
dissatisfaction caused by the lack of knowledge of staff or the attitude of staff:<br />
Secondly, and more fundamentally, dissatisfaction occurred as the result of a systemic<br />
failure to prioritise the requirements of the customer:<br />
“You call at normal working hours and half the time you don't get a response,<br />
particularly early morning and lunch hours. There should be a service all throughout<br />
the day and key departments should be open Saturdays with minimum service<br />
available”.<br />
The conundrum is that officials adhering to existing quality customer service<br />
procedures and processes may nonetheless produce a dissatisfactory service for<br />
customers, as illustrated by the following customer quotation:<br />
“Their reply just seemed very short and negative and with no come back possible from<br />
my end.”<br />
While officials may consider the delivery of quality customer service in terms of their<br />
specific roles and responsibilities for each customer contact, individual customer<br />
requirements can cut across Departmental functions, requiring multiple contacts with<br />
different Departments and Offices for the resolution of a single query. This suggests<br />
that appreciating the customer journey as a whole, rather than as a collection of<br />
discrete contacts with individual Departments and Offices, is fundamental to a usercentred<br />
evaluation of quality customer service.<br />
In <strong>2009</strong>, 15% of the entire sample was dissatisfied with some aspect of service<br />
received from the <strong>Civil</strong> <strong>Service</strong> in the last 12 months, a total of 311 respondents.<br />
Further analysis indicates that this group only differs from the main sample in terms of<br />
their age (significantly more likely to be aged 25-39) and gender (significantly more<br />
likely to be female).<br />
27
<strong>Irish</strong> <strong>Civil</strong> <strong>Service</strong> - <strong>Customer</strong> <strong>Satisfaction</strong> <strong>Survey</strong><br />
5. Perceptions of the <strong>Civil</strong> <strong>Service</strong><br />
This chapter examines advocacy of the <strong>Civil</strong> <strong>Service</strong>, perceptions of <strong>Civil</strong> <strong>Service</strong><br />
efficiency and general attitudes towards the <strong>Irish</strong> <strong>Civil</strong> <strong>Service</strong> as an organisation<br />
among customers and non-customers.<br />
Results from a number of studies indicate that trust levels in Ireland are declining<br />
generally. It is worth noting that a useful context for this trend is provided later in this<br />
chapter in Section 5.4.4 - Declining Levels of Trust – External Data.<br />
5.1 <strong>Civil</strong> <strong>Service</strong> Advocacy<br />
All respondents interviewed were asked whether they would speak highly or be critical<br />
of the <strong>Civil</strong> <strong>Service</strong> to other people, based on their own experiences or impressions.<br />
The question was therefore asked of customers and non-customers, those with<br />
experience of service delivery and those without.<br />
Advocacy Towards <strong>Civil</strong> <strong>Service</strong> (05-09)<br />
- All Respondents<br />
Q. Taking into account your own experiences or impressions, which of these phrases best describes<br />
the way you would speak of the <strong>Civil</strong> <strong>Service</strong> to other people<br />
45<br />
Would speak highly without being asked<br />
Would be neutral<br />
Would be critical without being asked<br />
% Advocates<br />
28%<br />
Would speak highly if I am asked<br />
Would be critical if I am asked<br />
Don't Know<br />
% Critics<br />
21%<br />
<strong>2009</strong><br />
6% 22%<br />
28%<br />
46% 16% 5% 5%<br />
20%<br />
2008<br />
4%<br />
24%<br />
50%<br />
15%<br />
5% 4%<br />
32%<br />
16%<br />
2005<br />
3% 29%<br />
50% 12%<br />
4% 2%<br />
Base: All respondents (n=2,007 in <strong>2009</strong>, n=2,002 in 2008, n=1,226 in 2005)<br />
28% of respondents reported that they would speak highly of the <strong>Civil</strong> <strong>Service</strong> based<br />
on their own experience or impressions, which is the same level of advocacy recorded<br />
in 2008. 21% of respondents reported that they would be critical of the <strong>Civil</strong> <strong>Service</strong>,<br />
compared to 20% of respondents in 2008 and 16% of respondents in 2005.<br />
Approximately half of all respondents interviewed would be neutral towards the <strong>Civil</strong><br />
<strong>Service</strong>, which is consistent with the 2008 and 2005 results.<br />
28
<strong>Irish</strong> <strong>Civil</strong> <strong>Service</strong> - <strong>Customer</strong> <strong>Satisfaction</strong> <strong>Survey</strong><br />
The <strong>2009</strong> results also demonstrate the influence of contact with a Government<br />
Department or Office on customer advocacy. The table below shows that there is a<br />
significant difference in levels of customer advocacy between respondents who had<br />
contact and those who did not have contact.<br />
Advocacy Towards <strong>Civil</strong> <strong>Service</strong><br />
The influence of contact<br />
Q. Taking into account your own experiences or impressions, which of these phrases best describes<br />
the way you would speak of the <strong>Civil</strong> <strong>Service</strong> to other people<br />
50<br />
Would speak highly without being asked<br />
Would be neutral<br />
Would be critical without being asked<br />
Would speak highly if I am asked<br />
Would be critical if I am asked<br />
Don't Know<br />
All who had contact<br />
with any Govt Dept/Office<br />
in the last 12 months (n=992)<br />
7% 24%<br />
45%<br />
18% 6%1%<br />
All who had no contact<br />
with any Govt Dept/Office<br />
in the last 12 months (n=1015)<br />
6% 20%<br />
47% 15% 4% 8%<br />
Base: All respondents<br />
Those with contact were both more likely to speak highly and more likely to be critical<br />
of the <strong>Civil</strong> <strong>Service</strong> than those without contact. 31% of those with contact would speak<br />
highly of the <strong>Civil</strong> <strong>Service</strong>, based on their experiences and impressions, whereas only<br />
26% of those without contact would do likewise. Similarly, 24% of those with contact<br />
would be critical of the <strong>Civil</strong> <strong>Service</strong>, based on their experiences and impressions,<br />
compared to 19% of those without contact.<br />
29
<strong>Irish</strong> <strong>Civil</strong> <strong>Service</strong> - <strong>Customer</strong> <strong>Satisfaction</strong> <strong>Survey</strong><br />
5.2 Perceptions of <strong>Civil</strong> <strong>Service</strong> Efficiency<br />
All respondents were asked about their impression of how efficient they feel the <strong>Civil</strong><br />
<strong>Service</strong> is.<br />
Impression of <strong>Civil</strong> <strong>Service</strong> Efficiency (05-09)<br />
Q. Thinking of the <strong>Civil</strong> <strong>Service</strong> in overall terms, I would like you to give me your impression of how<br />
efficient you feel it is<br />
48<br />
Very Efficient Fairly Efficient No Opinion Either Way<br />
Fairly Inefficient Very Inefficient Don't know<br />
% All<br />
Efficient<br />
<strong>2009</strong><br />
16%<br />
40%<br />
17%<br />
15% 7% 5%<br />
57%<br />
2008<br />
15%<br />
45%<br />
15%<br />
12%<br />
5%<br />
8%<br />
60%<br />
2005<br />
16%<br />
46%<br />
24% 10% 3%1%<br />
62%<br />
Base: All respondents (n=2,007 in <strong>2009</strong>, n=2,002 in 2008, n=1,226 in 2005)<br />
The <strong>Civil</strong> <strong>Service</strong> is perceived as very efficient or fairly efficient by 57% of respondents<br />
(after statistical rounding) in <strong>2009</strong>, compared to 60% in 2008 and 62% of respondents<br />
in 2005. 22% of respondents believed the <strong>Civil</strong> <strong>Service</strong> to be very or fairly inefficient,<br />
compared to 17% in 2008 and 13% of respondents in 2005.<br />
As with levels of advocacy, there are differences in the perceptions of efficiency<br />
between those who had contact with the <strong>Civil</strong> <strong>Service</strong> and those who did not have<br />
contact. 65% of respondents with contact perceived the <strong>Civil</strong> <strong>Service</strong> to be very or fairly<br />
efficient, compared to 49% of respondents without contact. Equally, 24% of<br />
respondents with contact perceived the <strong>Civil</strong> <strong>Service</strong> to be very or fairly inefficient,<br />
compared to 19% of respondents without contact.<br />
Thus, while almost two-thirds (65%) of its customers perceive the <strong>Civil</strong> <strong>Service</strong> as a<br />
whole to be efficient, less than one in every two (49%) non-customers do not.<br />
30
<strong>Irish</strong> <strong>Civil</strong> <strong>Service</strong> - <strong>Customer</strong> <strong>Satisfaction</strong> <strong>Survey</strong><br />
5.3 Familiarity with the <strong>Civil</strong> <strong>Service</strong><br />
Familiarity with the <strong>Civil</strong> <strong>Service</strong> (05-09)<br />
Q. Taking into account your own experiences as well as any impressions you may have formed from any<br />
source, how familiar or unfamiliar do you feel you are with the workings of the <strong>Civil</strong> <strong>Service</strong> as they affect<br />
you<br />
54<br />
Very Familiar Fairly Familiar No Opinion Either Way<br />
Fairly Unfamiliar Very Unfamiliar Don't know<br />
% All<br />
Familiar<br />
<strong>2009</strong><br />
11%<br />
41%<br />
12%<br />
22% 11% 3%<br />
52%<br />
2008<br />
8%<br />
37%<br />
13%<br />
27%<br />
13%<br />
2%<br />
45%<br />
2005<br />
9%<br />
31%<br />
19% 29%<br />
12%<br />
40%<br />
Base: All respondents (n=2,007 in <strong>2009</strong>, n=2,002 in 2008, n=1,226 in 2005)<br />
52% of respondents felt they were familiar with the workings of the <strong>Civil</strong> <strong>Service</strong>, a<br />
significant increase in familiarity, compared to levels recorded in 2008 (45%) and 2005<br />
(40%). The proportion of respondents claiming to be fairly or very unfamiliar with the<br />
<strong>Civil</strong> <strong>Service</strong> (33%) has also decreased significantly from 2008 (40%) and 2005 (41%)<br />
levels.<br />
Once again, those with contact are much more likely to consider themselves familiar<br />
with the <strong>Irish</strong> <strong>Civil</strong> <strong>Service</strong> than those without contact. 60% of those with contact<br />
consider themselves familiar with the working of the <strong>Irish</strong> <strong>Civil</strong> <strong>Service</strong>, compared to<br />
43% of those without contact. In 2008, 33% of those without contact considered<br />
themselves familiar with the working of the <strong>Civil</strong> <strong>Service</strong>.<br />
Taken together, the comparison of results relating to familiarity from this year’s survey<br />
and previous surveys demonstrates significant rises in the level of stated awareness of<br />
the workings of the <strong>Civil</strong> <strong>Service</strong> by both customers and non-customers. This rise in<br />
awareness may be a function of the emphasis of recent public service modernisation<br />
initiatives on openness and transparency, as well as increases in media reporting of<br />
the workings of the <strong>Civil</strong> <strong>Service</strong>.<br />
31
<strong>Irish</strong> <strong>Civil</strong> <strong>Service</strong> - <strong>Customer</strong> <strong>Satisfaction</strong> <strong>Survey</strong><br />
5.4 Favourability with the <strong>Civil</strong> <strong>Service</strong><br />
Favourability with <strong>Civil</strong> <strong>Service</strong> (05-09)<br />
Q. Taking into account your own experiences or impressions, how favourable is your opinion of the way<br />
in which <strong>Civil</strong> Servants meet the needs of the public<br />
55<br />
Very Favourable Fairly Favourable No Opinion Either Way<br />
Fairly Unfavourable Very Unfavourable Don't know<br />
% All<br />
Favourable<br />
<strong>2009</strong><br />
11%<br />
41%<br />
22%<br />
16% 6% 5%<br />
52%<br />
2008<br />
9%<br />
46%<br />
23%<br />
14%<br />
5% 4%<br />
55%<br />
2005<br />
9%<br />
48%<br />
24% 10% 3%<br />
57%<br />
Base: All respondents (n=2,007 in <strong>2009</strong>, n=2,002 in 2008, n=1,226 in 2005)<br />
The <strong>2009</strong> survey shows a decrease in the proportion of respondents with very<br />
favourable or fairly favourable opinions of the way in which the <strong>Civil</strong> <strong>Service</strong> meets the<br />
needs of the public, compared to the 2008 and 2005 surveys. In 2008, 55% of<br />
respondents had a favourable opinion, compared to 57% in 2005. In <strong>2009</strong>, the<br />
proportion of respondents with favourable opinions is 52%.<br />
There is also an equivalent increase in the proportion of respondents with very<br />
unfavourable or fairly unfavourable opinions of the <strong>Civil</strong> <strong>Service</strong>, compared to 2008 and<br />
2005. In <strong>2009</strong>, the proportion of respondents with unfavourable opinions is 22%,<br />
compared to 19% in 2008 and 13% in 2005.<br />
Once again, those with contact are much more likely to have a favourable opinion of<br />
the <strong>Irish</strong> <strong>Civil</strong> <strong>Service</strong> compared to those without contact. 60% of those with contact<br />
have a favourable opinion of the <strong>Irish</strong> <strong>Civil</strong> <strong>Service</strong>, compared to 44% of those without<br />
contact.<br />
32
<strong>Irish</strong> <strong>Civil</strong> <strong>Service</strong> - <strong>Customer</strong> <strong>Satisfaction</strong> <strong>Survey</strong><br />
5.4.1 Trends in Favourability & Familiarity<br />
Typically, customer satisfaction research suggests that as familiarity with a particular<br />
organisation rises, so too does favourability. However, trends over recent surveys run<br />
contrary to this expected relationship between favourability and familiarity with the <strong>Civil</strong><br />
<strong>Service</strong>. While familiarity among the general public has increased steadily from 40% to<br />
52% between 2005 and <strong>2009</strong>, favourability has declined from 57% to 52% within the<br />
same timeframe. Thus, the level of familiarity has increased at more than twice the rate<br />
the level of favourability has been declining between 2005 and <strong>2009</strong>, as depicted in the<br />
graph below.<br />
Familiarity/Favourability with the <strong>Civil</strong> <strong>Service</strong> (05-09)<br />
Q. Taking into account your own experiences as well as any impressions you may have formed from any<br />
source, how familiar or unfamiliar do you feel you are with the workings of the <strong>Civil</strong> <strong>Service</strong> as they affect<br />
you How favourable is your opinion of the way in which <strong>Civil</strong> Servants meet the needs of the public<br />
53<br />
%<br />
100%<br />
% Very/Fairly Familiar % Very/Fairly Favourable<br />
80%<br />
60%<br />
40%<br />
57%<br />
40%<br />
55%<br />
45%<br />
52% 52%<br />
20%<br />
0%<br />
2005 2008 <strong>2009</strong><br />
Base: All respondents (n=2,007 in <strong>2009</strong>, n=2,002 in 2008, n=1,226 in 2005)<br />
As discussed in the introduction to the report, the nature of service delivery in the<br />
public sector differs from that of private sector organisations in that all members of the<br />
general public are stakeholders, though not always service users. For the <strong>Civil</strong> <strong>Service</strong>,<br />
stakeholders may have perceptions of its performance, without direct experience of the<br />
services it provides. It is important to note that, despite the small decline in favourability<br />
among the general public, satisfaction among customers remains relatively static.<br />
Furthermore, as in 2008, customers are consistently more positive in their perceptions<br />
of the <strong>Civil</strong> <strong>Service</strong> than those who have not had contact in the past 12 months.<br />
33
<strong>Irish</strong> <strong>Civil</strong> <strong>Service</strong> - <strong>Customer</strong> <strong>Satisfaction</strong> <strong>Survey</strong><br />
5.5 Perceptions of the <strong>Civil</strong> <strong>Service</strong> as an Organisation<br />
Respondents were also asked a series of statements about the <strong>Irish</strong> <strong>Civil</strong> <strong>Service</strong> and<br />
asked to what extent they agreed or disagreed with the statements. Respondents were<br />
presented with both ‘positive’ and ‘negative’ statements about the <strong>Civil</strong> <strong>Service</strong>. We<br />
begin by reporting respondents’ opinions on a selection of these ‘positive’ and<br />
‘negative’ statements before examining separately a selection of statements for which<br />
the level of agreement has significantly decreased compared to 2008.<br />
5.5.1 Positive Perceptions of the <strong>Civil</strong> <strong>Service</strong> as an<br />
Organisation<br />
<strong>Civil</strong> <strong>Service</strong> Perceptions: Positive Statements<br />
Q. Now thinking about the <strong>Irish</strong> <strong>Civil</strong> <strong>Service</strong> in general, please tell me to what extent you agree or disagree<br />
with the following statements (ranked by mean scores)<br />
Strongly Agree Agree Neither Agree nor Disagree<br />
Disagree Strongly Disagree Don't know<br />
51<br />
% All<br />
Agree<br />
The <strong>Civil</strong> <strong>Service</strong> offers good career prospects<br />
for its employees<br />
28%<br />
40%<br />
10% 5% 1%17%<br />
67%<br />
I feel that the service provided by the <strong>Civil</strong><br />
<strong>Service</strong> has improved in the last 5 years<br />
11%<br />
39%<br />
17%<br />
13% 5%<br />
15%<br />
50%<br />
The <strong>Civil</strong> <strong>Service</strong> has become more customer<br />
focussed over the past 5 years<br />
10%<br />
39%<br />
14%<br />
16%<br />
5%<br />
16%<br />
49%<br />
The <strong>Civil</strong> <strong>Service</strong> has good procedures for<br />
making complaints about levels of service<br />
received<br />
6%<br />
23%<br />
18%<br />
15%<br />
10%<br />
28%<br />
29%<br />
Base: All Respondents (2,007)<br />
Over two-thirds (67%) of respondents agreed that the <strong>Irish</strong> <strong>Civil</strong> <strong>Service</strong> offers good<br />
career prospects for its employees. Half (50%) of all respondents agreed that I feel that<br />
the service provided by the <strong>Civil</strong> <strong>Service</strong> has improved in the last 5 years and a similar<br />
proportion (49%) agreed that The <strong>Civil</strong> <strong>Service</strong> has become more customer focussed<br />
over the past 5 years. Approximately a fifth of all respondents disagree with the same<br />
two statements.<br />
Less than one-third (31%) of respondents agreed that the <strong>Civil</strong> <strong>Service</strong> has good<br />
procedures for making complaints about levels of service received, with one-quarter<br />
(25%) of respondents disagreeing with this statement.<br />
34
<strong>Irish</strong> <strong>Civil</strong> <strong>Service</strong> - <strong>Customer</strong> <strong>Satisfaction</strong> <strong>Survey</strong><br />
5.5.2 Negative Perceptions of the <strong>Civil</strong> <strong>Service</strong> as an<br />
Organisation<br />
<strong>Civil</strong> <strong>Service</strong> Perceptions: Negative Statements<br />
Q. Now thinking about the <strong>Irish</strong> <strong>Civil</strong> <strong>Service</strong> in general, please tell me to what extent you agree or disagree<br />
with the following statements (ranked by mean scores)<br />
52<br />
Strongly Agree Agree Neither Agree nor Disagree<br />
Disagree Strongly Disagree Don't know<br />
% All<br />
Agree<br />
The <strong>Civil</strong> <strong>Service</strong> has too much red tape<br />
31%<br />
39%<br />
9% 9% 3%9%<br />
70%<br />
I get most of my information about the <strong>Civil</strong><br />
<strong>Service</strong> from coverage in the newspaper, TV or<br />
radio<br />
16%<br />
52%<br />
10%<br />
15% 3% 4%<br />
68%<br />
Private sector organisations give a better service<br />
than the <strong>Civil</strong> <strong>Service</strong><br />
12%<br />
26%<br />
24%<br />
18%<br />
4% 16%<br />
38%<br />
The <strong>Civil</strong> <strong>Service</strong> is an old-fashioned<br />
organisation<br />
12%<br />
32%<br />
15%<br />
27%<br />
8% 6%<br />
44%<br />
It is difficult to get information you need from<br />
the <strong>Civil</strong> <strong>Service</strong>/Deps/ Offices<br />
13%<br />
28%<br />
12%<br />
30%<br />
8% 9%<br />
41%<br />
Base: All Respondents (2,007)<br />
70% of respondents agreed that the <strong>Civil</strong> <strong>Service</strong> has too much red tape. While the<br />
level of agreement with the statement Private sector organisations give a better service<br />
than the <strong>Civil</strong> <strong>Service</strong> is consistent with the 2008 results, there is a significant decrease<br />
in the proportion of respondents who disagreed with this statement (22%) in <strong>2009</strong>,<br />
compared to 2008 (34%).<br />
In 2008, more respondents disagreed (42%) than agreed (38%) that it is difficult to get<br />
information you need from <strong>Civil</strong> <strong>Service</strong> Departments or Offices. However, in <strong>2009</strong>, this<br />
has reversed. The proportion agreeing (41%) with this statement is higher than the<br />
proportion disagreeing (38%).<br />
Finally, 68% of respondents agreed with the statement I get most of my information<br />
about the <strong>Civil</strong> <strong>Service</strong> from coverage in the newspapers, television or radio. 74% of<br />
those without contact agreed with this statement, compared to 62% of those with<br />
contact. As previously reported, those with contact had significantly more positive<br />
perceptions than those without contact.<br />
35
<strong>Irish</strong> <strong>Civil</strong> <strong>Service</strong> - <strong>Customer</strong> <strong>Satisfaction</strong> <strong>Survey</strong><br />
5.5.3 Changes in Public Perceptions of the <strong>Civil</strong> <strong>Service</strong> as an<br />
Organisation – Declining Trust<br />
Overall, the level of agreement with both positive and negative statements is largely<br />
unchanged from 2008. However, there have been significant differences between the<br />
levels of agreement with three attitudinal statements between 2008 and <strong>2009</strong>.<br />
Changes in Public Perceptions (05-09)<br />
Q. Now thinking about the <strong>Irish</strong> <strong>Civil</strong> <strong>Service</strong> in general, please tell me to what extent you agree or disagree<br />
with the following statements (ranked by mean scores)<br />
50<br />
Agree Strongly/Fairly<br />
The <strong>Civil</strong> <strong>Service</strong> deals<br />
with people in a<br />
fair and equal way<br />
<strong>2009</strong><br />
2008<br />
2005<br />
55%<br />
62%<br />
67%<br />
The <strong>Civil</strong> <strong>Service</strong> serves<br />
all segments of society<br />
in Ireland equally<br />
<strong>2009</strong><br />
2008<br />
2005<br />
47%<br />
54%<br />
60%<br />
The <strong>Civil</strong> <strong>Service</strong><br />
is independent and<br />
trustworthy<br />
<strong>2009</strong><br />
2008<br />
2005<br />
50%<br />
61%<br />
61%<br />
Base: All respondents (n=2,007 in <strong>2009</strong>, n=2,002 in 2008, n=1,226 in 2005)<br />
As illustrated in the graph above, there have been significant decreases since 2008 in<br />
the proportion of the general public that agrees that the <strong>Civil</strong> <strong>Service</strong> is independent<br />
and trustworthy, that it serves all segments of society equally and that it deals with<br />
people in a fair and equal way. It is noteworthy that the proportions agreeing with these<br />
statements have decreased by roughly the same amount - between 11% and 13% -<br />
since 2005.<br />
The negative changes in these three statements since 2005 are particularly interesting<br />
because all three statements relate to the objectivity of the <strong>Civil</strong> <strong>Service</strong>, in terms of its<br />
independence and fairness, in dealing with customers. Despite these changes in public<br />
opinion, levels of customer satisfaction recorded over the three surveys conducted<br />
between 2005 and <strong>2009</strong> have remained consistent. Therefore, we may need to look<br />
beyond direct experiences of service delivery for explanations for the decline in the<br />
perceived independence and fairness of the <strong>Civil</strong> <strong>Service</strong>.<br />
The first explanation may relate more directly to effective communications rather than<br />
36
<strong>Irish</strong> <strong>Civil</strong> <strong>Service</strong> - <strong>Customer</strong> <strong>Satisfaction</strong> <strong>Survey</strong><br />
performance. Research conducted by Ipsos MORI in the UK consistently demonstrates<br />
a positive relationship between levels of awareness of communications by public<br />
service providers and customer satisfaction. This decline in positive perceptions of the<br />
<strong>Civil</strong> <strong>Service</strong>’s independence and fairness may be considered a communications rather<br />
than a performance challenge.<br />
A second possible explanation for this increase in negative attitudes may lie in the<br />
declining levels of trust generally, among the wider public. Most public service<br />
modernisation initiatives are often underpinned by the assumption that increasing<br />
quality will lead to increasing trust in public administration and government, generally.<br />
However, not all of these respondents have experience of <strong>Civil</strong> <strong>Service</strong> delivery. The<br />
chart below illustrates how the attitudes of those with experience of satisfactory service<br />
delivery in the last 12 months compare to those who had dissatisfactory service<br />
experiences and to those who had no experience of <strong>Civil</strong> <strong>Service</strong> delivery.<br />
Public Perceptions by Quality of Contact<br />
Q. Now thinking about the <strong>Irish</strong> <strong>Civil</strong> <strong>Service</strong> in general, please tell me to what extent you agree or<br />
disagree with the following statements<br />
The <strong>Civil</strong> <strong>Service</strong> deals with people in a fair and equal way<br />
Satisfactory experience<br />
54%<br />
Dissatisfactory experience<br />
27%<br />
No contact / neither satisfied nor dissatisfied<br />
The <strong>Civil</strong> <strong>Service</strong> serves all segments of society in Ireland equally<br />
Satisfactory experience<br />
Dissatisfactory experience<br />
32%<br />
46%<br />
66%<br />
No contact / neither satisfied nor dissatisfied<br />
The <strong>Civil</strong> <strong>Service</strong> is independent and trustworthy<br />
Satisfactory experience<br />
51%<br />
59%<br />
Dissatisfactory experience<br />
26%<br />
No contact / neither satisfied nor dissatisfied<br />
Base: Satisfactory experience (n=775), Dissatisfactory experience (n=152), No contact / no opinion (n=1,080)<br />
46%<br />
It is evident that those respondents who were satisfied with the service received were<br />
more likely to say that they agreed with the positive statements set out above. Those<br />
who had a negative experience were considerably more likely to have negative<br />
attitudes. Respondents with no contact at all, or who had no opinion (neither satisfied<br />
nor dissatisfied), generally fell between the satisfied and dissatisfied cohorts in their<br />
attitudes.<br />
37
<strong>Irish</strong> <strong>Civil</strong> <strong>Service</strong> - <strong>Customer</strong> <strong>Satisfaction</strong> <strong>Survey</strong><br />
5.5.4 Declining Levels of Trust – External Data<br />
The apparent fall in trust for the <strong>Civil</strong> <strong>Service</strong> mirrors that of other sectors, as evidenced<br />
by other data from recent studies.<br />
Ipsos MORI’s Trust in People and Professions study 1 recently examined trust in people<br />
and professions among a sample of the general public, benchmarking data from<br />
January 2010 against results first gathered in 2005. Similar declines in trust were<br />
uncovered in this survey.<br />
Trust in People and Professions: 2010 - 2005<br />
Business Leaders<br />
<strong>Civil</strong> Servants<br />
Doctors<br />
Gardaí<br />
Government Ministers<br />
Journalists<br />
Ordinary man/woman in the street<br />
Politicians generally<br />
Scientists<br />
Teachers<br />
Television news readers<br />
Trade Union officials<br />
32%<br />
29%<br />
21%<br />
23%<br />
40%<br />
45%<br />
20%<br />
21%<br />
40%<br />
47%<br />
59%<br />
63%<br />
66%<br />
62%<br />
66%<br />
2010<br />
2005<br />
92%<br />
92%<br />
77%<br />
83%<br />
80%<br />
86%<br />
89%<br />
83%<br />
82%<br />
Base: (1,000) Adults aged 16+ - Ipsos MRBI Omnibus <strong>Survey</strong>, Jan 2010<br />
The results show that just one in three of those surveyed trust business leaders (32%),<br />
albeit showing a slight increase since 2005. One in five of those surveyed trust<br />
politicians generally, with a similar proportion trusting Government Ministers – both of<br />
these results show little change since 2005. In the same time period, trust in civil<br />
servants has declined (down from 63% to 59%), journalists (from 45% to 40%) and<br />
trade union officials (down from 47% to 40%).<br />
Trust in doctors, scientists and teachers remains high, with the latter falling slightly.<br />
Trust in the Gardaí, meanwhile, has increased from 66% to 77%.<br />
1<br />
Source : Ipsos MORI – Trust in People and Professions 2010.<br />
38
<strong>Irish</strong> <strong>Civil</strong> <strong>Service</strong> - <strong>Customer</strong> <strong>Satisfaction</strong> <strong>Survey</strong><br />
Consideration of a second external report provides further evidence of this decline in<br />
trust. Edelman’s Trust Barometer (2010) 2 , a survey of opinion leaders recently<br />
published, highlights that in contrast to other European countries, Ireland is<br />
experiencing “a profound and continuing trust crisis”. The findings show that <strong>Irish</strong><br />
respondents have the lowest level of trust in politics of the 22 countries surveyed.<br />
The data shows that trust in a number of important institutions, across all areas of<br />
public life, is the lowest in Europe. Indeed, Ireland was the only country surveyed by<br />
Edelman that experienced declines in trust across four areas; business, government,<br />
media and NGOs.<br />
The results from both of these studies help to put the results of the <strong>Irish</strong> <strong>Civil</strong> <strong>Service</strong><br />
<strong>Customer</strong> <strong>Satisfaction</strong> <strong>Survey</strong> <strong>2009</strong> in context, by demonstrating that declining levels of<br />
trust are being experienced across a variety of <strong>Irish</strong> institutions and professions.<br />
2<br />
Source: http://www.edelman.ie/index.php/insights/trust-barometer/ The Edelman trust survey<br />
2010 was undertaken via telephone with a sample of 4,875 college educated 25-64 year old<br />
members of the public (“opinion leaders”) across 25 countries.<br />
39
<strong>Irish</strong> <strong>Civil</strong> <strong>Service</strong> - <strong>Customer</strong> <strong>Satisfaction</strong> <strong>Survey</strong><br />
6. Access to <strong>Service</strong>s<br />
This chapter examines the experiences and perceptions of customers and noncustomers<br />
with regard to access to services provided by the <strong>Irish</strong> <strong>Civil</strong> <strong>Service</strong>. This<br />
included the perceived convenience of current service delivery methods as well as<br />
access to necessary services by <strong>Irish</strong> language speakers and those respondents<br />
whose first language was other than <strong>Irish</strong> or English.<br />
6.1 Convenience of Contact Methods<br />
Perceived Convenience of Contact Methods (02-09)<br />
Q. Thinking of future dealing you may have with <strong>Civil</strong> <strong>Service</strong> Departments or Offices, please tell me how<br />
convenient or inconvenient each of the following methods of communication would be for you if you were<br />
contacting a Govt Dept<br />
42<br />
% very/fairly<br />
convenient<br />
By Telephone In Writing By E-mail Via Internet Visiting Dept/Office in person<br />
100%<br />
80%<br />
80%<br />
67%<br />
86%<br />
72%<br />
84%<br />
66%<br />
78%<br />
63%<br />
60%<br />
40%<br />
37%<br />
47%<br />
46%<br />
44%<br />
50% 51%<br />
45%<br />
50%<br />
48% 48%<br />
27%<br />
20%<br />
25%<br />
0%<br />
2002 2005 2008 <strong>2009</strong><br />
Base: All respondents (n=2,007 in <strong>2009</strong>, n=2,002 in 2008, n=1,226 in 2005, n=1,001 in 2002)<br />
In terms of future contact, all respondents were asked to rate how convenient or<br />
inconvenient various methods of communication would be for contacting a Government<br />
Department or Office. As one might expect, the most used method is also perceived<br />
as the most convenient. Overall, 78% of respondents would find telephone a<br />
convenient method of communication, compared to 84% of respondents in 2008.<br />
Visiting a Department or Office in person is now considered convenient by 50% of<br />
respondents, compared to 45% in 2008, 44% in 2005 and 37% in 2002.<br />
Despite the currently low levels of service uptake via electronic methods, the chart<br />
above suggests that such methods may be increasingly seen as more convenient,<br />
particularly when compared to the results for 2005 and 2002. E-mail and Internet are<br />
now considered convenient (very/fairly convenient) for around 50% of respondents.<br />
40
<strong>Irish</strong> <strong>Civil</strong> <strong>Service</strong> - <strong>Customer</strong> <strong>Satisfaction</strong> <strong>Survey</strong><br />
While this underlines the importance of monitoring the potential for the development of<br />
electronic service delivery where appropriate, it is important to remember that the chart<br />
above represents the perceived convenience of such forms of contact for all members<br />
of the general public. It remains the case that electronic service methods have seen<br />
low levels of uptake by existing customers for existing services. For example, 34% of<br />
respondents from lower socio-economic occupational groupings consider e-mail<br />
contact to be personally convenient, compared to 63% of respondents from higher<br />
socio-economic occupational groupings.<br />
6.2 Language <strong>Service</strong>s<br />
Those respondents who required <strong>Irish</strong> language services and those whose first<br />
language was neither <strong>Irish</strong> nor English were also asked about their experience of<br />
accessing necessary services from <strong>Irish</strong> <strong>Civil</strong> <strong>Service</strong> Departments or Offices.<br />
6.2.1 <strong>Irish</strong> Language <strong>Service</strong>s<br />
The purpose of the 2003 Official Languages Act is to ensure that those who require the<br />
availability of <strong>Irish</strong> language services for dealing with the <strong>Civil</strong> <strong>Service</strong>, or any other<br />
official purpose in the State, can access necessary services in <strong>Irish</strong>. Of the total<br />
sample, only 2% had ever used a service from the <strong>Irish</strong> <strong>Civil</strong> <strong>Service</strong> in the <strong>Irish</strong><br />
language. A similar proportion, 2%, also expressed a preference for receiving services<br />
in <strong>Irish</strong>, if the levels and quality of the services offered were the same in both <strong>Irish</strong> and<br />
English. Of those who had accessed <strong>Irish</strong> language services, 67% were very satisfied<br />
or fairly satisfied with the level of service received in the <strong>Irish</strong> language. 13% were very<br />
dissatisfied or fairly dissatisfied with the level of service received.<br />
However, it is worth bearing in mind that, while the overall survey sample is<br />
representative of the population as a whole, this small sample of <strong>Irish</strong> language service<br />
users is unlikely to be wholly representative of the <strong>Irish</strong>-speaking population and does<br />
not represent a reliable basis for service-critical policy decisions in this area.<br />
41
<strong>Irish</strong> <strong>Civil</strong> <strong>Service</strong> - <strong>Customer</strong> <strong>Satisfaction</strong> <strong>Survey</strong><br />
6.2.2 <strong>Satisfaction</strong> with Access to <strong>Service</strong>s (other languages)<br />
<strong>Satisfaction</strong> with Access to <strong>Service</strong>s (05-09)<br />
60<br />
Q. How satisfied or dissatisfied are you with access to necessary services from the <strong>Civil</strong> <strong>Service</strong><br />
Very Satisfied<br />
Neither Satisfied nor Dissatisfied<br />
Very Dissatisfied<br />
Fairly Satisfied<br />
Fairly Dissatisfied<br />
Don't know<br />
% All<br />
Satisfied<br />
<strong>2009</strong><br />
21%<br />
32%<br />
18%<br />
3% 3% 23%<br />
53%<br />
2008<br />
23%<br />
37%<br />
14%<br />
5% 3%<br />
18%<br />
60%<br />
2005<br />
9%<br />
55%<br />
19% 14%<br />
21%<br />
64%<br />
Base: All Respondents whose 1 st language is something other than <strong>Irish</strong> or English (n=70 in 2005, n=127 in 2008 and n=107 in <strong>2009</strong>)<br />
5% of the sample claimed to have a first language that is something other than <strong>Irish</strong> or<br />
English. This sub-group were then asked how satisfied they were with access to<br />
necessary services from the <strong>Civil</strong> <strong>Service</strong>. 53% of those with a first language other than<br />
<strong>Irish</strong> or English were satisfied with the access to necessary services from the <strong>Civil</strong><br />
<strong>Service</strong>. Only 6% were dissatisfied, compared to 8% in 2008 and 14% in 2005. This<br />
might be illustrative of ongoing work being done by the <strong>Civil</strong> <strong>Service</strong> to meet the needs<br />
of this customer base. However, because of the small sample who answered this<br />
question, this result should only be considered indicative.<br />
42
<strong>Irish</strong> <strong>Civil</strong> <strong>Service</strong> - <strong>Customer</strong> <strong>Satisfaction</strong> <strong>Survey</strong><br />
7. Understanding <strong>Customer</strong> Contact<br />
The <strong>Irish</strong> <strong>Civil</strong> <strong>Service</strong> customer survey provides an objective evaluation of customer<br />
satisfaction with overall levels of service provided by <strong>Civil</strong> <strong>Service</strong> Departments and<br />
Offices, as well as public attitudes to and perceptions of the <strong>Civil</strong> <strong>Service</strong> as a whole.<br />
While the <strong>2009</strong> survey results are largely positive, showing that overall levels of<br />
customer satisfaction are consistent with previous surveys, the findings relating to<br />
customer dissatisfaction discussed in the 2008 customer survey report also remain<br />
relevant 3 .<br />
The purpose of this section is to extend our understanding of satisfaction by analysing<br />
different aspects of customer contact and their relevance to customers’ evaluations of<br />
service delivery. This is discussed with specific reference to the Department for Social<br />
& Family Affairs (DSFA) and the Office of the Revenue Commissioners (Revenue), as<br />
exemplars of two contrasting <strong>Civil</strong> <strong>Service</strong> customer experiences.<br />
7.1 The Nature of <strong>Customer</strong> Contact<br />
There have been significant changes in the nature of customer contact in the period<br />
between 2005 and <strong>2009</strong>. Specifically, the proportion of DSFA customers as a<br />
proportion of all <strong>Civil</strong> <strong>Service</strong> customers has been rising since 2005, while the<br />
proportion of Revenue customers has been steadily falling. In <strong>2009</strong>, approximately one<br />
in every four (26%) members of the public had contact with DSFA, compared to<br />
roughly one in every ten (11%) who had contact with Revenue.<br />
As these two Departments account for the majority of public contact with the <strong>Civil</strong><br />
<strong>Service</strong>, customer experiences with both Departments have a significant influence on<br />
the overall level of customer satisfaction with the <strong>Irish</strong> <strong>Civil</strong> <strong>Service</strong>. The chart overleaf<br />
shows the significant difference between the overall satisfaction with service of DSFA<br />
customers and that of Revenue customers.<br />
3<br />
The five most common explanations for dissatisfaction provided by respondents in 2008 were:<br />
process too slow or complex; attitude of staff; perceived lack of knowledge or information not<br />
provided; lack of privacy and waiting time for phone or left holding.<br />
43
<strong>Irish</strong> <strong>Civil</strong> <strong>Service</strong> - <strong>Customer</strong> <strong>Satisfaction</strong> <strong>Survey</strong><br />
Overall <strong>Satisfaction</strong> with <strong>Service</strong> - DSFA & Revenue<br />
Q. Thinking of the most recent contact you had with a <strong>Civil</strong> <strong>Service</strong> Department or Office – overall how<br />
satisfied or dissatisfied were you with the service you received<br />
19<br />
Very Satisfied<br />
Fairly Satisfied<br />
Neither Satisfied nor Dissatisfied<br />
Don’t know<br />
Fairly Dissatisfied<br />
Very Dissatisfied<br />
Dept of Social & Family Affairs<br />
Office of Revenue Commissioners<br />
18%<br />
dissatisfied<br />
6%<br />
10%<br />
8% 1%<br />
34%<br />
75%<br />
satisfied<br />
9%<br />
dissatisfied<br />
3% 5%<br />
4%<br />
1%<br />
40%<br />
86%<br />
satisfied<br />
41%<br />
47%<br />
Base: All who had any contact with the<br />
DSFA in the last 12 months (n=438)<br />
Base: All who had any contact with the<br />
Revenue in the last 12 months (n=146)<br />
While 75% of DSFA customers are satisfied with the level of service they received on<br />
their most recent contact with the Department, 86% of Revenue customers are<br />
satisfied. Similarly, dissatisfaction is significantly higher among DSFA customers<br />
(18%), compared to Revenue customers (9%). Thus, the average experience of DSFA<br />
customers is significantly less satisfactory than that of Revenue customers.<br />
There are a number of possible explanations for the different levels of satisfaction<br />
recorded by DSFA and Revenue customers which relate to the nature of contacts they<br />
are likely to have with the <strong>Civil</strong> <strong>Service</strong>. The first possible explanation is the level of<br />
contact customers have with individual Departments.<br />
44
<strong>Irish</strong> <strong>Civil</strong> <strong>Service</strong> - <strong>Customer</strong> <strong>Satisfaction</strong> <strong>Survey</strong><br />
Top 3 Depts - Frequency of Contact (05-09)<br />
Q. How frequently have you contacted those Departments in the last year<br />
(ranked by highest respondent base)<br />
Once 2-4 times 5+ times<br />
8<br />
Dept of Social<br />
& Family Affairs<br />
<strong>2009</strong><br />
2008<br />
2005<br />
27%<br />
28%<br />
35%<br />
45%<br />
48%<br />
45%<br />
26%<br />
21%<br />
22%<br />
23% 53% 19%<br />
Office of<br />
the Revenue<br />
Commissioners<br />
<strong>2009</strong><br />
2008<br />
2005<br />
41%<br />
30%<br />
32%<br />
39%<br />
37%<br />
47%<br />
14%<br />
13%<br />
19%<br />
56% 29%<br />
Dept of Foreign Affairs<br />
(incl. Passport office)<br />
<strong>2009</strong><br />
2008<br />
69%<br />
23% 4%<br />
64% 19% 13%<br />
Base: All Respondents who have been in contact with each Dept<br />
As displayed above, Revenue customers are significantly more likely to have had a<br />
single contact with the Office, compared to DSFA customers who are significantly more<br />
likely to have multiple contacts with the Department. In <strong>2009</strong>, there are almost as many<br />
DSFA customers who contacted the Department five or more times (26%) in the last 12<br />
months as there are customers who contacted the Department once (27%). Only 13%<br />
of Revenue customers had contact five or more times with the Office. This would<br />
suggest that the processes involved in resolving contacts with the DSFA is<br />
considerably longer, on average, than when dealing with Revenue. By way of<br />
comparison, we can also see that 69% of respondents who had contact with the<br />
Department of Foreign Affairs (including the Passport Office) in <strong>2009</strong> contacted the<br />
Department only once. This might be a result of process improvements in passport<br />
application and other systems in recent years.<br />
In 2008 and <strong>2009</strong>, the single most frequently identified reason for dissatisfaction with<br />
service delivery was that the process was too slow or complex. As we have seen,<br />
timeliness and speed of delivery is a consistent feature of the improvements required<br />
by <strong>Civil</strong> <strong>Service</strong> customers across contact methods. However, the process involved for<br />
certain services, such as renewing a passport, can be considerably more<br />
straightforward than others, such as registering for social welfare services, and the<br />
length of the process necessarily gives rise to greater potential for dissatisfaction.<br />
The nature of many DSFA services is that customers typically make contact in person<br />
by visiting local social welfare offices. As personal visits require travel to and from<br />
45
<strong>Irish</strong> <strong>Civil</strong> <strong>Service</strong> - <strong>Customer</strong> <strong>Satisfaction</strong> <strong>Survey</strong><br />
Departments, as well as waiting time at the office, they will, all things being equal,<br />
involve a greater investment of time than alternative contact methods for each single<br />
contact a customer makes. The contrast in the distribution of contact methods used to<br />
contact the DSFA and Revenue is displayed below.<br />
Method of Most Recent Contact – DSFA & Revenue<br />
Q. Thinking about this most recent contact, did you mainly deal with the relevant Department or Office by<br />
telephone, in writing, by e-mail, via a website or in person<br />
15<br />
By phone<br />
30%<br />
41%<br />
50%<br />
In person<br />
21%<br />
41%<br />
61%<br />
In writing<br />
Via Internet<br />
12%<br />
8%<br />
19%<br />
4%<br />
7%<br />
<strong>2009</strong><br />
DSFA<br />
Revenue<br />
Through e-mail<br />
2%<br />
3%<br />
Base: All who had any contact with a Govt Dept/Office in the last 12 months (n=992 in <strong>2009</strong>, DSFA n=438, Revenue n=146 )<br />
Overall, the proportion of <strong>Civil</strong> <strong>Service</strong> customers who made their most recent contact<br />
by phone is the same as the proportion whose most recent contact was in person.<br />
However, 61% of DSFA customers’ most recent contact was in person, compared to<br />
21% of Revenue customers. 30% of DSFA customers’ most recent contact was by<br />
phone, compared to 50% of Revenue customers. Because of the number of variables<br />
involved in visiting Government offices, such as the physical environment, queuing<br />
system, opening hours, and office location, contact in person is often a more complex<br />
process than contact by phone or electronic means. Again, this may give rise to greater<br />
potential for a dissatisfactory customer experience.<br />
The DSFA customer experience is therefore more likely to involve multiple, ‘in person’<br />
contacts with the Department whereas Revenue customers are more likely to have a<br />
single contact by phone or electronic means. Across all services, regardless of contact<br />
method, the challenge for the <strong>Civil</strong> <strong>Service</strong> is to reduce the complexity of service<br />
delivery for users. For example, Revenue now delivers a number of its services to<br />
personal and business customers through online interactive services.<br />
However, this is only possible where such forms of service delivery are appropriate to<br />
46
<strong>Irish</strong> <strong>Civil</strong> <strong>Service</strong> - <strong>Customer</strong> <strong>Satisfaction</strong> <strong>Survey</strong><br />
customers’ needs and requirements and, while the general public now view internet or<br />
e-mail contact to be as convenient as personal contact, less than 1% of DSFA<br />
customers made contact by e-mail or via Internet. DSFA customers are also more than<br />
twice as likely as Revenue customers to consider either internet or e-mail contact to be<br />
inconvenient. Thus, while electronic service delivery is an attractive model when<br />
considering the relative efficiency of different service delivery methods, e-services are<br />
not equally accessible to all customer cohorts.<br />
7.2 Measuring Performance<br />
Given the incredibly diverse nature of services provided by the <strong>Civil</strong> <strong>Service</strong> as a<br />
whole, there is no equivalent organisation against which a direct and meaningful<br />
comparison can be made, in terms of performance. Nonetheless, these customer<br />
surveys provide a temporal point of comparison and the <strong>2009</strong> customer survey results<br />
demonstrate consistency in the perceived quality of service delivery by the <strong>Civil</strong> <strong>Service</strong><br />
at an overall level, when compared with previous surveys. They also illustrate how<br />
customer experiences (and requirements) differ in specific contexts and across contact<br />
methods, depending on the nature of the services involved. This undermines<br />
somewhat the usefulness of a single benchmark of performance for the <strong>Civil</strong> <strong>Service</strong>.<br />
Just as the complexity of the customer experience differs from service to service, so<br />
should the level of customer satisfaction, the “Frontier of Performance”, that any<br />
individual service is expected to achieve. Some services, such as renewing a passport<br />
or obtaining a tax clearance certificate, are simply more easily administered than others<br />
and, from a user’s point of view, easier to consume. A deeper understanding of <strong>Civil</strong><br />
<strong>Service</strong> customer journeys will ensure that services provided by individual Departments<br />
and Offices reflect the requirements and expectation of their customers, but could also<br />
be used to develop appropriate targets for individual services.<br />
Ultimately, the challenge for the <strong>Civil</strong> <strong>Service</strong> is to continue to deliver high-quality<br />
services which are appropriate to the needs of each specific user.<br />
47