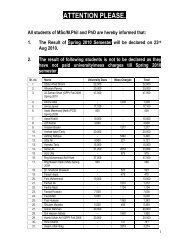
OPINION Vol.1, No.1 June 2013 - National Defence University
OPINION Vol.1, No.1 June 2013 - National Defence University
OPINION Vol.1, No.1 June 2013 - National Defence University

You also want an ePaper? Increase the reach of your titles
YUMPU automatically turns print PDFs into web optimized ePapers that Google loves.
In present day Asia, three big demographic tendencies are exerting influence on the region’s economic and<br />
political calculus. The first is rapid population aging, especially in East Asia. By 2025 China’s median age<br />
may be approaching 40 years, and Japan’s may well exceed 50. Second is an adverse mortality trend— in<br />
Russia already, but possibly in China and India as well stand to constrain options for some emerging actors<br />
on the Eurasian stage. Finally, the strange and unnatural phenomenon of rising ratios at birth in favour of<br />
females has been extending over much of the Asia terrain.<br />
For further revealing comparison , if we consider the two-generation sweep from 1975 to 2025,in<br />
which we are currently (more or less) at three quarter point, we will observe that relative population weight<br />
is poised to shift for various dyads 5 , few important ones are :-<br />
India/China. By the UNDP’s “medium variant” projections, between 1975 and 2025, China’s<br />
population would grow by about half, from about 930 million to over 1.4 billion. India’s, on the<br />
other hand, would increase to more than double, jumping from around 620 million to over 1.3<br />
billion. A generation ago, there were nearly 50 % more people in China than in India; a generation<br />
hence, the projected differential would be a mere 5 %. The management pattern is quite divergent<br />
in both the cases and has academic value.<br />
Pakistan/Russia. The most radical shift in the relative population weight of major countries in<br />
the region, would involve Pakistan and Russia. In 1975, Erstwhile USSR population was nearly<br />
twice as large as Pakistan’s (134 vs. 70 million). By 2025, under “medium variant” projections, the<br />
situation will be virtually reversed: Pakistan would be just over twice as populous as Russia (250<br />
vs. 124 million) 6 .<br />
Important Constituents of Demographics of Pakistan and its Implications<br />
Population Size and Growth. The areas, which now constitute Pakistan, is the area of the Indus<br />
Valley Civilization, one of the oldest in the world dating back at least 5000 years, the population was<br />
dependent on the Indus River System. The area has a history of consistent census undertaking since 1901.<br />
Since both fertility and mortality remained high during first half of the twentieth century, the size of<br />
population hardly doubled. In the post-world war II span, decline in mortality followed and population<br />
grew rapidly. In 1951, when the first census of Pakistan was taken, the population was recorded as 33.8<br />
million. The inter-census growth rate between 1961 and 1972 touched 3.7 per cent level, while overall the<br />
population of Pakistan experienced an increase of more than six times during the post-independence 65<br />
years period. The current population of Pakistan is estimated around 180 million and has become the 6th<br />
most populous country in the world. The current population growth rate is at steady level of around 2 per<br />
cent per annum. The population density has increased from 43 persons in 1951 to present 185 persons per<br />
sq. km. As per UNDP estimates, the population of the country is likely to touch approx. 310 million in<br />
2050.<br />
Impact on Socio-economic Development. This rapid population growth in Pakistan, which has<br />
been one of the highest among developing countries, has been offsetting the gains in social and economic<br />
development. A comparison can be made between Pakistan and South Korea from 1950 to 2011 in regards<br />
to per capita income and population growth. In 1950, Pakistan and South Korea had same level of per<br />
capita income, that is, 79 and 82 US dollars respectively, in 2011, PPP(Parity Purchase Power) was<br />
estimated around 2800 US $ compared to 30100 US dollars of South Korea. In 1951 our population was 33<br />
million with 1.8 per cent per annum growth rate; in 2012 our population is approx. 180 million with 2 per<br />
cent per annum growth rate. In contrast to this, in 1950 South Korea’s population was 20 million with 3.0<br />
per cent per annum growth rate. In 2012, South Korea’s population was estimated around 49 million with<br />
0.8 per cent per annum growth rate. This indicates that Pakistan has added 6 times population compared to<br />
2.5 times of South Korea. There may be several factors of this large differential in per capita income.<br />
However, the major factors are that we could not control our fast population growth and suffered from<br />
inconsistent national policy and lack of Developmental Strategy during these years, whereas South Korea<br />
has been able to contain its fast growth of population and treaded on a better national vision.<br />
Age Structure and Youth Bulge. Population can usefully be divided into three age groupsyoung<br />
dependent under age 15, the working age population between the ages 15-64, and old age dependent<br />
at ages 65 and over. The last half of the twentieth century, especially the last three decades in Pakistan has<br />
been marked by rapid fertility decline. The total youth population of Pakistan has touched more than 60 %<br />
of the country’s population; this youth bulge (almost 100 million) can be converted into demographic<br />
dividend, which demands its exploitation through planning and vision.<br />
<strong>OPINION</strong> <strong>Vol.1</strong> <strong>No.1</strong> 93 <strong>June</strong> <strong>2013</strong>