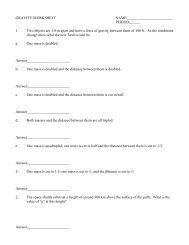
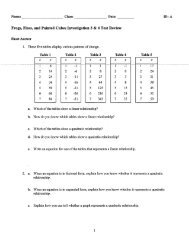
Scatter Plot Worksheet For questions 1-3 a. Identify the correlation of ...
Scatter Plot Worksheet For questions 1-3 a. Identify the correlation of ...
Scatter Plot Worksheet For questions 1-3 a. Identify the correlation of ...

Create successful ePaper yourself
Turn your PDF publications into a flip-book with our unique Google optimized e-Paper software.
Name: ________________________________<br />
8. Make a scatter plot for <strong>the</strong> data. If <strong>the</strong>re is a trend, draw a trend line and write <strong>the</strong> equation <strong>of</strong> <strong>the</strong><br />
trend line.<br />
In <strong>questions</strong> 9 & 10, use <strong>the</strong> scatter plot at right. The<br />
scatter plot shows <strong>the</strong> average salaries for<br />
Pr<strong>of</strong>essors <strong>of</strong> Public Institutions <strong>of</strong> Higher Education<br />
in thousands <strong>of</strong> dollars for years 1988 through 1994<br />
where t = 8 corresponds to 1988<br />
9. What was <strong>the</strong> average salary in 1991<br />
10. Estimate <strong>the</strong> average salary in 1998. (Hint: draw a trend line)