

A spatially resolved study of ionized regions in galaxies at different ...
A spatially resolved study of ionized regions in galaxies at different ...
A spatially resolved study of ionized regions in galaxies at different ...

Create successful ePaper yourself
Turn your PDF publications into a flip-book with our unique Google optimized e-Paper software.
60 3 • IFS <strong>of</strong> a GEHR <strong>in</strong> NGC 6946<br />
1e−15<br />
1.0<br />
0.8<br />
[SIII] 9532<br />
◦A−1<br />
)<br />
s−2<br />
Flux (erg cm−2<br />
0.6<br />
0.4<br />
[SIII] 9069<br />
0.2<br />
Absorption correction factor<br />
0.0<br />
2.2<br />
2.0<br />
1.8<br />
1.6<br />
1.4<br />
1.2<br />
1.0<br />
8800 9000 9200 9400 9600 9800<br />
Wavelength (◦A)<br />
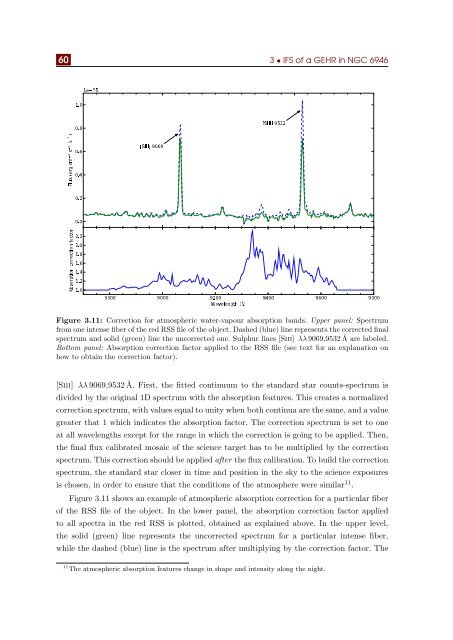
Figure 3.11: Correction for <strong>at</strong>mospheric w<strong>at</strong>er-vapour absorption bands. Upper panel: Spectrum<br />
from one <strong>in</strong>tense fiber <strong>of</strong> the red RSS file <strong>of</strong> the object. Dashed (blue) l<strong>in</strong>e represents the corrected f<strong>in</strong>al<br />
spectrum and solid (green) l<strong>in</strong>e the uncorrected one. Sulphur l<strong>in</strong>es [Siii] λλ 9069,9532 Å are labeled.<br />
Bottom panel: Absorption correction factor applied to the RSS file (see text for an explan<strong>at</strong>ion on<br />
how to obta<strong>in</strong> the correction factor).<br />
[Siii] λλ 9069,9532 Å. First, the fitted cont<strong>in</strong>uum to the standard star counts-spectrum is<br />
divided by the orig<strong>in</strong>al 1D spectrum with the absorption fe<strong>at</strong>ures. This cre<strong>at</strong>es a normalized<br />
correction spectrum, with values equal to unity when both cont<strong>in</strong>ua are the same, and a value<br />
gre<strong>at</strong>er th<strong>at</strong> 1 which <strong>in</strong>dic<strong>at</strong>es the absorption factor. The correction spectrum is set to one<br />
<strong>at</strong> all wavelengths except for the range <strong>in</strong> which the correction is go<strong>in</strong>g to be applied. Then,<br />
the f<strong>in</strong>al flux calibr<strong>at</strong>ed mosaic <strong>of</strong> the science target has to be multiplied by the correction<br />
spectrum. This correction should be applied after the flux calibr<strong>at</strong>ion. To build the correction<br />
spectrum, the standard star closer <strong>in</strong> time and position <strong>in</strong> the sky to the science exposures<br />
is chosen, <strong>in</strong> order to ensure th<strong>at</strong> the conditions <strong>of</strong> the <strong>at</strong>mosphere were similar 11 .<br />
Figure 3.11 shows an example <strong>of</strong> <strong>at</strong>mospheric absorption correction for a particular fiber<br />
<strong>of</strong> the RSS file <strong>of</strong> the object. In the lower panel, the absorption correction factor applied<br />
to all spectra <strong>in</strong> the red RSS is plotted, obta<strong>in</strong>ed as expla<strong>in</strong>ed above. In the upper level,<br />
the solid (green) l<strong>in</strong>e represents the uncorrected spectrum for a particular <strong>in</strong>tense fiber,<br />
while the dashed (blue) l<strong>in</strong>e is the spectrum after multiply<strong>in</strong>g by the correction factor. The<br />
11 The <strong>at</strong>mospheric absorption fe<strong>at</strong>ures change <strong>in</strong> shape and <strong>in</strong>tensity along the night.


