RA 00110.pdf - OAR@ICRISAT
RA 00110.pdf - OAR@ICRISAT
RA 00110.pdf - OAR@ICRISAT

Create successful ePaper yourself
Turn your PDF publications into a flip-book with our unique Google optimized e-Paper software.
800<br />
600<br />
400<br />
200<br />
0<br />
800<br />
600<br />
400<br />
200<br />
L o c a l c o n t r o l<br />
Souna 3, Sahel 1982<br />
IKMV, Sudan Savanna, 1983 1<br />
IKMV, S a h e l , 1983 2<br />
Z e r o<br />
f e r t i l i z e d<br />
p l o t s<br />
200 400 600 800<br />
Mean g r a i n y i e l d ( k g h a " 1 )<br />
a t each s i t e<br />
F e r t i l i z e d<br />
p l o t s<br />
0<br />
200 400 600 800<br />
Mean g r a i n y i e l d ( k g h a - 1 )<br />
a t each s i t e<br />
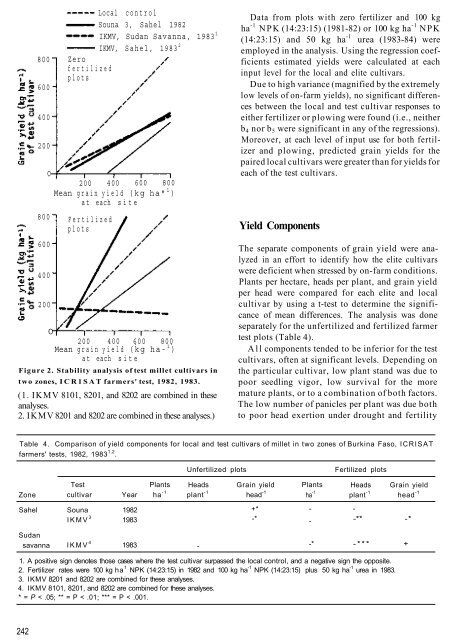
Figure 2. Stability analysis of test millet cultivars in<br />
two zones, I C R 1 S A T farmers' test, 1982, 1983.<br />
(1. IKMV 8101, 8201, and 8202 are combined in these<br />
analyses.<br />
2. IKMV 8201 and 8202 are combined in these analyses.)<br />
Data from plots with zero fertilizer and 100 kg<br />
ha -1 NPK (14:23:15) (1981-82) or 100 kg ha -1 NPK<br />
(14:23:15) and 50 kg ha -1 urea (1983-84) were<br />
employed in the analysis. Using the regression coefficients<br />
estimated yields were calculated at each<br />
input level for the local and elite cultivars.<br />
Due to high variance (magnified by the extremely<br />
low levels of on-farm yields), no significant differences<br />
between the local and test cultivar responses to<br />
either fertilizer or plowing were found (i.e., neither<br />
b 4 nor b 5 were significant in any of the regressions).<br />
Moreover, at each level of input use for both fertilizer<br />
and plowing, predicted grain yields for the<br />
paired local cultivars were greater than for yields for<br />
each of the test cultivars.<br />
Yield Components<br />
The separate components of grain yield were analyzed<br />
in an effort to identify how the elite cultivars<br />
were deficient when stressed by on-farm conditions.<br />
Plants per hectare, heads per plant, and grain yield<br />
per head were compared for each elite and local<br />
cultivar by using a t-test to determine the significance<br />
of mean differences. The analysis was done<br />
separately for the unfertilized and fertilized farmer<br />
test plots (Table 4).<br />
A l l components tended to be inferior for the test<br />
cultivars, often at significant levels. Depending on<br />
the particular cultivar, low plant stand was due to<br />
poor seedling vigor, low survival for the more<br />
mature plants, or to a combination of both factors.<br />
The low number of panicles per plant was due both<br />
to poor head exertion under drought and fertility<br />
Table 4. Comparison of yield components for local and test cultivars of millet in two zones of Burkina Faso, I C R I S A T<br />
farmers' tests, 1982, 1983 1,2 .<br />
Unfertilized plots<br />
Fertilized plots<br />
Zone<br />
Test<br />
Plants<br />
cultivar Year ha -1<br />
Heads Grain yield<br />
plant -1 head -1<br />
Plants<br />
ha -1<br />
Heads Grain yield<br />
plant -1 head -1<br />
Sahel<br />
Souna 1982<br />
I K M V 3 1983<br />
+*<br />
-*<br />
-<br />
-<br />
-<br />
-** -*<br />
Sudan<br />
savanna<br />
I K M V 4 1983<br />
-<br />
-*<br />
- * * * +<br />
1. A positive sign denotes those cases where the test cultivar surpassed the local control, and a negative sign the opposite.<br />
2. Fertilizer rates were 100 kg ha 1 NPK (14:23:15) in 1982 and 100 kg ha -1 NPK (14:23:15) plus 50 kg ha -1 urea in 1983.<br />
3. IKMV 8201 and 8202 are combined for these analyses.<br />
4. IKMV 8101, 8201, and 8202 are combined for these analyses.<br />
* = P < .05; ** = P < .01; *** = P < .001.<br />
242