the high/scope preschool curriculum comparison study through
the high/scope preschool curriculum comparison study through
the high/scope preschool curriculum comparison study through

You also want an ePaper? Increase the reach of your titles
YUMPU automatically turns print PDFs into web optimized ePapers that Google loves.
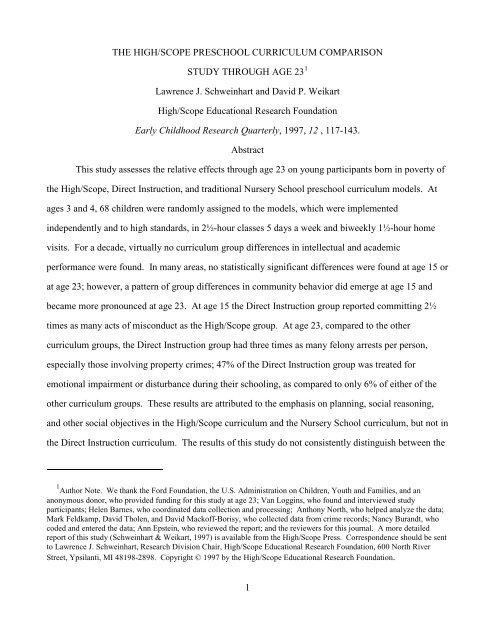
THE HIGH/SCOPE PRESCHOOL CURRICULUM COMPARISON<br />
STUDY THROUGH AGE 23 1<br />
Lawrence J. Schweinhart and David P. Weikart<br />
High/Scope Educational Research Foundation<br />
Early Childhood Research Quarterly, 1997, 12 , 117-143.<br />
Abstract<br />
This <strong>study</strong> assesses <strong>the</strong> relative effects <strong>through</strong> age 23 on young participants born in poverty of<br />
<strong>the</strong> High/Scope, Direct Instruction, and traditional Nursery School <strong>preschool</strong> <strong>curriculum</strong> models. At<br />
ages 3 and 4, 68 children were randomly assigned to <strong>the</strong> models, which were implemented<br />
independently and to <strong>high</strong> standards, in 2½-hour classes 5 days a week and biweekly 1½-hour home<br />
visits. For a decade, virtually no <strong>curriculum</strong> group differences in intellectual and academic<br />
performance were found. In many areas, no statistically significant differences were found at age 15 or<br />
at age 23; however, a pattern of group differences in community behavior did emerge at age 15 and<br />
became more pronounced at age 23. At age 15 <strong>the</strong> Direct Instruction group reported committing 2½<br />
times as many acts of misconduct as <strong>the</strong> High/Scope group. At age 23, compared to <strong>the</strong> o<strong>the</strong>r<br />
<strong>curriculum</strong> groups, <strong>the</strong> Direct Instruction group had three times as many felony arrests per person,<br />
especially those involving property crimes; 47% of <strong>the</strong> Direct Instruction group was treated for<br />
emotional impairment or disturbance during <strong>the</strong>ir schooling, as compared to only 6% of ei<strong>the</strong>r of <strong>the</strong><br />
o<strong>the</strong>r <strong>curriculum</strong> groups. These results are attributed to <strong>the</strong> emphasis on planning, social reasoning,<br />
and o<strong>the</strong>r social objectives in <strong>the</strong> High/Scope <strong>curriculum</strong> and <strong>the</strong> Nursery School <strong>curriculum</strong>, but not in<br />
<strong>the</strong> Direct Instruction <strong>curriculum</strong>. The results of this <strong>study</strong> do not consistently distinguish between <strong>the</strong><br />
1 Author Note. We thank <strong>the</strong> Ford Foundation, <strong>the</strong> U.S. Administration on Children, Youth and Families, and an<br />
anonymous donor, who provided funding for this <strong>study</strong> at age 23; Van Loggins, who found and interviewed <strong>study</strong><br />
participants; Helen Barnes, who coordinated data collection and processing; Anthony North, who helped analyze <strong>the</strong> data;<br />
Mark Feldkamp, David Tholen, and David Mackoff-Borisy, who collected data from crime records; Nancy Burandt, who<br />
coded and entered <strong>the</strong> data; Ann Epstein, who reviewed <strong>the</strong> report; and <strong>the</strong> reviewers for this journal. A more detailed<br />
report of this <strong>study</strong> (Schweinhart & Weikart, 1997) is available from <strong>the</strong> High/Scope Press. Correspondence should be sent<br />
to Lawrence J. Schweinhart, Research Division Chair, High/Scope Educational Research Foundation, 600 North River<br />
Street, Ypsilanti, MI 48198-2898. Copyright © 1997 by <strong>the</strong> High/Scope Educational Research Foundation.<br />
1
long-term effectiveness of <strong>the</strong> High/Scope and traditional Nursery School <strong>curriculum</strong>s, but <strong>the</strong><br />
High/Scope <strong>curriculum</strong> model is more readily replicated because of its more precise definition. These<br />
findings argue against using Direct Instruction in <strong>preschool</strong> programs and for using a well-defined<br />
<strong>curriculum</strong> model based on child-initiated learning activities.<br />
2
THE HIGH/SCOPE PRESCHOOL CURRICULUM<br />
COMPARISON STUDY THROUGH AGE 23<br />
The High/Scope Preschool Curriculum Comparison <strong>study</strong> was designed in <strong>the</strong> late 1960s<br />
to assess which of three <strong>preschool</strong> <strong>curriculum</strong> models worked best for young children living in<br />
poverty. By <strong>the</strong> time <strong>the</strong>y reached young adulthood, <strong>the</strong> hypo<strong>the</strong>sis was that young people born<br />
in poverty would achieve greater success and manifest greater social responsibility if <strong>the</strong>y had<br />
attended a High/Scope or traditional Nursery School <strong>preschool</strong> program than if <strong>the</strong>y had attended<br />
a Direct Instruction <strong>preschool</strong> program. This hypo<strong>the</strong>sis assumes critical importance in light of<br />
<strong>the</strong> findings of <strong>the</strong> High/Scope Perry Preschool <strong>study</strong> that young people born in poverty have<br />
greater educational and economic success and half <strong>the</strong> crime rate if <strong>the</strong>y attend a <strong>high</strong>-quality<br />
<strong>preschool</strong> program than if <strong>the</strong>y do not attend a <strong>preschool</strong> program and that such programs return<br />
seven dollars to taxpayers for every dollar invested (Schweinhart, Barnes, & Weikart, 1993).<br />
The question <strong>the</strong>n becomes whe<strong>the</strong>r <strong>the</strong>se benefits result equally from all <strong>curriculum</strong> approaches<br />
from some more than from o<strong>the</strong>rs. This report addresses this question with data from a followup<br />
of <strong>the</strong> original <strong>study</strong> participants when <strong>the</strong>y were 23 years old.<br />
Previous Findings from this Study<br />
Weikart and his colleagues began this <strong>study</strong> in 1967 to assess <strong>the</strong> relative effects of three<br />
diverse <strong>preschool</strong> <strong>curriculum</strong> models---High/Scope, Direct Instruction, and traditional Nursery<br />
School. Project staff employed a stratified random assignment procedure to assign 68 young<br />
children living in poverty in Ypsilanti, Michigan, to each of <strong>the</strong> <strong>preschool</strong> <strong>curriculum</strong> models,<br />
which <strong>the</strong>y experienced for one or two school years at ages 3 and 4. Through age 10, <strong>the</strong> only<br />
<strong>curriculum</strong> group difference on intellectual tests was that <strong>the</strong> Direct Instruction group had a<br />
significantly <strong>high</strong>er mean IQ on <strong>the</strong> Stanford-Binet Intelligence Test (Terman & Merrill, 1960)<br />
than did <strong>the</strong> Nursery School group at <strong>the</strong> end of <strong>the</strong> <strong>preschool</strong> program at age 5 (Weikart,<br />
Epstein, Schweinhart, & Bond, 1978). This 10-point difference, however, was not so large as <strong>the</strong><br />
3
mean IQ increases for each of <strong>the</strong> <strong>curriculum</strong> groups---an overall average of 27 points after one<br />
year of <strong>the</strong> <strong>preschool</strong> programs, which diminished by 9 points during <strong>the</strong> subsequent six years,<br />
but held steady at 17 points or more above <strong>the</strong> baseline at ages 6, 7, and 10---a pattern of<br />
sustained improvement that contradicted <strong>the</strong> expected IQ fade-out. The conclusion from <strong>the</strong><br />
<strong>study</strong> <strong>through</strong> age 10 was that well-implemented <strong>preschool</strong> <strong>curriculum</strong> models had about <strong>the</strong><br />
same strong effects on children's intellectual and academic performance.<br />
Quite a different picture emerged from <strong>the</strong> <strong>study</strong> <strong>through</strong> age 15, when <strong>the</strong> measurement<br />
of outcomes was expanded to include community behavior (Schweinhart, Weikart, & Larner,<br />
1986b). The Direct Instruction group reported committing 2½ times as many acts of misconduct<br />
as <strong>the</strong> High/Scope group. In addition, <strong>the</strong> Direct Instruction group reported that <strong>the</strong>y were not as<br />
well thought of by <strong>the</strong>ir families as were <strong>the</strong> o<strong>the</strong>r two <strong>curriculum</strong> groups and had fewer<br />
members who engaged in <strong>the</strong> positive social activities of playing ball or o<strong>the</strong>r sports.<br />
The discovery of differential <strong>curriculum</strong> effects at age 15 served as both impetus and<br />
source of hypo<strong>the</strong>ses for <strong>the</strong> <strong>study</strong> <strong>through</strong> age 23. Were <strong>the</strong>se age-15 findings accidental,<br />
perhaps due to <strong>the</strong> <strong>study</strong>'s methodological limitations Direct Instruction proponents thought so<br />
(Bereiter, 1986; Gersten, 1986), raising a series of methodological issues to which Schweinhart,<br />
Weikart, and Larner (1986a) responded. The methodology of <strong>the</strong> age-23 follow-up reported in<br />
this article responds to <strong>the</strong>se issues as well. Most importantly, in response to <strong>the</strong> critics’<br />
challenge to <strong>the</strong> validity of self-reported misconduct, <strong>the</strong> <strong>study</strong> <strong>through</strong> age 23 includes an<br />
examination of actual public arrest records. While nei<strong>the</strong>r self-reported misconduct nor arrest<br />
records alone provide a fully valid description of antisocial behavior, toge<strong>the</strong>r <strong>the</strong>y present <strong>the</strong><br />
best description obtainable, capturing both its personal and social dimensions.<br />
Curriculum Models<br />
The <strong>curriculum</strong> models used in <strong>the</strong> <strong>study</strong>'s <strong>preschool</strong> programs represent three distinct<br />
<strong>the</strong>oretical approaches to early childhood education, three visions of what early childhood<br />
education ought to be. As shown in Figure 1, <strong>the</strong>se approaches differ with respect to <strong>the</strong> degree<br />
4
of initiative expected of <strong>the</strong> child and <strong>the</strong> degree of initiative expected of <strong>the</strong> teacher---whe<strong>the</strong>r<br />
<strong>the</strong> child is primarily initiator or respondent and whe<strong>the</strong>r <strong>the</strong> teacher is primarily initiator or<br />
respondent (Weikart, 1972). Kohlberg and Mayer (1972) identified similar early childhood<br />
education traditions. In <strong>the</strong> programmed-learning approach, <strong>the</strong> child responds to <strong>the</strong> initiating<br />
teacher, while in <strong>the</strong> child-centered approach, <strong>the</strong> teacher responds to <strong>the</strong> initiating child. In <strong>the</strong><br />
open-framework approach, child and teacher both initiate events at <strong>the</strong>ir own levels of<br />
responsibility, while in <strong>the</strong> custodial-care approach (not represented in this <strong>study</strong>), child and<br />
teacher both respond to <strong>the</strong> flow of events, and <strong>the</strong> teacher's job is merely to keep <strong>the</strong> child safe<br />
and out of trouble.<br />
--- Insert Figure 1 about here ---<br />
The Direct Instruction <strong>curriculum</strong> model, developed by Bereiter and Engelmann (1966),<br />
represented <strong>the</strong> programmed-learning approach in this <strong>study</strong>. The model began with a <strong>preschool</strong><br />
program devoted to behavioral learning principles, operated by Bereiter and Engelmann at <strong>the</strong><br />
University of Illinois-Urbana in <strong>the</strong> mid-1960s. The model later expanded to Follow Through<br />
primary-grade programs and "DISTAR" materials published by Science Research Associates.<br />
The Direct Instruction program taught academic skills---specifically, <strong>the</strong> skills and content<br />
assessed by intelligence and achievement tests. Teachers led small groups of children in<br />
precisely planned, 20-minute, question-and-answer lessons in language, ma<strong>the</strong>matics, and<br />
reading. Teachers’ guides and children’s workbooks were <strong>the</strong> only materials in <strong>the</strong> classroom<br />
because <strong>the</strong>y were considered <strong>the</strong> only materials that stimulated <strong>the</strong> requisite learning.<br />
The Nursery School <strong>curriculum</strong> model, encompassing what was traditionally seen as<br />
good early childhood education (Sears & Dowley, 1963), represented <strong>the</strong> child-centered<br />
approach. It was originally called “unit-based” because <strong>the</strong> teachers organized class activities,<br />
discussions, and field trips around broad units or <strong>the</strong>mes, such as community helpers, circus<br />
animals, and holidays. Within a permissive atmosphere, teachers expected children to show<br />
good manners, cooperate, and observe limits. Children had freedom to choose activities, move<br />
5
from one activity to ano<strong>the</strong>r, and interact with adults and peers. The emphasis was on<br />
developing social skills ra<strong>the</strong>r than intellectual skills.<br />
The High/Scope <strong>curriculum</strong> model, developed by Weikart and his associates (Weikart,<br />
Rogers, Adcock, & McClelland, 1971; Hohmann, Banet, & Weikart, 1979; Hohmann & Weikart,<br />
1995), represented <strong>the</strong> open-framework approach. Based on Piaget's constructivist <strong>the</strong>ory of<br />
child development, adults engaged children as active learners and arranged <strong>the</strong>ir classrooms in<br />
discrete, well-equipped interest areas. Each day, children planned, carried out, and reviewed<br />
<strong>the</strong>ir own activities; engaged in small- and large-group activities; and spent time outdoors.<br />
Teachers facilitated intellectual, social, and physical key experiences in children's development.<br />
These key experiences represented <strong>the</strong> domains of children's initiative; social relations; creative<br />
representation; music and movement; language and literacy; and <strong>the</strong> logical and ma<strong>the</strong>matical<br />
operations of classification, seriation, and number and <strong>the</strong>ir applications to space and time.<br />
Preschool Curriculum and Adult Status<br />
How could <strong>the</strong> High/Scope or Nursery School <strong>preschool</strong> <strong>curriculum</strong>s improve adult<br />
success and social responsibility better than <strong>the</strong> Direct Instruction <strong>preschool</strong> <strong>curriculum</strong> A<br />
parsimonious hypo<strong>the</strong>sis is that, compared to <strong>the</strong> Direct Instruction <strong>curriculum</strong>, <strong>the</strong> High/Scope<br />
and Nursery School <strong>curriculum</strong>s improve children’s positive dispositions that lead to later<br />
success and away from later misconduct. Comparison of <strong>the</strong> processes in <strong>the</strong>se <strong>curriculum</strong>s<br />
suggests that <strong>the</strong> positive dispositions are those of planning and social reasoning.<br />
Planning. Planning ability and initiative may mediate between <strong>the</strong> High/Scope and<br />
Nursery School <strong>curriculum</strong>s and later success and social responsibility. In <strong>the</strong> High/Scope<br />
<strong>curriculum</strong> and, to a lesser extent, in <strong>the</strong> Nursery School <strong>curriculum</strong>, adults encourage children to<br />
take initiative, to select and plan <strong>the</strong>ir own activities, to be decision makers to <strong>the</strong> extent that<br />
<strong>the</strong>ir ages and abilities permit. Early childhood education can help children develop <strong>the</strong>ir ability<br />
to take initiative and make plans (Bronson, 1994), and this ability has been found to be a factor<br />
in school achievement (Cohen, Bronson, & Casey, 1995). Linking planning ability to social<br />
6
esponsibility, correctional programs that place an emphasis on participants’ critical thinking and<br />
reasoning about <strong>the</strong>ir behavior have been found to effectively prevent crime (Andrews et al.,<br />
1990; Antonowicz & Ross, 1994).<br />
Social reasoning. DeVries, Reese-Learned, and Morgan (1991) found that children<br />
experiencing constructivist <strong>preschool</strong> education evidence better sociomoral action and reasoning<br />
than do children experiencing <strong>preschool</strong> Direct Instruction. DeVries and her associates<br />
systematically observed three kindergarten classes---one used Direct Instruction; ano<strong>the</strong>r used a<br />
constructivist approach similar to High/Scope's; and <strong>the</strong> third was eclectic. Analyzing teachers'<br />
interactions with children, <strong>the</strong>y found that <strong>the</strong> constructivist teacher significantly surpassed <strong>the</strong><br />
o<strong>the</strong>r two in her use of reciprocal and collaborative negotiation strategies and shared experiences<br />
(DeVries, Haney & Zan, 1991). They found that during two game-like activities, <strong>the</strong> children<br />
from <strong>the</strong> constructivist class were more interpersonally interactive, with a greater number and<br />
variety of negotiation strategies and shared experiences than children from <strong>the</strong> o<strong>the</strong>r two classes<br />
(DeVries, Reese-Learned, & Morgan, 1991). DeVries (1991) offered an explanation of her<br />
results that apply, by extension, to this <strong>study</strong>:<br />
When we unilaterally focus on giving children information, we are also<br />
communicating "lessons" about human relations. In <strong>the</strong> process we are creating<br />
<strong>the</strong> context for construction of interpersonal habits, personality, and character.<br />
Our <strong>study</strong> (DeVries, Reese-Learned, & Morgan, 1991) suggests that when<br />
children experience a heavily unilateral atmosphere, <strong>the</strong>ir sociomoral action and<br />
underlying reasoning are less advanced than when children experience a more<br />
reciprocal atmosphere. (DeVries, 1991, p. 546)<br />
O<strong>the</strong>r Preschool Curriculum Studies<br />
The High/Scope Preschool Curriculum Comparison <strong>study</strong> stands at <strong>the</strong> beginning of a<br />
collection of studies examining <strong>the</strong> relative merits of various early childhood <strong>curriculum</strong> models.<br />
Three <strong>preschool</strong> <strong>curriculum</strong> <strong>comparison</strong> studies begun in <strong>the</strong> 1960s focused on children living in<br />
7
poverty and included both Direct Instruction and traditional Nursery School programs---<strong>the</strong><br />
<strong>study</strong> reported here, <strong>the</strong> University of Louisville <strong>study</strong> of Head Start (Miller & Dyer, 1975;<br />
Miller & Bizzell, 1983), and <strong>the</strong> University of Illinois <strong>study</strong> (Karnes, Teska, & Hodgins, 1970;<br />
Karnes, Schwedel, & Williams, 1983). All three studies found that children in Direct Instruction<br />
programs significantly outperformed children in traditional and o<strong>the</strong>r programs on various<br />
measures of intellectual performance during <strong>the</strong> program and up to a year afterwards. The<br />
widely observed pattern of IQ improvement followed by fade-out applied to all of <strong>the</strong>se<br />
<strong>preschool</strong> programs. In <strong>the</strong> Illinois <strong>study</strong>, however, <strong>the</strong> <strong>high</strong> school graduation rates were<br />
noticeably if not significantly different---70% for <strong>the</strong> traditional program group, 48% for <strong>the</strong><br />
Direct Instruction group, and 47% for <strong>the</strong> no-program group.<br />
The national evaluation of <strong>the</strong> 1969-72 Planned Variation Head Start project included a<br />
dozen <strong>preschool</strong> <strong>curriculum</strong> models at 37 sites with some 6,000 children enrolled in model<br />
programs (Bissell, 1971; Datta, McHale, & Mitchell, 1976; Smith, 1973; Weisberg, 1973).<br />
Among its models were <strong>the</strong> Direct Instruction model, <strong>the</strong> High/Scope model, and an “Enabler<br />
model” that resembled <strong>the</strong> traditional Nursery School model. Despite <strong>the</strong> <strong>study</strong>’s many design<br />
problems, two clear findings emerged. First, children in Direct Instruction and o<strong>the</strong>r<br />
programmed-learning programs had <strong>the</strong> <strong>high</strong>est scores of all <strong>the</strong> program and <strong>comparison</strong> groups<br />
on <strong>the</strong> achievement tests given at <strong>the</strong> end of <strong>the</strong> <strong>preschool</strong> program. Second, children in<br />
High/Scope programs had <strong>the</strong> greatest gains in intellectual performance of all <strong>the</strong> program and<br />
<strong>comparison</strong> groups---an average 23 points gained on <strong>the</strong> Stanford-Binet Intelligence Scale as<br />
compared to average gains for children in o<strong>the</strong>r models of no more than 5 points.<br />
The evidence continues to accumulate that early childhood <strong>curriculum</strong> models differ<br />
significantly in some of <strong>the</strong>ir effects on children (e.g., Burts et al., 1992; Marcon, 1992, 1994).<br />
This <strong>study</strong> <strong>through</strong> age 23 is part of <strong>the</strong> resultant effort to more precisely identify how<br />
<strong>curriculum</strong> differences affect children differently and how important and extensive <strong>the</strong>se<br />
differences are.<br />
8
Methodology<br />
This <strong>study</strong> began with 68 3- and 4-year-olds of low socioeconomic status and <strong>high</strong> risk of<br />
school failure who were randomly assigned to three <strong>curriculum</strong> groups.<br />
Sample Selection<br />
As previously described (Weikart et al., 1978; Schweinhart et al., 1986b), <strong>the</strong> <strong>study</strong><br />
sample consisted of 68 children who lived in Ypsilanti, Michigan; became 3 years old in 1967,<br />
1968, or 1969; lived in families of low socioeconomic status; and had low scores on <strong>the</strong><br />
Stanford-Binet Intelligence Scale (Terman & Merrill, 1960) at age 3. Ypsilanti had a population<br />
in 1969 of 29,538---80% European-American and 20% African-American (U.S. Bureau of <strong>the</strong><br />
Census, 1972). The median income of <strong>the</strong> Ypsilanti population in 1969 was $10,710, with 27%<br />
living in poverty (<strong>the</strong> poverty threshold for a non-farm family of four in 1969 was $3,743). The<br />
adult population in 1969 had completed a median 12.2 years of schooling, with 54% having<br />
graduated from <strong>high</strong> school.<br />
The census of <strong>the</strong> Ypsilanti Public Schools was used to identify <strong>the</strong> pool from which<br />
children were selected for <strong>the</strong> <strong>study</strong>. Sample members attended <strong>the</strong> <strong>preschool</strong> programs at ages 3<br />
and 4 from 1967 to 1970. In September of <strong>the</strong> years that <strong>the</strong>se children turned age 3, school<br />
district staff asked <strong>the</strong> children's parents to complete a questionnaire identifying: (a) parents'<br />
occupations---<strong>the</strong> fa<strong>the</strong>r in two-parent families or <strong>the</strong> mo<strong>the</strong>r in single-parent families coded<br />
from 1 to 5: unemployed, unskilled, semiskilled, skilled, or professional; (b) parents' <strong>high</strong>est year<br />
of schooling---<strong>the</strong> <strong>high</strong>est year completed by <strong>the</strong> mo<strong>the</strong>r in single-parent families or <strong>the</strong> mean of<br />
<strong>the</strong> <strong>high</strong>est years completed by both parents; and (c) <strong>the</strong> rooms per person in <strong>the</strong> household<br />
(given half <strong>the</strong> weight of <strong>the</strong> o<strong>the</strong>r two factors). Low-scoring families were judged to be living<br />
in poverty and eligible for <strong>the</strong> <strong>study</strong> sample. The 3-year-olds in <strong>the</strong>se families who scored<br />
between 60 and 90 on <strong>the</strong> Stanford-Binet Intelligence Scale (Form L-M; Terman & Merrill,<br />
1960) and had no evidence of physical disability were admitted to <strong>the</strong> <strong>study</strong> sample.<br />
9
Several children in <strong>the</strong> initial sample pool were already attending o<strong>the</strong>r early childhood<br />
programs, so <strong>the</strong>ir parents declined to have <strong>the</strong>m participate in <strong>the</strong> <strong>study</strong>. Several o<strong>the</strong>rs dropped<br />
out of <strong>the</strong> <strong>preschool</strong> programs in <strong>the</strong> <strong>study</strong> because <strong>the</strong>ir families moved out of <strong>the</strong> district. Two<br />
children were later judged ineligible for <strong>the</strong> <strong>study</strong> because <strong>the</strong>ir parents had risen to a much<br />
<strong>high</strong>er socioeconomic level. The 68 children who met <strong>the</strong> entry criteria and completed <strong>the</strong><br />
<strong>preschool</strong> programs served as <strong>the</strong> original <strong>study</strong> sample. The oldest class had 27 children in it;<br />
<strong>the</strong> next oldest had 19; and <strong>the</strong> youngest had 22. Table 1 lists <strong>the</strong> characteristics of <strong>the</strong> initial<br />
sample.<br />
--- Insert Table 1 about here ---<br />
Curriculum Groups<br />
Annually, staff randomly assigned children to three groups, <strong>the</strong>n reassigned several<br />
children from one group to ano<strong>the</strong>r until <strong>the</strong> groups had similar percentages of Blacks and<br />
Whites, percentages of boys and girls, and mean Stanford-Binet IQ---essentially a group<br />
matching technique. Then each group was randomly assigned to a <strong>curriculum</strong> model. To avoid<br />
confounding <strong>the</strong> effects of different <strong>curriculum</strong> models within families, 9 of <strong>the</strong> 68 children were<br />
reassigned to <strong>the</strong> same <strong>curriculum</strong> group that <strong>the</strong>ir older siblings had attended.<br />
As Table 1 shows, <strong>the</strong> three <strong>curriculum</strong> groups did not differ significantly (p less than<br />
.05, two-tailed) at program entry on <strong>the</strong> background characteristics of race, gender, mean<br />
socioeconomic status of families, family configuration, fa<strong>the</strong>rs’ or mo<strong>the</strong>rs’ employment rate,<br />
fa<strong>the</strong>rs’ <strong>high</strong>est year of schooling, persons per household or per room, or mean Stanford-Binet<br />
IQ of <strong>the</strong> children. On average, <strong>the</strong> Nursery School group mo<strong>the</strong>rs attended school significantly<br />
longer than <strong>the</strong> High/Scope group mo<strong>the</strong>rs---a difference that serves as a bias against finding<br />
advantages for <strong>the</strong> High/Scope group over <strong>the</strong> Nursery School group. This difference, however,<br />
was counterbalanced by a similar but nonsignificant difference in <strong>the</strong> opposite direction in<br />
fa<strong>the</strong>rs’ <strong>high</strong>est years of schooling. Fur<strong>the</strong>r, when <strong>study</strong> participants at age 23 reported <strong>the</strong>ir<br />
10
parents’ <strong>high</strong>est years of schooling, <strong>curriculum</strong> groups did not differ significantly on ei<strong>the</strong>r<br />
mo<strong>the</strong>rs’ or fa<strong>the</strong>rs’ <strong>high</strong>est years of schooling.<br />
Common Characteristics of Program Operation<br />
This <strong>study</strong> operated three <strong>high</strong>-quality <strong>preschool</strong> programs that differed only in <strong>the</strong><br />
<strong>curriculum</strong> models employed. All three programs operated in <strong>the</strong> same context---<strong>the</strong> same<br />
school administrators and director, <strong>the</strong> same funding, and <strong>the</strong> same staff working conditions and<br />
salary schedule. All three programs had class sessions for children 2½ hours a day Monday<br />
<strong>through</strong> Friday and 1½-hour educational home visits by teachers to each mo<strong>the</strong>r and child every<br />
two weeks. Teachers used <strong>the</strong> <strong>curriculum</strong> model in <strong>the</strong> class sessions and home visits and<br />
demonstrated and explained it to parents so that <strong>the</strong>y could use it with <strong>the</strong>ir children. Classes,<br />
meeting between 1967 and 1970, typically had 15 or 16 3- and 4-year-olds and two certified<br />
teachers, a ratio of one teacher to about 8 children.<br />
Documentation<br />
In addition to detailed descriptions of program activities by <strong>the</strong> <strong>curriculum</strong> supervisor and<br />
teaching staff, Weikart et al. (1978) reported three types of documentation of program operation.<br />
This documentation verifies that <strong>the</strong> three models were implemented as intended and in distinctly<br />
different ways:<br />
(a) Systematic observation of <strong>the</strong> programs using <strong>the</strong> Pupil Record of School<br />
Experience (PROSE; Medley, Schluck, & Ames, 1968) focused on individual<br />
children ra<strong>the</strong>r than <strong>the</strong> teacher. Observers using <strong>the</strong> PROSE found significant<br />
differences between programs which generally agreed with expected <strong>curriculum</strong><br />
model differences.<br />
(b) 492 home visit reports---12 for each of 41 of <strong>the</strong> 68 children in <strong>the</strong> <strong>study</strong>---showed<br />
that <strong>the</strong> home visits reflected characteristics of <strong>the</strong> <strong>curriculum</strong> models being<br />
experienced by <strong>the</strong> children. Mo<strong>the</strong>rs participated in 80% of <strong>the</strong> scheduled<br />
11
High/Scope and Direct Instruction home visits, but in only 50% of <strong>the</strong> scheduled<br />
Nursery School home visits.<br />
(c) Twelve national experts in early childhood education who visited <strong>the</strong> project during<br />
1968 and 1969 wrote comments on <strong>the</strong> <strong>high</strong> degree of staff enthusiasm and<br />
commitment to <strong>the</strong> project and to <strong>the</strong> children. They wrote that <strong>the</strong> Direct<br />
Instruction program was faithful to <strong>the</strong> Bereiter-Engelmann model; that <strong>the</strong><br />
High/Scope teachers adapted Piagetian ideas to <strong>the</strong> children’s developmental levels<br />
and developed children’s impulse control <strong>through</strong> <strong>the</strong> plan-do-review daily routine;<br />
and that <strong>the</strong> Nursery School program had frequent spontaneous interaction and that<br />
children persisted at tasks despite <strong>the</strong> lack of structure.<br />
Because <strong>the</strong> teachers followed <strong>the</strong> <strong>curriculum</strong> models closely, and were observed to do<br />
so, it is reasonable to attribute any group differences in child outcomes to <strong>curriculum</strong> model<br />
differences ra<strong>the</strong>r than to idiosyncratic teacher differences.<br />
Instrumentation and Data Collection<br />
The High/Scope Preschool Curriculum Comparison <strong>study</strong> collected data annually from<br />
ages 3 to 8 and at ages 10, 15, and 23.<br />
Age 23 interview. The age-23 interview, also used in <strong>the</strong> High/Scope Perry Preschool<br />
<strong>study</strong> <strong>through</strong> age 27 (Schweinhart et al., 1993), lasted 1½ - 2 hours and examined <strong>the</strong><br />
characteristics of <strong>study</strong> participants reported in <strong>the</strong> results section, including literacy (APL<br />
Survey, American College Testing Program, 1976), sources of irritation (Freeberg, 1976), and<br />
self-reported misconduct (Bachman & Johnston, 1978). After each interview, <strong>the</strong> interviewer<br />
asked <strong>the</strong> respondent to sign consent forms for release of personal information from school,<br />
police, and social services records; and paid <strong>the</strong> respondent $50. A long-time, well-known<br />
African-American resident of Ypsilanti found and interviewed <strong>study</strong> participants at ages 15 and<br />
23. He had served as a <strong>high</strong> school coach and knew many of <strong>the</strong>m. He found many of <strong>the</strong>m by<br />
12
obtaining information from <strong>the</strong>ir families and friends. He did not know <strong>the</strong> <strong>curriculum</strong> group<br />
membership of individual <strong>study</strong> participants.<br />
--- Insert Table 2 about here ---<br />
Table 2 lists <strong>the</strong> initial background characteristics of <strong>the</strong> 52 sample members interviewed<br />
at age 23. Except for age and home at age 23, <strong>the</strong>se characteristics were measured at program<br />
entry, so that <strong>comparison</strong> of Table 1 and Table 2 indicates how <strong>the</strong> sample remaining at age 23<br />
differed from <strong>the</strong> original sample. A key question for <strong>the</strong> analysis of <strong>the</strong> age-23 interview<br />
variables was whe<strong>the</strong>r those remaining in <strong>the</strong> <strong>curriculum</strong> groups differed significantly from each<br />
o<strong>the</strong>r on background characteristics. Just as at program entry, <strong>the</strong> <strong>curriculum</strong> groups remaining<br />
at age 23 differed only on mo<strong>the</strong>rs’ <strong>high</strong>est year of schooling, in such a way as to bias<br />
<strong>comparison</strong>s of outcomes against <strong>the</strong> High/Scope group and in favor of <strong>the</strong> Nursery School<br />
group. Nei<strong>the</strong>r did <strong>the</strong> <strong>curriculum</strong> groups differ significantly on age at interview, with a mean<br />
age of 23.5 years for <strong>the</strong> sample interviewed, nor on residence at age 23, with 74% living in<br />
Washtenaw County (where <strong>the</strong> <strong>preschool</strong> programs took place), 14% living elsewhere in<br />
Michigan, and 12% living elsewhere in <strong>the</strong> country. Although <strong>the</strong> <strong>curriculum</strong> groups at age 23<br />
did not differ significantly in gender makeup, 47% of <strong>the</strong> Direct Instruction group were males as<br />
compared to only 36% of <strong>the</strong> High/Scope group and 42% of <strong>the</strong> Nursery School group.<br />
School records. With student permission (obtained at <strong>the</strong> age-23 interview for 37 cases<br />
or <strong>the</strong> age-15 interview for 9 additional cases), data were collected on 46 <strong>study</strong> participants from<br />
<strong>the</strong> general and special education records of <strong>the</strong> Ypsilanti Public Schools and o<strong>the</strong>r school<br />
districts in Washtenaw County---15 from <strong>the</strong> Direct Instruction group, 15 from <strong>the</strong> High/Scope<br />
group, and 16 from <strong>the</strong> Nursery School group. Comparison of <strong>the</strong> <strong>curriculum</strong> groups’<br />
background characteristics for <strong>the</strong> 46 sample members with school records data revealed <strong>the</strong><br />
same results as for <strong>the</strong> 68 members of <strong>the</strong> original sample and for <strong>the</strong> 52 sample members with<br />
age-23 interview data:The only statistically significant difference was that <strong>the</strong> Nursery School<br />
13
group mo<strong>the</strong>rs had a significantly <strong>high</strong>er mean <strong>high</strong>est year of schooling than <strong>the</strong> High/Scope<br />
group mo<strong>the</strong>rs.<br />
Arrest records. Arrest records came from records searches in 1990 at <strong>the</strong> local juvenile<br />
court, circuit court, three district courts, Detroit Recorder Court, <strong>the</strong> Federal Court in Detroit, and<br />
<strong>the</strong> Michigan State Police computerized records system. Because local police departments<br />
transmit data to <strong>the</strong> State Police records, <strong>the</strong>se records had nearly complete counts of arrests in<br />
<strong>the</strong> state, but incomplete counts of <strong>the</strong> charges and adjudications that followed arrests. Adult<br />
arrest records are available for public inspection without <strong>the</strong> permission of those arrested;<br />
however, <strong>the</strong> <strong>study</strong> participants who were interviewed had given <strong>the</strong>ir permission for <strong>the</strong>se<br />
records’ searches.<br />
Unlike school records, for which missing records are simply missing data, missing arrest<br />
records signify <strong>the</strong> absence of arrests, "0" arrests, and we searched for <strong>the</strong> records of all 68 cases.<br />
However, <strong>study</strong> participants who were interviewed at age 23 in a state o<strong>the</strong>r than Michigan had a<br />
reduced chance of being arrested in Michigan; only 1 of <strong>the</strong> 6 had an adult arrest record in<br />
Michigan. So <strong>the</strong>se 6 cases (2 in <strong>the</strong> Direct Instruction group, 3 in <strong>the</strong> High/Scope group, and 1<br />
in <strong>the</strong> Nursery School group) were excluded from <strong>the</strong> arrest records sample. This left two<br />
categories of <strong>study</strong> participants---those interviewed at age 23 in Michigan and those not<br />
interviewed whose residence at age 23 was unknown. Of <strong>the</strong> <strong>study</strong> participants not interviewed,<br />
49% (8 of 19) had adult arrest records, only slightly less than <strong>the</strong> 56% (24 of 43) of <strong>the</strong><br />
interviewed Michigan residents who had adult arrest records. For this reason, <strong>the</strong> 19 <strong>study</strong><br />
participants who were not interviewed were retained in <strong>the</strong> arrest records sample; of <strong>the</strong>se, 1 of 4<br />
Direct Instruction group members, 3 of 8 High/Scope group members, and 1 of 7 Nursery School<br />
group members had adult arrest records. Thus, <strong>the</strong> arrest records sample had 62 members---21 in<br />
<strong>the</strong> Direct Instruction group, 19 in <strong>the</strong> High/Scope group, and 22 in <strong>the</strong> Nursery School group.<br />
Analysis of <strong>the</strong> background characteristics of <strong>the</strong> <strong>curriculum</strong> groups retained in <strong>the</strong> arrest<br />
records sample had <strong>the</strong> same results as <strong>the</strong> o<strong>the</strong>r analyses of background characteristics. Again,<br />
14
<strong>the</strong> only statistically significant difference was that <strong>the</strong> Nursery School group mo<strong>the</strong>rs had a<br />
significantly <strong>high</strong>er mean <strong>high</strong>est year of schooling than <strong>the</strong> High/Scope group mo<strong>the</strong>rs.<br />
Data Analysis Techniques<br />
Initial <strong>curriculum</strong> group analyses were carried out without statistical adjustments because<br />
<strong>the</strong> groups had been randomly assigned and were quite similar to each o<strong>the</strong>r on background<br />
variables; a second analysis controlled for gender. Data analyses were conducted using SPSS for<br />
Windows, Version 6.1 (Norušis, 1993).<br />
Analysis of variance was used to analyze continuous variables. Because of skewed<br />
distributions and unequal variances, each continuous variable was also analyzed with <strong>the</strong><br />
Kruskal-Wallis H statistic corrected for ties, a procedure that uses <strong>the</strong> chi-square statistic to test<br />
differences in <strong>the</strong> mean ranks of groups. These parametric and nonparametric procedures usually<br />
agreed in <strong>the</strong>ir conclusions regarding whe<strong>the</strong>r <strong>curriculum</strong> group differences on a variable were<br />
statistically significant (at p < .05, two-tailed), indicating that analysis of variance results were<br />
not due to outliers or o<strong>the</strong>r violations of assumptions for parametric analyses. Only <strong>the</strong> analysisof-variance<br />
results are presented except for variables in which discrepant findings were obtained.<br />
For <strong>the</strong>se variables, <strong>the</strong> mean ranks and p-value based on <strong>the</strong> Kruskal-Wallis H analysis are<br />
presented as well. Chi-square analysis was used to analyze categorical variables.<br />
Findings<br />
Findings are presented for <strong>curriculum</strong>-group differences <strong>through</strong> age 23 in education,<br />
household and income, community activities, and criminal arrests.<br />
Education<br />
As Table 3 shows, <strong>the</strong> High/Scope group significantly surpassed <strong>the</strong> Direct Instruction<br />
group in <strong>high</strong>est year of schooling planned. However, <strong>curriculum</strong> groups did not differ<br />
significantly in <strong>the</strong>ir self-reported <strong>high</strong>est year of schooling, on-time <strong>high</strong> school graduation rate,<br />
<strong>high</strong> school graduation/GED rate, or post-<strong>high</strong> school education.<br />
15
--- Insert Table 3 about here ---<br />
Table 3 also presents information from school records. The Direct Instruction group<br />
experienced significantly more years of special education for emotional impairment or<br />
disturbance than ei<strong>the</strong>r of <strong>the</strong> o<strong>the</strong>r two groups; 47% of <strong>the</strong> Direct Instruction group were<br />
identified at some time as emotionally impaired or disturbed, as compared to only 6% of <strong>the</strong><br />
High/Scope group and 6% of <strong>the</strong> Nursery School group. Combining treatment for emotional<br />
impairment or disturbance with treatment for educable mental impairment and treatment for<br />
specific learning disabilities, 80% of <strong>the</strong> Direct Instruction group, 53% of <strong>the</strong> High/Scope group,<br />
and 44% of <strong>the</strong> Nursery School group received some sort of special education at some time<br />
during <strong>the</strong>ir schooling.<br />
While this <strong>study</strong> did not have an untreated control group, <strong>the</strong> High/Scope Perry Preschool<br />
<strong>study</strong> did, as part of a sample selected by <strong>the</strong> same criteria in <strong>the</strong> same town just before this <strong>study</strong><br />
began (Schweinhart et al., 1993). In that <strong>study</strong>, <strong>the</strong> program group received treatment for<br />
emotional impairment or disturbance an average of 0.5 years, while <strong>the</strong> untreated control group<br />
received such treatment for an average of 0.7 years. In <strong>the</strong> Curriculum <strong>study</strong>, <strong>the</strong> Direct<br />
Instruction group’s average of 1.1 years was considerably <strong>high</strong>er than ei<strong>the</strong>r of <strong>the</strong>se numbers,<br />
while <strong>the</strong> average of 0.1 years for <strong>the</strong> High/Scope group and <strong>the</strong> Nursery School group was<br />
considerably lower than ei<strong>the</strong>r of <strong>the</strong>m, suggesting that <strong>the</strong> Direct Instruction program may have<br />
led to an increase in emotional impariment or disturbance while <strong>the</strong> High/Scope and Nursery<br />
School programs led to a decrease.<br />
In contrast, <strong>the</strong> High/Scope group experienced significantly more years of compensatory<br />
education (for low-income, low-achieving students) than did <strong>the</strong> Nursery School group, with<br />
33% of <strong>the</strong> High/Scope group, 20% of <strong>the</strong> Direct Instruction group, and 0% of <strong>the</strong> Nursery<br />
School group receiving compensatory education at some time. One might suppose that<br />
compensatory education served as a less expensive alternative to special education for those<br />
students requiring some sort of special treatment. However, in this sample, <strong>the</strong> only students<br />
16
eceiving compensatory education were those who also received special education at some o<strong>the</strong>r<br />
time during <strong>the</strong>ir schooling.<br />
No statistically significant group differences in literacy test scores were found at age 23.<br />
--- Insert Table 4 about here ---<br />
Household, Income, and Community Activities<br />
Age 23 is at <strong>the</strong> beginning of adult life and in this <strong>study</strong> appears to be a transitional<br />
period: As shown in Table 4, 47% of <strong>the</strong> respondents were still living with <strong>the</strong>ir parents and 53%<br />
were not. Curriculum groups differed significantly in <strong>the</strong> percentages of members married and<br />
living with <strong>the</strong>ir spouses: 0% of <strong>the</strong> Direct Instruction group, as compared to 18% of <strong>the</strong> Nursery<br />
School group and 31% of <strong>the</strong> High/Scope group. As Table 4 shows, <strong>curriculum</strong> groups did not<br />
differ significantly in <strong>the</strong>ir employment rates during <strong>the</strong> previous five years or currently, monthly<br />
earnings, monthly income from all sources, or months on welfare in <strong>the</strong> previous ten years,<br />
although <strong>the</strong> High/Scope group’s employment rate was noticeably lower than those of <strong>the</strong> o<strong>the</strong>r<br />
<strong>curriculum</strong> groups.<br />
As shown in Table 5, <strong>curriculum</strong> groups differed significantly on various positive and<br />
negative community activities. Significantly more High/Scope and Nursery School group<br />
members than Direct Instruction group members had ever done volunteer work. About three<br />
times as many High/Scope group members as Direct Instruction or Nursery School group<br />
members had voted in <strong>the</strong> last Presidential election.<br />
--- Insert Table 5 about here ---<br />
The Direct Instruction group identified significantly more sources of irritation (<strong>the</strong><br />
interview item read “types of people . . . giving you a hard time lately”) than did <strong>the</strong> High/Scope<br />
group. The most frequent sources of irritation for <strong>the</strong>se sample members, in order of frequency,<br />
were collection agencies, work supervisors, police, courts, and family members.<br />
As previously reported, at age 15 <strong>the</strong> High/Scope group reported committing significantly<br />
fewer acts of misconduct than did <strong>the</strong> Direct Instruction group (Schweinhart et al., 1986b). The<br />
17
High/Scope group reported committing an average of 5.9 acts of misconduct on an 18-item scale<br />
as compared to <strong>the</strong> 14.9 acts of misconduct reported by <strong>the</strong> Direct Instruction group. 2<br />
When <strong>the</strong><br />
same scale was used in <strong>the</strong> High/Scope Perry Preschool <strong>study</strong> at age 15, <strong>the</strong> program group<br />
reported an average of 5.2 acts of misconduct and <strong>the</strong> no-program group reported an average of<br />
7.1 acts of misconduct, suggesting that <strong>the</strong> Direct Instruction group in <strong>the</strong> Curriculum <strong>study</strong> may<br />
have committed twice as many acts of misconduct as <strong>the</strong>y would have had <strong>the</strong>y not attended any<br />
<strong>preschool</strong> program.<br />
As shown in Table 5, <strong>the</strong> mean rank on acts of misconduct reported at age 23 was<br />
significantly lower for <strong>the</strong> High/Scope group than for <strong>the</strong> Nursery School group, an instance in<br />
which <strong>the</strong> variable did not meet <strong>the</strong> assumptions for analysis of variance and <strong>the</strong> appropriate,<br />
nonparametric analysis was used. Thus, <strong>the</strong> age-15 misconduct difference between <strong>the</strong><br />
High/Scope and Direct Instruction group was not corroborated by ano<strong>the</strong>r self-report measure at<br />
age 23. The mean rank for <strong>the</strong> Direct Instruction group on being suspended from work was<br />
significantly greater than <strong>the</strong> comparable figure for <strong>the</strong> Nursery School group: 27% of <strong>the</strong> Direct<br />
Instruction group as compared to 0% of <strong>the</strong> Nursery School group had ever been suspended from<br />
work.<br />
--- Insert Table 6 about here ---<br />
Criminal Arrests<br />
As shown in Table 6, <strong>the</strong> Direct Instruction group had significantly more felony arrests<br />
than <strong>the</strong> o<strong>the</strong>r <strong>curriculum</strong> groups---three times as many as ei<strong>the</strong>r of <strong>the</strong> o<strong>the</strong>r <strong>curriculum</strong> groups.<br />
These differences appeared in felony arrests from ages 22 onward, as <strong>the</strong>ir number grew more<br />
substantial. Overall, 39% of <strong>the</strong> Direct Instruction group members had felony arrest records as<br />
compared to 10% of <strong>the</strong> High/Scope group and 17% of <strong>the</strong> Nursery School group. These<br />
2 These numbers differ from those reported by Schweinhart et al. (1986) because <strong>the</strong> scaling was<br />
recalibrated: “3 or 4 times” was coded as 3.5 instead of 3, and “5 or more times” was coded as 5 instead of 4.<br />
18
findings corroborate <strong>the</strong> findings on self-reported misconduct at age 15, triangulating on <strong>the</strong><br />
relative prevalence of crime by <strong>the</strong>se <strong>curriculum</strong> groups.<br />
The Direct Instruction group averaged 0.9 felony arrests as compared to 0.2 for <strong>the</strong><br />
High/Scope group and 0.3 for <strong>the</strong> Nursery School group. In <strong>the</strong> High/Scope Perry Preschool<br />
<strong>study</strong>, <strong>the</strong> estimated average felony arrests by age 23 were 0.7 for <strong>the</strong> program group and 1.5 for<br />
<strong>the</strong> no-program group (Schweinhart et al., 1993). This <strong>comparison</strong> suggests that <strong>the</strong> Direct<br />
Instruction program did not lead to more felony arrests than no <strong>preschool</strong> program would have,<br />
but nei<strong>the</strong>r did it lead to fewer felony arrests than no <strong>preschool</strong> program, as <strong>the</strong> o<strong>the</strong>r <strong>preschool</strong><br />
programs did.<br />
As Table 6 shows, <strong>the</strong> Direct Instruction group had significantly more arrests for property<br />
crimes---such as breaking and entering, larceny, vehicle <strong>the</strong>ft, and malicious destruction of<br />
property---than <strong>the</strong> High/Scope group. Curriculum groups did not differ significantly in arrests<br />
for violent crimes or crimes involving drugs. Regarding specific types of crimes, <strong>the</strong> Direct<br />
Instruction group was cited significantly more than <strong>the</strong> o<strong>the</strong>r <strong>curriculum</strong> groups for assault with a<br />
dangerous weapon (19% vs. 0% vs. 0%, n = 62, p = .015).<br />
In his critique of this <strong>study</strong>’s findings <strong>through</strong> age 15, Bereiter (1986) suggested that <strong>the</strong><br />
<strong>curriculum</strong> group difference in misconduct might be due to <strong>the</strong> fact that <strong>the</strong> first cohort of 8<br />
members of <strong>the</strong> Direct Instruction group (and 8 members of <strong>the</strong> Nursery School group) attended<br />
only one year of <strong>the</strong> <strong>preschool</strong> program while all of <strong>the</strong> High/Scope group attended for two<br />
years. To see if <strong>the</strong> shorter <strong>preschool</strong> programs influenced <strong>the</strong> <strong>curriculum</strong> group difference in<br />
felony arrests, <strong>the</strong> analysis was conducted with <strong>the</strong> subsample who attended <strong>the</strong>ir <strong>preschool</strong><br />
programs for two years. In <strong>the</strong> two-year subsample, <strong>the</strong> mean number of felony arrests for each<br />
of <strong>the</strong> three <strong>curriculum</strong> groups was almost exactly <strong>the</strong> same as it was in <strong>the</strong> complete arrest<br />
sample.<br />
Curriculum-by-Gender Analyses<br />
19
In a sample of this size, it is possible that nonsignificant differences in <strong>the</strong> gender makeup<br />
of <strong>curriculum</strong> groups might account for apparent <strong>curriculum</strong> group differences, especially with<br />
regard to misconduct and arrests. To examine this possibility, we conducted <strong>curriculum</strong>-groupby-gender<br />
analyses of variance on <strong>the</strong> 13 variables for which statistically significant group<br />
differences were reported. Ten of <strong>the</strong>se variables continued to manifest a statistically significant<br />
<strong>curriculum</strong> group difference: years of identified emotional impairment or disturbance, times<br />
suspended from work, <strong>high</strong>est year of schooling planned, sources of irritation, misconduct at age<br />
15, felony arrests, felony arrests at ages 22 and over, property crimes, living with spouse at age<br />
23, and ever done volunteer work. Thus, <strong>the</strong> majority of <strong>the</strong> findings were unaffected by <strong>the</strong><br />
gender makeup of <strong>the</strong> <strong>curriculum</strong> groups.<br />
The <strong>curriculum</strong> group differences found for <strong>the</strong> remaining three variables did not remain<br />
when analyzed with <strong>curriculum</strong>-group-by-gender analyses of variance---years of compensatory<br />
education, misconduct at age 23, and voting in <strong>the</strong> last Presidential election. For <strong>the</strong>se variables,<br />
it seems that <strong>the</strong> apparent <strong>curriculum</strong> group differences were due to differences in <strong>the</strong> groups’<br />
gender makeup ra<strong>the</strong>r than <strong>the</strong>ir <strong>preschool</strong> <strong>curriculum</strong> experience. These three variables include<br />
<strong>the</strong> only two variables on which <strong>the</strong> High/Scope group and <strong>the</strong> Nursery School group had<br />
differed significantly---years of compensatory education misleadingly favoring <strong>the</strong> Nursery<br />
School group and misconduct <strong>through</strong> age 23 misleadingly favoring <strong>the</strong> High/Scope group. With<br />
gender included in <strong>the</strong> analysis, this <strong>study</strong> found no statistically significant differences between<br />
<strong>the</strong> High/Scope and Nursery School groups.<br />
Examination of <strong>curriculum</strong>-by-gender subgroup means and percentages reveals that<br />
Direct Instruction males were worse off than any of <strong>the</strong> o<strong>the</strong>r subgroups in various ways---years<br />
of identified emotional impairment or disturbance, times suspended from work, sources of<br />
irritation, felony arrests, felony arrest at ages 22 and over, and property crimes.<br />
Mediating Variables<br />
20
Evidence on mediating variables buttresses <strong>the</strong> plausibility of long-term group<br />
differences being due to <strong>curriculum</strong> models. Hypo<strong>the</strong>sized mediating variables between<br />
<strong>preschool</strong> <strong>curriculum</strong> and adult social responsibility were children’s positive dispositions and<br />
misconduct. Regarding positive dispositions, this <strong>study</strong> documented <strong>curriculum</strong> differences in<br />
<strong>the</strong> practices of fostering planning ability and social reasoning, but did not measure <strong>the</strong>se<br />
outcomes in children. Regarding patterns of misconduct, <strong>the</strong> <strong>study</strong> measured and found<br />
<strong>curriculum</strong> group differences in years of treatment for emotional impairment or disturbance<br />
during schooling from kindergarten onward, self-reported misconduct at age 15, and felony<br />
arrests <strong>through</strong> age 23. Fur<strong>the</strong>r evidence that emotional impairment/disturbance and misconduct<br />
at age 15 mediated between <strong>preschool</strong> <strong>curriculum</strong> models and felony arrests were <strong>the</strong> Pearson<br />
correlation coefficients between <strong>the</strong>m: Felony arrests were correlated .54 with years of<br />
emotional impairment (p < .001, n = 46) and .30 with self-reported misconduct at age 15 (p =<br />
.026, n = 54).<br />
Discussion<br />
The interpretation of <strong>the</strong> findings and implications of this <strong>study</strong> revolve around two<br />
<strong>comparison</strong>s: first, Direct Instruction versus <strong>the</strong> o<strong>the</strong>r two <strong>curriculum</strong> models; and second, <strong>the</strong><br />
High/Scope model versus <strong>the</strong> Nursery School model. While statistically significant <strong>curriculum</strong><br />
group differences were not found for most variables, ten such differences were found and<br />
remained after <strong>the</strong> groups’ gender makeup was taken into account. All of <strong>the</strong>m favored <strong>the</strong><br />
High/Scope group, <strong>the</strong> Nursery School group, or both over <strong>the</strong> Direct Instruction group:<br />
• The High/Scope group had advantages over <strong>the</strong> Direct Instruction group in <strong>high</strong>est year<br />
of schooling planned, <strong>high</strong>er percent living with spouse, fewer sources of irritation, less<br />
self-reported misconduct at age 15, fewer felony arrests, and fewer arrests for property<br />
crimes.<br />
• The Nursery School group had advantages over <strong>the</strong> Direct Instruction group in fewer<br />
suspensions from work and fewer felony arrests at age 22 and over.<br />
21
• Both High/Scope and Nursery School groups had advantages over <strong>the</strong> Direct<br />
Instruction group in experiencing fewer years of identified emotional impairment or<br />
disturbance and in ever doing volunteer work.<br />
On no variable did <strong>the</strong> Direct Instruction group have an advantage over ei<strong>the</strong>r <strong>the</strong> High/Scope<br />
group or <strong>the</strong> Nursery School group. On no variable did <strong>the</strong> High/Scope group have an advantage<br />
over <strong>the</strong> Nursery School group, and on no variable did <strong>the</strong> Nursery School group have an<br />
advantage over <strong>the</strong> High/Scope group.<br />
Preschool Direct Instruction Did Not Prevent Crime<br />
With nearly half of its members requiring treatment for emotional impairment or<br />
disturbance and with three times as many felony arrests, <strong>the</strong> Direct Instruction group, especially<br />
<strong>the</strong> males in this group, did not fare as well in <strong>the</strong> long run as <strong>the</strong> o<strong>the</strong>r <strong>curriculum</strong> groups.<br />
Unlike <strong>the</strong> High/Scope and Nursery School approaches, Direct Instruction focused on academic<br />
objectives, not on planning or social objectives. This strategy does not appear to have been in<br />
<strong>the</strong> best interests of <strong>the</strong> children served. This issue persists because of continuing demands from<br />
some parents, administrators, and policymakers that early childhood teachers use direct<br />
instructional strategies ra<strong>the</strong>r than child-initiated-learning strategies. Such demands have been<br />
<strong>the</strong> reason that <strong>the</strong> National Association for <strong>the</strong> Education of Young Children (NAEYC) has seen<br />
fit to issue, and recently reissue, a position statement on developmentally appropriate practice<br />
(Bredekamp, 1987; Bredekamp & Copple, 1997). Despite this clearly taken position, on a recent<br />
survey of a random sample of NAEYC members, 13% of respondents said <strong>the</strong>y used Direct<br />
Instruction in <strong>the</strong>ir classrooms (Epstein, Schweinhart, and McAdoo, 1996).<br />
Future research should examine <strong>the</strong> generalizability of this <strong>study</strong>’s findings. Can<br />
<strong>preschool</strong> programs based on child-initiated learning activities help prevent crime in all children,<br />
or only in children born in poverty or o<strong>the</strong>rwise at risk of school failure Do <strong>the</strong>se findings<br />
apply only to <strong>preschool</strong> programs or do <strong>the</strong>y apply as well to educational programs for children<br />
in kindergarten and older Early elementary Direct Instruction appears to have had beneficial<br />
22
effects on children’s schooling at some sites (Gersten & Keating, 1987), but does it represent a<br />
missed opportunity for <strong>the</strong> early prevention of misconduct and crime, even in early elementary<br />
school In this <strong>study</strong>, could <strong>the</strong> Direct Instruction program have been modified so that it did not<br />
purchase a short-term advantage in intellectual performance at <strong>the</strong> expense of preventing longterm<br />
misconduct and crime Is <strong>high</strong>ly scripted Direct Instruction (<strong>the</strong> model used in this <strong>study</strong>)<br />
more or less effective in preventing misconduct and crime than <strong>the</strong> unscripted direct instruction<br />
that is more commonly used in schools today This <strong>study</strong> prompts <strong>the</strong> serious debate and<br />
empirical <strong>study</strong> of <strong>the</strong>se questions.<br />
Curriculum Models and Program Quality<br />
This <strong>study</strong> suggests that specific <strong>curriculum</strong> models based on child-initiated learning<br />
activities are essential if <strong>preschool</strong> programs are to produce lasting benefits. In <strong>the</strong> recent survey<br />
of NAEYC members (Epstein et al., 1996), 33% of <strong>the</strong> respondents espoused a particular<br />
<strong>curriculum</strong> model of some kind; 46% said <strong>the</strong>y blended ideas from several <strong>curriculum</strong> models;<br />
and 21% said <strong>the</strong>y used no <strong>curriculum</strong> model. Those who do not espouse a particular <strong>curriculum</strong><br />
model do not have a firm basis on which to generalize <strong>the</strong> findings of studies such as this one to<br />
<strong>the</strong>ir own programs.<br />
Teachers who want to achieve <strong>the</strong> effects found for a <strong>curriculum</strong> model must commit<br />
<strong>the</strong>mselves to use <strong>the</strong> <strong>curriculum</strong> model to guide <strong>the</strong>ir educational decisions. Research findings<br />
for program effects can only be generalized to programs that are essentially <strong>the</strong> same as <strong>the</strong><br />
programs studied. Using a <strong>curriculum</strong> model does not require <strong>the</strong> abandonment of intelligent<br />
judgment, as some have suggested (Goffin, 1993; Walsh, Smith, Alexander, & Ellwein, 1993).<br />
Situations in <strong>preschool</strong> programs are constantly changing, and teachers must apply principles<br />
intelligently to <strong>the</strong>se situations, or <strong>the</strong> principles are reduced to mindless reactions. On <strong>the</strong> o<strong>the</strong>r<br />
hand, while this <strong>study</strong> suggests that conventional early childhood wisdom is on <strong>the</strong> right track, it<br />
hardly substantiates every idea that a good early childhood teacher ever had. Compared to <strong>the</strong><br />
23
oadly defined Nursery School tradition, <strong>the</strong> High/Scope <strong>curriculum</strong> model is more precisely<br />
defined, better documented, and <strong>the</strong>refore easier to replicate.<br />
This <strong>study</strong> should dispel <strong>the</strong> belief that substantial outreach to parents, regardless of<br />
content or objectives, makes <strong>the</strong> difference between programs that have lasting success and those<br />
that do not. Biweekly home visits were as much a part of <strong>the</strong> Direct Instruction program as <strong>the</strong>y<br />
were of <strong>the</strong> o<strong>the</strong>rs. But this <strong>study</strong> does support <strong>the</strong> belief that substantial outreach to parents is a<br />
major vehicle by which a <strong>curriculum</strong> model can achieve its lasting benefits. Because parents<br />
were treated as full partners in <strong>the</strong> implementation of <strong>the</strong>se <strong>curriculum</strong> models with <strong>the</strong>ir<br />
children, it is reasonable to believe that <strong>the</strong> parents of Direct Instruction group children focused<br />
on direct teaching of academic skills while parents of <strong>the</strong> High/Scope and Nursery School group<br />
children learned to observe and extend <strong>the</strong>ir children’s development and decision-making<br />
capacity. In this way, parents as well as teachers may have led children to shift <strong>the</strong>ir behavior in<br />
ways that led to <strong>the</strong> striking long-term group differences.<br />
This <strong>study</strong> has <strong>the</strong> disadvantages of a small sample as well its advantages. The<br />
disadvantages have to do with possible limitations in <strong>the</strong> generalizability of <strong>the</strong> children in <strong>the</strong><br />
sample to all children living in poverty and <strong>the</strong> generalizability of <strong>the</strong> <strong>curriculum</strong> models<br />
implemented in <strong>the</strong> <strong>study</strong> to all implementations of <strong>the</strong>se <strong>curriculum</strong> models. The 68-member<br />
sample spent much or all of <strong>the</strong>ir lives in Ypsilanti, Michigan, experiencing its particular<br />
schools, police, and social climate, which may differ in crucial ways elsewhere. Despite <strong>the</strong><br />
initial similarity of <strong>curriculum</strong> groups, some group differences in long-term outcomes may be<br />
due to differences in background characteristics ra<strong>the</strong>r than <strong>curriculum</strong> experience, as <strong>the</strong> groupby-gender<br />
analyses show. Finally, <strong>the</strong> three <strong>curriculum</strong> models vary in practice much more than<br />
<strong>the</strong>y varied in <strong>the</strong> <strong>study</strong>. Only two to five teachers implemented each <strong>curriculum</strong> model, making<br />
it possible, despite <strong>the</strong> careful control, that teachers’ <strong>curriculum</strong> implementation styles could<br />
have affected <strong>the</strong> programs. For all of <strong>the</strong>se reasons, <strong>the</strong> <strong>study</strong> findings must be viewed as<br />
suggestive ra<strong>the</strong>r than definitive.<br />
24
On <strong>the</strong> o<strong>the</strong>r hand, <strong>the</strong> small size of <strong>the</strong> <strong>study</strong> permitted a seldom-achieved tight<br />
experimental design and control of program quality. Larger <strong>curriculum</strong> <strong>comparison</strong> studies, such<br />
as Planned Variation Head Start, have been fraught with problems of design and wide variations<br />
in program quality (e.g., Weisberg, 1973). Also, statistical analyses are designed to take small<br />
sample instability into account. To achieve statistical significance, group differences must be<br />
larger in small samples than in large samples. Thus, when group differences are found to be<br />
statistically significant in a small sample, <strong>the</strong>se differences are of considerable magnitude.<br />
Witness that <strong>the</strong> statistically significant finding of a difference in felony arrests in this <strong>study</strong><br />
required three times as many felony arrests in one group as in <strong>the</strong> o<strong>the</strong>r two.<br />
This <strong>study</strong> supports <strong>the</strong> preventive value of early childhood education based on childinitiated<br />
learning activities over early childhood education based on scripted teacher-directed<br />
instruction. It identifies <strong>the</strong> High/Scope Curriculum and a particular traditional Nursery School<br />
approach as methods of <strong>preschool</strong> education that develop children’s initiative, planning ability<br />
and social reasoning---<strong>the</strong> requisite skills and dispositions to become responsible adults. It<br />
supports <strong>the</strong> position that use of a defined <strong>curriculum</strong> model based on child-initiated learning<br />
activities is an essential part of <strong>the</strong> definition of quality in early childhood education.<br />
25
References<br />
American College Testing Program. (1976). User's guide: Adult APL Survey. Iowa City, IA:<br />
Author.<br />
Andrews, D. A., Zinger, I., Hoge, R. D., Bonta, J, Gendreau, P., & Cullen, F. T. (1990). Does<br />
correctional treatment work A clinically-relevant and psychologically-informed metaanalysis.<br />
Criminology, 28, 369-404.<br />
Antonowicz, D. H., & Ross, R. R. (1994). Essential components of successful rehabilitation<br />
programs for offenders. International Journal of Offender Therapy and Comparative<br />
Criminology, 38, 97-104.<br />
Bachman, J. G., & Johnston, J. (1978). The Monitoring <strong>the</strong> Future questionnaire. Ann Arbor, MI:<br />
University of Michigan, Institute for Social Research.<br />
Bereiter, C. (1986). Does Direct Instruction cause delinquency Early Childhood Research<br />
Quarterly, 1, 289-292.<br />
Bereiter, C., & Engelmann, S. (1966). Teaching <strong>the</strong> disadvantaged child in <strong>the</strong> <strong>preschool</strong>.<br />
Englewood Cliffs, NJ: Prentice-Hall.<br />
Bredekamp, S. (Ed.). (1987). Developmentally appropriate practice in early childhood programs<br />
serving children from birth <strong>through</strong> age 8. Washington, DC: National Association for <strong>the</strong><br />
Education of Young Children.<br />
Bredekamp, S. & Copple, C. (Eds.). (1997). Developmentally appropriate practice in early<br />
childhood programs. Rev. ed. Washington, DC: National Association for <strong>the</strong> Education of<br />
Young Children.<br />
Bissell, J. S. (1971). Implementation of planned variation in Head Start. Washington, DC: U.S.<br />
Department of Health, Education, and Welfare, Office of Child Development.<br />
Bronson, M. B. (1994). The usefulness of an observational measure of children’s social and<br />
mastery behaviors in early childhood classrooms. Early Childhood Research Quarterly, 9, 19-<br />
43.<br />
26
Burts, D. C., Hart, C. H., Charlesworth, R., Fleege, P. O., Mosley, J., & Thomasson, R. H.<br />
(1992). Observed activities and stress behaviors of children in developmentally appropriate<br />
and inappropriate kindergarten classrooms. Early Childhood Research Quarterly, 7, 297-318.<br />
Cohen, G. N., Bronson, M. B., & Casey, M. B. (1995). Planning as a factor in school<br />
achievement. Journal of Applied Developmental Psychology, 16, 405-428.<br />
Datta, L., McHale, C, & Mitchell, S. (1976). The effects of Head Start classroom experience on<br />
some aspects of child development: A summary report of national evaluations, 1966-1969.<br />
(DHEW Publication No. OHD-76-30088). Washington, DC: U. S. Government Printing<br />
Office.<br />
DeVries, R. (1991). The eye beholding <strong>the</strong> eye of <strong>the</strong> beholder: Reply to Gersten. Early<br />
Childhood Research Quarterly, 6, 539-548.<br />
DeVries, R., Haney, J. P., & Zan, B. (1991). Sociomoral atmosphere in direct-instruction,<br />
eclectic, and constructivist kindergartens: A <strong>study</strong> of teachers' enacted interpersonal<br />
understanding. Early Childhood Research Quarterly, 6, 449-471.<br />
DeVries, R., Reese-Learned, H., & Morgan, P. (1991). Sociomoral development in directinstruction,<br />
eclectic, and constructivist kindergartens: A <strong>study</strong> of children's enacted<br />
interpersonal understanding. Early Childhood Research Quarterly, 6, 473-517.<br />
Epstein, A. S., Schweinhart, L. J., & McAdoo, L. (1996). Models of early childhood education.<br />
Ypsilanti, MI: High/Scope Press.<br />
Freeberg, N. E. (1976). Criterion measures for youth-work training programs: The development<br />
of relevant performance dimensions. Journal of Applied Psychology, 61, 537-545.<br />
Gersten, R. (1986). Response to “Consequences of three <strong>preschool</strong> <strong>curriculum</strong> models <strong>through</strong><br />
age 15.” Early Childhood Research Quarterly, 1, 293-302.<br />
Gersten, R. & Keating, T. (1987). Improving <strong>high</strong> school performance of "at-risk" students: A<br />
<strong>study</strong> of long-term benefits of direct instruction. Educational Leadership, 44(6), 28-31.<br />
27
Goffin, S. G. (1993). Curriculum models and early childhood education: Appraising <strong>the</strong><br />
relationship. New York: Merrill.<br />
Hohmann, M., Banet, B., & Weikart, D. P. (1979). Young children in action: A manual for<br />
<strong>preschool</strong> educators. Ypsilanti, MI: High/Scope Press.<br />
Hohmann, M., & Weikart, D. P. (1995). Educating young children: Active learning practices for<br />
<strong>preschool</strong> and child care programs. Ypsilanti, MI: High/Scope Press.<br />
Karnes, M. B., Schwedel, A. M., & Williams, M. B. (1983). A <strong>comparison</strong> of five approaches for<br />
educating young children from low-income homes. In Consortium for Longitudinal Studies,<br />
As <strong>the</strong> twig is bent . . . lasting effects of <strong>preschool</strong> programs (pp. 133-170). Hillsdale, NJ:<br />
Erlbaum.<br />
Karnes, M. B., Teska, J. A., & Hodgins, A. S. (1970). The effects of four programs of classroom<br />
intervention on <strong>the</strong> intellectual and language development of four-year-old disadvantaged<br />
children. American Journal of Orthopsychiatry, 40, 58-76.<br />
Kohlberg, L. & Mayer, R. (1972). Development as <strong>the</strong> aim of education. Harvard Educational<br />
Review, 42, 449-496.<br />
Marcon, R. A. (1992). Differential effects of three <strong>preschool</strong> models on inner-city 4-year-olds.<br />
Early Childhood Research Quarterly, 7, 517-530.<br />
Marcon, R. A. (1994, November). Doing <strong>the</strong> right thing for children: Linking research and policy<br />
reform in <strong>the</strong> District of Columbia Public Schools.<br />
Young Children, 50(1), 8-20.<br />
Medley, D. M., Schluck, C. G., & Ames, N. P. (1968).<br />
Recording<br />
individual pupil experiences in <strong>the</strong> classroom: A manual for<br />
PROSE recorders. Princeton, NJ: Educational Testing Service.<br />
Miller, L. B., & Bizzell, R. P. (1983). The Louisville experiment: A <strong>comparison</strong> of four<br />
programs. In Consortium for Longitudinal Studies, As <strong>the</strong> twig is bent . . . lasting effects of<br />
<strong>preschool</strong> programs (pp. 171-199). Hillsdale, NJ: Erlbaum.<br />
28
Miller, L. B. & Dyer, J. L. (1975). Four <strong>preschool</strong> programs: Their dimensions and effects.<br />
Monographs of <strong>the</strong> Society for Research in Child Development, 40 (5-6, Serial No. 162).<br />
Norušis, M. J. (1993). SPSS for Windows: Base system user’s guide, Release 6.0. Chicago:<br />
SPSS.<br />
Schweinhart, L. J., Barnes, H. V., & Weikart, D. P., with Barnett, W. S., & Epstein, A. S. (1993).<br />
Significant benefits: The High/Scope Perry Preschool <strong>study</strong> <strong>through</strong> age 27 (Monographs of<br />
<strong>the</strong> High/Scope Educational Research Foundation, 10). Ypsilanti, MI: High/Scope Press.<br />
Schweinhart, L. J., Weikart, D. P., & Larner, M. B. (1986a, September). Child-initiated activities<br />
in early childhood programs may help prevent delinquency. Early Childhood Research<br />
Quarterly, 1, 303-312.<br />
Schweinhart, L. J., & Weikart, D. P. (1997). Lasting differences: The High/Scope Preschool<br />
Curriculum Comparison <strong>study</strong> <strong>through</strong> age 23 (Monographs of <strong>the</strong> High/Scope Educational<br />
Research Foundation, 12). Ypsilanti, MI: High/Scope Press.<br />
Schweinhart, L. J., & Weikart, D. P., & Larner, M. B. (1986b). Consequences of three <strong>preschool</strong><br />
<strong>curriculum</strong> models <strong>through</strong> age 15. Early Childhood Research Quarterly, 1, 15-45.<br />
Sears, P. S., & Dowley, E. M. (1963). Research on teaching in <strong>the</strong> nursery school. In N. L. Gage<br />
(Ed.), Handbook of research on teaching. Chicago: Rand McNally.<br />
Smith, M. S. (1973). Some short-term effects of project Head Start: A preliminary report on <strong>the</strong><br />
second year of planned variation, 1970-71. Cambridge, MA: Huron Institute.<br />
Terman, L. M., & Merrill, M. A. (1960). Stanford-Binet Intelligence Scale, Form L-M: Manual<br />
for <strong>the</strong> third revision. Boston, MA: Houghton-Mifflin.<br />
U.S. Bureau of <strong>the</strong> Census. (1972). Census of population and housing: 1970, Census tracts, Ann<br />
Arbor, Mich., Standard Metropolitan Statistical Area. Final report PH(1)-11. Washington,<br />
DC: U.S. Government Printing Office.<br />
29
Walsh, D. J., Smith, M. E., Alexander, M., & Ellwein, M. C. (1993). The <strong>curriculum</strong> as<br />
mysterious and constraining: Teachers’ negotiations of <strong>the</strong> first year of a pilot programme for<br />
at-risk 4-year-olds. Journal of Curriculum Studies, 25, 317-332.<br />
Weikart, D. P. (1972). Relationship of <strong>curriculum</strong>, teaching, and learning in <strong>preschool</strong> education.<br />
In J. C. Stanley (Ed.), Preschool programs for <strong>the</strong> disadvantaged. Baltimore, MD: Johns<br />
Hopkins University Press.<br />
Weikart, D. P., Epstein, A. S., Schweinhart, L. J., & Bond, J. T. (1978). The Ypsilanti Preschool<br />
Curriculum Demonstration Project: Preschool years and longitudinal results. (Monographs of<br />
<strong>the</strong> High/Scope Educational Research Foundation, 4).Ypsilanti, MI: High/Scope Press.<br />
Weikart, D. P., Rogers, L., Adcock, C., & McClelland, D. (1971). The Cognitively Oriented<br />
Curriculum: A framework for <strong>preschool</strong> teachers. Urbana, IL: University of Illinois.<br />
Weisberg, H. I. (1973). Short-term cognitive effects of Head Start programs: A report on <strong>the</strong><br />
third year of planned variation--1971-72. Cambridge, MA: Huron Institute.<br />
30
Table 1<br />
Background Characteristics of <strong>the</strong> Original Study Participants<br />
Characteristic<br />
All<br />
Direct<br />
Instruction<br />
High/<br />
Scope<br />
Nursery<br />
School p<br />
Number of <strong>study</strong> participants 68 23 22 23<br />
First cohort 27 8 11 8<br />
Second cohort 19 7 5 7<br />
Third cohort 22 8 6 8<br />
African-Americans 65% 65% 77% 52% –<br />
Females 54% 52% 59% 52% –<br />
Family socioeconomic status a (n = 67) 8.8 (1.1) 8.7 (1.0) 9.0 (1.3) 8.9 (1.0) –<br />
Single-parent families (n = 65) 32% 35% 40% 23% –<br />
Fa<strong>the</strong>rs employed (n = 48) 98% 93% 100% 100% –<br />
Mo<strong>the</strong>rs employed (n = 66) 33% 44% 25% 29% –<br />
Fa<strong>the</strong>rs’ <strong>high</strong>est year of schooling (n = 51) 9.0 (2.2) 9.2 (1.6) 9.6 (1.7) 8.4 (2.9) –<br />
Mo<strong>the</strong>rs’ <strong>high</strong>est year of schooling (n = 66) 10.0 (1.9) 9.7 (1.7) 9.3* (2.4) 10.9* (1.2) .017<br />
Persons per household (n = 65) 6.7 (2.6) 6.8 (2.1) 6.1 (2.5) 7.1 (3.1) –<br />
Persons per room (n = 65) 1.1 (0.4) 1.2 (0.4) 1.0 (0.4) 1.2 (0.4) –<br />
Child Stanford-Binet IQ at program entry 78.3 (6.8) 78.8 (7.0) 77.5 (7.0) 78.6 (6.8) –<br />
Note.---Unless o<strong>the</strong>rwise indicated, n of <strong>the</strong> original sample = 68. The chi-square statistic tests differences in percents; <strong>the</strong><br />
analysis of variance tests differences in means (followed by standard deviations in paren<strong>the</strong>ses). The associated p-value is<br />
reported if less than .05. One group value in a row is starred if different from <strong>the</strong> o<strong>the</strong>r two at p < .05; two group values in<br />
a row are starred if different from each o<strong>the</strong>r at p < .05.<br />
a The socioeconomic status scale combines factors of mo<strong>the</strong>r’s and fa<strong>the</strong>r’s employment and schooling and persons per<br />
room.<br />
31
Table 2<br />
Background Characteristics of <strong>the</strong> Study Participants Interviewed at Age 23<br />
Direct<br />
High/ Nursery<br />
Characteristic<br />
Instruction Scope School p<br />
Number of <strong>study</strong> participants 19 14 19<br />
First cohort 6 9 7<br />
Second cohort 5 2 6<br />
Third cohort 8 3 6<br />
African-Americans 68% 86% 63% –<br />
Females 53% 64% 58% –<br />
Family socioeconomic status a (n = 67) 8.7 (1.1) 8.8 (1.5) 8.8 (1.1) –<br />
Single-parent families (n = 65) 32% 42% 28% –<br />
Fa<strong>the</strong>rs employed (n = 48) 100% 100% 100% –<br />
Mo<strong>the</strong>rs employed (n = 66) 42% 21% 35% –<br />
Fa<strong>the</strong>rs’ <strong>high</strong>est year of schooling (n = 51) 10.5 (1.9) 9.3 (1.7) 8.7 (3.2) –<br />
Mo<strong>the</strong>rs’ <strong>high</strong>est year of schooling (n = 66) 9.8 (1.7) 9.0* (2.6) 10.8* (1.2) .029<br />
Persons per household (n = 65) 6.9 (2.2) 6.5 (2.8) 7.6 (3.3) –<br />
Persons per room in household (n = 65) 1.2 (0.5) 1.1 (0.4) 1.3 (0.4) –<br />
Child Stanford-Binet IQ 78.5 (7.1) 78.4 (7.7) 77.8 (7.1) –<br />
Age at age-23 interview (n = 52) 23.2 (1.0) 23.7 (0.8) 23.8 (1.4) –<br />
Home at age 23 (n = 50)<br />
Washtenaw County 90% 64% 65% –<br />
Rest of Michigan 0% 14% 29%<br />
Rest of U.S. 11% 21% 6%<br />
Note.–Unless o<strong>the</strong>rwise indicated, n = 68. Variables were collected at program entry unless age 23 is mentioned. The chisquare<br />
statistic tests differences in percents; <strong>the</strong> analysis of variance tests differences in means (followed by standard<br />
deviations in paren<strong>the</strong>ses). The associated p-value is reported if less than .100. One group value in a row is starred if<br />
different from <strong>the</strong> o<strong>the</strong>r two at p < .05; two group values in a row are starred if different from each o<strong>the</strong>r at p < .05.<br />
a Combines factors of mo<strong>the</strong>r’s and fa<strong>the</strong>r’s employment and schooling and persons per room.<br />
32
Table 3<br />
Schooling<br />
Characteristic<br />
Direct<br />
Instruction High/Scope<br />
Nursery<br />
School p<br />
Self-report<br />
a<br />
Highest year of schooling (n = 51) 12.2 (2.0) 12.4 (1.7) 12.7 (1.7) –<br />
On-time <strong>high</strong> school graduation (n = 51) 47% 64% 72% –<br />
High school graduation/GED (n = 51) 58% 71% 78% –<br />
Any post-<strong>high</strong> school education/training (n = 50) 61% 77% 79% –<br />
Highest year of schooling planned a (n = 51) 14.1* (2.2) 16.3* (1.8) 15.1 (2.2) .020<br />
Bachelor’s degree or more planned (n = 51) 36% 70% 57%<br />
School records<br />
b<br />
Years of special education 1.9 (1.6) 2.1 (3.1) 1.7 (2.7) –<br />
1 - 2 years 47% 20% 13%<br />
3 - 10 years 33% 33% 31%<br />
Years of identified educable mental impairment 0.2 (0.6) 1.1 (2.9) 0.8 (2.3) –<br />
% ever identified as EMI 13% 13% 13%<br />
Years of identified emotional impairment or disturbance 1.1* (1.5) 0.1 (0.5) 0.1 (0.3) .004<br />
% ever identified as EI 47% 6% 6%<br />
Years of identified specific learning disability 0.3 (0.9) 0.6 (1.7) 0.4 (1.0) –<br />
% ever identified as LD 13% 13% 13%<br />
Years of compensatory education 0.3 (0.6) 0.6* (1.0) 0.0* (0.0) .049<br />
1 - 3 years 20% 33% 0%<br />
Years repeating a grade 0.3 (0.6) 0.5 (0.7) 0.3 (0.6) –<br />
% ever repeated a grade 20% 40% 19%<br />
Total number of classes failed 9.6 (7.0) 5.0 (5.5) 4.9 (4.9) –<br />
Days absent per school year 6.4 (4.2) 8.3 (4.5) 6.7 (7.0) –<br />
Note.---N = 46 unless o<strong>the</strong>rwise indicated. The chi-square statistic tests differences in percents; <strong>the</strong> analysis of<br />
variance tests differences in means (followed by standard deviations in paren<strong>the</strong>ses). The associated p-value is<br />
reported if less than .05. One group value in a row is starred if different from <strong>the</strong> o<strong>the</strong>r two at p < .05; two group<br />
values in a row are starred if different from each o<strong>the</strong>r at p < .05.<br />
a Junior <strong>high</strong> school = 9, some <strong>high</strong> school = 10.5, <strong>high</strong> school graduate or GED = 12, vocational training or<br />
community college = 12.5, 1 year of college = 13, 2-year college degree = 14, 2 or more years of college = 15, 4-<br />
year college degree = 16, master’s degree = 18, doctoral degree = 20.<br />
b ”Special education” combines self-contained classes, integrated classes, and speech and language support.<br />
34
Table 4<br />
Household and Income<br />
Direct<br />
Instruction<br />
Nursery<br />
School<br />
Characteristic<br />
High/Scope<br />
p<br />
Persons living in respondent’s household (n = 49)<br />
Mo<strong>the</strong>r &/or fa<strong>the</strong>r 53% 46% 41% –<br />
O<strong>the</strong>r relatives 10% 0% 12% –<br />
Spouse 0%* 31%* 18% .045<br />
Cohabitant 21% 15% 18% –<br />
Roommate 16% 8% 0% –<br />
Alone 5% 0% 6% –<br />
Past and present pregnancies to females (n = 27) 1.8 (1.6) 0.8 (0.9) 1.2 (1.7) –<br />
0 33% 50% 50% –<br />
1-2 22% 50% 33%<br />
3-5 44% 0% 20%<br />
Ever employed during last 5 years 100% 100% 94% –<br />
Currently employed 79% 50% 72% –<br />
Monthly earnings from work (n = 48) $498 ($324) $465 ($445) $698 ($477) –<br />
$0 12% 31% 11%<br />
$100 - $500 35% 31% 33%<br />
$501 - $1,600 53% 39% 55%<br />
Monthly income from all sources (n = 38) $730 ($691) $1,378 ($1,005) $1,170 ($876) –<br />
$0 7% 0% 0%<br />
$100 - $1,000 71% 44% 60%<br />
$1,001 - $3,500 21% 56% 40%<br />
Months on welfare in last 10 years (n = 52) 13.3 (24.3) 9.3 (11.6) 13.7 (29.6) –<br />
1 - 12 16% 36% 21%<br />
13 - 60 16% 21% 11%<br />
61 - 108 5% 0% 10%<br />
Note.---N = 52 unless o<strong>the</strong>rwise indicated. The chi-square statistic tests differences in percents; <strong>the</strong> analysis of<br />
variance tests differences in means (followed by standard deviations in paren<strong>the</strong>ses). The associated p-value is<br />
reported if less than .05. One group value in a row is starred if different from <strong>the</strong> o<strong>the</strong>r two at p < .05; two group<br />
values in a row are starred if different from each o<strong>the</strong>r at p < .05.<br />
35
Table 5<br />
Positive Community Activities and Misconduct<br />
Characteristic<br />
Direct<br />
Instruction<br />
High/<br />
Scope<br />
Nursery<br />
School p<br />
Ever done volunteer work 11%* 43% 44% .047<br />
Registered to vote 37% 62% 56% –<br />
Voted in last Presidential election 21% 62%* 22% .030<br />
Voted in state or local election 5% 8% 29% –<br />
Sources of irritation (sum of 12 items; r ∀ = .594) 2.0* (2.0) 0.4* (0.6) 1.2 (1.2) .014<br />
0 32% 64% 37%<br />
1 - 2 32% 36% 47%<br />
3 - 7 37% 0% 16%<br />
Misconduct at 15 a (sum of 18 items, r ∀ = .788) 14.9* (14.7) 5.9* (6.1) 8.0 (9.1) .036<br />
Mean rank 32.8<br />
24.1 25.6 –<br />
0 28% 28% 33%<br />
1 - 10 17% 50% 39%<br />
11 - 20 17% 17% 17%<br />
21 - 55 39% 6% 6%<br />
Misconduct at 23 b (sum of 14 items, r ∀ = .748) 8.7 (9.0) 5.3 (7.4) 9.9 (6.6) –<br />
Mean rank 27.0<br />
18.7* 31.8* .049<br />
0 11% 36% 5%<br />
1 - 10 58% 43% 58%<br />
11 - 20 21% 14% 32%<br />
21 - 38 11% 7% 5%<br />
Times suspended from <strong>high</strong> school 1.6 (1.5) 1.3 (1.3) 0.8 (1.0) –<br />
0 37% 29% 48% –<br />
1 - 2 32% 50% 42%<br />
3 or more 32% 21% 11%<br />
Ever expelled from <strong>high</strong> school 16% 7% 5% –<br />
Times suspended from work 0.6 (1.1) 0.1 (0.3) 0.0 (0.0) –<br />
Mean rank 30.4*<br />
25.3 23.5* .033<br />
1 16% 7% 0%<br />
3 or more 11% 0% 0%<br />
Note.---N = 52 unless o<strong>the</strong>rwise indicated. The chi-square statistic tests differences in percents; <strong>the</strong> analysis of<br />
variance tests differences in means (followed by standard deviations in paren<strong>the</strong>ses); <strong>the</strong> Kruskal-Wallis H<br />
statistic tests differences in mean ranks (in italics) when this nonparametric procedure leads to a different<br />
conclusion from <strong>the</strong> parametric analysis. The associated p-value is reported if less than .05. One group value in<br />
a row is starred if different from <strong>the</strong> o<strong>the</strong>r two at p < .05; two group values in a row are starred if different from<br />
each o<strong>the</strong>r at p < .05.<br />
a Based on 18 items–scored 0 = 0, 1 = 1, 2 = 2, 3.5 = 3 - 4 (previously calibrated as 3.0), 5 = 5 or more times.<br />
b The 14 items–scored 0 = 0, 1 = 1, 2 = 2, 3.5 = 3 - 4, 5 = 5 or more times–were: gotten into a serious fight at<br />
work or at school, involved in a family fight, in fight with a group of friends against ano<strong>the</strong>r group, injured<br />
someone so <strong>the</strong>y needed medical care, used a weapon to get something from a person, took something worth less<br />
than $50, took something worth more than $50, took car from someone outside your family, broke into a house<br />
or building, set fire to property, damaged property, smoked marijuana, and used o<strong>the</strong>r drugs. The Pearson<br />
correlation coefficient between self-reported misconduct at 15 and self-reported misconduct at 23 was .531 (n =<br />
42, p < .001).<br />
36
Table 6<br />
Arrest Records<br />
Variable<br />
Direct<br />
Instruction High/Scope<br />
Nursery<br />
School p<br />
Lifetime arrests (juvenile and adult) 3.3 (4.2) 1.7 (2.7) 1.3 (2.6) –<br />
1 - 4 38% 37% 32%<br />
5 - 14 29% 16% 9%<br />
Adult arrests (felonies and misdemeanors) 3.0 (4.0) 1.2 (2.2) 1.1 (2.1) –<br />
1 - 4 33% 37% 32%<br />
5 - 12 24% 5% 9%<br />
Felony arrests 0.9 (1.3) 0.2 (0.7) 0.3 (0.8) .040<br />
1 - 2 22% 5% 13%<br />
3 - 4 17% 5% 4%<br />
Felony arrests at ages 17 - 21 0.2 (0.5) 0.1 (0.2) 0.3 (1.0) –<br />
1 - 2 19% 5% 9%<br />
3 - 4 0% 0% 5%<br />
Felony arrests at ages 22 and over 0.6* (1.0) 0.2 (0.7) 0.1* (0.3) .037<br />
1 - 2 29% 0% 9%<br />
3 - 4 5% 5% 0%<br />
Ever convicted of felony & sentenced to prison 14% 5% 9% –<br />
Misdemeanors 2.0 (3.0) 1.0 (1.7) 0.8 (1.4) –<br />
1 - 4 10% 21% 18%<br />
5 - 9 33% 16% 18%<br />
Property-crime arrests 0.9* (1.4) 0.0* (0.0) 0.2 (0.7) .007<br />
1 - 2 24% 0% 9%<br />
3 - 5 14% 0% 5%<br />
Violent crime arrests 0.4 (1.3) 0.1 (0.3) 0.2 (0.4) –<br />
1- 2 14% 11% 18%<br />
3 - 6 5% 0% 0%<br />
Ever arrested for a drug-related-crime 10% 5% 5% –<br />
Juvenile arrests 0.4 (0.7) 0.5 (1.8) 0.2 (0.7) –<br />
1 - 8 24% 16% 9%<br />
Note.---N = 62. The chi-square statistic tests differences in percents; <strong>the</strong> analysis of variance tests differences in<br />
means (followed by standard deviations in paren<strong>the</strong>ses); <strong>the</strong> Kruskal-Wallis H statistic tests differences in mean<br />
ranks (in italics) when this nonparametric procedure leads to a different conclusion from <strong>the</strong> parametric analysis.<br />
The associated p-value is reported if less than .05. One group value in a row is starred if different from <strong>the</strong> o<strong>the</strong>r<br />
two at p < .05; two group values in a row are starred if different from each o<strong>the</strong>r at p < .05.<br />
37
Table 7<br />
Curriculum by Gender Analyses of Outcomes Differing Significantly by Curriculum Group<br />
Characteristic<br />
Direct High/ Nursery Curriculum Gender Curriculum x<br />
Gender Instruction Scope School p p Gender p<br />
Years of identified emotional Female 0.4 0.0 0.0 .001 .006 .032<br />
impairment or disturbance<br />
(n = 46)<br />
Male 2.0 0.3 0.1<br />
Ever identified for Female 25% 0% 0%<br />
emotional impairment or<br />
disturbance<br />
Male 71% 17% 14%<br />
Times suspended from work Female 1.1 1.1 1.0 .039 – –<br />
(n = 52)<br />
Male 2.0 1.0 1.0<br />
Ever suspended from work Female 10% 11% 0%<br />
Male 80% 0% 0%<br />
a<br />
Years of schooling planned Female 13.5 16.7 15.1 .023 – –<br />
(n = 44)<br />
Male 14.6 15.5 15.1<br />
Years of compensatory Female 0.4 0.4 0.0 – – –<br />
education (n = 46)<br />
Male 0.1 0.8 0.0<br />
Sources of irritation (n = 52) Female 1.3 0.4 1.0 .012 – –<br />
Male 2.8 0.4 1.4<br />
Misconduct at 15 (n = 54) Female 15.8 4.4 7.7 .042 – –<br />
Male 14.2 8.4 8.3<br />
Misconduct at 23 (n = 52) Female 5.0 2.4 7.3 – .001 –<br />
Male 12.8 10.3 13.4<br />
Felony arrests (n = 62) Female 0.4 0.1 0.1 .026 .006 –<br />
Male 1.7 0.4 0.6<br />
Felony arrests at ages 22 and Female 0.2 0.0 0.1 .019 .006 .031<br />
over (n = 62)<br />
Male 1.2 0.4 0.1<br />
Property crimes (n = 62) Female 0.5 0.0 0.2 .006 – –<br />
Male 1.4 0.0 0.3<br />
Live with spouse (n = 49) Female 0% 22% 27% .023 – –<br />
Male 0% 50% 0%<br />
Ever done volunteer work Female 10% 33% 46% .044 – –<br />
(n = 51)<br />
Male 11% 60% 43%<br />
Voted in last Presidential Female 10% 67% 27% – – –<br />
election (n = 50)<br />
Male 33% 50% 14%<br />
Note -- The table presents means of continuous variables and percentages of categorical variables followed by p-values (less<br />
than .05) from two-way <strong>curriculum</strong>-by-gender analyses of variance. The first two variables are presented as continuous and<br />
as categorical.<br />
b Junior <strong>high</strong> school = 9, some <strong>high</strong> school = 10.5, <strong>high</strong> school graduate or GED = 12, vocational training or community<br />
college = 12.5, 1 year of college = 13, 2-year college degree = 14, 2 or more years of college = 15, 4-year college degree =<br />
16, master’s degree = 18, doctoral degree = 20.<br />
38
Figure 1<br />
Four Theoretical Approaches to Early Childhood Education<br />
Teacher<br />
Responds<br />
Initiates<br />
Child<br />
Initiates Child-centered Open framework<br />
Responds Custodial care Programmed learning<br />
Note. From “Relationship of Curriculum, Teaching, and Learning in Preschool Education,” by<br />
D. P. Weikart, 1972. In J. C. Stanley (Ed.), Preschool programs for <strong>the</strong> disadvantaged.<br />
Baltimore, MD: Johns Hopkins University Press. Copyright 1972 by The Johns Hopkins<br />
University Press. Adapted with permission.<br />
39