- Page 1 and 2: Air Traffic Management Concept Base
- Page 3 and 4: Executive Summary This report prese
- Page 5 and 6: Table of Contents 1 Introduction...
- Page 7 and 8: List of Figures 2.1 System Developm
- Page 9 and 10: Acronyms AAS AATT ACARS ACP ADF ADF
- Page 11 and 12: KIAS LAAS LAHSO LLWAS MAC MCP MDCRS
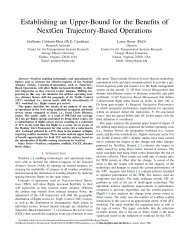
- Page 13 and 14: 1 Introduction This report presents
- Page 15 and 16: unknown technology, and thus the co
- Page 17 and 18: 2 The NAS ATM System Development Pr
- Page 19 and 20: System Requirements & Objectives Va
- Page 21 and 22: technologies needed for initial tra
- Page 23 and 24: • The goals of various users are
- Page 25 and 26: considerations are key to evaluatin
- Page 27: Free Flight White Paper on System C
- Page 31 and 32: elated component will increase with
- Page 33 and 34: Special Committees. The paper, with
- Page 35 and 36: efficiency-constraints model that i
- Page 37 and 38: • Problem Statement • Alternati
- Page 39 and 40: • The highly peaked nature of air
- Page 41 and 42: • Sector-level flow planning Each
- Page 43 and 44: • Flow managers Figure 3.3 shows
- Page 45 and 46: traffic situation as it currently a
- Page 47 and 48: • It is probable that the process
- Page 49 and 50: 3.3. Event-based trajectory deviati
- Page 51 and 52: egion takes on the order of years t
- Page 53 and 54: The answer to this question is like
- Page 55 and 56: Flight Schedule Flight Planning Fil
- Page 57 and 58: 4 Human Factors This section addres
- Page 59 and 60: 4.2.3 Human Factors Support For Imp
- Page 61 and 62: “System designers, regulators, an
- Page 63 and 64: arbitrating wherever intents confli
- Page 65 and 66: aircraft-to-aircraft separation res
- Page 67 and 68: 5 Available and Emerging Technology
- Page 69 and 70: function of all the ICPs of element
- Page 71 and 72: A key concept in the definition of
- Page 73 and 74: contrast, the older radars have azi
- Page 75 and 76: Broadcast (ADS-B), V6.0). Individua
- Page 77 and 78: is needed to develop cockpit displa
- Page 79 and 80:
ATC Voice Procedures Waypoint Repor
- Page 81 and 82:
CPC = Controller Pilot Communicatio
- Page 83 and 84:
TWDL = Two-Way Data Link CPDLC = Co
- Page 85 and 86:
the ATN ADS specification. This wil
- Page 87 and 88:
The airlines and the FAA have recen
- Page 89 and 90:
menu associated with the airport of
- Page 91 and 92:
8.0 NM 4.0 NM POPP PLMN 14.0 NM 30.
- Page 93 and 94:
The near future will probably see a
- Page 95 and 96:
ASR/SSR Radar Terminal Automation S
- Page 97 and 98:
ASR/SSR Radar Mosaic Based (Host) T
- Page 99 and 100:
Another group of users which can be
- Page 101 and 102:
and human factor elements in all fo
- Page 103 and 104:
ASOS AWOS TDWR NEXRAD Surface Upper
- Page 105 and 106:
sets as legitimate atmospheric data
- Page 107 and 108:
AWIPS/WFO- Advanced WARP Analysis P
- Page 109 and 110:
longer-term domestic and internatio
- Page 111 and 112:
example, the ceiling and visibility
- Page 113 and 114:
WARP TWIP ITWS CWIN Information Dis
- Page 115 and 116:
Constraints modeling can be perform
- Page 117 and 118:
Figure 6.4 shows a template for ill
- Page 119 and 120:
National Level. Improved Traffic Fl
- Page 121 and 122:
of flight plan management and mediu
- Page 123 and 124:
The component of the spacing buffer
- Page 125 and 126:
6.2.5 NAS Surface Figure 6.9 shows
- Page 127 and 128:
trades involved in this step will r
- Page 129 and 130:
exchange of traffic rights.” (Don
- Page 131 and 132:
above, the agency’s organizationa
- Page 133 and 134:
concepts under consideration for th
- Page 135 and 136:
1.2.4. A coordinated traffic flow p
- Page 137 and 138:
Concepts Requirements Trades Evalua
- Page 139 and 140:
2. Intent: The research area identi
- Page 141 and 142:
Acknowledgments The Boeing team wor
- Page 143 and 144:
Eurocontrol (1996), Meeting Europe
- Page 145 and 146:
Schadt, J and Rockel, B. (1996),
- Page 147 and 148:
Warren, A.W. (1994), “A New Metho
- Page 149 and 150:
Table A-1 Communication Application
- Page 151 and 152:
Table A-3 Communication Media Techn
- Page 153 and 154:
A.2 Navigation The navigation techn
- Page 155 and 156:
Table A-5 Navigation Processors Pro
- Page 157 and 158:
standardized as VDL Mode-4. Both sy
- Page 159 and 160:
Table A-6 Surveillance Inventory Su
- Page 161 and 162:
Appendix B. Global Scenario Issue T
- Page 163 and 164:
Issue # 2: Some Limitations of Futu
- Page 165 and 166:
aviation. it was agreed that ICAO
- Page 167 and 168:
• IPT architecture efforts are li
- Page 169 and 170:
Terminal Replacement System (STARS)
- Page 171 and 172:
5) Air Traffic Control: Complete an
- Page 173 and 174:
Appendix C. Comparison of FAA 2005
- Page 175 and 176:
Surface Movement Automation require
- Page 177 and 178:
Surface Movement Efficiency Table C
- Page 179 and 180:
Arrivals/ Departures Automation/ de
- Page 181 and 182:
Table C-1 Comparison of FAA 2005 an
- Page 183 and 184:
Table C-1 Comparison of FAA 2005 an
- Page 185 and 186:
Appendix D. Transition Database Thi
- Page 187 and 188:
Enabler Grouping Number NAS5.1 NAS5
- Page 189 and 190:
Enabler Grouping Number Enabler Ena
- Page 191 and 192:
Table D-1 Enabler Grouping Number E
- Page 193 and 194:
Table D-1 Enabler Grouping Number E
- Page 195 and 196:
Appendix E. Constraints Model Traff
- Page 197 and 198:
Approach Configuration - Approach P