Air Traffic Management Concept Baseline Definition - The Boeing ...
Air Traffic Management Concept Baseline Definition - The Boeing ...
Air Traffic Management Concept Baseline Definition - The Boeing ...

You also want an ePaper? Increase the reach of your titles
YUMPU automatically turns print PDFs into web optimized ePapers that Google loves.
Free Flight White Paper on System Capacity (Chew, 1997). <strong>The</strong> objective of the study<br />
was the identification of a ‘critical’ year when the airline hub operating integrity threshold<br />
is reached. <strong>The</strong> American <strong>Air</strong>line NAS study uses the 1996 Official <strong>Air</strong>line Guide (OAG)<br />
as the starting point for analysis, representing over 18,000 flights per day.<br />
100.00%<br />
90.00%<br />
Actual<br />
Simulation - AA<br />
Percent of Flights Within<br />
80.00%<br />
70.00%<br />
60.00%<br />
50.00%<br />
40.00%<br />
30.00%<br />
20.00%<br />
10.00%<br />
0.00%<br />
2<br />
4<br />
6<br />
8<br />
10<br />
12<br />
14<br />
16<br />
18<br />
20<br />
22<br />
Delay in Minutes<br />
24<br />
26<br />
28<br />
30<br />
32<br />
>33<br />
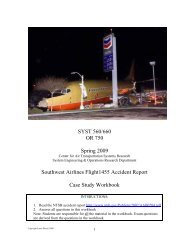
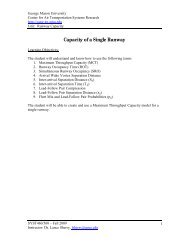
Figure 2.5 American <strong>Air</strong>lines NAS Study Validated with Actual Delay Data<br />
A simulation was conducted representing the jet traffic operating over 4,000 routes among<br />
the 50 busiest U.S. airports. An annualized traffic growth of 2.3% was assumed, based on<br />
a 4% growth in passenger enplanements. <strong>The</strong>se values are consistent with FAA and<br />
<strong>Boeing</strong> 1996 market outlook estimates. Current NAS separation standards were<br />
estimated at 7 nm en route, 2 nm in the terminal area and between 1.9 and 4.5 nm for<br />
wake vortex avoidance. Figure 2.5 indicates the model output compared with observed<br />
American <strong>Air</strong>lines data on system delay. <strong>The</strong> comparison shows that the 1996 simulation<br />
data agrees well with empirical results.<br />
<strong>The</strong> analysis examines the change in the average delay system wide, with growth in traffic,<br />
as well as the growth in the percentage of flights which experience more than 15 minutes<br />
of delay in the system. <strong>The</strong> 15 minute delay figure is considered key to maintaining hub<br />
integrity and provides a good indicator as to the hub viability. <strong>The</strong> simulation results in<br />
Figure 2.6 indicate that the 15 minute delay statistic grows faster than the average delay<br />
value. American’s study indicates delay problems in the NAS will become significant by<br />
the 2005 to 2007 time frame.<br />
15