Wyoming - Building Energy Codes
Wyoming - Building Energy Codes
Wyoming - Building Energy Codes

You also want an ePaper? Increase the reach of your titles
YUMPU automatically turns print PDFs into web optimized ePapers that Google loves.
BUILDING TECHNOLOGIES PROGRAM<br />
<strong>Wyoming</strong><br />
<strong>Energy</strong><br />
and Cost<br />
Savings<br />
for New<br />
Single– and<br />
Multifamily<br />
Homes:<br />
2009 and 2012 IECC<br />
as Compared to the<br />
2006 IECC<br />
1 2009 AND 2012 IECC AS COMPARED TO THE 2006 IECC
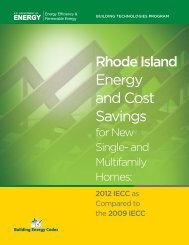
<strong>Wyoming</strong> <strong>Energy</strong> and Cost Savings<br />
for New Single– and Multifamily<br />
Homes: 2009 and 2012 IECC as<br />
Compared to the 2006 IECC<br />
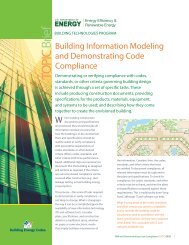
Figure 1. <strong>Wyoming</strong><br />
Climate Zones<br />
The 2009 and 2012 International<br />
<strong>Energy</strong> Conservation <strong>Codes</strong> (IECC)<br />
yield positive benefits for <strong>Wyoming</strong><br />
homeowners.<br />
Moving to either the 2009 or 2012 IECC from the 2006 IECC is<br />
cost-effective over a 30-year life cycle. On average, <strong>Wyoming</strong><br />
homeowners will save $1,809 over 30 years under the 2009 IECC,<br />
with savings still higher at $6,441 under the 2012 IECC.<br />
After accounting for up-front costs and additional costs financed<br />
in the mortgage, homeowners should see net positive cash flows<br />
(i.e., cumulative savings exceeding cumulative cash outlays) in<br />
2 years for the 2009 and 2 years with the 2012 IECC. Average<br />
annual energy savings are $131 for the 2009 IECC and $466 for<br />
the 2012 IECC.<br />
2 2009 AND 2012 IECC AS COMPARED TO THE 2006 IECC
Highlights<br />
Cost-effectiveness against a 2006 IECC baseline:<br />
• Life-cycle cost savings, averaged across climate<br />
zones and building types, are $1,809 for the 2009<br />
IECC and $6,441 for the 2012 IECC<br />
• Simple payback periods are 6 years for the 2009<br />
and 6.4 years for the 2012 IECC<br />
Consumer savings compared to a 2006 IECC baseline:<br />
• Households save an average of $131 per year in<br />
energy costs with the 2009 IECC<br />
• Household savings rise significantly to an average<br />
of $466 per year with the 2012 IECC<br />
• Net annual consumer savings, including energy<br />
savings, mortgage cost increases, and other<br />
associated costs in the first year of ownership,<br />
average $83 for the 2009 IECC and $286 for<br />
the 2012 IECC<br />
• <strong>Energy</strong> costs, on average, are 10.3% lower for the<br />
2009 IECC and 36.6% lower for the 2012 IECC<br />
Cost-Effectiveness<br />
The U.S. Department of <strong>Energy</strong> (DOE) evaluates the energy<br />
codes based on three measures of cost-effectiveness:<br />
• Life-Cycle Cost: Full accounting over a 30-year<br />
period of the cost savings, considering energy<br />
savings, the initial investment financed through<br />
increased mortgage costs, tax impacts, and residual<br />
values of energy efficiency measures<br />
• Cash Flow: Net annual cost outlay (i.e., difference<br />
between annual energy cost savings and increased<br />
annual costs for mortgage payments, etc.)<br />
• Simple Payback: Number of years required for<br />
energy cost savings to exceed the incremental first<br />
costs of a new code<br />
Life-cycle cost is the primary measure by which DOE<br />
assesses the cost-effectiveness of the IECC. These savings<br />
assume that initial costs are mortgaged, that homeowners<br />
take advantage of the mortgage interest deductions, and<br />
that long-lived efficiency measures retain a residual value<br />
after the 30-year analysis period. As shown in Table 1,<br />
life-cycle cost savings averaged across climate zones are<br />
$1,809 for the 2009 IECC and $6,441 for the 2012 IECC.<br />
Table 1. Average Life-Cycle Cost Savings from Compliance with 2009 and 2012 IECC, Relative to the 2006 IECC<br />
Life-Cycle Cost<br />
Savings ($)<br />
Net Positive<br />
Cash Flow (Years)<br />
Simple Payback<br />
(Years)<br />
2009 IECC $1,809 2 6<br />
2012 IECC $6,441 2 6.4<br />
2009 AND 2012 IECC AS COMPARED TO THE 2006 IECC<br />
3
Consumer Savings<br />
Annual consumer cash flows impact the affordability of<br />
energy-efficient homes. Based on this analysis, <strong>Wyoming</strong><br />
homeowners, on average, should see annual energy cost<br />
savings of $131 per year and achieve a net cumulative<br />
savings that accounts for an increased down payment<br />
in addition to energy costs, mortgage costs, and tax-<br />
related costs and benefits in 2 years when comparing<br />
the 2009 IECC to the 2006 IECC. When moving to the<br />
2012 IECC from the 2006 IECC, the average annual<br />
savings increase substantially to $466 per year, and it<br />
is again only 2 years before cumulative savings exceed<br />
cumulative costs. Table 2 summarizes these results.<br />
Table 2. Impacts to Consumers’ Cash Flow from Compliance with 2009 and 2012 IECC Compared to the 2006 IECC<br />
Consumers’ Cash Flow (Average) 2009 IECC 2012 IECC<br />
A<br />
Down payment and other up-front<br />
costs<br />
$85 $318<br />
B Annual energy savings (year one) $131 $466<br />
C Annual mortgage increase $46 $172<br />
D<br />
Net annual cost of mortgage interest<br />
deductions, mortgage insurance, and<br />
property taxes (year one)<br />
$2 $8<br />
E = [B-(C+D)] Net annual cash flow savings (year one) $83 $286<br />
F = [A/E]<br />
Years to positive savings, including<br />
up-front cost impacts<br />
2 2<br />
The U.S. Department of <strong>Energy</strong> (DOE) provides estimates of energy and cost savings from code adoption:<br />
• National: <strong>Energy</strong> cost savings<br />
(only)<br />
• Climate Zone: <strong>Energy</strong> cost<br />
savings, life-cycle cost savings,<br />
and consumer cash flows<br />
• State: <strong>Energy</strong> cost savings,<br />
life-cycle cost savings, consumer<br />
cash flows, and simple paybacks<br />
For more information on how these estimates were developed, visit the DOE <strong>Building</strong> <strong>Energy</strong><br />
<strong>Codes</strong> website: www.energycodes.gov/development/residential<br />
BUILDING TECHNOLOGIES PROGRAM<br />
EERE Information Center<br />
1-877-EERE-INFO (1-877-337-3463)<br />
www.eere.energy.gov/informationcenter<br />
September 2012<br />
PNNL-21776<br />
For information on <strong>Building</strong> <strong>Energy</strong><br />
<strong>Codes</strong>, visit www.energycodes.gov<br />
4 2009 AND 2012 IECC AS COMPARED TO THE 2006 IECC
Technical Appendix A<br />
Methodology<br />
An overview of the methodology used to calculate these impacts is provided below. Further information as to<br />
how these estimates were developed is available at the U.S. Department of <strong>Energy</strong>’s (DOE) <strong>Building</strong> <strong>Energy</strong><br />
<strong>Codes</strong> website. 1<br />
Cost-Effectiveness<br />
Pacific Northwest National Laboratory (PNNL) calculated three cost-effectiveness metrics in comparing the 2009<br />
and 2012 International <strong>Energy</strong> Conservation <strong>Codes</strong> (IECC) to the 2006 IECC. These are:<br />
• Life-Cycle Cost (LCC): Full accounting over a 30-year period of the cost savings, considering energy<br />
savings, the initial investment financed through increased mortgage costs, tax impacts, and residual<br />
values of energy efficiency measures<br />
• Cash Flow: Net annual cost outlay (i.e., difference between annual energy cost savings and increased<br />
annual costs for mortgage payments, etc.)<br />
• Simple Payback: Number of years required for energy cost savings to exceed the incremental first costs<br />
of a new code<br />
LCC is a robust cost-benefit metric that sums the costs and benefits of a code change over a specified time<br />
period. LCC is a well-known approach to assessing cost-effectiveness. DOE uses LCC for determining the costeffectiveness<br />
of code change proposals, and for the code as a whole, because it is the most straightforward<br />
approach to achieving the desired balance of short- and long-term perspectives.<br />
The financial and economic parameters used for these calculations are as follows:<br />
• New home mortgage parameters:<br />
o 5.0% mortgage interest rate (fixed rate)<br />
o Loan fees equal to 0.7% of the mortgage amount<br />
o 30-year loan term<br />
o 10% down payment<br />
• Other rates and economic parameters:<br />
o 5% nominal discount rate (equal to mortgage rate)<br />
o 1.6% inflation rate<br />
o 25% marginal federal income tax<br />
o 0.9% property tax<br />
o Insulation has 60-year life with linear depreciation resulting in a 50% residual value at the end of<br />
the 30-year period<br />
o Windows, duct sealing, and envelope sealing have a 30-year life and hence no residual value at<br />
the end of the analysis period<br />
o Light bulbs have a 6-year life and are replaced four times during the 30-year analysis period<br />
1 www.energycodes.gov/development/residential<br />
A.1 September 2012
<strong>Energy</strong> and Economic Analysis<br />
This analysis determined the energy savings and economic impacts of the 2009 and 2012 IECC compared to the<br />
2006 IECC. <strong>Energy</strong> usage was modeled using DOE’s <strong>Energy</strong>Plus software for two building types:<br />
1. Single-Family: A two-story home with a 30-ft by 40-ft rectangular shape, 2,400 ft 2 of floor area excluding<br />
the basement, and windows that cover 15% of the wall area, equally distributed on all sides of the house<br />
2. Multifamily: A three-story building with 18 units (6 units per floor), each unit having conditioned floor<br />
area of 1,200 ft 2 and window area equal to approximately 10% of the conditioned floor area, equally<br />
distributed on all sides of the building<br />
Each of these building types, single-family and apartment/condo in a multifamily building, have four unique<br />
foundation types:<br />
1. Slab on grade<br />
2. Heated basement<br />
3. Unheated basement<br />
4. Crawlspace<br />
Each building type also has four unique heating system types:<br />
1. Natural gas<br />
2. Heat pump<br />
3. Electric resistance<br />
4. Oil<br />
This results in 32 unique scenarios (2 × 4 × 4) for each of the three climate zones.<br />
PNNL incorporated the prescriptive requirements of the 2006, 2009, and 2012 IECC when modeling the impacts<br />
of changes to the code. Whenever possible, PNNL uses DOE’s <strong>Energy</strong>Plus model software to simulate changes<br />
to code requirements. However, in some cases, alternative methods are employed to estimate the effects of a<br />
given change. As an example, in order to give full consideration of the impacts of the 2012 IECC requirement for<br />
insulating hot water pipes (or shortening the pipe lengths), a separate estimate was developed for hot water<br />
pipe insulation requirements in the 2012 IECC, which results in a 10% savings in water heating energy use (Klein<br />
2012).<br />
<strong>Energy</strong> and economic impacts were determined separately for each unique scenario, including the single-family<br />
and multifamily buildings, the four unique foundation types, and the four unique heating system types.<br />
However, the cost-effectiveness results are reported as a single average for each climate zone and as an overall<br />
state average. To determine this average, first the results were combined across foundation types and heating<br />
system types for single-family and multifamily prototypes as shown in Table A.1 and Table A.2 (single-family and<br />
multifamily have the same shares for foundation types). For example, the primary heating system type in new<br />
residential units in <strong>Wyoming</strong> is a natural gas furnace. Therefore, the combined average energy usage<br />
calculations were proportionally weighted to account for the predominance of natural gas heating. Then singlefamily<br />
and multifamily results were combined for each climate zone in the state and the climate zone results<br />
were combined to determine a state average weighted by housing starts from 2010 U.S. Census data as shown<br />
in Table A.3.<br />
A.2 September 2012
Table A.1. Heating Equipment Shares<br />
Heating System<br />
Percent Share<br />
Single-Family<br />
Multifamily<br />
Natural gas 77.8 97.2<br />
Heat pump 19.4 2.8<br />
Electric resistance 2.6 0<br />
Oil 0.2 0<br />
Table A.2. Foundation Type Shares<br />
Foundation Type Slab on Grade Heated Basement Unheated Basement Crawlspace<br />
Percent share 26.7 36.6 11.0 25.6<br />
Table A.3. Construction by <strong>Building</strong> Type and Climate Zone<br />
Climate Zone<br />
Housing Starts<br />
Single-Family<br />
Multifamily<br />
5 18 4<br />
6 1,366 388<br />
7 162 24<br />
Differences Between the 2006 IECC, the 2009 IECC, and the 2012 IECC<br />
The state of <strong>Wyoming</strong> has no mandatory energy efficiency code. There is no detailed data on current<br />
construction techniques related to energy efficiency in new <strong>Wyoming</strong> residences. However, there is likely to be<br />
a spectrum in the levels of energy efficiency. Some new housing may be built to levels equal to or even better<br />
than the 2006 IECC (for example, homes certified to meet ENERGY STAR); others may fall well short of the IECC.<br />
For this study, we assumed that the baseline home will be built to exactly the 2006 IECC requirements. This<br />
isolates the impacts of key improvements in the 2009 and 2012 IECC.<br />
All versions of the IECC have requirements that apply uniformly to all climate zones, and other requirements<br />
that vary by climate zone. Highlights of the mandatory requirements across all buildings include:<br />
• <strong>Building</strong> envelope must be caulked and sealed. The 2012 IECC adds a requirement that the building<br />
must be tested and a level of leakage that is no more than a maximum limit must be achieved.<br />
• Ducts and air handlers must be sealed. Testing against specified maximum leakage rates is required in<br />
the 2009 and 2012 IECC if any ducts pass outside the conditioned space (e.g., in attics, unheated<br />
basements). The 2012 IECC leakage requirements are more energy efficient.<br />
• Supply and return ducts in attics, and all ducts in crawlspaces, unheated basements, garages, or<br />
otherwise outside the building envelope must be insulated.<br />
• For the 2009 and 2012 IECC, a minimum percentage of the lighting bulbs or fixtures in the dwelling must<br />
be high-efficacy lighting.<br />
• A certificate listing insulation levels and other energy efficiency measures must be posted on or near the<br />
electric service panel.<br />
A.3 September 2012
A comparison of significant IECC requirements that do not vary by climate zone is contained in Table A.4. Of<br />
these, the most significant changes in the 2009 and 2012 IECC compared to the 2006 IECC are the requirements<br />
for pressure testing of the building envelope and ducts/air handlers, and for insulating service hot water pipes<br />
(2012 IECC only). The requirement for high-efficacy lamps, while significant, is somewhat abated by a<br />
superseding federal regulation banning the manufacture or import of less efficient lamps at common watt levels<br />
that takes effect in 2012 to 2014.<br />
Table A.4. Comparison of Major Requirements That Do Not Vary by Climate Zone<br />
Requirement 2006 IECC 2009 IECC 2012 IECC<br />
<strong>Building</strong> envelope sealing<br />
Ducts and air handlers<br />
Caulked and sealed,<br />
verified by visual<br />
inspection<br />
Sealed, verified by<br />
visual inspection<br />
Caulked and sealed,<br />
verified by visual<br />
inspection against a<br />
more detailed checklist<br />
Sealed, verified by<br />
visual inspection, and<br />
pressure tested, or all<br />
ducts must be inside<br />
building envelope<br />
Caulked and sealed, verified by visual<br />
inspection and a pressure test against<br />
a leakage requirement<br />
Sealed, verified by visual inspection,<br />
and pressure tested against a leakage<br />
requirement, or all ducts must be<br />
inside building envelope<br />
Supply ducts in attics R-8 R-8 R-8<br />
Return ducts in attics and all ducts<br />
in crawlspaces, unheated<br />
basements, garages, or otherwise<br />
outside the building envelope<br />
R-8 R-6 R-6<br />
Insulation on hot water pipes for<br />
service water heating systems<br />
Insulation on hot water pipes for<br />
hydronic (boiler) space heating<br />
systems<br />
High-efficacy lamps (percent of<br />
lighting in the home)<br />
Certificate of insulation levels and<br />
other energy efficiency measures<br />
None<br />
None<br />
R-3 except where pipe run length is<br />
below a diameter-dependent<br />
threshold<br />
R-3 R-3 R-3<br />
None 50% of lamps 75% of lamps or 75% of fixtures<br />
Yes Yes Yes<br />
Requirements such as insulation levels and fenestration (window, door, and skylight) U-factors can vary by the<br />
eight zones in the United States. Table A.5 shows these requirements. <strong>Wyoming</strong> has three climate zones (Zones<br />
5, 6, and 7) as defined in the IECC.<br />
A.4 September 2012
Table A.5. Comparison of Major Requirements That Vary by Climate Zone<br />
Climate<br />
Zone<br />
IECC<br />
Ceiling<br />
(R-value)<br />
Skylight<br />
(U-factor)<br />
Fenestration<br />
(windows and doors)<br />
U-factor<br />
SHGC<br />
Wood<br />
Frame<br />
Wall<br />
(R-value)<br />
Components<br />
Mass<br />
Wall*<br />
(R-value)<br />
Floor<br />
(R-value)<br />
Basement<br />
Wall**<br />
(R-value)<br />
Tested Max<br />
Air Leakage<br />
Rate<br />
(air changes<br />
per hour)<br />
NR<br />
Slab***<br />
(R-value<br />
and depth)<br />
Crawl<br />
Space**<br />
(R-value)<br />
1<br />
2006<br />
2009 30 0.75 NR<br />
0.4<br />
0.3 13 3/4 13 NR NR<br />
NR NR<br />
2012 0.25 5<br />
2006 30 0.75 0.75 0.4<br />
NR<br />
2 2009 30 0.75 0.65 0.3 13 4/6 13 NR NR<br />
NR NR<br />
2012 38 0.65 0.4 0.25 5<br />
2006 30 0.65 0.65 0.4 13 5/8<br />
0 NR<br />
3 2009 30 0.65 0.5 0.3 13 5/8 19 5/13**** NR<br />
NR 5/13<br />
2012 38 0.55 0.35 0.25 20 8/13 5/13**** 3<br />
2006 38 0.6 0.4<br />
13 5/13<br />
10/13 NR<br />
10/13<br />
NR<br />
4 2009 38 0.6 0.35 13 5/10 19 10/13 NR 10, 2 ft 10/13<br />
2012 49 0.55 0.35 0.4 20 8/13 10/13 3 10/13<br />
2006 38 0.6 0.35<br />
19 13/19<br />
10/13 NR<br />
10/13<br />
5 2009 38 0.6 0.35 NR<br />
20 13/17 30 10/13 NR 10, 2 ft 10/13<br />
2012 49 0.55 0.32 20 15/19 15/19 3 15/19<br />
2006<br />
0.6 0.35<br />
19 10/13<br />
10/13 NR<br />
10/13<br />
6 2009 49 0.6 0.35 NR<br />
20 15/19 30 15/19 NR 10, 4 ft 10/13<br />
2012 0.55 0.32 20+5 15/19 15/19 3 15/19<br />
2006<br />
0.6 0.35<br />
21<br />
30 10/13 NR<br />
10/13<br />
7 and 8 2009 49 0.6 0.35 NR<br />
21 19/21 38 15/19 NR 10, 4 ft 10/13<br />
2012 0.55 0.32 20+5 38 15/19 3 15/19<br />
* The second number applies when more than half the insulation is on the interior side of the high mass material in the wall.<br />
** The first number is for continuous insulation (e.g., a board or blanket directly on the foundation wall) and the second number is for cavity insulation (i.e., if there<br />
is a furred-out wall built against the foundation wall). Only one of these two has to be met.<br />
*** The first number is R-value. The second value refers to the vertical depth of the insulation around the perimeter.<br />
**** Basement wall insulation is not required in the warm-humid region of Zone 3 in the southeastern United States.<br />
NR = not required<br />
SHGC = solar heat gain coefficient<br />
A.5 September 2012
While exemptions or allowances in the code are not included in this analysis, the code does allow for some of<br />
these depending on the compliance path. Examples include the following:<br />
• One door and 15 ft 2 of window area are exempt<br />
• Skylight U-factors are allowed to be higher than window U-factors<br />
• Five hundred square feet or 20% of ceiling area of a cathedral ceiling, whichever is less, is allowed to<br />
have R-30 insulation in climate zones where more than R-30 is required for other ceilings<br />
Incremental First Costs<br />
Table A.6 shows the costs of implementing the prescriptive measures of the new codes. Costs are provided for<br />
both the reference home and apartment/condo, and for the cost of moving from the 2006 to the 2009 IECC, as<br />
well as from the 2006 IECC to the 2012 IECC. The costs derive from estimates assembled by Faithful + Gould<br />
(2012) and a number of other sources. 2 The original cost data were based on a national average. The costs are<br />
adjusted downwards by 11.4% (multiplied by 0.886) to reflect local construction costs based on location factors<br />
provided by Faithful + Gould (2011).<br />
Table A.6. Total Construction Cost Increase for the 2009 and 2012 IECC Compared to the 2006 IECC<br />
Unheated<br />
Basement or<br />
Crawlspace<br />
2,400 ft 2 House 1,200 ft 2 Apartment/Condo<br />
Heated Basement<br />
Slab on Grade<br />
Unheated<br />
Basement or<br />
Crawlspace<br />
Heated<br />
Basement<br />
Slab on Grade<br />
2009 IECC<br />
Zone 5 $832 $832 $832 $427 $427 $427<br />
Zone 6 $832 $1,058 $832 $427 $460 $427<br />
Zone 7 $720 $691 $465 $380 $328 $295<br />
2012 IECC<br />
Zone 5 $2,219 $2,445 $2,219 $1,169 $1,201 $1,169<br />
Zone 6 $3,310 $3,536 $3,310 $1,567 $1,600 $1,567<br />
Zone 7 $3,198 $3,169 $2,943 $1,520 $1,468 $1,435<br />
Results<br />
Life-Cycle Cost<br />
Table A.7 shows the LCC savings (discounted present value) of the new codes over the 30-year analysis period.<br />
These savings assume that initial costs are mortgaged, that homeowners take advantage of the mortgage<br />
interest tax deductions, and that efficiency measures retain a residual value at the end of the 30 years. As<br />
shown in Table A.7, LCC savings, averaged across climate zones, are $1,809 for the 2009 IECC and $6,441 for the<br />
2012 IECC.<br />
2 The Faithful +Gould cost data and other cost data for energy efficiency measures are available on the “BC3” website at<br />
http://bc3.pnnl.gov/.<br />
A.6 September 2012
Table A.7. Life-Cycle Cost Savings Compared to the 2006 IECC<br />
Zone 5 Zone 6 Zone 7 State Average<br />
2009 IECC $1,675 $1,754 $2,238 $1,809<br />
2012 IECC $6,404 $6,268 $7,977 $6,441<br />
Cash Flow<br />
Because most houses are financed, consumers will be very interested in the financial impacts of buying a home<br />
that complies with the 2009 or 2012 IECC requirements compared to the 2006 IECC. Mortgages spread the<br />
payment for the cost of a house over a long period of time (the simple payback fails to account for the impacts<br />
of mortgages). In this analysis, a 30-year fixed-rate mortgage was assumed. It was also assumed that<br />
homebuyers will deduct the interest portion of the payments from their income taxes.<br />
Table A.8 and Table A.9 show the impacts to consumers’ cash flow resulting from the improvements in the 2009<br />
and 2012 IECC, respectively. Up-front costs include the down payment and loan fees. The annual values shown<br />
in the table are for the first year.<br />
The savings from income tax deductions for the mortgage interest will slowly decrease over time while energy<br />
savings are expected to increase over time because of escalating energy prices. These tables also include<br />
increases in annual property taxes because of the higher assessed house values. The net annual cash flow<br />
includes energy costs, mortgage payments, mortgage tax deductions, and property taxes but not the up-front<br />
costs. The time to positive cash flow includes all costs and benefits, including the down payment and other upfront<br />
costs.<br />
As shown in Table A.8 , on average, there is a net positive cash flow to the consumer of $83 per year beginning<br />
in year one for the 2009 IECC. Positive cumulative savings, including payment of up-front costs, are achieved in<br />
2 years. The positive cash flow is more significant with the 2012 IECC. Here state average net annual cash flow<br />
savings are $286, with only 2 years to positive cumulative savings after covering up-front costs (see Table A.9).<br />
Table A.8. Impacts to Consumers’ Cash Flow from Compliance with 2009 IECC Compared to the 2006 IECC<br />
Cost/Benefit Zone 5 Zone 6 Zone 7<br />
State<br />
Average<br />
A Down payment and other up-front costs $81 $87 $64 $85<br />
B Annual energy savings (year one) $123 $129 $144 $131<br />
C Annual mortgage increase $44 $47 $35 $46<br />
D<br />
Net annual cost of mortgage interest deductions, mortgage<br />
insurance, and property taxes (year one)<br />
$3 $2 $2 $2<br />
E<br />
=<br />
Net annual cash flow savings (year one) $76 $80 $107 $83<br />
[B-(C+D)]<br />
F<br />
=<br />
[A/E]<br />
Years to positive savings, including up-front cost impacts 2 2 1 2<br />
A.7 September 2012
Table A.9. Impacts to Consumers’ Cash Flow from Compliance with 2012 IECC Compared to the 2006 IECC<br />
Cost/Benefit Zone 5 Zone 6 Zone 7<br />
State<br />
Average<br />
A Down payment and other up-front costs $224 $320 $311 $318<br />
B Annual energy savings (year one) $426 $458 $540 $466<br />
C Annual mortgage increase $122 $173 $169 $172<br />
D<br />
E<br />
=<br />
[B-(C+D)]<br />
F<br />
=<br />
[A/E]<br />
Net annual cost of mortgage interest deductions, mortgage<br />
insurance, and property taxes (year one)<br />
$6 $8 $9 $8<br />
Net annual cash flow savings (year one) $298 $277 $362 $286<br />
Years to positive savings, including up-front cost impacts 1 2 1 2<br />
Simple Payback<br />
Table A.10 shows the simple payback period, which consists of the construction cost increase divided by firstyear<br />
energy cost savings. This calculation yields the number of years required for the energy cost savings to pay<br />
back the initial investment. Simple payback does not consider financing of the initial costs through a mortgage<br />
or favored tax treatment of mortgages.<br />
As Table A.10 shows, the simple payback period from moving to the 2009 IECC from the 2006 IECC averages 6<br />
years across climate zones. The simple payback for the 2012 IECC is slightly longer, averaging 6.4 years.<br />
Table A.10. Simple Payback Period, Relative to the 2006 IECC (Years)<br />
Code Zone 5 Zone 6 Zone 7 State Average<br />
2009 IECC 6.2 6.3 4.2 6<br />
2012 IECC 4.9 6.5 5.4 6.4<br />
<strong>Energy</strong> Cost Savings<br />
All fuel prices were obtained from the DOE <strong>Energy</strong> Information Administration and are recent residential prices<br />
specific to <strong>Wyoming</strong> (DOE 2012a, 2012b, 2012c). For this analysis, natural gas fuel prices were set to<br />
$0.747/therm. Electricity prices were set to $0.084/kWh for space heating and $0.093/kWh for air conditioning.<br />
Oil prices were set to $23.7/MBtu. <strong>Energy</strong> prices are assumed to escalate at the rates published in DOE’s Annual<br />
<strong>Energy</strong> Outlook (DOE 2012d).<br />
Table A.11 shows the estimated annual energy costs, including heating, cooling, water heating, and lighting per<br />
home that result from meeting the requirements in the 2006, 2009, and 2012 IECC. Table A.12 shows the total<br />
A.8 September 2012
energy cost savings as both a net dollar savings and as a percentage of the total energy use. 3 Results are<br />
averaged across home type (single- and multifamily), foundation type, and heating system types.<br />
Table A.11. Annual <strong>Energy</strong> Costs for Different Versions of IECC<br />
2006 IECC 2009 IECC 2012 IECC<br />
Heating Cooling Water<br />
Water<br />
Water<br />
Lighting Total Heating Cooling Lighting Total Heating Cooling Lighting Total<br />
Heating Heating Heating<br />
Zone 5 $750 $194 $198 $158 $1,300 $662 $185 $198 $132 $1,177 $404 $178 $179 $113 $874<br />
Zone 6 $782 $109 $204 $153 $1,248 $682 $104 $204 $129 $1,119 $390 $107 $184 $109 $790<br />
Zone 7 $1,020 $75 $234 $164 $1,493 $905 $73 $234 $137 $1,349 $551 $74 $211 $117 $953<br />
State<br />
Average $804 $107 $207 $154 $1,272 $703 $102 $207 $129 $1,141 $405 $105 $187 $109 $806<br />
As can be seen from Table A.12, energy cost savings per year for the 2009 IECC compared to the 2006 IECC range<br />
from $123 in Zone 5 to $144 in Zone 7. Annual energy cost savings rise significantly with the 2012 IECC, ranging<br />
from $426 per year for Zone 5, up to $540 per year in Zone 7. On a percentage basis, energy cost savings range<br />
from about 33% to 37% with the 2012 IECC depending on climate zone.<br />
Table A.12. Total <strong>Energy</strong> Cost Savings Compared to the 2006 IECC<br />
2009 IECC 2012 IECC<br />
Savings ($/yr) Percent Savings Savings ($/yr) Percent Savings<br />
Zone 5 $123 9.5 $426 32.8<br />
Zone 6 $129 10.3 $458 36.7<br />
Zone 7 $144 9.6 $540 36.2<br />
State Average $131 10.3 $466 36.6<br />
References<br />
Faithful + Gould. 2012. Residential <strong>Energy</strong> Efficiency Measures – Prototype Estimate and Cost Data. Portland,<br />
Oregon. http://bc3.pnnl.gov/wiki/index.php/Downloads<br />
Faithful + Gould. 2011. Residential <strong>Energy</strong> Efficiency Measures – Locations Factors. Portland, Oregon.<br />
http://bc3.pnnl.gov/wiki/index.php/Downloads<br />
Klein, G. 2012. Cost Estimation for Materials and Installation of Hot Water Piping Insulation. Affiliated<br />
International Management, LLC, Newport Beach, California.<br />
3 The percent savings is the annual energy cost savings for heating, cooling, water heating, and lighting divided by the total<br />
baseline annual energy cost for heating, cooling, water heating, and lighting.<br />
A.9 September 2012
U.S. Department of <strong>Energy</strong> (DOE). 2012a. Electric Power Monthly. DOE/EIA-0226. Washington, D.C.<br />
http://www.eia.doe.gov/cneaf/electricity/epm/table5_6_a.html<br />
U.S. Department of <strong>Energy</strong> (DOE). 2012b. Natural Gas Monthly. DOE/EIA-0130. Washington, D.C.<br />
http://www.eia.gov/oil_gas/natural_gas/data_publications/natural_gas_monthly/ngm.html<br />
U.S. Department of <strong>Energy</strong> (DOE). 2012c. Petroleum Marketing Monthly. DOE/EIA-0380. Washington, D.C.<br />
http://www.eia.gov/petroleum/marketing/monthly/<br />
U.S. Department of <strong>Energy</strong> (DOE). 2012d. Annual <strong>Energy</strong> Outlook. DOE/EIA-0383. Washington, D.C.<br />
A.10 September 2012