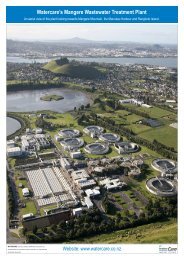
Annual Report 2012 - Watercare
Annual Report 2012 - Watercare
Annual Report 2012 - Watercare

Create successful ePaper yourself
Turn your PDF publications into a flip-book with our unique Google optimized e-Paper software.
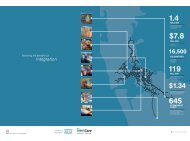
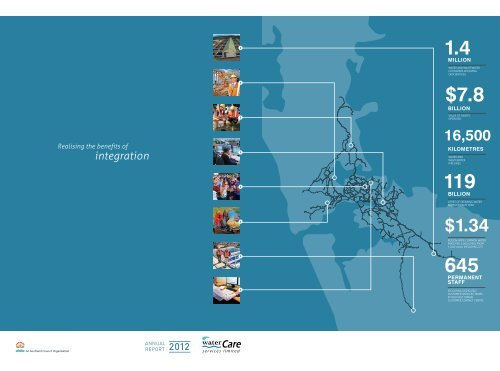
1.4<br />
million<br />
Water and wastewater<br />
customers receiving<br />
our services<br />
$7.8<br />
billion<br />
Realising the benefits of<br />
integration<br />
Value of assets<br />
operated<br />
16,500<br />
kilometres<br />
Water and<br />
wastewater<br />
pipelines<br />
119<br />
billion<br />
Litres of drinking water<br />
supplied each year<br />
$1.34<br />
Region-wide common water<br />
price per 1,000 litres from<br />
1 July <strong>2012</strong>, including GST<br />
645<br />
Permanent<br />
staff<br />
including dedicated<br />
Customer services teams<br />
at our East Tamaki<br />
Customer contact Centre<br />
<strong>Annual</strong><br />
<strong>Report</strong> <strong>2012</strong>
<strong>Watercare</strong> Services Limited<br />
<strong>2012</strong> ANNUAL REPORT<br />
Conserving the<br />
resources of<br />
today for future<br />
generations<br />
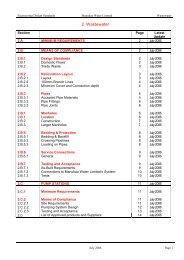
contents<br />
Serving the people of Auckland 2<br />
<strong>Watercare</strong>’s networks 3<br />
Key to performance measurement 4<br />
Performance summary 5<br />
Sustainability impacts of company activities 6<br />
Chairman’s report 8<br />
Directors’ profiles 10<br />
Chief Executive’s report 12<br />
water<br />
resource<br />
Executives’ profiles 15<br />
News 16<br />
Governance 17<br />
Local Board relationships 21<br />
treatment<br />
Environmental Advisory Group 22<br />
Engagement with Tangata Whenua 23<br />
consumer<br />
treatment<br />
1<br />
2<br />
3<br />
4<br />
5<br />
6<br />
7<br />
8<br />
Focus 1: Safe and reliable water 24<br />
Focus 2: Healthy waterways 30<br />
Focus 3: Health, safety and well-being 34<br />
Focus 4: Customer satisfaction 40<br />
Focus 5: Stakeholder relations 44<br />
Focus 6: Sustainable environment 48<br />
Focus 7: Effective asset management 54<br />
Focus 8: Sound financial management 58<br />
Sustainable<br />
approach<br />
Verification report 62<br />
Financial report 63<br />
water<br />
resource<br />
<strong>Report</strong> of the Auditor-General 72<br />
Statutory information 112<br />
Statement of Service Performance 113<br />
G3 cross-reference table 116<br />
Index 120<br />
Glossary 120<br />
contents PAGE 1
<strong>Watercare</strong> Services Limited<br />
<strong>2012</strong> ANNUAL REPORT<br />
Serving the<br />
people of<br />
Auckland<br />
Water supply and wastewater services are essential to the growth of the economic, social and<br />
environmental health and well-being of the communities they serve, and are key enablers<br />
supporting Auckland’s vision to be the world’s most liveable city. In particular, Auckland has<br />
benefited from the provision of high-quality water for drinking and other uses, sourced mainly<br />
from catchment areas specifically set aside for water supply purposes. Wastewater is treated<br />
to a high standard before being discharged into the receiving environment. This is a major<br />
contributing factor to maintaining the health of Auckland’s surroundings.<br />
Water supply and wastewater services in the Auckland region are provided by <strong>Watercare</strong><br />
Services Limited (<strong>Watercare</strong>), a Council-Controlled Organisation (CCO) from 1 July <strong>2012</strong>.<br />
In managing our vast infrastructure network of dams, pump stations, pipes and treatment<br />
plants, <strong>Watercare</strong> must ensure we deliver cost-effective services and must also recognise<br />
and plan for the needs of future generations.<br />
By law, <strong>Watercare</strong> has to manage our operations efficiently with a view to keeping the overall<br />
costs of water supply and wastewater services to our customers collectively at minimum<br />
levels. Rising population levels and changing patterns of use will lead to an increase in<br />
demand, and will require careful planning and development of assets to maintain levels of<br />
service to the people of Auckland.<br />
The integration of Auckland-wide wholesale and retail water and wastewater services has<br />
provided opportunities for efficiencies and more effective delivery of services. <strong>Watercare</strong><br />
has already delivered over $100 million of savings since integration in November 2010.<br />
Each day, <strong>Watercare</strong> draws around 370 million litres of drinking water from some 40 sources,<br />
including dams, rivers and underground springs. The combined reservoir capacity of our dams<br />
is over 100 billion litres. <strong>Watercare</strong> provides bulk services to United Water in Papakura, which<br />
manages the local network on behalf of <strong>Watercare</strong> and retails services to the local community.<br />
Water conservation is important in terms of sustainability and community well-being. As well<br />
as the sustainability benefits associated with encouraging people to use natural resources<br />
wisely, water efficiency makes good economic sense. <strong>Watercare</strong> is aiming to reduce gross<br />
per‐capita consumption by 15 per cent by 2025.<br />
<strong>Watercare</strong> collects and treats around 350 million litres of wastewater daily. We also treat and<br />
dispose of trade waste, working with customers with the aim of controlling the discharges<br />
of trade waste into the wastewater network and ensuring wastewater treatment plant<br />
discharges meet consent requirements. The company is responsible for enforcing trade waste<br />
compliance. We are continually seeking more environmentally friendly ways of managing our<br />
waste while balancing the social, cultural, and economic impacts of investment decisions.<br />
PAGE 2 serving the people of auckland
<strong>Watercare</strong> Services Limited<br />
<strong>2012</strong> ANNUAL REPORT<br />
<strong>Watercare</strong>’s<br />
Networks<br />
And the Local Board areas that we serve<br />
Great Barrier Island Inset<br />
Rodney<br />
Hibiscus Coast and Bays<br />
Upper Harbour<br />
Kaipatiki<br />
Devonport - Takapuna<br />
Waiheke<br />
Henderson - Massey<br />
Albert - Eden<br />
Waitemata<br />
Orakei<br />
Whau<br />
Waitakere Ranges<br />
Puketapapa<br />
Mangere - Otahuhu<br />
Maungakiekie - Tamaki<br />
Howick<br />
Otara - Papatoetoe<br />
Manurewa<br />
Papakura<br />
Franklin<br />
DAM<br />
WASTEWATER TREATMENT PLANT<br />
WATER TREATMENT PLANT<br />
BULK WATER SUPPLY NETWORK<br />
MAIN WASTEWATER COLLECTION NETWORK<br />
Local Boards<br />
watercare’s networks PAGE 3
<strong>Watercare</strong> Services Limited<br />
<strong>2012</strong> ANNUAL REPORT<br />
key to Performance<br />
Measurement<br />
1<br />
2<br />
3<br />
4<br />
5<br />
6<br />
7<br />
8<br />
Safe and reliable water<br />
Management of water resources to provide a safe and reliable water supply.<br />
Healthy waterways<br />
Management of wastewater discharges to maintain or improve the health of the environment.<br />
Health, safety and well-being<br />
To be an industry-best workplace.<br />
Customer satisfaction<br />
Providing customers with great service and great value.<br />
Stakeholder relations<br />
To be responsive to stakeholder requirements.<br />
Sustainable environment<br />
To minimise and/or mitigate the adverse impact of the company’s operations on the environment.<br />
Effective asset management<br />
Managing assets to ensure the use of existing assets is maximised while optimising the scope, timing and cost<br />
of new investments.<br />
Sound financial management<br />
Management of the company to meet business objectives at the lowest cost.<br />
How to read the performance rulers<br />
(Pages 26-60)<br />
<strong>Watercare</strong> uses performance rulers to measure achievements against 42 targets in the eight focus areas shown above.<br />
The way some rulers are presented has changed this year (indicated with a star<br />
has remained the same.<br />
) although the methodology for calculating the results<br />
3e. Percentage performance: staff training.<br />
Target: 20 hours, training and study per employee.<br />
Achieved<br />
TARGET 100%<br />
This year’s performance<br />
10 20 30 40 50 60 70 80 90 100<br />
<strong>2012</strong> SCORE<br />
100%<br />
<strong>Watercare</strong> continued to invest significantly in the training and development of staff during<br />
2011/12, with an average of 21.7 hours per employee spent undertaking training or study<br />
throughout the year. The Engineering Graduate support group continues with 25 graduates<br />
currently working towards chartered status. All water and wastewater operational staff are<br />
actively encouraged to pursue formal qualifications, with 4 staff achieving Certificate or<br />
Diploma-level qualifications during 2011/12.<br />
KEY<br />
Target met<br />
Target not met<br />
Good performance<br />
but could do better<br />
2008 2009 2010 2011<br />
85% 90% 85% 69%<br />
Previous years’ results<br />
for comparison<br />
PAGE 4 key to performance measurement
<strong>Watercare</strong> Services Limited<br />
<strong>2012</strong> ANNUAL REPORT<br />
Performance<br />
summary<br />
<strong>Watercare</strong> measures and manages our sustainability performance against<br />
42 targets within eight focus areas. The focus areas are: safe and reliable<br />
water; healthy waterways; health, safety and well-being; customer<br />
satisfaction; stakeholder relations; sustainable environment; effective asset<br />
management; and sound financial management. The chart below shows<br />
<strong>Watercare</strong>’s performance this year against a target of 100 per cent.<br />
FoCuS 7<br />
95 %<br />
FoCuS 8<br />
97 %<br />
PercentaGe<br />
100<br />
95<br />
90<br />
85<br />
80<br />
75<br />
70<br />
65<br />
60<br />
55<br />
50<br />
45<br />
40<br />
35<br />
30<br />
25<br />
20<br />
15<br />
10<br />
97 %<br />
FoCuS 1<br />
99 %<br />
FoCuS 2<br />
1<br />
2<br />
Safe and reliable water 97%<br />
In 2011/12, <strong>Watercare</strong> has:<br />
• Continued to supply quality drinking water to 1.4 million Auckland<br />
residents and businesses<br />
• Improved the security of water supply at Ardmore Water Treatment<br />
Plant which treats 61% of Auckland’s drinking water<br />
• Greatly improved drinking water quality for the Franklin area.<br />
Outlook: Progress the $350 million Hunua No.4 water transmission<br />
pipeline work.<br />
Healthy waterways 99%<br />
In 2011/12, <strong>Watercare</strong> has:<br />
• Continued to meet high wastewater discharge standards and<br />
levels of service at metropolitan plants<br />
• Improved the compliance of rural wastewater treatment plants<br />
inherited from Auckland’s legacy councils in 2010.<br />
Outlook: Continue planned infrastructure maintenance and renewals<br />
projects to improve the health of regional waterways.<br />
FoCuS 6<br />
90 %<br />
95 %<br />
FoCuS 5<br />
100 %<br />
FoCuS 4<br />
98 %<br />
FoCuS 3<br />
3<br />
4<br />
Health, safety and well-being 98%<br />
In 2011/12, <strong>Watercare</strong> has:<br />
• Sustained a staff and contractor focus on health and safety<br />
• Performed extremely well against a range of health, safety and<br />
well-being measures.<br />
Outlook: Continue to invest in staff development and training.<br />
Customer satisfaction 100%<br />
In 2011/12, <strong>Watercare</strong> has:<br />
• Improved measured service levels in all contacts with customers<br />
• Introduced a range of online self-service and electronic billing options.<br />
Outlook: Ensure continuous improvement in responding quickly and<br />
efficiently to customers’ requirements.<br />
7<br />
7<br />
FoCuS<br />
FoCuS<br />
6<br />
6<br />
FoCuS<br />
FoCuS<br />
8<br />
8<br />
FoCuS<br />
FoCuS<br />
FoCuS FoCuS<br />
5<br />
5<br />
PercentaGe<br />
PercentaGe<br />
100<br />
95 100<br />
90 95<br />
85 90<br />
80 85<br />
75 80<br />
70 75<br />
65 70<br />
60 65<br />
55 60<br />
50 55<br />
45 50<br />
40 45<br />
35 40<br />
30 35<br />
25 30<br />
20 25<br />
15 20<br />
10 15<br />
10<br />
FoCuS<br />
FoCuS<br />
4<br />
4<br />
FoCuS FoCuS 1<br />
1<br />
FoCuS<br />
FoCuS<br />
3<br />
3<br />
FoCuS<br />
FoCuS<br />
2<br />
2<br />
Overall score<br />
for focus arEA<br />
98 %<br />
5<br />
6<br />
Stakeholder relations 95%<br />
In 2011/12, <strong>Watercare</strong> has:<br />
• Contributed to the development of the Long Term Plan and developed a<br />
new Statement of Intent in consultation with Auckland Council<br />
• Continued to work closely with environmental and Maori advisory groups.<br />
Outlook: Focus on engagement with local boards and other key stakeholders.<br />
Sustainable environment 90%<br />
In 2011/12, <strong>Watercare</strong> has:<br />
• Expanded the focus of reducing the impact of midges and odours to the<br />
communities surrounding the wastewater treatment plants and networks<br />
acquired through integration<br />
• Begun rehabilitation of the Puketutu Island with biosolids, a whole-life<br />
project enabling saving to ratepayers of $22 million in real terms.<br />
Outlook: Continue to implement sustainability across the company’s activities.<br />
Each section has a key<br />
which highlights the<br />
score for that particular<br />
focus group. The above<br />
example shows the<br />
overall score for focus 3,<br />
the highlighted segment<br />
shows how it relates to<br />
the main wheel.<br />
7<br />
Effective asset management 95%<br />
In 2011/12, <strong>Watercare</strong> has:<br />
• Continued with the staged completion of $48 million Waikato Treatment<br />
Plant upgrade<br />
• Delivered 97.5% of planned Infrastructure operations capital projects,<br />
within the $243 million capital programme.<br />
Outlook: Ensure effective delivery of the Asset Management Plan for the<br />
period 1 July <strong>2012</strong> to 30 June 2022.<br />
8<br />
Sound financial management 97%<br />
In 2011/12, <strong>Watercare</strong> has:<br />
• Maintained focus on meeting interest targets and financial ratios.<br />
• Continued to concentrate on procurement efficiency, realising savings<br />
of $3.5 million.<br />
Outlook: Maintain our focus on leveraging efficiencies and gains<br />
from the integrated company.<br />
performance summary PAGE 5
<strong>Watercare</strong> Services Limited<br />
<strong>2012</strong> ANNUAL REPORT<br />
sustainability<br />
impacts of<br />
company activities<br />
<strong>Watercare</strong> owns and operate assets…<br />
Initiative and Sustainability impacts Outcome to date Outlook <strong>2012</strong>/13<br />
... with a focus on energy<br />
Internal power generation met more than 30%<br />
of <strong>Watercare</strong>’s total energy requirements in<br />
2011/12 through biogas engines and hydro<br />
generation from water supply dams. The<br />
engines also provide low-grade waste heat<br />
to sustain the anaerobic digesters, which<br />
neutralise the solid waste products and<br />
produce biogas in the process.<br />
66<br />
Second annual carbon abatement report approved by the<br />
Ministry for the Environment, and Emissions units credited to<br />
<strong>Watercare</strong>’s account<br />
66<br />
Optimising biogas engine operating routine<br />
66<br />
Investigating benefits of increased use of off-peak energy<br />
tariffs<br />
66<br />
Proposing participation in instantaneous reserves market and<br />
proposing control and operating changes to reduce power<br />
usage and shift usage to off-peak<br />
66<br />
Assess benefits of biogas storage to achieve reduced<br />
flaring, improved engine operation and maximise peak<br />
demand generation<br />
66<br />
Achieve energy reduction with major consumers such as<br />
the Mangere aeration system<br />
66<br />
Work with network companies to reduce “Regional<br />
Coincident Peak Demand”<br />
66<br />
Research initiatives such as “Contract for Differences” to<br />
reduce costs<br />
... with a thorough maintainance programme<br />
The Reliability-Centred Maintenance (RCM)<br />
programme provides a balance between<br />
environmental and service risk by identifying<br />
optimum frequency for maintenance of assets<br />
and determining when assets can continue to<br />
be used until they need replacing.<br />
... and plans the next assets needed<br />
Master Planning provides a comprehensive<br />
review of facilities to ensure that future<br />
capacity requirements and regulatory<br />
requirements needed by the growing region<br />
can be met in a cost-effective manner.<br />
66<br />
Completed the implementation of RCM to wholesale parts of<br />
the business<br />
66<br />
Reliability block models developed on an as needed basis<br />
66<br />
RCM assisting other maintenance projects<br />
66<br />
RCM assisting capital projects and equipment<br />
66<br />
Huia Water Treatment Plant and Mangere Wastewater<br />
Treatment Plant Master Plans completed<br />
66<br />
Rosedale Network Facility Plan and Rosedale Wastewater<br />
Treatment Plant Master Plan substantially completed<br />
66<br />
Programme for preparation of water network zone<br />
management plans developed, 11 substantially completed<br />
66<br />
Align RCM models with SAP ERP system<br />
66<br />
Review asset failure data, update RCM Weibull data sets<br />
and run RCM model simulations to improve maintenance,<br />
procurement and design activities as well as asset<br />
performance<br />
66<br />
Prepare other major water treatment plant master plans<br />
66<br />
Continue development of water network zone<br />
management plans<br />
66<br />
Continue development of wastewater network master<br />
plans<br />
<strong>Watercare</strong> is contributing to the rehabilitation of Auckland’s natural environment…<br />
Initiative and Sustainability impacts Outcome to date Outlook <strong>2012</strong>/13<br />
... through rehabilitation projects<br />
<strong>Watercare</strong>’s Coastal Walkway is a 13 km public<br />
walking track linking important public reserves<br />
to the north (Ambury Farm Park) and south<br />
(Otuataua Stonefields).<br />
66<br />
Further rehabilitation work undertaken at Oruarangi<br />
Creek mouth<br />
66<br />
Additional land purchased to enhance open space and the<br />
coastal area<br />
66<br />
Continue to maintain the area<br />
66<br />
Integrate Coastal walkways to into the new Puketutu<br />
Island parkland<br />
Puketutu Island will be rehabilitated with<br />
treated biosolids over a 35-year period. This<br />
long-term, cost-effective solution rehabilitates<br />
a former quarry and will result in a new<br />
regional park for the people of Auckland.<br />
66<br />
Consents and appeals finalised in 2011 66<br />
Begin application of biosolids in 2013<br />
66<br />
Commence enabling works as scheduled in <strong>2012</strong><br />
66<br />
Establish Governance Trust<br />
Pond Two is a former oxidation pond that will<br />
be an ecological reserve planted with trees<br />
after being treated with biosolids. The project<br />
is a least-cost solution and its proximity to the<br />
treatment plant minimises truck movements in<br />
urban areas.<br />
66<br />
Rehabilitation progressing<br />
66<br />
Submitted the Post-Closure Care Plan for approval<br />
66<br />
Continue rehabilitation.<br />
66<br />
Obtain approval for the Post-Closure Care Plan from<br />
the Auckland Council<br />
... through community partnerships<br />
Tree planting: throughout the Greater Auckland<br />
area <strong>Watercare</strong> is supporting community-led<br />
tree-planting initiatives.<br />
The <strong>Watercare</strong> Harbour Clean-Up Trust is<br />
sponsored by <strong>Watercare</strong> to remove litter from<br />
the Waitemata Harbour and the Tamaki Estuary.<br />
66<br />
Continued riparian planting in the Waitakere and Hunua<br />
ranges and with the Waikato RiverCare Trust<br />
66<br />
Continued native tree-planting programmes for local<br />
schools through Trees for Survival initiative<br />
66<br />
On 26 June a significant milestone was reached - a total<br />
of 3 million litres of rubbish has been removed since the<br />
Trust began operations<br />
66<br />
New website for the Trust’s activities launched,<br />
www.harbourcleanup.org.nz and new Facebook page<br />
www.facebook.com/pages/<strong>Watercare</strong>-Harbour-Clean-Up-<br />
Trust/2019<strong>2012</strong>9882257<br />
66<br />
Continue planting project for the Waikato RiverCare<br />
Trust and in the Waitakere and Hunua ranges<br />
66<br />
Maintain support of Trees for Survival<br />
66<br />
The Trust has implemented a new contract for litter<br />
collection from July <strong>2012</strong><br />
PAGE 6 sustainability impacts of company activities
<strong>Watercare</strong> Services Limited<br />
<strong>2012</strong> ANNUAL REPORT<br />
The valve intake tower at Cosseys Dam.<br />
KEY<br />
Environmental<br />
Social<br />
Economic<br />
<strong>Watercare</strong> builds major new infrastructure where needed for the growth of Auckland<br />
Initiative and Sustainability impacts Outcome to date Outlook <strong>2012</strong>/13<br />
... water supply infrastructure<br />
Hunua No.4 Watermain will provide for population<br />
growth and increased security of water supply to<br />
the Auckland region through approximately 35km<br />
of trunk watermain from Manukau City to central<br />
Auckland. Approx. $350m cost.<br />
66<br />
Redoubt Rd to Campbell Rd (28km) under construction in stages over<br />
the next 4 years<br />
66<br />
Areas of advance works already completed to coordinate with<br />
infrastructure works by others<br />
66<br />
Progress design and consents for future<br />
stages of the project between Epsom and<br />
Khyber Pass<br />
66<br />
Continue construction in the<br />
Manukau area<br />
... wastewater treatment infrastructure<br />
Central Interceptor will provide for population<br />
growth, mitigate risks of pipe failure and reduce<br />
wastewater overflows in central Auckland. The<br />
central wastewater interceptor will go from central<br />
Auckland to the Mangere Wastewater Treatment<br />
Plant. Approx. $800m.<br />
66<br />
Concept design completed<br />
66<br />
Consultation and preparation of consent application continuing<br />
66<br />
Final drafts of consent application documents are complete and<br />
undergoing final review<br />
66<br />
Complete resource consent application for<br />
submission by August <strong>2012</strong><br />
66<br />
Public notification of main works package<br />
late <strong>2012</strong>; hearing early 2013<br />
<strong>Watercare</strong> contributes to the well-being of communities<br />
Initiative and Sustainability impacts Outcome to date Outlook <strong>2012</strong>/13<br />
... improving their neighbours’ quality of life<br />
Midge control: <strong>Watercare</strong> is minimising the impact<br />
of midges on the local communities near Mangere<br />
and Rosedale wastewater treatment plants by<br />
reducing midge populations and habitats.<br />
Odour control: <strong>Watercare</strong> is minimising the impact<br />
of odour on the local communities living near the<br />
wastewater treatment plants.<br />
... making things easy for customers<br />
Monthly billing will enable households to spread<br />
the cost of water across the year and detect leaks<br />
more easily. They were previously billed on a<br />
three-monthly or six-monthly basis.<br />
Volumetric charging of wastewater enables<br />
households to be charged for what they really use.<br />
Before, the cost of wastewater was mostly a fixed<br />
charge integrated in the rates. Households had<br />
little economic interest in using water more wisely.<br />
Water demand management promotes efficient<br />
and wise use of water. It is seen as key to<br />
promoting the sustainable use of the region’s<br />
water resources.<br />
... engaging with stakeholders<br />
Engaging with the community: <strong>Watercare</strong><br />
is engaging in open communication with<br />
stakeholders using a variety of methods.<br />
... investing in staff<br />
The Graduate Engineering Programme enables<br />
engineering graduates to gain widespread<br />
experience and exposure during their early<br />
career years with <strong>Watercare</strong>.<br />
66<br />
Conducted regular field surveys of midge species and numbers<br />
66<br />
Proactive measures used for controlling midge breeding grounds<br />
66<br />
Enclosed odorous processes<br />
66<br />
Operated biofilter odour beds<br />
66<br />
Held regular meetings with odour auditors and local community<br />
66<br />
Since 1 July <strong>2012</strong>, all Aucklanders receive a monthly bill<br />
66<br />
Monthly billing undertaken following customer consultation<br />
and feedback<br />
66<br />
Since 1 July <strong>2012</strong>, wastewater charges are not included in Council rates<br />
any longer and are mostly based on volume<br />
66<br />
Adopted a target of 15% reduction in water demand by 2025 through<br />
the Regional Water Demand Management Plan<br />
66<br />
Started preparing demand management tools to achieve the target<br />
66<br />
The new <strong>2012</strong> wastewater tariff underwent public consultation as part<br />
of the development of the Auckland Plan<br />
66<br />
Continued to deliver the Adopt A Stream initiative in Auckland schools,<br />
The Rain Forest Express and increased use of social media in delivering<br />
key messages<br />
66<br />
Held open Board meetings with agendas and minutes available online.<br />
66<br />
Held 5 public open days to explain the Central Interceptor project and<br />
receive community feedback<br />
66<br />
Held public meetings in Helensville and in Kumeu, Huapai and<br />
Riverhead in relation to wastewater servicing<br />
66<br />
Extensive engagement with Local Boards<br />
66<br />
Continuing support of Engineering Graduate group activities<br />
66<br />
In-house mentoring group continuing to run successfully<br />
66<br />
Continuing support of IPENZ-recognised professional<br />
development workshops<br />
66<br />
Continue midge control programmes<br />
66<br />
Continue to undertake odour monitoring<br />
programmes<br />
66<br />
Continue to respond to odour complaints<br />
66<br />
Support given to Aucklanders by increased<br />
staff and training at <strong>Watercare</strong>’s contact<br />
centre<br />
66<br />
Support given to Aucklanders by increased<br />
staff and training at <strong>Watercare</strong>’s<br />
contact centre<br />
66<br />
Continue existing programmes<br />
66<br />
Continue preparing more tools to achieve<br />
the targets<br />
66<br />
Set up the monitoring of demand across<br />
the region<br />
66<br />
Continue Adopt A Stream and <strong>Watercare</strong>led<br />
science lessons<br />
66<br />
Continue the Rain Forest Express service<br />
66<br />
Undertake customer service survey<br />
66<br />
<strong>Watercare</strong> will continue to develop<br />
graduate engineers by providing a<br />
range of experiences during their early<br />
postgraduate years and ongoing support<br />
towards them achieving chartered status<br />
sustainability impacts of company activities PAGE 7
<strong>Watercare</strong> Services Limited<br />
<strong>2012</strong> ANNUAL REPORT<br />
Chairman’s<br />
report<br />
“<strong>Watercare</strong> is building on the significant efficiencies<br />
realised since integration to balance the need for<br />
growth with excellent levels of service.”<br />
<strong>Watercare</strong>’s first full year as an integrated<br />
water and wastewater service provider has<br />
been a successful one.<br />
I am pleased to commend the management<br />
and staff of <strong>Watercare</strong> for their work in<br />
building on last year’s integration process,<br />
and acknowledge the contribution of my<br />
Board colleagues.<br />
In the year and a half since November 2010,<br />
the company can claim many successes, but<br />
in my mind there are two achievements which<br />
stand out:<br />
• the seamless transition from a bulk supplier<br />
serving six customers to a retail business<br />
servicing 1.4 million customers, with no<br />
impact on the service delivery to those<br />
customers, and<br />
• the contribution <strong>Watercare</strong> continues to<br />
make to the success of Auckland as one of<br />
the world’s most liveable cities through the<br />
delivery of safe, reliable drinking water and<br />
environmentally sustainable collection and<br />
treatment disposal of wastewater.<br />
As we look to the year ahead and beyond,<br />
<strong>Watercare</strong> will continue to manage competing<br />
demands on its resources and funding. This<br />
means the business must prioritise when<br />
making decisions about Auckland’s future<br />
water and wastewater needs.<br />
This city is growing at a fast pace, so<br />
<strong>Watercare</strong> needs to be able to supply for peak<br />
summer water use and meet the demand<br />
for wastewater services for an increasing<br />
population at affordable prices.<br />
<strong>Watercare</strong> is forecasting $4.8 billion in<br />
capital investment over the next 10 years.<br />
The majority of that investment is directed<br />
towards renewing and improving the existing<br />
infrastructure, whilst ensuring sufficient<br />
capacity is available to cope with growth<br />
projections.<br />
Key infrastructure projects in the next<br />
10 years include:<br />
• the Hunua No.4 Watermain pipeline, which<br />
will provide for growth and improve security<br />
of supply to central Auckland and the North<br />
Shore ($350 million)<br />
• North Harbour watermain duplication to<br />
provide for growth on the North Shore and<br />
in Rodney and improve security of supply<br />
from key water sources ($265 million)<br />
• upgrade of the Huia Water Treatment Plant<br />
($185 million) to renew existing assets and<br />
improve security of supply<br />
• expansion of the Waikato Water Treatment<br />
Plant (which is a staged upgrade of the<br />
existing plant) to 150 mega-litres per day<br />
• upgrade and expansion of the rural water<br />
treatment plants ($100million)<br />
• expansion of the biological nutrient removal<br />
(BNR) treatment capacity at the Mangere<br />
Wastewater Treatment Plant ($135 million)<br />
• the Northern Interceptor, which will cater<br />
for growth in West Auckland and the North<br />
Shore, and improve performance of the<br />
existing wastewater system leading to the<br />
Rosedale plant ($168 million)<br />
• the Central Interceptor – an $800 million<br />
project which will cater for growth in central<br />
Auckland, replacing aged assets nearing the<br />
end of their lives and significantly reducing<br />
combined sewer overflows, and<br />
• the Waterfront Interceptor – a $135 million<br />
project designed to address combined sewer<br />
overflows in Herne Bay and Grey Lynn.<br />
Whilst <strong>Watercare</strong> is planning ahead to<br />
safeguard the security of Auckland’s water<br />
supply, it is essential that all consumers<br />
endeavour to reduce the amount of water<br />
used individually. To that end, <strong>Watercare</strong><br />
is actively supporting the promotion of<br />
awareness of water consumption with<br />
volumetric charging and monthly billing;<br />
minimising leaks while lifting network<br />
efficiency; and working with major users to<br />
encourage a focus on water conservation.<br />
The <strong>Watercare</strong> board comprises a range of<br />
skills and it is our role to ensure investment<br />
decisions are economically sound and aligned<br />
with the strategic outcomes sought by our<br />
shareholder, Auckland Council.<br />
During this year, Pat Snedden retired from<br />
the <strong>Watercare</strong> board – his constructive and<br />
thoughtful contribution during his nine-year<br />
tenure was greatly appreciated. At the end of<br />
2011 we welcomed Mike Allen to the board.<br />
<strong>Watercare</strong> is committed to delivering water<br />
and wastewater services that meet the needs<br />
and expectations of this growing region. Our<br />
focus for the coming year is to maintain a high<br />
level of service delivery and increase muchneeded<br />
system capacity.<br />
A successful year requires the contribution<br />
of a large number of people and processes<br />
together with the establishment and<br />
maintenance of key relationships, both<br />
external and internal.<br />
My thanks to you all.<br />
Ross B Keenan<br />
Chairman<br />
PAGE 8 chairman’s report
<strong>Watercare</strong> Services Limited<br />
<strong>2012</strong> ANNUAL REPORT<br />
Upper Nihotupu Dam spillway in action,<br />
releasing water and helping to ensure that<br />
the downstream ecosystem is maintained.<br />
chairman’s report PAGE 9
<strong>Watercare</strong> Services Limited<br />
<strong>2012</strong> ANNUAL REPORT<br />
directors’<br />
profiles<br />
Ross Keenan, 68<br />
BCom, FCIT<br />
Chairman<br />
Ross Keenan joined the <strong>Watercare</strong> board in March 2010 and was<br />
appointed Chairman in December 2010. He is an experienced<br />
company director, with corporate governance and executive<br />
experience across a diverse range of companies including airways,<br />
tourism, telecommunications, health and property development.<br />
Ross has particular knowledge and experience in the retail and<br />
wholesale water and wastewater services industry and previously<br />
served as the Chairman of Metro Water Limited.<br />
General disclosure of interests:<br />
Chair, Allied Work Force Group Ltd; Chair, Ngai Tahu Tourism Ltd;<br />
Director, Ngai Tahu Seafood Ltd; Director, Touchdown Ltd<br />
David Clarke, 53<br />
BE (Hons), ME, BBS, MBA, MInstD, FNZIM<br />
Deputy Chairman; Chair of the Capital Review Group<br />
David Clarke has considerable experience in the areas of<br />
biotechnology, IT, health, food and related sectors. He has been<br />
the inaugural chair for multiple technology industries and<br />
has strong commercial and governance skills. His background<br />
includes engineering, finance, marketing and sales. David is a<br />
fellow of the New Zealand Institute of Management and member<br />
of the NZ Institute of Directors.<br />
General disclosure of interests:<br />
Chairman, Optima Corporation Ltd – Software (Ambulance/Fire<br />
systems and Airlines Rostering); Chairman, TRGG Ltd – Radiology<br />
Services; Chairman, NZ Institute of Rural Health; Chairman, Kordia<br />
Ltd; Chairman, Skin Institute; Director, Hawkins Watts Ltd – Penrose<br />
based food company; Director, Cranleigh Merchant Bankers; Director,<br />
FarmIQ Systems Ltd; Director, Ngai Tahu Tourism Ltd; Director, Hynds<br />
Group Ltd; Trustee, South Auckland Foundation (Middlemore/CMDHB)<br />
Peter S Drummond, 59<br />
MNZM, AFInstD<br />
Peter Drummond is an experienced director and chairman, with<br />
extensive international business management and marketing<br />
expertise. He was previously Chairman of <strong>Watercare</strong> and brings<br />
extensive knowledge of the wholesale and retail water services<br />
industry. He has also served on the boards of Vector, MidCentral<br />
Health and HortResearch Ltd, as well as a large range of<br />
community organisations such as Variety - The Children’s Charity.<br />
Peter rejoined the <strong>Watercare</strong> Board in March 2010.<br />
General disclosure of interests:<br />
Chairman, United Fire Brigade Association; Chairman, Appliance<br />
Connection Ltd; Chairman, <strong>Watercare</strong> Harbour Clean Up Trust; Chairman,<br />
Variety Medical Missions South Pacific; Chairman, Ngati Whatua o Oraki<br />
whai maia; International President Variety Childrens Charity; Director,<br />
NARTA New Zealand Ltd; Director, NARTA International Pty Ltd<br />
Catherine Harland, 50<br />
BA, PGDipBus (Marketing), MBA, JP<br />
Catherine Harland has a background in research, consultancy and<br />
public policy in local and central government. She was a local<br />
government member in Auckland for 15 years, serving on and<br />
chairing major regional and city committees. Currently, Catherine<br />
is project leader at the New Zealand Institute, an independent<br />
thinktank. Previously, she worked with AUT University’s Institute<br />
of Public Policy and was engaged in consultancy work with the<br />
Auckland water industry. Catherine is a Justice of the Peace and<br />
served on the Auckland Observatory and Planetarium Trust Board<br />
for 11 years, five of those as Chair.<br />
General disclosure of interests:<br />
Director, McHar Investments Ltd ; Director, Interface Partners Ltd;<br />
Trustee, Auckland Restorative Justice Trust; Trustee, One Tree Hill<br />
Jubilee Educational Trust<br />
Susan Huria, 52<br />
FPRINZ, MInstD<br />
Chair of the Organisation Committee<br />
Susan Huria is a specialist in the Maori sector, working<br />
with Maori organisations on constitutional reviews, board<br />
appointments, support and strategic advice. She has<br />
extensive governance, marketing communications and<br />
general management experience. Susan was an executive<br />
at Auckland International Airport and worked in marketing<br />
and communications for 10 years, before starting her own<br />
management practice, Huria Anders, in 2000.<br />
General disclosure of interests:<br />
Deputy Chair, AgResearch Ltd ; Director, Northland Port<br />
Company Ltd; Director and Shareholder, Huria Anders Ltd;<br />
Director and Shareholder, Susan Huria (2003) Associates Ltd;<br />
Director and Shareholder, Te Ara Tika Properties Ltd ; Director,<br />
Vermilion Design Ltd; Director, Airways Corporation of New<br />
Zealand Ltd; Director, Veterinary Enterprises Group Limited;<br />
Trustee, First Foundation<br />
Tony Lanigan, 64<br />
BE (Hons), PhD, FIPENZ, MICE<br />
Tony Lanigan is a professional civil engineer (FIPENZ),<br />
project-management consultant and former General Manager<br />
of Fletcher Construction. He was Chancellor of Auckland<br />
University of Technology and a director of Infrastructure<br />
Auckland. Tony is currently Vice Chairman of Habitat for<br />
Humanity in New Zealand and Chair of the<br />
NZ Housing Foundation. He is a Director of the<br />
NZ Transport Agency (NZTA).<br />
General disclosure of interests:<br />
Vice Chairman, Habitat for Humanity International; Director, NZ<br />
Housing Foundation; Director, NZ Transport Agency; Director,<br />
Hargrave Project Management Limited; Director, A G Lanigan &<br />
Associates Limited<br />
Mike Allen, 51<br />
LLB, BCom<br />
Mike Allen has extensive experience in investment banking<br />
and general management in both New Zealand and the UK.<br />
He has previously consulted to the Australasian water and<br />
infrastructure sectors. Mike is chairman of Environmental<br />
Investments Limited.<br />
General disclosure of interests:<br />
Chairman: Coats plc; Director, Guinness Peat Group: Director,<br />
Godfrey Hirst Limited; Director, Innoflow Australia Limited;<br />
Director, Tower Insurance; Director, Tainui Group Holdings<br />
Limited; Director, Breakwater Consulting Limited<br />
Jeff Todd, 70<br />
CBE, BCom, FCA, FInstD<br />
Chairman of the Audit and Risk Committee<br />
Jeff Todd is a chartered accountant and company director,<br />
and was formerly managing partner for New Zealand and<br />
the Pacific for Price Waterhouse (now PwC). He is a former<br />
Chairman of the Southern Cross Medical Care Society,<br />
Southern Cross Healthcare Trust and The New Zealand<br />
Guardian Trust Company Ltd, and Director of the Reserve<br />
Bank of New Zealand and the ANZ Banking Group (NZ) Ltd.<br />
Jeff has a particular interest in corporate governance and is a<br />
fellow of the NZ Institute of Directors.<br />
General disclosure of interests:<br />
Chairman, Dynasty Hotel Group Limited; Chairman, Sanford<br />
Limited; President, Auckland Medical Research Foundation;<br />
Trustee, Goodfellow Foundation; Trustee, Christian<br />
Healthcare Trust<br />
PAGE 10 Directors’ profiles
<strong>Watercare</strong> Services Limited<br />
<strong>2012</strong> ANNUAL REPORT<br />
<strong>Watercare</strong> Senior Engineer Paul Gowans checking<br />
the interior of the new Manurewa Pump Station,<br />
constructed as part of <strong>Watercare</strong>’s Southwestern<br />
Interceptor wastewater pipeline project.<br />
Directors’ profiles PAGE 11
<strong>Watercare</strong> Services Limited<br />
<strong>2012</strong> ANNUAL REPORT<br />
chief<br />
executive’s<br />
report<br />
“Our focus for the coming year is to maintain a<br />
high standard of service to meet the expectations<br />
of a continually growing region.”<br />
Over the last year, <strong>Watercare</strong> has continued<br />
to mature as an integrated business.<br />
While Auckland’s growing population<br />
drives increasing demand for water and<br />
wastewater services, <strong>Watercare</strong> is working to<br />
reduce water demand and expand capacity<br />
in the system where required, while also<br />
maintaining service level standards and<br />
minimising costs to customers.<br />
Since November 2010, <strong>Watercare</strong> has<br />
brought into place the operational and<br />
retailing functions of the former six local<br />
network operators and councils, without<br />
compromising service delivery to<br />
our customers.<br />
Each day, we deliver the things our<br />
customers want from us: secure and safe<br />
drinking water, and the collection, treatment<br />
and disposal of wastewater in a way that<br />
keeps our environment and waterways<br />
healthy.<br />
of safe drinking water to our customers,<br />
and that enable their wastewater to be<br />
collected and treated while minimising<br />
impacts on our environment. This is even<br />
as we integrated some under-performing<br />
water and wastewater assets from the<br />
former local network operators into the<br />
mainstream network.<br />
Following integration we quickly moved to<br />
improve treatment at the non-metropolitan<br />
water treatment plants, including the<br />
installation of process upgrades at<br />
Warkworth and Wellsford to meet a<br />
required increase in performance.<br />
We also introduced process changes to<br />
improve effluent quality at non-compliant<br />
wastewater treatment plants, while<br />
compliance was maintained at all<br />
other metropolitan wastewater<br />
treatment plants.<br />
Future-proofing the water and<br />
wastewater network<br />
<strong>Watercare</strong>’s aim is to develop, operate,<br />
maintain and replace assets over the long<br />
term in order to deliver high-quality service<br />
levels and meet foreseeable future needs.<br />
Reducing water demand now defers the<br />
need for expensive upgrades and is an<br />
important focus for us.<br />
<strong>Watercare</strong>’s services are delivered via<br />
$7.8 billion worth of assets – Auckland’s<br />
entire water and wastewater infrastructure<br />
– and we are focused on using Aucklanders’<br />
investment in these assets wisely and well.<br />
This year, by striving for efficiencies such<br />
as integrated programme delivery and<br />
project design modification, we finished<br />
the year having completed the scheduled<br />
infrastructure programme, spending<br />
97 per‐cent of our $243 million budget.<br />
In this year’s <strong>Annual</strong> <strong>Report</strong> I am pleased to<br />
share the excellent progress <strong>Watercare</strong> is<br />
making in delivering those services.<br />
We are a company which carefully focuses<br />
its efforts and resources in order to deliver<br />
what our shareholder requires and what our<br />
1.4 million customers expect.<br />
My hope is that, over time, we will see<br />
greater public recognition of <strong>Watercare</strong>’s<br />
role. Here are some of the achievements<br />
that I believe deserve a mention.<br />
Water and wastewater service delivery<br />
This year we have delivered water and<br />
wastewater services without major<br />
interruption, and maintained excellent<br />
levels of service.<br />
Every day, our network teams are on the<br />
job throughout Auckland maintaining the<br />
16,500-kilometre network of pipes and<br />
plants that enable the continuous supply<br />
“Since integration in November 2010, <strong>Watercare</strong> has achieved<br />
regional cost efficiencies of more than $100 million.”<br />
The majority of the established water<br />
assets – most of which are gravity supplied<br />
– continue to serve us well. Much of the<br />
required upgrade work has been completed,<br />
is underway or is planned.<br />
Our two largest wastewater treatment<br />
plants are state of the art. The high quality<br />
of treatment at Mangere means we can<br />
discharge close to the shore. An international<br />
expert group recently advised that the<br />
2003-2007 upgrade was “an outstanding<br />
success story in relation to protection of<br />
public health and the environment” and the<br />
condition of Manukau Harbour has<br />
benefited substantially.<br />
<strong>Watercare</strong> plans capital works projects<br />
which future-proof for growth and<br />
development in the Auckland region, and<br />
which replace ageing infrastructure and<br />
ensure security of water supply.<br />
New significant infrastructure can be subject<br />
to long lead times, sometimes a decade or<br />
more. This requires considerable foresight<br />
and planning from <strong>Watercare</strong>, working<br />
closely with Auckland Council.<br />
In the last two years, completed major<br />
infrastructure includes Project Hobson, the<br />
Swanson Branch Wastewater Storage Tank,<br />
and Southwestern Interceptor upgrades.<br />
PAGE 12 chief executive’s report
<strong>Watercare</strong> Services Limited<br />
<strong>2012</strong> ANNUAL REPORT<br />
Pictured surveying work on the<br />
Hunua 4 Watermain project<br />
in Flat Bush are (left to right)<br />
contractor’s Construction<br />
Manager Tony Mills; <strong>Watercare</strong><br />
Project Manager Andy Spittal;<br />
<strong>Watercare</strong> Chief Executive Mark<br />
Ford; and contractor’s STMS<br />
Vinnie Shriwastow.<br />
Right now, two of <strong>Watercare</strong>’s biggest<br />
projects are progressing well.<br />
Construction on the $350 million Hunua<br />
No.4 Watermain has begun. This huge<br />
watermain, a major step in securing<br />
Auckland’s water supply, will run for 28<br />
kilometres from Redoubt North Reservoir in<br />
Manukau Heights to Campbell Crescent in<br />
Epsom, connecting to the local water supply<br />
network along the way. Several packages of<br />
advanced works were completed ahead of<br />
the main construction phase which began in<br />
May <strong>2012</strong>. Work is currently being carried<br />
out in the Flat Bush/Manukau Heights area,<br />
and will continue until 2016.<br />
Consenting for our single largest capital<br />
project, the $800 million Central Interceptor,<br />
is about to commence. <strong>Watercare</strong> is<br />
proposing to construct a new 13-kilometrelong<br />
tunnel to collect and carry wastewater<br />
from Western Springs through to the<br />
Mangere Wastewater Treatment Plant. The<br />
company has been consulting with affected<br />
local boards and the public as we move<br />
toward submitting a resource consent<br />
application in August.<br />
Meanwhile we are planning a number of<br />
projects on the North Shore, including<br />
the Northern Interceptor, which will allow<br />
wastewater flows to be diverted from the<br />
Northern Strategic Growth Area (NorSGA),<br />
the North Harbour watermain duplication<br />
project which will provide security of water<br />
supply, and the Barry’s Point Wastewater<br />
Pump Station.<br />
Making efficiencies work for<br />
our customers<br />
Since integration in November 2010,<br />
<strong>Watercare</strong> has achieved regional cost<br />
efficiencies of more than $100 million.<br />
This meant we were able to lower the retail<br />
price of drinking water across Auckland<br />
from 1 July 2011 by cutting the unit rate<br />
and removing the fixed service charges for<br />
water that were previously payable in some<br />
areas. Had we not achieved those efficiency<br />
savings, drinking water costs had the<br />
potential to be over 30 percent higher.<br />
Efficiencies from integration are ongoing.<br />
They include economies we can achieve<br />
because of our scale – such as the<br />
amalgamation of corporate and customer<br />
services, and improved procurement<br />
purchasing power – and the streamlining<br />
and savings we can achieve because we<br />
now plan from a regional rather than local<br />
perspective. The rationalisation of network<br />
service hubs and staff numbers has meant<br />
additional savings.<br />
Following the introduction of a standardised<br />
and substantially reduced water price for<br />
all Aucklanders in July 2011, <strong>Watercare</strong><br />
prepared to introduce the standardised<br />
wastewater tariff for residential customers<br />
on 1 July <strong>2012</strong>.<br />
chief executive’s report PAGE 13
<strong>Watercare</strong> Services Limited<br />
<strong>2012</strong> ANNUAL REPORT<br />
The new tariff will address inconsistent<br />
charging across the former council areas.<br />
The tariff was selected by Auckland Council,<br />
based on principles of equity and fairness,<br />
and approved by the <strong>Watercare</strong> board<br />
following public consultation in early <strong>2012</strong><br />
as part of the council’s Long Term Plan.<br />
Many Aucklanders will benefit from this<br />
change as they will be paying less than<br />
they did in 2011/12, but some households<br />
will face increases compared to what<br />
they paid during that period previously.<br />
Recognising that some customers still<br />
struggle to manage their household costs,<br />
<strong>Watercare</strong> established the Water Utility<br />
Consumer Assistance Trust in late 2011.<br />
While the trust receives funding from<br />
<strong>Watercare</strong>, it operates independently. The<br />
trust has the ability to grant remissions<br />
to residential customers who meet its<br />
eligibility criteria and are deemed to be<br />
struggling to manage their water and/or<br />
wastewater costs.<br />
In 2011/12, 150 customers were registered<br />
with the Water Utility Consumer Assistance<br />
Trust. To date, 52 customers have had<br />
hardship relief approved by the trust.<br />
We have also continued refining our<br />
centralised contact centre. Here, at our<br />
single point of contact for all calls to<br />
<strong>Watercare</strong>, we are now seeing consistently<br />
high levels of service against service targets,<br />
such as response to incidents, notification of<br />
shutdowns, correspondence and complaints.<br />
In the lead-up to 1 July <strong>2012</strong>, we prepared<br />
for the implementation of monthly billing.<br />
Shifting the billing frequency to monthly – a<br />
large project which meant reconfiguring<br />
a number of systems all at the same<br />
time – is a business change that has been<br />
implemented because it benefits both our<br />
customers and <strong>Watercare</strong>.<br />
Customer feedback had indicated that<br />
managing home budgets would be easier if<br />
they received a bill every month, rather than<br />
a large bill every quarter or six months. And<br />
from a business perspective, while monthly<br />
billing adds some initial cost to <strong>Watercare</strong>,<br />
this change – along with the company’s<br />
gradual shift to electronic billing – will<br />
also create savings over time, helping the<br />
business to minimise water and wastewater<br />
charges to our customers.<br />
Sustainability<br />
Our commitment to protecting the<br />
environment is embedded in our business<br />
and operations. The company is focused on<br />
delivering services that balance the needs<br />
to provide critical infrastructure to a growing<br />
region, while also ensuring our operations and<br />
services are delivered in a sustainable way.<br />
This year, having employed a full-time<br />
Sustainability Manager, we began expanding<br />
our corporate sustainability programme,<br />
capitalising on the work done by the<br />
<strong>Watercare</strong> ‘Zero Waste’ group. We are also<br />
partnering with EcoMatters Environment<br />
“Our commitment to protecting the environment is embedded<br />
in our business and operations.”<br />
Trust to help our domestic customers achieve<br />
water savings at home, and continuing other<br />
external sustainability initiatives while also<br />
planning new ones within <strong>Watercare</strong>’s new<br />
sustainability framework.<br />
Examples of our sustainability activities this<br />
year include the following:<br />
• Our core business sustainability impacts<br />
such as:<br />
• internal power generation, which<br />
in 2011/12 met more than 30% of<br />
<strong>Watercare</strong>’s total energy through biogas<br />
engines and hydro generation from<br />
water supply dams<br />
• projects such as the Hunua No.4<br />
Watermain and Central Interceptor,<br />
which will provide for population growth<br />
• direct community engagement which<br />
enables <strong>Watercare</strong> to integrate<br />
community needs into project<br />
development<br />
• Through the Adopt A Stream programme,<br />
our dedicated educator helped nearly 6000<br />
students learn about water and its vital role<br />
within our environment<br />
• The <strong>Watercare</strong> Harbour Clean-Up Trust<br />
continued overseeing the removal of litter<br />
from Auckland’s habours and promoting the<br />
concept of rubbish-free waterways<br />
• In close consultation with iwi and Auckland<br />
Council, work is underway on Puketutu<br />
Island to rehabilitate its 40 hectares of<br />
quarried land with biosolids from the<br />
Mangere Wastewater Treatment Plant.<br />
Preparation for building the biosolids<br />
placement area has begun and the site is<br />
scheduled to be operational in October<br />
2013. Over time, as the site is gradually<br />
rehabilitated, more and more land will be<br />
relinquished back to Auckland Council and<br />
opened to the public. On completion of the<br />
quarry rehabilitation in 35 year’s time, the<br />
whole island will be available as public<br />
open space.<br />
Although the tragic accident that took the<br />
life of our colleague Philomen Gulland and<br />
seriously injured Ian Winson, James Millard and<br />
Harry Barnett was recorded in last year’s <strong>Annual</strong><br />
<strong>Report</strong>, the event is so strongly embedded in<br />
our memories that it just seems too premature<br />
to consign it to history. Since the accident,<br />
<strong>Watercare</strong> has supported the families of<br />
Philomen and Ian and we’ve also endeavoured<br />
to aid the recovery of Ian, James and Harry.<br />
We are pleased that they are making steady<br />
progress. The Department of Labour is taking<br />
proceedings against <strong>Watercare</strong>.<br />
As we move into the second half of <strong>2012</strong>,<br />
I am heartened by the progress we have made<br />
as a business, and the commitment shown<br />
daily by all our staff in providing high-quality<br />
water and wastewater services to the people<br />
of Auckland.<br />
K M Ford<br />
Chief Executive<br />
PAGE 14 chief executive’s report
<strong>Watercare</strong> Services Limited<br />
<strong>2012</strong> ANNUAL REPORT<br />
Executives’<br />
profiles<br />
Mark Ford, 62<br />
CNZM, BA<br />
Chief Executive<br />
Mark Ford is the Chief Executive of <strong>Watercare</strong> Services<br />
Ltd. He held the role from 1994 to June 2009 and was<br />
reappointed following the company’s expansion to include<br />
retail operations. He is an experienced chief executive,<br />
director and chairman who has worked in the water,<br />
forestry, transport and petroleum industries. From July<br />
2009 until his recent reappointment to <strong>Watercare</strong> he was<br />
Executive Chairman of the Auckland Transition Agency, the<br />
government agency responsible for planning and managing<br />
the transition to Auckland’s new governance arrangements.<br />
Mark currently serves as Chairman of Auckland Transport<br />
and Independent Chair of the Christchurch Client<br />
Governance Group for the Infrastructure Rebuild. Mark<br />
is also a member of the Better Public Services Advisory<br />
Group. Since the end of the financial year, Mark has been<br />
appointed Chairman of Solid Energy Limited.<br />
All fees received from his association with companies or<br />
organisations outside <strong>Watercare</strong> are paid back to <strong>Watercare</strong>.<br />
Brian Monk, 62<br />
BCom, ACA<br />
Chief Financial Officer<br />
Brian Monk is a chartered accountant with 40 years’<br />
experience in corporate financial management. He<br />
was appointed to the role of Chief Financial Officer in<br />
November 2010, and holds responsibility for <strong>Watercare</strong>’s<br />
financial management, treasury and strategic planning<br />
functions, as well as the company’s Laboratory and<br />
Commercial Services division. Brian has previously<br />
held senior financial management roles with Auckland<br />
Regional Council, Fletcher Energy, Air New Zealand and US<br />
multinational S.C. Johnson & Son.<br />
David Worsnop, 60<br />
BE (Hons)<br />
Chief Operations Officer<br />
David Worsnop has over 35 years’ experience working in<br />
a range of infrastructure, power generation and primary<br />
industries. He is responsible for <strong>Watercare</strong>’s operational,<br />
networks and compliance teams. David was Group General<br />
Manager (Service Delivery) at Vector from 2008 to <strong>2012</strong>,<br />
and prior to this held a number of senior roles including<br />
New Zealand CEO of Hastie Group; Executive General<br />
Manager at Transfield Services Electrical Mechanical<br />
and Power, covering New Zealand and Australia; and<br />
management roles at industrial group SGS.<br />
Trish Langridge, 54<br />
MBA, Diploma of Nursing<br />
Chief Services Officer<br />
Trish Langridge is an experienced general manager who<br />
has worked in both the health and local government<br />
sectors. Her responsibilities include customer services,<br />
human resources and property. Trish developed and<br />
implemented the customer services function of Auckland<br />
Council prior to joining <strong>Watercare</strong> in 2011.<br />
Rob Fisher, 68<br />
ONZM, LLB, Dip TP<br />
General Counsel<br />
Rob Fisher is a barrister who has specialised in resource<br />
management, public law and local government law. He<br />
holds responsibility for statutory and environmental<br />
planning, resource consents and policy. As a litigator, he<br />
appeared frequently before the Environment Court, the<br />
High Court and the Court of Appeal. In a 40-year legal<br />
career, he has provided strategic advice and expertise<br />
to both private and public bodies, especially in the<br />
consenting of large infrastructure projects. Rob was the<br />
2010 Barrister of the Year in the New Zealand Law Awards<br />
and was made an Officer of the New Zealand Order of<br />
Merit in the 2011 Queen’s Birthday Honours.<br />
David Hawkins, 58<br />
MPP, TTC, JP<br />
Corporate Relations Manager<br />
David Hawkins’ responsibilities include government and<br />
community relations. He has a background in sales and<br />
marketing management for New Zealand and global<br />
brands, and has a strong commitment to local government<br />
and community engagement. David has previously served<br />
as an Auckland Regional Councillor and is a former Mayor<br />
of the Papakura District.<br />
David Sellars, 45<br />
BCA, CA<br />
Risk and Assurance Manager<br />
David Sellars is a chartered accountant with experience<br />
in banking and audit functions. He has previously been<br />
responsible for risk assurance, reporting on the internal<br />
control environment and governance of major projects. As<br />
the Risk and Assurance Manager, David is responsible for<br />
internal audit and risk management.<br />
Graham Wood, 55<br />
MIM, BA (Hons), FIE (Aust),<br />
MCIWEM, CPEng (Aust), C.WEM (UK)<br />
Chief Infrastructure Officer<br />
Graham Wood is a chartered mechanical engineer with<br />
25 years’ experience in the water industry across four<br />
continents. Graham has been the Managing Director<br />
of water-related businesses in Australia; at Thames<br />
Water and United Water in the United Kingdom; and at<br />
American Water in the United States of America. He joined<br />
<strong>Watercare</strong> in 2007 and now manages the company’s<br />
capital programme, new developments, energy and control<br />
systems and <strong>Watercare</strong>’s maintenance teams.<br />
executives’ profiles PAGE 15
<strong>Watercare</strong> Services Limited<br />
<strong>2012</strong> ANNUAL REPORT<br />
New Maintenance Services group for <strong>Watercare</strong><br />
In July <strong>2012</strong>, <strong>Watercare</strong> introduced a new Maintenance Services business unit which<br />
strengthens the company’s maintenance and networks capability with over 70 new staff.<br />
The new unit is split into two teams, a new Central Networks group to undertake<br />
maintenance works on <strong>Watercare</strong>’s Central Auckland area network, and the existing<br />
maintenance group which will continue to maintain the company’s water and<br />
wastewater treatment plants and operational facilities across Auckland. The new group<br />
is based in Penrose, and is led by Maintenance Services Manager Chris Kinley.<br />
<strong>Watercare</strong>’s Chief Infrastructure Officer Graham Wood says: “This is a strong strategic<br />
move for <strong>Watercare</strong> – with the new team now on board, I’m looking forward to<br />
collaborating with Chris and his unit to develop the networks maintenance side of the<br />
business, which we anticipate will provide more operational efficiencies and a positive<br />
outcome for our customers.”<br />
Graham says with the new Maintenance Services group now in place, <strong>Watercare</strong> is<br />
better positioned to grow and maintain the company’s in-house skill base, improve the<br />
interaction and deployment of operations teams, and provide a benchmark to measure<br />
the performance levels of existing maintenance contractors.<br />
Part of <strong>Watercare</strong>’s new Maintenance Services team<br />
outside the group’s operational base in Penrose.<br />
Hunua No.4 Watermain project<br />
As part of the Hunua No.4 Watermain project, <strong>Watercare</strong> worked<br />
closely with KiwiRail and contractor Hawkins Construction to<br />
facilitate the construction of a railway pipe crossing and new<br />
pedestrian overbridge at Puhinui Station in South Auckland.<br />
Infrastructure Project Manager at <strong>Watercare</strong>, Andy Spittal, says<br />
the project team set out to enable both important pieces of<br />
infrastructure to be developed within the same construction<br />
corridor, thus reducing costs by making best use of resources and<br />
minimising rail corridor disruption on the North Island Main Trunk<br />
rail line. “<strong>Watercare</strong>’s work on site commenced in October 2011.<br />
The project encompassed the demolition of the old pedestrian<br />
footbridge, construction of a temporary footbridge for pedestrians,<br />
sheet piling and excavation work for the Hunua No.4 Watermain,<br />
and construction of the new permanent pedestrian overbridge,”<br />
says Andy. “The new footbridge was opened in April <strong>2012</strong>. This<br />
project is an excellent example of <strong>Watercare</strong> taking a collaborative<br />
approach to a problem and working with key stakeholders to<br />
achieve an outcome that’s positive for everybody, including the<br />
local community.”<br />
Construction of the Hunua No.4 Watermain is progressing.<br />
The new pedestrian overbridge at Puhinui Station.<br />
In May the main construction contract for Hunua No.4 got underway<br />
in Manukau Heights. The Hunua No. 4 Watermain will run for<br />
28 kilometres from Redoubt North Reservoir in Manukau Heights to<br />
Campbell Crescent in Epsom, connecting to the local water supply<br />
along the way. Ultimately, Hunua No.4 will extend through to<br />
Khyber Reservoirs in the central city. For the majority of the route,<br />
open trenching methods are being used to lay the watermain.<br />
In sensitive areas – such as at busy intersections – more specialised<br />
construction methods are employed, for example tunnelling or pipe<br />
bridges. Several packages of advanced work have already been<br />
undertaken, such as the SH20 Manukau Harbour Bridge section that<br />
approaches Mangere Bridge and Onehunga. A 1.9-kilometre length<br />
of Hunua No.4 was installed as part of construction of the new<br />
motorway bridge on SH20 and on adjacent roads, including those<br />
at railway crossings.<br />
PAGE 16 News
<strong>Watercare</strong> Services Limited<br />
<strong>2012</strong> ANNUAL REPORT<br />
governance<br />
<strong>Watercare</strong> is a wholly owned subsidiary of Auckland Council (the<br />
Shareholder). The Board of Directors (the Board) and management of<br />
<strong>Watercare</strong> remain committed to ensuring that the company applies bestpractice<br />
governance policies and procedures. The Board is ultimately<br />
responsible for all decision making by the company.<br />
Operational responsibility is delegated<br />
to the Chief Executive by way of a formal<br />
delegated authority framework. The Board<br />
comprises eight independent, non-executive<br />
directors. Their profiles and disclosures of<br />
interests are published on page 10. Directors,<br />
including the chair, are appointed by the<br />
Shareholder.<br />
1. ACCOUNTABILITY<br />
Shareholder<br />
The Board is appointed by the Shareholder<br />
to govern <strong>Watercare</strong> in accordance with<br />
the statutory obligations and in accordance<br />
with the agreed Statement of Corporate<br />
Intent (SCI).<br />
The SCI sets out the activities to be<br />
undertaken by <strong>Watercare</strong> and specific<br />
economic, social and environmental<br />
objectives for the company. It establishes<br />
performance targets which are used to<br />
measure the company’s performance.<br />
<strong>Watercare</strong> must consult with the Shareholder,<br />
Local Boards, the Maori Statutory Board and<br />
the public during the development of the<br />
SCI. The Shareholder’s comments regarding<br />
the draft SCI were presented to the public at<br />
one of <strong>Watercare</strong>’s public Board meetings.<br />
Prior to the Board adopting the draft SCI<br />
in 2011/12, the public was invited to the<br />
Board meeting on 26 May 2011 to consider<br />
Shareholder comments on the SCI.<br />
<strong>Watercare</strong> delivered the 2011/12 SCI to<br />
the Shareholder on 30 June 2011, and the<br />
document is available on the company<br />
website www.watercare.co.nz.<br />
Performance<br />
<strong>Watercare</strong> is required by legislation to<br />
report quarterly to Auckland Council<br />
through the Accountability and<br />
Performance Committee. The performance<br />
of the company against the measures in<br />
the SCI is reported to the Board monthly<br />
and to the Shareholder quarterly. This<br />
annual report records performance<br />
of the company against non-financial<br />
performance measures included in the SCI.<br />
The non-financial performance measures<br />
are set out on pages 113-115. A wider set<br />
of measures including social, economic,<br />
environmental and selected SCI measures<br />
have been grouped under eight headings<br />
and the performance of the company<br />
against these is reported on pages 24-61.<br />
These measures are selected to reflect the<br />
performance of the integrated company<br />
across a broad base.<br />
2. TRANSPARENCY AND OPENNESS<br />
Legislative framework<br />
<strong>Watercare</strong> is a limited liability company<br />
registered under the Companies Act 1993,<br />
and a local government organisation.<br />
The Local Government Acts of 1974 and<br />
2002 define the role and duties of local<br />
government organisations in New Zealand.<br />
The legislative framework enabling and<br />
governing <strong>Watercare</strong>’s operations as the<br />
regional provider of water and wastewater<br />
services in Auckland is largely found in<br />
three Acts and amendments:<br />
1. Local Government (Tamaki Makaurau<br />
Reorganisation) Act 2009<br />
2. Local Government (Auckland Council)<br />
Act 2009<br />
3. Local Government (Auckland<br />
Transitional Provisions) Act 2010<br />
The company’s obligations to deliver water<br />
and wastewater services for Auckland are<br />
established under Part 5 section 57(1) of<br />
the Local Government (Auckland Council)<br />
Act 2009 which stipulates that an Auckland<br />
water organisation:<br />
(a) must manage its operations efficiently<br />
with a view to keeping the overall<br />
costs of water supply and wastewater<br />
services to its customers (collectively)<br />
at the minimum levels consistent<br />
with the effective conduct of its<br />
undertakings and the maintenance of<br />
the long-term integrity of its assets; and<br />
(b) must not pay any dividend or<br />
distribute any surplus in any way,<br />
directly or indirectly, to any owner or<br />
shareholder; and<br />
(c) is not required to comply with section<br />
68(b) of the Local Government Act<br />
2002 (avoiding the requirement to pay a<br />
dividend); and<br />
(d) must have regard for public safety (for<br />
example, the safety of children in urban<br />
areas) in relation to its structures.<br />
Also under the legislative framework:<br />
• the company became a Council Controlled<br />
Organisation on 1 July <strong>2012</strong>, and must<br />
remain a CCO of Auckland Council at least<br />
until 30 June 2015<br />
• at least two Board meetings a year are<br />
required to be held in public; before 30<br />
June to consider the Council’s comments<br />
on the draft SCI, and after 1 July to consider<br />
the company’s performance under the SCI<br />
in the previous year<br />
• the company’s financial statements, the<br />
SCI and specified long-term plans must be<br />
audited by the Auditor–General, or by an<br />
auditor acting on behalf of the<br />
Auditor–General.<br />
Company goals and strategies<br />
The goals and strategies for <strong>Watercare</strong> are<br />
set as part of the process of developing the<br />
SCI in association with the Shareholder and<br />
with approval by the <strong>Watercare</strong> Board of<br />
Directors. The process follows the receipt of<br />
the Mayor of Auckland’s letter of expectation<br />
which includes the vision and objectives for<br />
Auckland and the outcomes sought by the<br />
Auckland Plan. A draft SCI is then prepared<br />
by <strong>Watercare</strong> as the basis of consultation<br />
with the Shareholder which identifies the<br />
relationship between <strong>Watercare</strong>’s activity<br />
and delivery of the outcomes sought by<br />
the Mayor and those specified within the<br />
Auckland Plan. Prior to final adoption by<br />
the Board, comment on the final draft SCI<br />
is invited from Local Boards, the Maori<br />
Statutory Board and key stakeholders. This<br />
year, <strong>Watercare</strong> hosted a joint workshop<br />
between the Board and Auckland Council<br />
councillors to discuss water and wastewater<br />
strategy as a precursor to the development<br />
of a new water strategy, as required as part<br />
of the Auckland Plan.<br />
goverence PAGE 17
<strong>Watercare</strong> Services Limited<br />
<strong>2012</strong> ANNUAL REPORT<br />
<strong>Watercare</strong>’s objectives are closely aligned with<br />
those of Auckland Council, Local Boards and key<br />
stakeholders such as tangata whenua.<br />
Of special importance are the Local Boards<br />
which represent local communities under<br />
a co-governance model with the Auckland<br />
Council governing body. <strong>Watercare</strong><br />
maintains purposeful relationships with the<br />
Local Boards chairs and members arranged<br />
through a dedicated company executive<br />
which ensures flexible, transparent and<br />
timely communication and ready access to<br />
meaningful information. The relationship<br />
and channels of communication recognise<br />
the diverse needs of Local Boards and<br />
communities and the varying level of<br />
interest in <strong>Watercare</strong>’s services and projects.<br />
Performance of the Board and Chief<br />
Executive<br />
The performance of the Board is reviewed<br />
by the Shareholder annually, both in<br />
relation to the Board as a whole and the<br />
contribution of its individual members.<br />
Board remuneration is determined by the<br />
Shareholder. The performance of the Chief<br />
Executive is reviewed annually by the Board.<br />
Transparency in reporting<br />
<strong>Watercare</strong> remains committed to<br />
transparent reporting. Recognising this, the<br />
company publishes:<br />
• an annual Statement of Corporate<br />
Intent (SCI)<br />
• an annual Financial Plan<br />
• annual and long-term Asset Management<br />
Plan (AMP)<br />
• an annual report that reports performance<br />
against the SCI, non-mandatory measures,<br />
and the United Nations’ Global <strong>Report</strong>ing<br />
G3 Initiative guidelines (see page 116)<br />
• an overview of current water storage levels<br />
and other information published weekly<br />
• special reports and project newsletters for<br />
interested parties.<br />
The Board agenda, papers and minutes of<br />
the previous meeting are made available in<br />
advance of the Board meeting through the<br />
company website.<br />
Below: Members of the <strong>Watercare</strong> Board of Directors visit Ardmore Water Treatment Plant: from left,<br />
Tony Lanigan; Catherine Harland; Susan Huria; Ross Keenan (Chairman); and Jeff Todd; with Stuart<br />
Urquhart, Operations Controller and Gil Miers, Treatment Plant Manager.<br />
Setting standards of conduct for staff<br />
<strong>Watercare</strong> demands the highest standards<br />
of behaviour from its staff. All policies<br />
governing the conduct of employees are<br />
published on the company’s intranet<br />
including: Business Conduct and Ethics<br />
Policy, Gift and Inducement Policy Conflict<br />
of Interest Policy, Control of Discretionary<br />
Expenditure and Protected Disclosures<br />
Policy. All contracts managed by staff<br />
must be in writing. The policies also set<br />
out the delegated authority within the<br />
company. <strong>Watercare</strong>’s projects are subject<br />
to internal probity reviews, and external<br />
probity auditors are appointed to provide<br />
additional assurance on major projects.<br />
Complaints disclosure<br />
Any complaints against the company and<br />
the quality of response are recorded. Targets<br />
have been set for the management of<br />
these processes and the level of service<br />
is reported in the <strong>Annual</strong> <strong>Report</strong>, to the<br />
Shareholder quarterly, to the Board monthly<br />
and are made public at the board meetings<br />
and published on <strong>Watercare</strong>’s website.<br />
Whistleblowing<br />
The company has a specific policy to<br />
receive and deal with information about<br />
any serious wrong-doing within the<br />
company, as required by the Protected<br />
Disclosures Act 2000. <strong>Watercare</strong>’s policy<br />
prescribes how its <strong>Watercare</strong> staff and<br />
others report matters of serious wrongdoing,<br />
and provides contacts to whom such<br />
reporting can be made. The policy defines<br />
serious wrong-doing and applies to present<br />
and past employees, and to any individual<br />
either seconded to or working on a contract<br />
basis for <strong>Watercare</strong>.<br />
3. INTEGRITY<br />
Corporate governance charter<br />
The charter defines the duties and<br />
obligations of the Board and Board<br />
members covering fiduciary duty, duty of<br />
care, diligence, legal and statutory duties<br />
and conflicts of interest. It incorporates<br />
the principles of the New Zealand Institute<br />
of Directors’ Code of Proper Practice for<br />
Directors, relevant sections of the<br />
PAGE 18 Governance
<strong>Watercare</strong> Services Limited<br />
<strong>2012</strong> ANNUAL REPORT<br />
<strong>Watercare</strong>’s Board of Directors applies its specialist<br />
knowledge through subcommittees such as the Audit and<br />
Risk Committee and the Capital Projects Review Group.<br />
New Zealand Exchange Limited (NZX)<br />
Corporate Governance Best Practice Code<br />
and the Securities Commission’s nine<br />
principles of corporate governance.<br />
Disclosures of interest<br />
A register of directors’ interests is<br />
maintained by <strong>Watercare</strong> and is updated<br />
as and when necessary. Directors’ interests<br />
are a standard agenda item at every Board<br />
meeting. Any disclosure of interest is<br />
recorded in the meeting minutes and the<br />
participant refrains from taking part in<br />
the discussion or voting on any related<br />
resolution. In 2011/12, Board members<br />
disclosed a potential conflict of interest on<br />
two occasions.<br />
Audit and Risk Committee<br />
The Board is responsible for appointing the<br />
members of the Audit and Risk Committee.<br />
The committee’s role is to assist the Board<br />
to fulfil its responsibilities in the areas<br />
of financial reporting and to provide<br />
assurance regarding compliance with<br />
internal controls, policies and procedures.<br />
Its responsibilities are established in the<br />
Audit and Risk Committee Charter which<br />
is reviewed annually. The committee has<br />
no delegated authority. In carrying out its<br />
duties, the committee meets regularly with<br />
the external and internal auditors (both with<br />
and without management present) and the<br />
management of the company. At least one<br />
member must have accounting or financial<br />
management expertise. The chairman of the<br />
Board may not be chairman of the Audit and<br />
Risk Committee. The current chairman of the<br />
Audit and Risk Committee is Jeff Todd. All<br />
<strong>Watercare</strong>’s directors receive the papers of<br />
the Audit and Risk Committee in<br />
advance, and all are invited to attend<br />
committee meetings.<br />
Organisation Committee<br />
Following completion of the integration<br />
process the Board established an<br />
Organisation Committee to provide a link<br />
between the Chief Executive and the Board<br />
around senior staff remuneration and<br />
organisational development. The committee<br />
consists of two Board members: Susan Huria<br />
as Chair, and Ross Keenan. The Committee<br />
provides a reference point for the Chief<br />
Executive in matters around organisational<br />
change and succession planning.<br />
Capital Project Review Group<br />
The Capital Projects Review Group (the<br />
Group) is chaired by a member of the<br />
<strong>Watercare</strong> Board of Directors, currently<br />
David Clarke, and includes other Board<br />
members and senior management as<br />
required. The Group is responsible for<br />
reviewing the process and formulation of<br />
the company’s Asset Management Plan<br />
(AMP), including a review of the business<br />
drivers and prioritisation methodology<br />
included within the AMP framework. The<br />
Group also reviews the capital planning<br />
and expenditure process, the project<br />
reporting framework and the development<br />
of specific strategic projects. Papers that<br />
<strong>Watercare</strong> Governance Planning Cycle*<br />
approval<br />
Final Shareholder<br />
Draft SOI negotiated and revised<br />
SO I<br />
a do pt e d<br />
Tariffs set and<br />
Funding Plan<br />
approved<br />
Apr<br />
Mar<br />
t i o n<br />
Feb<br />
May<br />
l t a<br />
f c o n s u<br />
<strong>Annual</strong> Repo r t<br />
and Plan<br />
begins<br />
Financial<br />
process<br />
A s s e t M a n a g e m e n t<br />
SOI Process<br />
Asset Management Plan<br />
Financial Planning Process<br />
<strong>Annual</strong> <strong>Report</strong><br />
* From 1 July <strong>2012</strong>, <strong>Watercare</strong> will produce a Statement of Intent (SOI) rather than an SCI.<br />
Jun<br />
Jan<br />
are reviewed by the Group are circulated<br />
to all Board members and all members of<br />
the Board of Directors can attend Group<br />
meetings. All major capital projects require<br />
approval of the full Board.<br />
Regular independent reviews<br />
<strong>Watercare</strong> subjects its planning,<br />
operations and reporting to review by<br />
independent consultants on a regular<br />
basis. This year, the Board and the Audit<br />
and Risk Committee received reports<br />
from specialist advisers on risk and<br />
control issues to inform the maintenance<br />
and development of good practice and<br />
procedures. The company is committed<br />
to a culture of continuous improvement<br />
and seeks independent feedback from<br />
specialist advisers as necessary to achieve<br />
this objective.<br />
Dec<br />
Jul<br />
Aug<br />
Nov<br />
r i f<br />
Sep<br />
Oct<br />
T a<br />
Shareholder<br />
presentation<br />
tariff-setting<br />
P<br />
l a n<br />
of expectation<br />
received<br />
Mayoral letter<br />
Tariff options prepared<br />
S O I<br />
d r a f t<br />
p r e p a r e d<br />
Governance PAGE 19
<strong>Watercare</strong> Services Limited<br />
<strong>2012</strong> ANNUAL REPORT<br />
Suzanne Naylor, Operations<br />
Headworks Engineer,<br />
and Anin Nama, Network<br />
Manager Operations, with<br />
<strong>Watercare</strong> Board members<br />
at Cosseys Dam in the<br />
Hunua Ranges.<br />
4. STEWARDSHIP<br />
Indemnity and insurance<br />
<strong>Watercare</strong> has executed a deed of<br />
indemnity with each director which<br />
indemnifies the director in accordance<br />
with the company’s constitution, and<br />
grants certain rights in respect of access to<br />
documents and the maintenance of liability<br />
insurance cover.<br />
Board meetings<br />
The Board had seven Board meetings<br />
scheduled during the year. In addition, its<br />
members met three times in workshops<br />
to allow the Board to progress matters of<br />
policy to finality. The matters discussed<br />
were later dealt with at Board meetings<br />
once the policies and strategies were<br />
finalised. At two meetings the public<br />
was invited to provide feedback (one on<br />
performance for the previous year and the<br />
other on the SCI for the following year).<br />
The Board invites the public to attend all<br />
public sessions of Board meetings.<br />
Risk management<br />
<strong>Watercare</strong>’s framework for risk identification,<br />
measurement and reporting is well<br />
developed, and meets the requirements of<br />
the Australian and New Zealand Standard<br />
4360. There are regular external reviews<br />
to ensure the company meets and exceeds<br />
good-practice measures in risk management.<br />
As part of the risk management framework,<br />
the company has established a Risk Steering<br />
Committee which meets six times per year<br />
to monitor emerging risk and risk-mitigating<br />
actions and strategies. The committee<br />
comprises the Chief Executive, senior<br />
management, the internal auditor and<br />
the risk manager. Risks that have serious<br />
consequences are in turn directly monitored<br />
by the Board, with updates presented to<br />
each Board meeting.<br />
External auditor<br />
The Auditor-General is the auditor of the<br />
company’s financial statements. The Auditor-<br />
General has appointed Jamie Schmidt,<br />
using the staff and resources of Deloitte,<br />
to undertake the external audit work on<br />
behalf of the Auditor-General, in accordance<br />
with the Auditor-General’s Audit Standards,<br />
which incorporate New Zealand Auditing<br />
Standards. Deloitte has no relationship<br />
with the company outside of the audit and<br />
related assurance activities. This satisfies the<br />
independence requirements of the Auditor-<br />
General and the Institute of Chartered<br />
Accountants of New Zealand.<br />
Regulators<br />
<strong>Watercare</strong> is subject to regulation in planning,<br />
health and environmental matters. The<br />
principal regulators include Auckland Council,<br />
Waikato Regional Council and the Ministry of<br />
Health. The company also engages with these<br />
bodies by providing input on the impacts of<br />
existing and proposed policy and regulation<br />
on <strong>Watercare</strong>’s activities.<br />
Advisory groups<br />
<strong>Watercare</strong> has a standing consultative and<br />
advisory committee, the Environmental<br />
Advisory Group that comments on company<br />
plans and projects in 2011/12. The<br />
Environmental Advisory Group comprises<br />
experts who advise on how the company’s<br />
activities impact on the environment. In<br />
addition, <strong>Watercare</strong> is developing a new<br />
Maori advisory group, the Mana Whenua<br />
Forum, which will advise <strong>Watercare</strong> on<br />
how its plans and operations impact on<br />
Maori and on the relationship between the<br />
natural environment and Maori. The report<br />
of the Environmental Advisory Group and a<br />
summary of the new Mana Whenua Forum<br />
can be found on pages 22 and 23.<br />
Other stakeholders<br />
<strong>Watercare</strong> consults extensively with<br />
the Shareholder, the Accountability and<br />
Performance Committee, environmental<br />
regulators, special interest groups and<br />
advisory groups. Considerable effort<br />
is also put into engaging with parties<br />
and communities likely to be affected<br />
by the activities of the company in their<br />
neighbourhood. The performance of<br />
<strong>Watercare</strong>’s performance is very closely<br />
monitored in terms of the level and quality<br />
of the service provided to both customers<br />
and the community. The level of service is<br />
reported to the Board monthly and to the<br />
Shareholder on a quarterly basis.<br />
Official information requests<br />
In 2011/12, <strong>Watercare</strong> received 12 requests<br />
under the Local Government Official<br />
Information and Meetings Act 1987.<br />
The average response rate was 7.3 days.<br />
Board Member Attendance<br />
2011/12<br />
Date Appointed Date Retired Attendance at Board<br />
meetings/workshops<br />
Attendance at Audit<br />
& Risk Committee<br />
Attendance at Capital<br />
Projects Working Group<br />
Ross Keenan (Chairman) March 2010 10/10 4/5 4/4<br />
David Clarke (Deputy Chairman,<br />
Chair Capital Projects Working Group)<br />
July 2008 10/10 4/4<br />
Mike Allen Dec 2011 4/5 0/1<br />
Susan Huria July 2008 9/10<br />
Peter Drummond March 2010 7/10 4/4<br />
Jeff Todd (Chairman, Audit & Risk Committee) May 2007 10/10 5/5<br />
Catherine Harland May 2011 10/10 5/5<br />
Tony Lanigan May 2011 9/10 4/4<br />
Pat Snedden Dec 2002 Dec 2011 5/5 3/3<br />
PAGE 20 Governance
<strong>Watercare</strong> Services Limited<br />
<strong>2012</strong> ANNUAL REPORT<br />
<strong>Watercare</strong> at work<br />
local board<br />
relationships<br />
Local Boards are a key part of Auckland’s governance, enabling local<br />
representation and decision-making on behalf of local communities.<br />
There are 21 Local Boards throughout the Auckland region from<br />
Rodney to Franklin.<br />
Pictured left to right: Central Interceptor Project Manager Mike Sheffield discusses the project with Albert-Eden Local Board members and Council Parks staff;<br />
contractors installing new water filtration equipment at the Pukekohe Water Treatment Plant; Planning Manager Belinda Petersen talks with local residents<br />
at a Central Interceptor community open day.<br />
<strong>Watercare</strong> recognises the important role<br />
of Local Boards in local decision-making<br />
and community representation, and has<br />
worked to build purposeful relationships<br />
with the board chairs and members<br />
based on flexible, transparent and timely<br />
communication.<br />
An operational engagement plan has been<br />
developed, agreed and is in place with the<br />
Local Boards to help facilitate the working<br />
relationship. This is supported by a dedicated<br />
staff executive who works to help maintain<br />
the relationships and communication flows.<br />
The nature of <strong>Watercare</strong>’s relationship with<br />
various Local Boards varies due to the range<br />
of issues, local priorities and varying levels<br />
of community interest. To date, the majority<br />
of Local Board engagement has focused on<br />
areas where there is significant activity or<br />
public interest. However, the major premise<br />
for all Local Board communication has been a<br />
free flow of information regarding issues<br />
of mutual interest consistent with a no<br />
surprises approach.<br />
Notable activities over the past 12 months<br />
have been with Rodney Local Board in<br />
engaging with the Helensville community<br />
to obtain resource consents for the<br />
wastewater treatment plant, and with the<br />
Kumeu, Huapai and Riverhead community<br />
to prepare for new wastewater connections.<br />
Similarly, <strong>Watercare</strong> has communicated<br />
with the Franklin Local Board and key<br />
stakeholders during installation of the new<br />
$14 million Pukekohe local watermain.<br />
Local Boards in the central area have<br />
provided <strong>Watercare</strong> with constructive<br />
feedback on works in local parks associated<br />
with the proposed Central Interceptor<br />
project, and feedback from the boards was<br />
incorporated into five public open days<br />
held along the proposed route.<br />
<strong>Watercare</strong> has also worked with the Local<br />
Boards to help increase understanding<br />
of the Auckland-wide network discharge<br />
consent application which will build on<br />
the work previously undertaken on the<br />
North Shore in authorising and managing<br />
wet-weather overflow impacts on sensitive<br />
receiving environments.<br />
<strong>Watercare</strong>’s issues that impact Local<br />
Boards are diverse and varied, and require<br />
a variety of approaches. The company will<br />
continue to remain flexible and responsive<br />
in working with Local Boards to best meet<br />
their individual needs.<br />
In the coming 12 months, <strong>Watercare</strong><br />
will look to build on the excellent<br />
foundation established and remain<br />
responsive to the needs of Local Boards in<br />
representing the interests of their diverse<br />
local communities.<br />
local board relationships PAGE 21
<strong>Watercare</strong> Services Limited<br />
<strong>2012</strong> ANNUAL REPORT<br />
Environmental<br />
advisory group<br />
31 July <strong>2012</strong><br />
The Environmental Advisory Group (EAG) has worked with <strong>Watercare</strong> over the course of the<br />
year to advise and challenge its approach to the environmental aspects of providing integrated<br />
water supply and wastewater services across the region. With our collective experience and<br />
involvement in community environmental organisations, we provide <strong>Watercare</strong> with insights<br />
into how its projects and activities may be received within the community.<br />
Key projects that EAG has been involved in are the Central Interceptor and the Greater Auckland<br />
Regional Network Discharge Consent, two projects that are fundamental to <strong>Watercare</strong>’s strategy<br />
for managing wastewater overflows. The EAG strongly supports the Central Interceptor project<br />
as a means of addressing, in an integrated manner, inner Auckland’s future growth and the<br />
current environment impacts associated with wet-weather wastewater overflows. We have<br />
provided advice as the project develops and are monitoring the implications of the resource<br />
management application required for the construction and operation of the Central Interceptor.<br />
MEMBERS<br />
Paul Walbran<br />
Water quality, harbour health<br />
and heritage<br />
Ken Catt<br />
The water cycle<br />
Anne Fenn<br />
Environmental policy and<br />
implementation<br />
Carol McSweeney<br />
Air quality, ecosystems<br />
and botany<br />
Judy Bischoff<br />
Water and land<br />
use, energy<br />
Other issues that the EAG has actively contributed to during the year include:<br />
66<br />
the Auckland Plan and what it means for <strong>Watercare</strong>’s activities<br />
66<br />
Water Demand Management Strategy<br />
66<br />
the future of the trade waste regulation for the Auckland region, and<br />
66<br />
ongoing initiatives to upgrade the non-metropolitan wastewater treatment plants<br />
inherited from the former territorial authorities.<br />
These issues will continue to be critical for <strong>Watercare</strong> during the coming year, and the<br />
EAG will continue its involvement in them.<br />
In March <strong>2012</strong>, the Maori Advisory Group (MAG) held its final meeting celebrating<br />
ten years of the MAG. The EAG wishes to acknowledge and thank the MAG for its<br />
contribution to <strong>Watercare</strong>’s projects over the years. The two groups have had a<br />
number of shared meetings and workshops over the years and we have valued the<br />
interaction and shared discussion on the environmental and cultural aspects of<br />
<strong>Watercare</strong>’s projects.<br />
It has been a very demanding year for <strong>Watercare</strong> as it dealt with the extra<br />
responsibilities arising from council amalgamation and we have appreciated the hard<br />
work of the staff members who brief us. We also wish to commend the organisation<br />
for the assistance it has given to Christchurch – once again going the extra mile.<br />
We look forward to continuing to work with <strong>Watercare</strong> in the year ahead.<br />
Bob Tait<br />
Biosolids<br />
Paul Walbran<br />
Chairman<br />
Environmental Advisory Group<br />
PAGE 22 environmental advisory group
<strong>Watercare</strong> Services Limited<br />
<strong>2012</strong> ANNUAL REPORT<br />
Engagement<br />
with tangata<br />
whenua<br />
Mana Whenua Forum<br />
<strong>Watercare</strong> has recently consulted with hapu and iwi from<br />
throughout Tamaki Makaurau on their preferred form of<br />
engagement with <strong>Watercare</strong>. Following a series of hui<br />
(meetings), a resolution was passed to establish a<br />
Mana Whenua Forum in conjunction with <strong>Watercare</strong>.<br />
Hapū and iwi in Tāmaki Makaurau have agreed to sign a<br />
Relationship Agreement with <strong>Watercare</strong>. The Forum will<br />
comprise designated representatives from each<br />
Mana Whenua entity.<br />
The Relationship Agreement has been designed to<br />
promote partnership, protection, and focused action.<br />
An associated Charter has been prepared which includes<br />
the following principles:<br />
• Relationship Building – Building understanding and<br />
enhancing the relationship between mana whenua<br />
and <strong>Watercare</strong><br />
• Integrity – Ensuring cultural integrity and respect<br />
• Opportunities – Identifying opportunities of mutual interest<br />
and benefit<br />
• Best practice – Advising on best practices for meeting<br />
<strong>Watercare</strong>’s cultural, environmental, social and economic<br />
responsibilities<br />
• Efficiency – Establishing efficient, collective processes for<br />
building the relationship and engagement.<br />
Māori Advisory Group<br />
The Māori Advisory Group (MAG) was established in 2001 in<br />
recognition of the stewardship role of Māori in relation to the<br />
supply of water services in the Auckland region. The group’s role<br />
was to provide advice to <strong>Watercare</strong> from a Māori perspective<br />
on <strong>Watercare</strong>’s response to national and local policy and plans<br />
and the development of <strong>Watercare</strong>’s infrastructure projects.<br />
In addition, the MAG provided guidance to <strong>Watercare</strong>’s senior<br />
managers on cultural issues and facilitated relationship building<br />
and understanding between <strong>Watercare</strong> management and iwi.<br />
The MAG was not established to represent the different Mana<br />
Whenua groups, but rather to advise <strong>Watercare</strong> on matters<br />
relating to iwi, including how to approach and relate to the<br />
mana whenua groups. Recent projects the MAG has provided<br />
advice on include the Hunua No. 4 Watermain project, the<br />
Central Interceptor project, wastewater network consents and<br />
the management of biosolids.<br />
<strong>Watercare</strong> acknowledges and thanks the members of the<br />
Māori Advisory Group for their contribution to <strong>Watercare</strong> over<br />
the last decade by assisting management in understanding<br />
Māori culture and protocols, the implications of the Treaty of<br />
Waitangi, the history of the region from an iwi perspective, the<br />
value of water to Māori, and the significance of kaitiakitanga<br />
(guardianship and conservation). In particular, <strong>Watercare</strong> wishes<br />
to recognise the MAG Chairman, Bill Kapea, for his long-standing<br />
commitment and support to <strong>Watercare</strong> and the MAG over years.<br />
The Māori Advisory Group members were:<br />
Chairman<br />
William Kapea<br />
Members<br />
Norma Rae Arlidge<br />
Paul Brown<br />
George Kahi<br />
Kowhai Olsen<br />
Pita Pou<br />
Lucile Rutherfurd<br />
Heta Tobin<br />
Pamera Warner<br />
<strong>Watercare</strong> wishes to thank Tame Te Rangi for<br />
his contribution as Mana Whenua Forum<br />
Interim Chair.<br />
engagement with tangata whenua PAGE 23
<strong>Watercare</strong> Services Limited<br />
<strong>2012</strong> ANNUAL REPORT<br />
31<br />
safe and<br />
reliable<br />
water<br />
Management of water resources to provide<br />
a safe and reliable water supply.<br />
PAGE 24 safe and reliable water
<strong>Watercare</strong> Services Limited<br />
<strong>2012</strong> ANNUAL REPORT<br />
PercentaGe<br />
Sedimentation beds at<br />
Ardmore Water Treatment<br />
Plant, where settlement<br />
of suspended solids takes<br />
place as part of the water<br />
treatment process.<br />
7<br />
7<br />
FoCuS<br />
FoCuS<br />
6<br />
6<br />
FoCuS<br />
FoCuS<br />
8<br />
8 FoCuS<br />
FoCuS<br />
FoCuS 5<br />
FoCuS 5<br />
PercentaGe<br />
100<br />
95<br />
90<br />
85<br />
80<br />
75<br />
70<br />
65<br />
60<br />
55<br />
50<br />
45<br />
40<br />
35<br />
30<br />
25<br />
20<br />
15<br />
10<br />
100<br />
95<br />
90<br />
85<br />
80<br />
75<br />
70<br />
65<br />
60<br />
55<br />
50<br />
45<br />
40<br />
35<br />
30<br />
25<br />
20<br />
15<br />
10<br />
FoCuS<br />
FoCuS<br />
4<br />
4<br />
FoCuS 1<br />
FoCuS 1<br />
FoCuS<br />
FoCuS<br />
2<br />
2<br />
FoCuS<br />
FoCuS<br />
3<br />
3<br />
Overall score<br />
for focus arEA<br />
97 %<br />
See page 5<br />
<strong>Watercare</strong> is on schedule to complete a $22 million upgrade of<br />
the company’s Ardmore Water Treatment Plant which will provide<br />
additional capacity and increased security of water supply to<br />
Aucklanders. The upgrade works will enhance the plant’s ‘Rapid<br />
Restart’ capability, reducing any disruption of Auckland’s water<br />
supply following operational interruption. In addition, improved<br />
solids-handling systems will improve long-term capacity and<br />
provide additional environmental protection against potential<br />
overflows. Contractors have already completed de-sludging,<br />
drainage and pipe-strengthening activities on site, and work is<br />
continuing on construction of overflow chambers and earthworks.<br />
Anin Nama (r), Operations Manager Networks,<br />
and Stuart Urquhart (l), Operations Controller,<br />
surveying the sedimentation beds at Ardmore<br />
Water Treatment Plant.<br />
safe and reliable water PAGE 25
<strong>Watercare</strong> Services Limited<br />
<strong>2012</strong> ANNUAL REPORT<br />
1<br />
safe and<br />
reliable<br />
water<br />
1a. Percentage of drinking water treated in <strong>Watercare</strong>’s plants that are graded ‘A’ by the Ministry of Health.<br />
Target: 100% by 2020.<br />
TARGET 100%<br />
10 20 30 40 50 60 70 80 90 100<br />
<strong>2012</strong> SCORE<br />
92%<br />
Water quality has been maintained based on the 2010 grading assessment carried out by the Auckland District Health<br />
Board on behalf of the Ministry of Health 1 . All the metropolitan water treatment plants that supply the bulk of drinking<br />
water to the people in the Auckland region meet the ‘A’ grade standard.<br />
2011<br />
92%<br />
Of the smaller non-metropolitan plants transferred to <strong>Watercare</strong> on 1 November 2010, nine remain ungraded. <strong>Watercare</strong><br />
is continuing with a programme of work to ensure all plants meet the ‘A’ grade standard by 2020, at a capital cost of $100<br />
million for both water treatment plants and the distribution network.<br />
1b. Percentage of drinking water distributed through the <strong>Watercare</strong> network that is graded ‘a’ by the<br />
Ministry of Health. Target: 100% by 2020.<br />
TARGET 100%<br />
10 20 30 40 50 60 70 80 90 100<br />
<strong>2012</strong> SCORE<br />
89%<br />
The same risk-based assessment used for water treatment plants also applies to the pipes and pump stations that make<br />
up the water distribution networks. The metropolitan network is graded ‘a’ under the Ministry of Health’s standards<br />
and supplies the bulk of the drinking water to the people in the Auckland region. Of the 15 non-metropolitan networks<br />
(inherited on 1 November 2010), three are ‘a’ graded, three are ‘b’ graded and nine are ungraded. <strong>Watercare</strong> has set in<br />
place a programme to ensure that all the networks meet the ‘a’ grade standard by 2020.<br />
2011<br />
89%<br />
1c. Percentage performance against Statement of Corporate Intent target: quality of drinking water.<br />
Target: 100% by 2020.<br />
TARGET 100%<br />
10 20 30 40 50 60 70 80 90 100<br />
<strong>2012</strong> SCORE<br />
100%<br />
<strong>Watercare</strong> fully met the Ministry of Health’s Drinking Water Standards for New Zealand (DWSNZ), at Ministry of<br />
Health-graded water treatment plants (Ruler 1a). The DWSNZ standards are based on a quality assurance approach,<br />
underpinned by the requirement to develop public health risk-management plans. Information on DWSNZ is available<br />
at www.moh.govt.nz\water.<br />
2011<br />
100%<br />
1<br />
The next grading assessment is due in the last calendar quarter of <strong>2012</strong>.<br />
PAGE 26 safe and reliable water
<strong>Watercare</strong> Services Limited<br />
<strong>2012</strong> ANNUAL REPORT<br />
Supporting information<br />
Fig. 1 Water and wastewater facts<br />
Fig. 8 Grading of water treatment plants and networks<br />
Fig. 9 Drinking water quality<br />
Fig. 10 Typical analysis of Auckland’s drinking water<br />
Fig. 11 Water supply interruptions<br />
Fig. 12 Water supply restoration<br />
Fig. 13 Water quality complaints<br />
KEY<br />
Target met<br />
Target not met<br />
Good performance<br />
but could do better<br />
Presentation of ruler<br />
updated from 2011<br />
1d. Percentage performance against Statement of Corporate Intent target: service interruption to customer<br />
connection ratio. Target: less than 10 per 1,000 connections.<br />
TARGET 100%<br />
10 20 30 40 50 60 70 80 90 100<br />
<strong>2012</strong> SCORE<br />
100%<br />
<strong>Watercare</strong> monitors the number of times the water supply to its customers is disrupted as a measure of reliability of service.<br />
The SCI target is set at achieving fewer than 10 interruptions per 1,000 connections for the year. The result for the year from<br />
1 July 2011 was 5.8, which was well within the target.<br />
2010 2011<br />
100% 100%<br />
1e. Percentage performance against Statement of Corporate Intent target: service restoration<br />
following unplanned shutdowns. Target: greater than or equal to 90%.<br />
TARGET 90%<br />
10 20 30 40 50 60 70 80 90 100<br />
<strong>2012</strong> SCORE<br />
100%<br />
<strong>Watercare</strong> has a target of restoring greater than 90% of unplanned water shutdowns within 5 hours. The result for the 2011/12<br />
period was 98%, achieving the target.<br />
2011<br />
100%<br />
1f. Percentage performance against Statement of Corporate Intent target: unaccounted–for water loss.<br />
Target: less than 17.7million m 3 per year.<br />
TARGET 100%<br />
10 20 30 40 50 60 70 80 90 100<br />
<strong>2012</strong> SCORE<br />
100%<br />
<strong>Watercare</strong> operates a continuous process of identifying, assessing and addressing water losses from its system that cannot be<br />
accounted for. For 2011/12 the volume of unaccounted-for water from the <strong>Watercare</strong> system was 15.2 million m³ against a<br />
target of less than 17.7 million m³, achieving the target.<br />
2011<br />
100%<br />
1g. Percentage performance against Statement of Corporate Intent target: water quality complaints.<br />
Target: less than 5 complaints per 1,000 connections.<br />
TARGET 100%<br />
10 20 30 40 50 60 70 80 90 100<br />
<strong>2012</strong> SCORE<br />
100%<br />
<strong>Watercare</strong> monitors the number and type of water quality complaints received from customers. The result of 4.1 complaints per<br />
1000 connections covering taste, odour and appearance per 1,000 connections was lower than the target of 5 per year.<br />
2011<br />
88%<br />
safe and reliable water PAGE 27
<strong>Watercare</strong> Services Limited<br />
<strong>2012</strong> ANNUAL REPORT<br />
<strong>Watercare</strong> at work<br />
Cost-effective investment providing clearer<br />
drinking water for Pukekohe customers<br />
<strong>Watercare</strong> inherited the Franklin Water<br />
Treatment Plant facilities on 1 November<br />
2010, and quickly began a retrofit upgrade<br />
project to address a number of complaints<br />
from Pukekohe customers about ongoing<br />
discolouration of local drinking water. Prior<br />
to the plant upgrade, naturally occurring iron<br />
and manganese particles in the bore water<br />
were reacting to the addition of chlorine<br />
as part of the treatment process, causing a<br />
slight (completely non-hazardous) orange<br />
tint in some Pukekohe residents’ treated<br />
tap water.<br />
In mid-2011 <strong>Watercare</strong>’s Water Supply<br />
Process Engineering group began pilot<br />
testing of additional filtration systems<br />
at Pukekohe to address the water<br />
discolouration, a problem unique to the<br />
local water supply. Water Supply Operations<br />
Manager Shayne Cunis says that <strong>Watercare</strong><br />
worked with contractor Canadian Pacific<br />
Limited to reach a solution to the problem<br />
which utilises three containerised membrane<br />
filtration units. The containerised units were<br />
designed so that when they are no longer<br />
required at Pukekohe they can be relocated<br />
and stored for emergency use, such as<br />
providing a treated water supply in the event<br />
of a natural disaster.<br />
The containerised membrane filtration<br />
units re-use several high-quality filtration<br />
membranes that had become available as<br />
part of <strong>Watercare</strong>’s expansion project at<br />
the Waikato Water Treatment Plant. This<br />
approach allowed the company to reduce<br />
the overall equipment costs of the project<br />
significantly, without compromising on the<br />
quality of water treatment.<br />
The filtration process now in use at Pukekohe<br />
advances the oxidation reaction within the<br />
water treatment plant, removing the iron<br />
and manganese solids by way of a filtration<br />
barrier and allowing <strong>Watercare</strong> to provide<br />
Pukekohe residents with vastly improved<br />
drinking water. Shayne says the project was<br />
completed in January <strong>2012</strong>, and <strong>Watercare</strong><br />
has since seen a significant reduction in<br />
the number of water quality complaints<br />
from Pukekohe customers. “Since the<br />
completion of this project we’ve noticed a<br />
huge reduction in the number of ‘dirty water’<br />
complaints being received from Pukekohe<br />
customers, from almost 50 per month in late<br />
2010 to virtually none in <strong>2012</strong>,” he says.<br />
Shayne explains, “<strong>Watercare</strong> is working<br />
on a permanent long-term solution which<br />
addresses Pukekohe’s requirement for<br />
additional water supply due to population<br />
growth. We’re currently constructing a new<br />
water supply pipeline which will draw<br />
Pukekohe drinking water from the Waikato<br />
Treated Watermain, and this is scheduled for<br />
operation by June 2013.”<br />
Process Engineer Jeremy Booth says the<br />
Pukekohe membrane plant project is just<br />
one aspect of <strong>Watercare</strong>’s innovative<br />
approach to upgrading the company’s water<br />
treatment facilities in the Franklin district.<br />
“We’ve made a substantial investment into<br />
automated, online monitoring of water<br />
treatment facilities in Franklin, which means<br />
we’re able to keep an eye on water quality<br />
from our centralised control room and act<br />
quickly if there’s a problem.”<br />
Jeremy adds that at a number of smaller<br />
local facilities – such as the water treatment<br />
plant at Glenbrook Beach – <strong>Watercare</strong> has<br />
installed UV treatment systems, and these<br />
have been very successful in helping to<br />
provide local communities with safe and<br />
reliable drinking water.<br />
Pictured left to right are:<br />
Process Engineer Jeremy Booth,<br />
Southern Area Water Supply<br />
Manager Gil Miers, and Senior<br />
Process Engineer Tom Surrey<br />
on site at <strong>Watercare</strong>’s Pukekohe<br />
Membrane Plant.<br />
PAGE 28 safe and reliable water
<strong>Watercare</strong> Services Limited<br />
<strong>2012</strong> ANNUAL REPORT<br />
Water Utility Consumer Assistance Trust established<br />
to help support at-risk Auckland consumers<br />
<strong>Watercare</strong> established the Water Utility<br />
Consumer Assistance Trust in late 2011 with<br />
the purpose of providing “financial support to<br />
customers of <strong>Watercare</strong> who are struggling to<br />
manage their water and/or wastewater costs.”<br />
The trust has been granted a nominal budget<br />
of up to $1 million per year. The Trust relies<br />
heavily on advice from budgeting centres<br />
including the Otara, Otahuhu, Mangere and<br />
Auckland Central budgeting services. The<br />
Trust has its own secretary and operates in a<br />
fully independent manner.<br />
Customers (including tenants) are alerted<br />
to the trust via the <strong>Watercare</strong> credit team;<br />
our Customer Centre; in overdue account<br />
reminder letters; on the <strong>Watercare</strong> and Trust<br />
websites www.waterassistance.org.nz; and via<br />
budget advisory service and Citizens’ Advice<br />
Bureau offices.<br />
Trust results as of July <strong>2012</strong>:<br />
• 150 <strong>Watercare</strong> customers registered<br />
with the Trust<br />
• 52 applications granted – total value<br />
$41,192<br />
Trustees:<br />
• John Lusk (chairman)<br />
– retired senior commercial lawyer<br />
(<strong>Watercare</strong> Services Limited appointee)<br />
• Dr Bruce Hucker (deputy chairman)<br />
– former Deputy Mayor of Auckland City<br />
(<strong>Watercare</strong> appointee)<br />
• Anne Candy<br />
– former Deputy Mayor of Manukau City<br />
(Maori Women’s Welfare League appointee)<br />
• Lauren Godsiff<br />
– Auckland City Mission appointee<br />
• Maureen Little<br />
– Presbyterian Support Services appointee<br />
<strong>Watercare</strong> Harbour Clean-Up Trust<br />
24,015,910<br />
Total estimated individual<br />
pieces of litter collected from<br />
Auckland waterways since<br />
the Harbour Clean-Up Trust’s<br />
inception in December 2002,<br />
based on an average of<br />
8 individual pieces of trash<br />
per litre.<br />
3,001,989 litres<br />
Volume of litter collected since<br />
the inception of the Harbour<br />
Clean-Up Trust across the<br />
Auckland region.<br />
2,076,320<br />
Total estimated individual<br />
pieces of litter collected from<br />
Auckland waterways in the year<br />
July 2011 – June <strong>2012</strong>, based<br />
on an average of 8 individual<br />
pieces of trash per litre.<br />
2923.5 hours<br />
Time worked by the <strong>Watercare</strong><br />
Harbour Clean-Up Trust during<br />
the year July 2011 – June <strong>2012</strong>.<br />
16,342.5 hours<br />
Total number of volunteer hours<br />
which assisted the <strong>Watercare</strong><br />
Harbour Clean-Up Trust during<br />
the year July 2011 – June <strong>2012</strong>.<br />
<strong>Watercare</strong> is the principal sponsor<br />
of the <strong>Watercare</strong> Harbour Clean-<br />
Up Trust, which works to remove<br />
litter from Waitemata Harbour<br />
and the gulf islands. Central to the<br />
Trust’s activities is ‘The Phil Warren’<br />
boat, pictured here alongside the<br />
Auckland Ferry Terminal.<br />
safe and reliable water PAGE 29
<strong>Watercare</strong> Services Limited<br />
<strong>2012</strong> ANNUAL REPORT<br />
2 Healthy<br />
Waterways<br />
Management of wastewater discharges to maintain<br />
or improve the health of the environment.<br />
Maintaining the health of Auckland’s valuable harbours,<br />
estuaries, beaches and islands remains a fundamental part<br />
of <strong>Watercare</strong>’s role in the community. The company’s 20<br />
wastewater treatment plants and network of wastewater<br />
pipes continue to treat the majority of Auckland’s<br />
wastewater to a very high standard, helping to protect the<br />
health of Auckland’s waterways.<br />
<strong>Watercare</strong> closely monitors all wastewater discharges,<br />
dry-weather sewer overflows, unplanned sewer<br />
interruptions, and rates for responding to urgent<br />
wastewater blockages.<br />
In 2011/12 <strong>Watercare</strong> performed at an extremely high<br />
level against the company’s performance targets and<br />
consent conditions.<br />
PAGE 30 healthy waterways
<strong>Watercare</strong> Services Limited<br />
<strong>2012</strong> ANNUAL REPORT<br />
Infrastructure Projects<br />
Manager Dave Shepherd on<br />
site during construction at<br />
The Concourse, <strong>Watercare</strong>’s<br />
new 13-million-litre<br />
wastewater overflow<br />
facility in Henderson.<br />
7<br />
7<br />
FoCuS<br />
FoCuS<br />
6<br />
6<br />
FoCuS<br />
FoCuS<br />
8<br />
8<br />
FoCuS<br />
FoCuS<br />
FoCuS<br />
FoCuS<br />
5<br />
5<br />
PercentaGe<br />
PercentaGe<br />
100<br />
100<br />
95<br />
95<br />
90<br />
90<br />
85<br />
85<br />
80<br />
80<br />
75<br />
75<br />
70<br />
70<br />
65<br />
65<br />
60<br />
60<br />
55<br />
55<br />
50<br />
50<br />
45<br />
45<br />
40<br />
40<br />
35<br />
35<br />
30<br />
30<br />
25<br />
25<br />
20<br />
20<br />
15<br />
15<br />
10<br />
10<br />
FoCuS<br />
FoCuS<br />
4<br />
4<br />
FoCuS 1<br />
FoCuS 1<br />
FoCuS 3<br />
FoCuS 2<br />
FoCuS 3<br />
FoCuS 2<br />
Overall score<br />
for focus arEA<br />
99 %<br />
See page 5<br />
healthy waterways PAGE 31
<strong>Watercare</strong> Services Limited<br />
<strong>2012</strong> ANNUAL REPORT<br />
KEY<br />
2<br />
healthy<br />
waterways<br />
Supporting Information<br />
Fig. 14 Resource consent compliance<br />
Fig. 15 Wastewater treatment plant discharge<br />
Fig. 16 Treated wastewater standards<br />
Fig. 17 Overflows from wastewater systems<br />
Fig. 18 Wastewater network interruptions<br />
Fig. 19 Wastewater network restoration performance<br />
Target met<br />
Target not met<br />
Good performance<br />
but could do better<br />
Presentation of ruler<br />
updated from 2011<br />
2a. Percentage of wastewater discharged compliant with consent conditions (excluding minor or non-technical).<br />
Target: 100%.<br />
TARGET 100%<br />
10 20 30 40 50 60 70 80 90 100<br />
<strong>2012</strong> SCORE<br />
97%<br />
<strong>Watercare</strong> achieved a 97% level of overall compliance with consent requirements at its wastewater treatment plants on a<br />
volumetric basis, excluding minor and technical breaches. Compliance with consents at the major urban wastewater treatment<br />
plants was 99% against a target of 100%. The non-compliance reported this year was due to illegal trade waste discharge and an<br />
off-site power failure, circumstances beyond <strong>Watercare</strong>’s control. There were several transient periods of technical or minor noncompliance<br />
1 at the Mangere Wastewater Treatment Plant during the year. An upgrade programme has been implemented<br />
to address this situation.<br />
The remaining non-compliance levels were influenced by the poor performance of some of the rural wastewater treatment plants<br />
transferred to <strong>Watercare</strong> by legacy councils upon integration. These plants performed at 64% against a target of 65% by 2015,<br />
and a target of 100% compliance by 2020. The company has developed a longer-term strategy and more immediate measures,<br />
forecast to cost $50 million, to reduce the impacts of these plants on the environment.<br />
2011<br />
97%<br />
2b. Percentage performance against Statement of Corporate Intent target: dry-weather sewer overflows.<br />
Target: less than or equal to 15 per 100km of pipe length.<br />
TARGET 100%<br />
10 20 30 40 50 60 70 80 90 100<br />
<strong>2012</strong> SCORE<br />
100%<br />
<strong>Watercare</strong> reports on the number of wastewater overflows from its retail network during dry weather as a measure of the ability<br />
of the network to manage current demand. The result for the 2011/12 year was 2.3 overflows per 100km of wastewater pipe,<br />
well within the target.<br />
2011<br />
100%<br />
2c. Percentage performance against Statement of Corporate Intent target: unplanned sewer interruptions.<br />
Target: less than 10 per 1,000 properties.<br />
TARGET 100%<br />
10 20 30 40 50 60 70 80 90 100<br />
<strong>2012</strong> SCORE<br />
100%<br />
The number of unplanned wastewater network interruptions as a result of breaks and chokes is a measure of the integrity of the<br />
system. The result for the 2011/12 year was 6.4 incidences, which was within the target.<br />
2011<br />
100%<br />
2d. Percentage performance against Statement of Corporate Intent target: response rate for urgent<br />
wastewater blockages. Target: within agreed contracted standards.<br />
TARGET 100%<br />
10 20 30 40 50 60 70 80 90 100<br />
<strong>2012</strong> SCORE<br />
100%<br />
The 2011/12 SCI required <strong>Watercare</strong> to respond to all urgent wastewater blockages within the standard agreed with<br />
contractors, 98% of the time. The target was achieved 99% of the time.<br />
2011<br />
94%<br />
1<br />
For instance, a technical non-compliance might be late completion of documentation; minor non-compliance might be a single reading above a target, the<br />
impact of which is total load based where there is no material impact on the environment. In each case, the regulator Auckland Council, is fully informed.<br />
PAGE 32 healthy waterways
<strong>Watercare</strong> Services Limited<br />
<strong>2012</strong> ANNUAL REPORT<br />
<strong>Watercare</strong> at work<br />
<strong>Watercare</strong> project to support urban growth<br />
in South Auckland passes major milestone<br />
A $31.5 million project by <strong>Watercare</strong> to<br />
support urban growth in the suburbs of<br />
Manurewa, Takanini, Wattle Downs and<br />
Papakura has passed a major milestone,<br />
with a newly-constructed wastewater pump<br />
station and pipe extension going live.<br />
<strong>Watercare</strong>’s new high-capacity pump<br />
station has been built alongside the existing<br />
Manurewa Pump Station in Wattle Farm<br />
Reserve. Senior Engineer Paul Gowans says<br />
the old pump station, which was demolished<br />
in June, was reaching the end of its service<br />
life. “The new pump station, which is the<br />
largest of its kind in South Auckland, houses<br />
four heavy-duty pumps,” explains Paul. “It<br />
also provides 1.5 million litres of storage<br />
capacity and will provide <strong>Watercare</strong> with<br />
improved operational flexibility for<br />
the region.”<br />
Paul says the construction of the pump<br />
station was a major undertaking and was<br />
carried out over a 19-month period between<br />
August 2010 and March <strong>2012</strong>. “If you were<br />
to look at the pump station from the outside,<br />
you would have no idea of its true scale.<br />
Inside, there is a major shaft that drops 14<br />
metres underground. At the bottom are the<br />
pumps, separated from the storage well by a<br />
thick, reinforced concrete wall.”<br />
The pump station pushes wastewater<br />
into two major wastewater pipes: the<br />
Southern Interceptor and the Southwestern<br />
Interceptor. As part of the project-the<br />
Southwestern Interceptor has been extended<br />
by 4.2 kilometres from the pump station<br />
to Roscommon Road. Paul says extending<br />
the Southwestern Interceptor has provided<br />
additional wastewater network capacity for<br />
the growth forecast in South Auckland, and<br />
provides <strong>Watercare</strong> with greater flexibility for<br />
future maintenance work.<br />
The company adopted best-practice<br />
construction methods throughout the project<br />
to minimise the impact on the surrounding<br />
community. For example, <strong>Watercare</strong> used a<br />
trenchless method to install the section of<br />
pipe that runs beneath Mahia Road. By not<br />
having to excavate a deep trench, a two-way<br />
flow of traffic and access to properties was<br />
maintained during the work.<br />
A tunnel-boring machine was used to install<br />
the section of pipe beneath Roscommon<br />
Road, again minimising the impact on the<br />
local community. One of the first custommade<br />
machines to be made in New Zealand,<br />
it worked from February to November<br />
2011, installing up to 15 metres of pipe<br />
per 12‐hour shift. The machine’s head cut<br />
through the earth, and soil was removed<br />
using an underground conveyor belt and<br />
small locomotive.<br />
With the pump station and pipe extension<br />
constructed and demolition of the old<br />
Manurewa Pump Station complete, project<br />
work will now focus on reinstating the site<br />
and planting vegetation at Wattle Farm<br />
Reserve.<br />
This project is part of a programme of work<br />
<strong>Watercare</strong> has planned in support of urban<br />
growth in the area. Other work includes<br />
diverting the Manurewa Branch Sewer and<br />
extending the Mahia Branch Sewer in Takanini.<br />
Southwestern Interceptor – project timeline:<br />
January 2009 to<br />
March 2010<br />
Project planning<br />
and design<br />
August 2010 to<br />
November 2011<br />
Construction<br />
of gravity<br />
wastewater pipe<br />
August 2010 to<br />
November 2011<br />
Construction<br />
of pressure<br />
wastewater pipe<br />
August 2010 to<br />
November 2011<br />
Construction<br />
of pump station<br />
December 2011 to<br />
March <strong>2012</strong><br />
Commissioning of<br />
pump station and<br />
new wastewater<br />
pipes<br />
May – July <strong>2012</strong><br />
Decommissioning<br />
and demolition of the<br />
old Manurewa Pump<br />
Station<br />
healthy waterways PAGE 33
<strong>Watercare</strong> Services Limited<br />
<strong>2012</strong> ANNUAL REPORT<br />
3<br />
Health,<br />
safety and<br />
well-being<br />
To be an industry-best workplace.<br />
PAGE 34 health, safety and well-being
<strong>Watercare</strong> Services Limited<br />
<strong>2012</strong> ANNUAL REPORT<br />
Water network contractors<br />
replace a water meter at<br />
a <strong>Watercare</strong> customer’s<br />
residential property in<br />
East Auckland.<br />
7<br />
7<br />
FoCuS<br />
FoCuS<br />
6<br />
6<br />
FoCuS<br />
FoCuS<br />
8<br />
8<br />
FoCuS<br />
FoCuS<br />
PercentaGe<br />
PercentaGe<br />
100<br />
95 100<br />
90 95<br />
85 90<br />
80 85<br />
75 80<br />
70 75<br />
65 70<br />
60 65<br />
55 60<br />
50 55<br />
45 50<br />
40 45<br />
35 40<br />
30 35<br />
25 30<br />
20 25<br />
15 20<br />
10 15<br />
10<br />
FoCuS FoCuS 1<br />
1<br />
FoCuS<br />
FoCuS<br />
3<br />
3<br />
FoCuS<br />
FoCuS<br />
2<br />
2<br />
Overall score<br />
for focus arEA<br />
98 %<br />
See page 5<br />
FoCuS FoCuS<br />
5<br />
5<br />
FoCuS<br />
FoCuS<br />
4<br />
4<br />
<strong>Watercare</strong> remains focused on recruiting, developing<br />
and retaining highly skilled people in all aspects of the<br />
company’s activities. The company maintains a long-term<br />
commitment to industry-best health and safety practices,<br />
and to providing ongoing training and development<br />
opportunities to employees.<br />
<strong>Watercare</strong> employs a highly diverse and skilled workforce<br />
from a range of nationalities, ethnicities and backgrounds.<br />
In addition, all water and wastewater operational staff<br />
are actively encouraged to pursue formal qualifications.<br />
The company continues to provide a comprehensive<br />
occupational health service to all staff, including:<br />
medical consultation, influenza immunisation, mandatory<br />
vaccinations for working in certain environments, skin<br />
checks and rehabilitation programmes.<br />
health, safety and well-being PAGE 35
<strong>Watercare</strong> Services Limited<br />
<strong>2012</strong> ANNUAL REPORT<br />
3<br />
Health,<br />
safety and<br />
well-being<br />
3a. Percentage performance against Statement of Corporate Intent target: lost-time injury frequency rate.<br />
Number of lost-time injuries per year x 1,000,000 hours worked. Target: less than or equal to 5.<br />
TARGET 100%<br />
10 20 30 40 50 60 70 80 90 100<br />
<strong>2012</strong> SCORE<br />
100%<br />
The lost-time injury frequency rate (LTIFR) measures the number of lost-time injuries per million hours worked and allows<br />
for comparisons across industries. <strong>Watercare</strong> achieved a rate of 1.39 which is well below the SCI target of not more than 5.<br />
This year, the company held 178 health and safety inductions which were attended by 2,025 internal and external people.<br />
Additionally, 284 health and safety inspections were completed.<br />
2008 2009 2010 2011<br />
85% 95% 90% 92%<br />
3b. Percentage performance against target: lost-time severity rate.<br />
Number of days lost x 200,000 hours worked. Target: less than or equal to 4.<br />
TARGET 100%<br />
10 20 30 40 50 60 70 80 90 100<br />
<strong>2012</strong> SCORE<br />
100%<br />
The severity rate measures the number of days lost from injury per 200,000 hours worked. <strong>Watercare</strong> had an injury severity<br />
rate of 0.0278 at the end of the 2011/12 financial year, which decreased from 9.48 the previous year. This significant<br />
reduction reflects the fact that the serious injuries occuring in the previous year were annualised out of the year-end results.<br />
The low severity rate reflects the fact that there was only one lost-time incident in the 12-month period and the total lost<br />
time for that incident was 72 hours.<br />
2008 2009 2010 2011<br />
60% 95% 90% 92%<br />
3c. Percentage performance against Statement of Corporate Intent target: staff wellness.<br />
Target: less than 2.5.<br />
TARGET 100%<br />
10 20 30 40 50 60 70 80 90 100<br />
<strong>2012</strong> SCORE<br />
100%<br />
As a measure of staff wellness <strong>Watercare</strong> monitors and reports the levels of absence due to staff illness. During 2011/12<br />
The company recorded that 1.81% of available work hours were lost due to the illness of staff. This is significantly below<br />
the SCI target of 2.5.<br />
<strong>Watercare</strong> provides a comprehensive occupational health service to all staff including: medical consultation, influenza<br />
immunisation, mandatory vaccinations for working in certain environments, skin checks and rehabilitation programmes.<br />
Employee Assistance Programme services are also available to all employees on a confidential basis.<br />
2008 2009 2010 2011<br />
75% 85% 80% 70%<br />
PAGE 36 health, safety and well-being
<strong>Watercare</strong> Services Limited<br />
<strong>2012</strong> ANNUAL REPORT<br />
Supporting Information<br />
Fig. 20 Lost-time injury frequencies<br />
Fig. 21 Heath and safety notes<br />
Fig. 22 Staff wellness and absenteeism<br />
Fig. 23 Staff voluntary turnover<br />
Fig. 24 Investment in staff<br />
Fig. 25 Staff service profiles<br />
Fig. 26 Staff demographics<br />
Fig. 27 Average staff numbers<br />
Fig. 28 Workforce employment type, contract and region<br />
KEY<br />
Target met<br />
Target not met<br />
Good performance<br />
but could do better<br />
Presentation of ruler<br />
updated from 2011<br />
3d. Percentage performance against Statement of Corporate Intent target: staff turnover. Target 10 to 12%.<br />
TARGET 100%<br />
10 20 30 40 50 60 70 80 90 100<br />
<strong>2012</strong> SCORE<br />
100%<br />
Voluntary staff turnover at 11.81% was within the SCI target of 10 to 12%, which is generally recognised as a healthy staffing<br />
refreshment rate.<br />
2008 2009 2010 2011<br />
45% 100% 50% 100%<br />
3e. Percentage performance: staff training.<br />
Target: 20 hours, training and study per employee.<br />
TARGET 100%<br />
10 20 30 40 50 60 70 80 90 100<br />
<strong>2012</strong> SCORE<br />
100%<br />
<strong>Watercare</strong> continued to invest significantly in the training and development of staff during 2011/12, with an average of<br />
21.7 hours per employee spent undertaking training or study throughout the year. The Engineering Graduate support group<br />
continues with 25 graduates currently working towards chartered status. All water and wastewater operational staff are actively<br />
encouraged to pursue formal qualifications, with 4 staff achieving Certificate or Diploma-level qualifications during 2011/12.<br />
2008 2009 2010 2011<br />
85% 90% 85% 69%<br />
3f. Percentage performance against Statement of Corporate Intent target: staff appointment ratio.<br />
Target: a ratio of less than 1.6:1 for external to internal appointments<br />
TARGET 100%<br />
10 20 30 40 50 60 70 80 90 100<br />
<strong>2012</strong> SCORE<br />
94%<br />
The ratio of new hires (excluding entry positions) to promotions is monitored and a more challenging target was set for this year<br />
of 1.6:1 compared to 2.25:1 last year. During the period, <strong>Watercare</strong> achieved a ratio of 1 promotion to every 1.7:1 new hires, the<br />
majority of new hires being at an entry level.<br />
2008 2009 2010 2011<br />
45% 85% 45% 92%<br />
3g. Percentage performance: Employment equity and diversity. Target: 100%.<br />
TARGET 100%<br />
<strong>2012</strong> SCORE<br />
Measure and<br />
monitor<br />
Demographic<br />
indicators<br />
Accredited<br />
employer<br />
with New<br />
Zealand<br />
Institute of<br />
Surveyors<br />
Freedom of<br />
association<br />
promoted<br />
Remuneration<br />
externally<br />
benchmarked<br />
Targeted<br />
employee<br />
development<br />
programmes<br />
identified<br />
Exit interview<br />
results incorporated<br />
into<br />
management<br />
decisionmaking<br />
Salaries<br />
assessed on<br />
performance<br />
Address<br />
demographic<br />
trends<br />
Targeted<br />
employee<br />
development<br />
programmes<br />
in place<br />
Performance<br />
and development<br />
review<br />
(PADR)<br />
extended to<br />
all staff<br />
90%<br />
2008 2009 2010 2011<br />
85% 85% 85% 88%<br />
<strong>Watercare</strong> strives to appoint the best candidates for all jobs. The workforce is diverse and comes from a wide range of<br />
backgrounds and experiences. Over 37 different nationalities are represented within the company.<br />
health, safety and well-being PAGE 37
<strong>Watercare</strong> Services Limited<br />
<strong>2012</strong> ANNUAL REPORT<br />
<strong>Watercare</strong> at work<br />
<strong>Watercare</strong> monitoring shows continuing<br />
improvements in Manukau Harbour’s water quality<br />
Major improvements in Manukau Harbour’s<br />
water quality have been achieved as a result<br />
of substantial long-term investment at the<br />
Mangere Wastewater Treatment Plant.<br />
<strong>Watercare</strong> completed a $450 million<br />
upgrade of the Mangere Wastewater<br />
Treatment Plant between 1997 and<br />
2003, which included the largest harbour<br />
restoration project ever undertaken in<br />
New Zealand.<br />
The company’s Wastewater Operations<br />
Manager, Mark Bourne, says <strong>Watercare</strong><br />
maintains a Manukau Harbour-specific<br />
water quality monitoring programme,<br />
while Auckland Council monitors water<br />
quality readings Auckland-wide through<br />
its own monitoring programme. “There is<br />
now more than 20 years of water quality<br />
monitoring data available which <strong>Watercare</strong><br />
has analysed. We’ve been able to compare<br />
harbour water quality data before the<br />
Mangere plant upgrade with test results<br />
collected since the completion of the<br />
upgrade.”<br />
Mark says <strong>Watercare</strong>’s monitoring of<br />
treated wastewater concentrations at<br />
Mangere has shown large reductions in<br />
contaminants in the 10 years since the<br />
upgrade was completed. These decreases<br />
have included:<br />
• A greater than 90% reduction in<br />
biochemical oxygen demand, with<br />
improved levels of dissolved oxygen<br />
• A greater than 80% reduction in<br />
suspended solids<br />
• A greater than 75% reduction in total<br />
nitrogen levels<br />
• A greater than 95% reduction in<br />
ammoniacal nitrogen<br />
• A greater than 10,000 times reduction in<br />
enteric human virus numbers through the<br />
upgraded plant under most conditions,<br />
with a mean reduction of more than<br />
100,000 times<br />
• Reduced peak chlorophyll A<br />
concentrations and associated risk of<br />
algal blooms.<br />
In addition, concentrations of metals<br />
in harbour sediments have decreased<br />
substantially compared with levels found<br />
when the old oxidation ponds were first<br />
decommissioned, and now meet guideline<br />
values in the majority of cases. Residual<br />
organic oxidation pond sludges have<br />
largely stabilised or disappeared.<br />
Since the completion of the upgrade,<br />
<strong>Watercare</strong>’s observations of the harbour<br />
have included:<br />
• No recorded toxic algal blooms (none<br />
were recorded before the upgrade<br />
either, even when total nitrogen loads<br />
“Extensive upgrades have transformed the old Mangere plant<br />
into a totally new-generation, multi-stage treatment facility”<br />
discharged were four times higher than<br />
they are now)<br />
• No recorded nuisance blooms<br />
• An approximate reduction of 55% in<br />
the area of the harbour covered by the<br />
macroalga Gracillaria.<br />
The extensive upgrade transformed the old<br />
Mangere plant into a totally new-generation,<br />
multi-stage treatment facility. The plant<br />
itself no longer uses oxidation ponds to<br />
treat wastewater, instead using land-based<br />
treatment technology including reactor<br />
clarifiers and ultraviolet filtration. The<br />
multi‐million-dollar plant upgrade included:<br />
• An intensive public consultation and<br />
consent process<br />
• The removal of 500 hectares of oxidation<br />
ponds, reuniting the original foreshore<br />
with the sea<br />
• The restoration of Oruarangi Creek and<br />
Mangere Lagoon<br />
• The reinstatement of 13 kilometres<br />
of Manukau Harbour shoreline,<br />
reinstating native vegetation and<br />
natural wildlife habitats.<br />
<strong>Watercare</strong>’s Coastal Walkway provides<br />
recreational access to the culturally<br />
significant Mangere Ihumatao foreshore,<br />
and stretches seven kilometres from<br />
Ambury Park to the Otuataua Stonefields.<br />
Substantial restoration of the Manukau<br />
Harbour bed has also now been completed,<br />
and further enhancements underway<br />
include the rehabilitation of the former<br />
quarry on Puketutu Island.<br />
Mark says <strong>Watercare</strong> remains strongly<br />
committed to continuing to protect the<br />
Manukau Harbour, and in particular to<br />
continuing to maintaining the same levels<br />
of public health protection for Aucklanders.<br />
In addition, <strong>Watercare</strong> will uphold<br />
compliance with the limits on nitrogen<br />
load stipulated in the conditions applied<br />
at the time discharge permits for the<br />
Mangere plant upgrade were granted.<br />
These conditions, along with the removal of<br />
the old oxidation ponds, were put in place<br />
to ensure that outcomes agreed with the<br />
community would be met, specifically:<br />
• To ensure that the treated wastewater<br />
meets appropriate standards for<br />
recreational use and the taking of<br />
shellfish (outside an agreed zone of<br />
non‐compliance)<br />
• To ensure that the proliferation of<br />
undesirable biological growth as a result<br />
of the discharge of nitrogen is avoided<br />
• To restore as much as possible of the<br />
former harbour bed to its natural marine<br />
estuary condition.<br />
<strong>Watercare</strong> has committed to continue to<br />
monitor and publicly report on Manukau<br />
Harbour’s water quality, to make sure that<br />
treatment capacity is suitably expanded<br />
in response to the growing demands<br />
of Auckland. The Mangere Wastewater<br />
Treatment Plant continues to meet<br />
appropriate environmental<br />
performance targets.<br />
PAGE 38 health, safety and well-being
<strong>Watercare</strong> Services Limited<br />
<strong>2012</strong> ANNUAL REPORT<br />
Mangere Wastewater Treatment Plant and Puketutu<br />
Island. <strong>Watercare</strong> completed a $450 million upgrade<br />
of the Mangere Wastewater Treatment Plant between<br />
1997 and 2003, and water quality monitoring has<br />
since shown continuing improvements in Manukau<br />
Harbour’s water quality.<br />
health, safety and well-being PAGE 39
<strong>Watercare</strong> Services Limited<br />
<strong>2012</strong> ANNUAL REPORT<br />
4 Customer<br />
satisfaction<br />
Providing customers with great service and great value.<br />
<strong>Watercare</strong>’s customers interact with the company in a<br />
variety of ways, and <strong>Watercare</strong>’s customer service teams<br />
continue to play an essential role in the company’s delivery<br />
of outstanding and affordable water services to Aucklanders.<br />
During the past 12 months, <strong>Watercare</strong> has achieved improved<br />
operational stability in the company’s customer service<br />
functions, and has been building on achievements from 2011.<br />
The contact centre at East Tamaki is often a customer’s first<br />
point of contact with <strong>Watercare</strong>, and continues to respond to<br />
up to 2,000 phone calls, letters and e-mails from customers<br />
every day. Customers can now choose to use online<br />
self-service facilities and electronic billing options. These<br />
initiatives are still being refined but have already generated<br />
positive feedback from those who prefer to interact with<br />
<strong>Watercare</strong> in this way.<br />
PAGE 40 customer satisfaction
<strong>Watercare</strong> Services Limited<br />
<strong>2012</strong> ANNUAL REPORT<br />
PercentaGe<br />
7<br />
7<br />
FoCuS<br />
FoCuS<br />
8<br />
8<br />
FoCuS<br />
FoCuS<br />
100<br />
95<br />
100<br />
90<br />
95<br />
85<br />
90<br />
80<br />
85<br />
75<br />
80<br />
70<br />
75<br />
65<br />
70<br />
60<br />
65<br />
55<br />
60<br />
50<br />
55<br />
45<br />
50<br />
40<br />
45<br />
35<br />
40<br />
30<br />
35<br />
25<br />
30<br />
20<br />
25<br />
15<br />
20<br />
10<br />
15<br />
10<br />
PercentaGe<br />
FoCuS<br />
FoCuS<br />
1<br />
1<br />
FoCuS<br />
FoCuS<br />
2<br />
2<br />
Overall score<br />
for focus arEA<br />
100 %<br />
<strong>Watercare</strong>’s East Tamaki<br />
Customer Contact<br />
Centre in action.<br />
6 6<br />
FoCuS FoCuS<br />
FoCuS<br />
FoCuS<br />
5<br />
5<br />
FoCuS<br />
FoCuS<br />
4<br />
4<br />
FoCuS<br />
FoCuS<br />
3<br />
3<br />
See page 5<br />
customer satisfaction PAGE 41
<strong>Watercare</strong> Services Limited<br />
<strong>2012</strong> ANNUAL REPORT<br />
4 Customer<br />
satisfaction<br />
Supporting Information<br />
Fig. 29 Customer satisfaction<br />
Fig. 30 Grade of service<br />
Fig. 31 Complaint types and response rates<br />
Fig. 32 Household affordability<br />
KEY<br />
Target met<br />
Target not met<br />
Good performance<br />
but could do better<br />
Presentation of ruler<br />
updated from 2011<br />
4a. Percentage performance against Statement of Corporate Intent target: customer satisfaction with water<br />
and wastewater services. SCI target: 80% customer satisfaction.<br />
TARGET 100%<br />
10 20 30 40 50 60 70 80 90 100<br />
<strong>2012</strong> SCORE<br />
100%<br />
<strong>Watercare</strong> achieved an 82.2% performance against the customer service target of 80%. Of the customers who contacted the<br />
company to report faults and were surveyed by independent researchers, 82.2% were satisfied – this being an overall score of<br />
at least 7 out of a possible 9. In 2011, <strong>Watercare</strong> met its customer service target but this was not clearly evident in the reported<br />
results. <strong>Watercare</strong> has exceeded the customer service target in <strong>2012</strong>, thereby achieving a performance score of 100%.<br />
2011<br />
90%<br />
4b. Percentage performance against Statement of Corporate Intent target: grade of service.<br />
SCI target: 80% of calls answered within 20 seconds.<br />
TARGET 100%<br />
10 20 30 40 50 60 70 80 90 100<br />
<strong>2012</strong> SCORE<br />
100%<br />
Grade of service is an industry best-practice performance measure, aimed at ensuring 80% of calls are answered within<br />
20 seconds. During the 2011/12 year, the grade of service target was met. Overall performance was 81.8%. First Contact<br />
(after-hours) calls were not included in the grade of service SCI. First Contact performance was 81.6%. For <strong>2012</strong>, <strong>Watercare</strong>’s<br />
performance is illustrated as a percentage of the target achieved. This differs from 2011, where our performance was illustrated<br />
against the Statement of Corporate Intent grade of service target. This year the company exceeded its target, thereby achieving<br />
a performance score of 100%.<br />
2011<br />
87%<br />
4c. Percentage performance against Statement of Corporate Intent target: ‘closed’ complaints and<br />
enquiries. SCI target: 95% of complaints and enquiries ‘closed’ within 10 days.<br />
TARGET100%<br />
10 20 30 40 50 60 70 80 90 100<br />
<strong>2012</strong> SCORE<br />
100%<br />
The SCI target of ‘closed’ complaints and enquiries measures the time taken for an issue to be resolved and feedback given to the<br />
customer. A 10-day target is considered industry best practice. Performance was 99.7% for the 2011/12 period, against an SCI<br />
target of 95%. Complaints performed at 96.4% and enquiries at 99.8%. Complaints (1355) made up 5.1% of the total enquiries<br />
(26,762). For <strong>2012</strong>, <strong>Watercare</strong>’s performance is illustrated as a percentage of the target achieved. This differs from 2011, where<br />
our performance was illustrated against the Statement of Corporate Intent target. This year the company exceeded its target,<br />
thereby achieving a performance score of 100%.<br />
2011<br />
90%<br />
4d. Percentage performance against Statement of Corporate Intent target: household affordability.<br />
SCI target: water bill is less than 1.5% of the average Auckland household income.<br />
TARGET 100%<br />
10 20 30 40 50 60 70 80 90 100<br />
<strong>2012</strong> SCORE<br />
100%<br />
The average monthly household water and wastewater bill from <strong>Watercare</strong> was $52.30 for the period 1 July 2011 to 30 June<br />
<strong>2012</strong>. Based on Statistics NZ’s average monthly household income in Auckland of $7,219, the bill represents 0.72% of the<br />
average household income.<br />
2010 2011<br />
100% 100%<br />
PAGE 42 customer satisfaction
<strong>Watercare</strong> Services Limited<br />
<strong>2012</strong> ANNUAL REPORT<br />
<strong>Watercare</strong> at work<br />
Services evolving to meet customers’ needs<br />
<strong>Watercare</strong> Networks Engineer<br />
Monique Furniss (right) talks<br />
with customer Verity Ricklan<br />
about the water meter on<br />
Verity’s Oteha property.<br />
<strong>Watercare</strong>’s Customer Service Manager<br />
Penelope Webster says the company is<br />
focused on responding quickly and efficiently<br />
to customers’ requirements, improving<br />
consistency of services and continuing<br />
to evolve to meet customers’ service<br />
expectations. “By better understanding our<br />
customers’ changing needs and experience of<br />
our services we can focus on improvements<br />
that will make it easier for customers to deal<br />
with us, and help us to be proactive as well<br />
as responsive.”<br />
The company’s customer-facing teams have<br />
access to a range of intranet-based tools<br />
designed to help them achieve this objective,<br />
including H2Know, a new information and<br />
knowledge resource which was successfully<br />
introduced during <strong>2012</strong>. “H2Know has been<br />
a vital tool in our service delivery this year as<br />
we responded to customers’ queries about<br />
the new Auckland-wide water and wastewater<br />
tariffs and streamlining of invoicing cycles to<br />
monthly billing,” Penelope says.<br />
As well as organisation-wide invoicing,<br />
financial management and customer<br />
database management tools, <strong>Watercare</strong><br />
staff utilise an Auckland-specific Geographic<br />
Information System (GIS) with the ability to<br />
map water and wastewater pipe networks,<br />
faults and meter locations in relation to<br />
customers’ Auckland property locations.<br />
<strong>Watercare</strong>’s Chief Services Officer Trish<br />
Langridge says the company has been<br />
striving to provide customers with more<br />
self-service options. “This year we introduced<br />
e-billing and website self-service options<br />
for customers who prefer to interact with<br />
us online. Our customers have the choice to<br />
receive their invoices electronically and make<br />
payments, update their details or ask for<br />
assistance through our website.”<br />
Trish says <strong>Watercare</strong> has also taken steps<br />
to introduce efficiencies in the collection<br />
and storage of data, improve residential<br />
and commercial customer invoicing, and<br />
satisfactorily resolve greater numbers of<br />
customer enquiries without escalation.<br />
“We’ve also been supporting our contact<br />
centre teams in expanding their own<br />
knowledge and experience of <strong>Watercare</strong>’s<br />
activities, and our role as a service provider<br />
to Aucklanders. All of this has contributed<br />
to a significant reduction in the number of<br />
customer complaints being received by our<br />
customer contact centre.”<br />
customer satisfaction PAGE 43
<strong>Watercare</strong> Services Limited<br />
<strong>2012</strong> ANNUAL REPORT<br />
5<br />
stakeholder<br />
relations<br />
To be responsive to stakeholder requirements.<br />
PAGE 44 stakeholder relations
<strong>Watercare</strong> Services Limited<br />
<strong>2012</strong> ANNUAL REPORT<br />
PercentaGe<br />
<strong>Watercare</strong> has been<br />
supporting Auckland’s Round<br />
the Bays fun run since 1993.<br />
The company’s staff provide<br />
runners with fresh drinking<br />
water at water stations along<br />
the 8.4 kilometre route.<br />
7 7<br />
FoCuS<br />
FoCuS<br />
6<br />
6<br />
FoCuS<br />
FoCuS<br />
8<br />
8<br />
FoCuS<br />
FoCuS<br />
FoCuS 5<br />
FoCuS 5<br />
100<br />
95<br />
10090<br />
9585<br />
9080<br />
8575<br />
8070<br />
7565<br />
7060<br />
6555<br />
6050<br />
5545<br />
5040<br />
4535<br />
4030<br />
3525<br />
3020<br />
2515<br />
2010<br />
15<br />
10<br />
PercentaGe<br />
FoCuS<br />
FoCuS<br />
4<br />
4<br />
FoCuS<br />
FoCuS<br />
1<br />
1<br />
FoCuS<br />
FoCuS<br />
3 3<br />
FoCuS<br />
FoCuS<br />
2<br />
2<br />
Overall score<br />
for focus arEA<br />
95 %<br />
See page 5<br />
<strong>Watercare</strong> continues to work collaboratively with a wide<br />
variety of key stakeholders, including: our shareholder<br />
Auckland Council; Auckland Local Boards and community<br />
groups; residents and businesses; schools and educational<br />
institutions; iwi and mana whenua groups; and other parties<br />
with interests in the company’s activities.<br />
As a major infrastructure business, <strong>Watercare</strong> has $1.4 billion<br />
of works underway across the Auckland region upgrading<br />
and developing new infrastructure. In 2011/12, notable<br />
engagements have included the Helensville community<br />
during the process of seeking resource consent for the<br />
local wastewater plant; the Kumeu, Huapai and Riverhead<br />
community on the installation of new wastewater services;<br />
and five public open days held on the Central Interceptor<br />
wastewater tunnel project.<br />
stakeholder relations PAGE 45
<strong>Watercare</strong> Services Limited<br />
<strong>2012</strong> ANNUAL REPORT<br />
KEY<br />
5<br />
Stakeholder<br />
Relations<br />
Supporting Information<br />
Fig. 33 Community impact of operations<br />
Fig. 34 Public policy participation<br />
Fig. 35 Rain Forest Express passengers and trips<br />
Fig. 36 Adopt A Stream<br />
Target met<br />
Target not met<br />
Good performance<br />
but could do better<br />
Presentation of ruler<br />
updated from 2011<br />
5a. Percentage performance against target: engaged shareholder.<br />
Target: 100% of shareholder engagement outcomes achieved.<br />
TARGET 100%<br />
<strong>2012</strong> SCORE<br />
Involvement<br />
in Auckland<br />
Council<br />
Long-Term<br />
Planning<br />
processes<br />
including the<br />
Long Term<br />
Plan (LTP),<br />
Auckland<br />
Plan and the<br />
Unitary Plan<br />
Consultation<br />
with the<br />
shareholder<br />
and Local<br />
Boards<br />
during<br />
development<br />
of the regional<br />
Asset<br />
Management<br />
Plan (AMP)<br />
Consultation<br />
with the<br />
Shareholder<br />
during development<br />
of<br />
the Funding<br />
Plan<br />
Consultation<br />
with the<br />
Shareholder,<br />
and through<br />
them, Maori,<br />
and Local<br />
Boards during<br />
development<br />
of the<br />
Statement<br />
of Corporate<br />
Intent (SCI)<br />
Quarterly<br />
performance<br />
and progress<br />
reports sent<br />
to Council<br />
Briefings<br />
presented to<br />
Council on<br />
a quarterly<br />
basis or as<br />
requested<br />
Co-operation<br />
with CCOs<br />
maintained<br />
e.g. joint<br />
initiatives<br />
undertaken<br />
to minimise<br />
public<br />
disruption<br />
Local Board,<br />
ratepayer association<br />
and<br />
community<br />
meetings<br />
attended<br />
Local Board<br />
plans<br />
reviewed and<br />
engagement<br />
plan<br />
developed,<br />
agreed and<br />
implemented<br />
Iwi Statutory<br />
Board and<br />
council advisory<br />
groups<br />
engaged<br />
on relevant<br />
projects<br />
2011<br />
85%<br />
95%<br />
<strong>Watercare</strong> has worked closely with its shareholder Auckland Council to<br />
develop key planning documents including the Auckland Plan, the plan to<br />
deliver Auckland’s vision of becoming the world’s most liveable city and<br />
the Long Term Plan (LTP). The LTP is the shareholder’s, strategic planning<br />
document that represents the following 10 years’ investment to deliver<br />
the outcomes of the Auckland Plan.<br />
<strong>Watercare</strong> supports the delivery of the shareholder’s outcomes through<br />
the development of a Statement of Corporate Intent (SCI), a document<br />
that sets out the governance arrangements between the company and the<br />
shareholder and by aligning investment through its Financial Plans and<br />
Asset Management Plan (AMP).<br />
Local Board relationships continued to develop significantly with the<br />
introduction of an agreed engagement plan as <strong>Watercare</strong> strengthened<br />
its working relationships with the Local Boards, keeping them informed of<br />
projects and decisions that affect their communities.<br />
<strong>Watercare</strong> is working with iwi authorities throughout Auckland to<br />
establish the Mana Whenua Forum. The emergence of the forum resulted<br />
from a collective desire to engage with Maori proactively to build<br />
relationships and to enhance business efficiencies. The primary purpose<br />
of the forum is to develop creative, innovative solutions for water and<br />
wastewater strategies and projects throughout Auckland to ensure<br />
<strong>Watercare</strong> operates in a manner that enhances environmental, social, and<br />
economic values, whilst maintaining cultural integrity.<br />
The company also continues to be an active participant in the<br />
development of relevant legislation and policy initiatives and has made<br />
submissions on the following:<br />
• Tamaki Collective Claim on Volcanic Cones<br />
• Code of Practice for Utilities Access in the Transport Corridors<br />
• Building Act Amendment Bill<br />
• Proposed Waikato Regional Policy Statement.<br />
<strong>Watercare</strong> has continued also an active member of the Land and<br />
Water Forum.<br />
5b. Percentage performance against target: engaged communities.<br />
Target: 100% of communities’ engagement outcomes achieved.<br />
TARGET 100%<br />
<strong>2012</strong> SCORE<br />
Projectrelated<br />
public communication<br />
undertaken<br />
Project liaison<br />
groups<br />
established<br />
and communications<br />
updated<br />
<strong>Watercare</strong><br />
advisory<br />
group<br />
meetings<br />
undertaken<br />
Access to<br />
<strong>Watercare</strong><br />
facilities –<br />
Rain Forest<br />
Express<br />
Education<br />
initiatives<br />
undertaken<br />
- Adopt A<br />
Stream<br />
Public<br />
meetings<br />
held to hear<br />
Shareholder<br />
feedback on<br />
the SCI and<br />
to report on<br />
performance<br />
<strong>Watercare</strong><br />
Board<br />
agendas<br />
and minutes<br />
published on<br />
the website<br />
Water-wise<br />
advertisements<br />
and<br />
water saving<br />
messages<br />
published<br />
Tangata<br />
whenua<br />
engaged and,<br />
where<br />
appropriate,<br />
relationship<br />
agreements<br />
developed<br />
Public Good<br />
Sponsorship<br />
of the <strong>Watercare</strong><br />
Harbour<br />
Clean-Up<br />
Trust<br />
2011<br />
95%<br />
95%<br />
As a major infrastructure company, <strong>Watercare</strong> has $1.4 billion of works<br />
underway across the Auckland region upgrading and developing new<br />
infrastructure. The company has carried out a wide variety of engagement<br />
with residents, businesses, Local Boards, Auckland Council and other affected<br />
parties. Notable engagements have included: the Helensville community<br />
during the process of seeking resource consent for the local wastewater<br />
plant; the Kumeu, Huapai and Riverhead community on the installation of<br />
new wastewater services; and, most recently, the five public open days held<br />
on the Central Interceptor wastewater tunnel project.<br />
<strong>Watercare</strong> runs an education programme – Adopt A Stream – offering primary<br />
and intermediate school children lessons about water quality, the water cycle,<br />
conservation and the environment. In 2011/12, demand for lessons remained<br />
high with 6,988 pupils participating. The Rain Forest Express, a narrow-gauge<br />
railway built to service the Upper Nihotupu Dam around 1912, continues to<br />
be a very popular attraction for tourists and locals.<br />
In addition, in 2011 the company became the principal sponsor of the<br />
<strong>Watercare</strong> Harbour Clean-Up Trust which has removed over 2.5 million litres<br />
of litter from Auckland’s harbours and waterways since it was established<br />
in 2002.<br />
PAGE 46 stakeholder relations
<strong>Watercare</strong> Services Limited<br />
<strong>2012</strong> ANNUAL REPORT<br />
<strong>Watercare</strong> at work<br />
Helensville plant upgrade requires<br />
a consultative approach<br />
Pictured below: <strong>Watercare</strong> contractors installing<br />
mechanical aerators into oxidation ponds as part<br />
of upgrade works at the Helensville Wastewater<br />
Treatment Plant. Four new cage aerators were<br />
lowered into the wastewater treatment pond by<br />
crane. The aerators will be fitted out and moved<br />
into separate locations alongside the existing single<br />
aerator inside the pond, to provide oxygen transfer<br />
for beneficial bacteria which treat the wastewater<br />
and remove pollutants.<br />
<strong>Watercare</strong> has worked closely with Auckland<br />
Council and the Helensville local community<br />
to achieve compliance with required effluent<br />
quality levels, and to resolve historical<br />
resource consent issues with the Helensville<br />
wastewater treatment plant inherited from<br />
a legacy local authority. The company<br />
has also begun the first in a series of<br />
staged upgrades at the plant to ensure the<br />
discharge continues to meet environmental<br />
standards and projected increases in the<br />
local area population.<br />
<strong>Watercare</strong>’s Wastewater Planning<br />
Manager, Phil Jaggard, says <strong>Watercare</strong><br />
commenced work to improve the<br />
performance of the plant by de-sludging<br />
it’s oxidation ponds in January 2011,<br />
and the installation of new mechanical<br />
aerators which is now complete. “We’re<br />
anticipating the full completion of<br />
design, upgrade works and compliance<br />
at Helensville by early 2014.” <strong>Watercare</strong><br />
has worked closely with Auckland<br />
Council, Local Board members and the<br />
local community to obtain new resource<br />
consents for the plant, and facility<br />
performance levels are continuing to<br />
improve. Phil says: “Now that the first<br />
upgrades are in place, we will continue<br />
to monitor the performance of the<br />
plant, and in early 2013 we’ll review<br />
the situation with regard to allowance<br />
for new connections. It’s been pleasing<br />
to be able to work constructively and<br />
collaboratively with Council for the<br />
benefit of Helensville residents.”<br />
5c. Percentage performance: legal compliance.<br />
Target: 100% of shareholder engagement outcomes achieved.<br />
TARGET 100%<br />
<strong>2012</strong> SCORE<br />
Compliance<br />
risk assessment<br />
Compliance<br />
monitoring<br />
Compliance<br />
comparative<br />
performance<br />
Compliance<br />
management<br />
plan<br />
Compliance<br />
assurance<br />
No successful<br />
prosecutions<br />
against<br />
<strong>Watercare</strong><br />
All potential<br />
legal issues<br />
identified<br />
All legal<br />
issues<br />
effectively<br />
managed<br />
All legal<br />
issues<br />
managed and<br />
resolved<br />
No known<br />
pending legal<br />
issues<br />
95%<br />
2011<br />
100%<br />
<strong>Watercare</strong> has many statutory obligations under a number of Acts and<br />
invests a considerable amount of resources in complying with and<br />
monitoring statutory requirements. Technical non-compliance with<br />
resource consents relating to the inherited non-metropolitan wastewater<br />
treatment plants are reported under Ruler 2a on page 32.<br />
Following careful consideration, <strong>Watercare</strong> decided to defend health<br />
and safety charges brought by the Department of Labour relating to the<br />
Onehunga explosion of June 2011. The matter is currently before the courts.<br />
In every other respect, the company achieved compliance with all<br />
statutory obligations specified in the relevant Acts during the past year.<br />
stakeholder relations PAGE 47
<strong>Watercare</strong> Services Limited<br />
<strong>2012</strong> ANNUAL REPORT<br />
6<br />
sustainable<br />
environment<br />
To minimise and/or mitigate the adverse impact of<br />
the company’s operations on the environment.<br />
PAGE 48 sustainable environment
<strong>Watercare</strong> Services Limited<br />
<strong>2012</strong> ANNUAL REPORT<br />
Pictured below: <strong>Watercare</strong><br />
Operations staff Dave Hodgson<br />
and John Pattenwise trapping<br />
eels at Lower Nihotupu<br />
Reservoir. <strong>Watercare</strong> traps eels<br />
in the company’s reservoirs and<br />
transfers them downstream of<br />
dams to reduce any impacts on<br />
their natural breeding lifecycle.<br />
7<br />
7<br />
FoCuS<br />
FoCuS<br />
6<br />
6<br />
FoCuS<br />
FoCuS<br />
8<br />
8<br />
FoCuS<br />
FoCuS<br />
FoCuS<br />
FoCuS<br />
5<br />
5<br />
PercentaGe<br />
PercentaGe<br />
100<br />
95<br />
90<br />
85<br />
80<br />
75<br />
70<br />
65<br />
60<br />
55<br />
50<br />
45<br />
40<br />
35<br />
30<br />
25<br />
20<br />
15<br />
10<br />
100<br />
95<br />
90<br />
85<br />
80<br />
75<br />
70<br />
65<br />
60<br />
55<br />
50<br />
45<br />
40<br />
35<br />
30<br />
25<br />
20<br />
15<br />
10<br />
FoCuS<br />
FoCuS 4 4<br />
FoCuS 1<br />
FoCuS 1<br />
FoCuS 3<br />
FoCuS 2<br />
FoCuS 3<br />
FoCuS 2<br />
Overall score<br />
for focus arEA<br />
90 %<br />
See page 5<br />
<strong>Watercare</strong> is committed to providing water and wastewater services<br />
to Auckland using methods that are environmentally sustainable.<br />
The company seeks to maintain an environmentally acceptable<br />
approach in all of its activities, including reducing greenhouse gas<br />
emissions, sourcing energy from internal sources, decreasing the<br />
amount of general waste ending up in landfills and promoting a<br />
zero waste policy in recycling. <strong>Watercare</strong> is actively involved in the<br />
long-term restoration and rehabilitation of Auckland’s harbours,<br />
beaches and islands, as well as community tree-planting days,<br />
wildlife protection programmes and sponsorship of not-for-profit<br />
community groups such as the <strong>Watercare</strong> Harbour Clean-Up Trust.<br />
<strong>Watercare</strong>’s new Sustainability Manager, Roseline Klein, started<br />
with the company in February. Roseline’s role involves leading<br />
<strong>Watercare</strong>’s internal sustainability programme, as well as<br />
implementing sustainability across the company’s activities and<br />
engaging with internal and external stakeholders.<br />
Roseline is closely involved in monitoring <strong>Watercare</strong>’s demand<br />
management; mapping the company’s sustainability impact; and<br />
building new projects to address these effects.<br />
sustainable environment PAGE 49
<strong>Watercare</strong> Services Limited<br />
<strong>2012</strong> ANNUAL REPORT<br />
6<br />
sustainable<br />
environment<br />
6a. Percentage performance against target: atmospheric CO 2<br />
emissions. Target: greater than 50% reduction,<br />
based on 1990 levels, by 2050.<br />
TARGET 100%<br />
10 20 30 40 50 60 70 80 90 100<br />
<strong>2012</strong> SCORE<br />
100%<br />
<strong>Watercare</strong> calculates its greenhouse gas emissions including carbon dioxide (CO 2<br />
), methane and nitrous oxide which are largely<br />
generated from the treatment of wastewater. This year, the company maintained emitted greenhouse gas levels equivalent<br />
to 78% lower than in 1990. 75% is the company’s historic benchmark for performance in this area. This long-term target<br />
has already been achieved. In previous years, <strong>Watercare</strong> exceeded its emissions target but this was not clearly evident in the<br />
reported results. <strong>Watercare</strong> again exceeded the emissions target in <strong>2012</strong>, thereby achieving a performance score of 100%.<br />
2008 2009 2010 2011<br />
85% 85% 85% 75%<br />
6b. Percentage performance against target: internally sourced energy. Target: 100%.<br />
TARGET 100%<br />
10 20 30 40 50 60 70 80 90 100<br />
<strong>Watercare</strong> aims to source 35% of all its energy requirements from internal sources, principally from generators burning biogas<br />
at its two largest wastewater plants, Mangere and Rosedale, and from five hydro-electric generators within the water supply<br />
system. This year the company sourced 31% of its energy, achieving 89% of its target.<br />
2011<br />
91%<br />
<strong>2012</strong> SCORE<br />
89%<br />
6c. Percentage performance: recycling. Elimination of recyclable and compostable material in the general<br />
waste stream. Target: 100%.<br />
TARGET100%<br />
10 20 30 40 50 60 70 80 90 100<br />
<strong>2012</strong> SCORE<br />
66%<br />
The zero-waste recycling programme aims to eliminate all general waste going to landfill. The immediate objective is to<br />
ensure that all material that can be either recycled or composted is diverted from entering the general waste stream and<br />
ending up in a landfill. In <strong>2012</strong> <strong>Watercare</strong> achieved 66% of its target. <strong>Watercare</strong> operates a three-bin system for general waste,<br />
recycling and organic material, which is used to feed the worm farms at each of our main facilities. The company has created<br />
a new Sustainability Manager role to champion Demand Management and Zero Waste and other programmes to help advance<br />
<strong>Watercare</strong>’s sustainable approach.<br />
2008 2009 2010 2011<br />
75% 75% 70% 70%<br />
6d. Percentage performance against target: waste management.<br />
Treatment plant solid waste diverted from commercial landfills. Target: 95%.<br />
TARGET 95%<br />
10 20 30 40 50 60 70 80 90 100<br />
<strong>2012</strong> SCORE<br />
84%<br />
<strong>Watercare</strong> aims to minimise the volume of material being sent to commercial landfills from its water and wastewater treatment<br />
plants. To do this, the company is successfully using biosolids to rehabilitate a small part of the old oxidation ponds at the<br />
Mangere Wastewater Treatment Plant, achieving 84% disposal this year. A key part of the future of this programme is the<br />
Puketutu Island project which gained regulatory approval this year and is a significant step towards achieving the target of 95%.<br />
2011<br />
80%<br />
6e. Percentage performance against target: species preservation.<br />
Target: 100% of species preservation outcomes achieved.<br />
TARGET 100%<br />
<strong>2012</strong> SCORE<br />
Bird roost<br />
management<br />
plan<br />
Bird<br />
populations<br />
monitored<br />
Adequate<br />
bird roost<br />
capacity<br />
Macroinvertebrate<br />
monitoring<br />
Trout<br />
management<br />
plan<br />
Flushing<br />
flow release<br />
- southern<br />
dams<br />
Fish trap and<br />
haul - southern<br />
dams<br />
Fish trap and<br />
haul - western<br />
dams<br />
Fish passages<br />
over weirssouthern<br />
dams<br />
Flushing<br />
flow release<br />
- western<br />
dams<br />
100%<br />
2008 2009 2010 2011<br />
80% 90% 100% 100%<br />
PAGE 50 sustainable environment
<strong>Watercare</strong> Services Limited<br />
<strong>2012</strong> ANNUAL REPORT<br />
Supporting Information<br />
KEY<br />
Fig. 37 Greenhouse gas emissions<br />
Fig. 38 Initiatives to reduce greenhouse gas emissions<br />
Fig. 39 Source of emissions<br />
Fig. 40 <strong>Watercare</strong>’s ecological footprint<br />
Fig. 41 Internal energy usage<br />
Fig. 42 Recycling of general waste<br />
Fig. 43 Biosolids metal levels<br />
Fig. 44 Solids disposal<br />
Fig. 45 Weight of hazardous substances in waste<br />
Fig. 46 Protected areas of high ecological value<br />
Fig. 47 Significant biodiversity impacts<br />
Fig. 48 Midge and odour complaints<br />
Fig. 49 Trade waste customers<br />
Fig. 50 Trade waste sampling programme<br />
Fig. 51 Key trade waste substances<br />
Fig. 52 Materials and chemicals<br />
Target met<br />
Target not met<br />
Good performance<br />
but could do better<br />
Presentation of ruler<br />
updated from 2011<br />
6e. Percentage performance against target: species preservation (continued).<br />
<strong>Watercare</strong> interacts with many species during its activities and we work hard to minimise any impacts and, where possible,<br />
improve conditions for them. An example is the coastal areas around the Mangere Wastewater Treatment Plant which<br />
support a large and diverse range of bird species, which have flourished in bird roosts built and maintained by <strong>Watercare</strong>.<br />
An additional benefit is that these roosts have helped to reduce bird strikes by planes at Auckland Airport. The company<br />
also puts significant resources into minimising the effects that our water supply dams have on the surrounding freshwater<br />
ecologies. This includes simulating flood flows downstream from our dams, installing fish passages and performing a trap and<br />
haul programme, where migrating fish and eels are transferred around our dams.<br />
6f. Percentage performance against target: habitat improvement.<br />
Target: 100% of habitat improvement outcomes achieved.<br />
TARGET 100%<br />
<strong>2012</strong> SCORE<br />
Rural: Trees<br />
for Survival<br />
sponsorship<br />
Freshwater:<br />
downstream<br />
water quality<br />
monitoring -<br />
southern<br />
dams<br />
Freshwater:<br />
residual<br />
flows maintained<br />
-<br />
southern<br />
dams<br />
Freshwater:<br />
downstream<br />
water quality<br />
monitoring -<br />
western<br />
dams<br />
Freshwater:<br />
Waikato<br />
RiverCare<br />
sponsorship<br />
Freshwater:<br />
Adopt A<br />
Stream<br />
school<br />
programme<br />
Freshwater:<br />
Riparian<br />
planting<br />
programme -<br />
southern<br />
dams<br />
Coastal:<br />
Harbour<br />
Clean Up<br />
Trust sponsorship<br />
Freshwater:<br />
residual<br />
flows implemented<br />
-<br />
western<br />
dams<br />
Urban:<br />
restoration<br />
projects<br />
Puketutu<br />
Island<br />
90%<br />
2008 2009 2010 2011<br />
80% 85% 90% 90%<br />
This year, <strong>Watercare</strong> became the principal sponsor of the <strong>Watercare</strong> Harbour Clean-Up Trust. The trust oversees the removal of<br />
litter from Auckland’s Waitemata Harbour and inner Hauraki Gulf islands. The restoration of Puketutu Island is a step closer with<br />
the issuing of the resource consents and works are expected to begin late <strong>2012</strong>. <strong>Watercare</strong> staff participate in planting days for the<br />
Trees for Survival and Waikato RiverCare programmes. Recent testing has shown that there has been a significant improvement in<br />
the quality of the water in the Manukau Harbour following extensive investment at the Mangere Wastewater Treatment Plant.<br />
6g. Percentage performance against target: midge complaints at wastewater treatment plants.<br />
Number of midge complaints. Target: 0.<br />
TARGET 100%<br />
10 20 30 40 50 60 70 80 90 100<br />
<strong>2012</strong> SCORE<br />
90%<br />
<strong>Watercare</strong> operates a year-round monitoring and management programme that focuses on controlling midge breeding grounds<br />
around its wastewater treatment plants and on reducing midge breeding grounds in the community, largely through public<br />
awareness initiatives. Effective response continues to be required, particularly when warm, wet weather creates conditions in<br />
which midges thrive. The plants continued to achieve low levels of midge complaints (2 received at Mangere, 3 at Omaha); and<br />
no complaints were received at other plants.<br />
2008 2009 2010 2011<br />
95% 100% 100% 70%<br />
6h. Percentage performance against target: odour complaints at wastewater treatment plants.<br />
Number of odour complaints. Target: 0.<br />
TARGET 100%<br />
10 20 30 40 50 60 70 80 90 100<br />
<strong>2012</strong> SCORE<br />
95%<br />
Odour control measures continue to be an important focus at <strong>Watercare</strong>’s wastewater treatment plants and include the use<br />
of covers and odour filter beds, as well as stationary and mobile deodoriser spraying units. The company undertakes periodic<br />
plant boundary odour surveys that involve an independent ‘odour scout’ to investigate and report any odour detection. For<br />
2011/12, there were two verified odour complaints at Mangere, and one each at the Waiwera, Beachlands and Omaha area. All<br />
complaints were responded to in a timely manner and a 95% performance against the target was achieved.<br />
2008 2009 2010 2011<br />
75% 60% 85% 90%<br />
6i. Percentage performance against target: compliance of trade waste customers. Target: 100%.<br />
TARGET 100%<br />
10 20 30 40 50 60 70 80 90 100<br />
<strong>Watercare</strong> aims to work with its customers to ensure 100% compliance level with trade waste by-laws. A comprehensive<br />
monitoring and sampling programme, targeted education and a good level of environmental awareness by customers have all<br />
been factors in maintaining a high degree of compliance.<br />
<strong>2012</strong> SCORE<br />
99%<br />
2008 2009 2010 2011<br />
95% 96% 97% 99%<br />
sustainable environment PAGE 51
<strong>Watercare</strong> Services Limited<br />
<strong>2012</strong> ANNUAL REPORT<br />
<strong>Watercare</strong> at work<br />
Puketutu<br />
Island<br />
<strong>Watercare</strong>’s rehabilitation of a 40 hectare former quarry on Puketutu Island<br />
is well underway. The 35-year rehabilitation is using clean fill and treated<br />
bio-solids to restore the existing natural volcanic cone on the island in a<br />
sustainable, socially and culturally responsible, and economically favourable way.<br />
Puketutu Island holds important historical<br />
and cultural value for the Greater Auckland<br />
region, and in particular for iwi. Successful<br />
negotiations between Waikato-Tainui, local<br />
iwi, <strong>Watercare</strong> and the Kelliher Charitable<br />
Trust have resulted in an agreement to<br />
develop Puketutu Island as a public open<br />
space. The proposal has been approved by<br />
the Environment Court.<br />
For <strong>Watercare</strong>, there is also a commercial<br />
reward. Without the availability of Puketutu<br />
Island, the company would need to transport<br />
bio-solids produced at the Mangere<br />
Wastewater Treatment Plant to landfills a<br />
considerable distance from the plant, which<br />
would result in higher operating costs,<br />
potential safety issues and inconvenience<br />
to neighbours. While the $23.9 million<br />
purchase price for the island lease – plus<br />
the $2.00-per-tonne levy – is a considerable<br />
investment, there will be a saving of up to<br />
$22 million in real terms over the 35-year life<br />
of the project. This saving will be reflected in<br />
future wastewater charges to customers.<br />
There is also a huge benefit for local<br />
residents in Mangere, who will not have<br />
to tolerate up to 30 trucks a day travelling<br />
through their neighbourhood with associated<br />
nuisances of noise, dust and road damage.<br />
In order to ensure benefits to all parties,<br />
the ownership agreement is quite complex.<br />
<strong>Watercare</strong> will lease the island for 55<br />
years and the Kelliher Charitable Trust<br />
will transfer the freehold title to an island<br />
trust comprising three to nine members<br />
representing Waikato-Tainui, Makaurau and<br />
Te Kawerau. A marae and associated cultural<br />
facilities will be constructed on an area<br />
specially designated for that purpose, and<br />
the marae precinct will be freely accessible to<br />
the people of Auckland and other visitors to<br />
the island. Visitors will also be shown places<br />
of historical and cultural significance.<br />
A governance trust comprising members<br />
representing the island trust, <strong>Watercare</strong><br />
and Auckland Council (proposed), will:<br />
allocate funding for the marae construction,<br />
development of the island, scholarships<br />
for education or training and employment<br />
opportunities; as well as provide a forum to<br />
consider issues relating to the island. Under<br />
the agreement it is proposed that Auckland<br />
Council will take up a concurrent renewable<br />
lease with 999- year terms to guarantee that<br />
Puketutu Island remains available to the<br />
people of Auckland in perpetuity.<br />
Under <strong>Watercare</strong>’s rehabilitation plan,<br />
stormwater on the island will be collected<br />
and treated, and liners will be used to collect<br />
any leachate so that this can be returned to<br />
the Mangere Wastewater Treatment Plant<br />
for treatment.<br />
<strong>Watercare</strong> is committed to the long-term<br />
vision of making Puketutu Island accessible<br />
to the people of Auckland as part of the<br />
region’s enhanced recreational parks<br />
network. The new regional park on Puketutu<br />
Island will comprise 197 hectares, which is<br />
larger than Cornwall Park at 172 hectares.<br />
PAGE 52 sustainable environment
<strong>Watercare</strong> Services Limited<br />
<strong>2012</strong> ANNUAL REPORT<br />
<strong>Watercare</strong> at work<br />
Kawakawa Bay wastewater treatment<br />
scheme providing environmental benefits<br />
The Kawakawa Bay Wastewater Treatment<br />
Scheme has now been successfully serving<br />
Kawakawa Bay residents for over 12 months.<br />
Officially opened by Mayor of Auckland Len<br />
Brown and members of the Franklin Local<br />
Board in September 2011, the completion<br />
of the Kawakawa Bay scheme has been the<br />
result of long-term co-operation between:<br />
residents; the former Manukau City Council<br />
and Manukau Water Limited; iwi Ngati Paoa<br />
and Ngai Tai; contractor Fulton Hogan;<br />
<strong>Watercare</strong>; and Auckland Council.<br />
<strong>Watercare</strong>’s Southern Area Wastewater<br />
Operations Manager, Allan Twinch, says the<br />
completion of the scheme in Kawakawa Bay<br />
is an impressive achievement. “Kawakawa<br />
Bay now has: an extensive network of<br />
underground pipes and pits which convey<br />
the wastewater from residents’ properties to<br />
the treatment facility; an efficient and quiet<br />
pump station; a sophisticated biological<br />
treatment plant; and a 9000-cubic-metre<br />
seasonal lagoon that you barely notice even<br />
when you’re standing next to it.”<br />
Allan says the wastewater treatment plant at<br />
Kawakawa Bay, which uses a vacuum system,<br />
is working well and the the decommissioning<br />
of residents’ failing septic tanks is now<br />
complete. With the volume of flow through<br />
the plant steadily increasing, <strong>Watercare</strong> has<br />
begun to make use of treated effluent as<br />
fertiliser into local forests via spray irrigation.<br />
Wastewater treatment and disposal in<br />
Kawakawa Bay had historically been by<br />
the use of private septic tanks. However, in<br />
the early 2000s failing septic tanks were<br />
confirmed as a major source of stormwater<br />
contamination. A number of factors<br />
contributed to this situation, including: high<br />
groundwater levels; the negligible capacity<br />
of shell and sand soils near the foreshore<br />
to treat wastewater; the very poor soakage<br />
characteristics of the soil further inland;<br />
the lack of sufficient land area for effluent<br />
disposal; and difficult terrain (a large, flat<br />
residential area surrounded by steep, rugged<br />
hill country).<br />
When monitoring revealed the scale of the<br />
pollution and the environmental and public<br />
health impacts in 2003, the former Manukau<br />
City Council moved to address the problem.<br />
The Council initiated a wastewater scheme<br />
Pictured at the opening of the Kawakawa Bay Wastewater Treatment Plant are (clockwise from top):<br />
Andrew Baker, Chair, Franklin Local Board; Bill Cashmore, Franklin Local Board member; Jan Sinclair,<br />
Deputy Chair Franklin Local Board; Lynn Chatterton, Kawakawa Bay Community Association.<br />
“It’s encouraging to see the new Kawakawa Bay wastewater<br />
scheme operating successfully, serving the local community<br />
and helping to protect public health and the environment.”<br />
which aimed to overcome the complex<br />
engineering challenges involved, prevent<br />
further beach and water contamination in<br />
Kawakawa Bay, and allow the environment to<br />
recover and beach water quality to improve.<br />
Throughout the community consultation<br />
process, there was widespread support for a<br />
local treatment plant with land disposal. The<br />
scheme designed by the company which was<br />
awarded the contract (Fulton Hogan) included:<br />
• Treatment plant and irrigation sites located<br />
at a reasonable distance from the main<br />
settlements<br />
• A ‘watertight’ vacuum system which prevents<br />
inflow and infiltration<br />
• A high level of treatment to ensure that<br />
the effects on the receiving environment<br />
are minor<br />
• Treatment which includes pathogen removal<br />
to minimise any risks to public health<br />
• Insect control and odour and noise control<br />
incorporated into the design.<br />
- Andrew Baker, Chair, Franklin Local Board<br />
The scheme was specifically designed<br />
to prevent further stream, beach and sea<br />
contamination, and allow the environment to<br />
recover naturally and water quality in the bay<br />
to gradually improve.<br />
Having taken over the development of<br />
the Kawakawa Bay scheme from the<br />
former Manukau Water, <strong>Watercare</strong> is now<br />
responsible for overseeing the operation of<br />
the new facility and has been working closely<br />
with Fulton Hogan to resolve any issues<br />
involved in making the system ‘go live’.<br />
Usage of the scheme began at 258<br />
Kawakawa Bay households – comprising<br />
1500 permanent residents and<br />
holidaymakers – and there are now around<br />
280 households connected to the scheme.<br />
The facility has the potential to serve<br />
3000 residents.<br />
sustainable environment PAGE 53
<strong>Watercare</strong> Services Limited<br />
<strong>2012</strong> ANNUAL REPORT<br />
7<br />
effective<br />
asset<br />
management<br />
Managing assets to ensure the use of existing assets is maximised<br />
while optimising the scope, timing and cost of new investments.<br />
PAGE 54 effective asset management
<strong>Watercare</strong> Services Limited<br />
<strong>2012</strong> ANNUAL REPORT<br />
<strong>Watercare</strong> engineers Chris<br />
Aspinall and Axel Dumont<br />
overlooking one of the<br />
new water clarifiers at the<br />
company’s Waikato Water<br />
Treatment Plant near Tuakau.<br />
7<br />
7<br />
FoCuS<br />
FoCuS<br />
6<br />
6<br />
FoCuS<br />
FoCuS<br />
8<br />
8<br />
FoCuS<br />
FoCuS<br />
FoCuS<br />
FoCuS 5 5<br />
PercentaGe<br />
PercentaGe<br />
100<br />
100<br />
95<br />
95<br />
90<br />
90<br />
85<br />
85<br />
80<br />
80<br />
75<br />
75<br />
70<br />
70<br />
65<br />
65<br />
60<br />
60<br />
55<br />
55<br />
50<br />
50<br />
45<br />
45<br />
40<br />
40<br />
35<br />
35<br />
30<br />
30<br />
25<br />
25<br />
20<br />
20<br />
15<br />
15<br />
10<br />
10<br />
FoCuS<br />
FoCuS<br />
4<br />
4<br />
FoCuS<br />
FoCuS<br />
1<br />
1<br />
FoCuS 3<br />
FoCuS 2<br />
FoCuS 3<br />
FoCuS 2<br />
Overall score<br />
for focus arEA<br />
95 %<br />
See page 5<br />
<strong>Watercare</strong> is on target to complete a three-year, $48 million<br />
expansion of the Waikato Water Treatment Plant by early 2013. The<br />
company’s principal engineer for the project, David Ward, says the<br />
expanded plant will help support the Auckland region’s continued<br />
long-term growth and increasing demand for high-quality treated<br />
drinking water. “The expansion project significantly increases the<br />
capacity of the Waikato plant by 50 million litres of treated drinking<br />
water per day, with provision to expand further by an additional<br />
25 million litres per day when the future demand is there. By utilising<br />
world-leading technology at the Waikato plant we’re able to stage the<br />
expansion of the plant’s capacity as demand increases, all without<br />
disrupting the supply of drinking water to Auckland. The choice<br />
of technology used at the plant also ensures that the expansion<br />
works are contained within the boundaries of the existing site, thus<br />
minimising impacts on the environment and respecting the cultural<br />
heritage of the local area.”<br />
effective asset management PAGE 55
<strong>Watercare</strong> Services Limited<br />
<strong>2012</strong> ANNUAL REPORT<br />
7<br />
Effective<br />
Asset<br />
Management<br />
Supporting Information<br />
Fig. 53 Capital expenditure programme<br />
Fig. 54 Infrastructure provided for public benefit<br />
KEY<br />
Target met<br />
Target not met<br />
Good performance<br />
but could do better<br />
Presentation of ruler<br />
updated from 2011<br />
7a. Percentage performance against Statement of Corporate Intent target: capital expenditure.<br />
Target: within 20% of budget.<br />
TARGET 80%<br />
10 20 30 40 50 60 70 80 90 100<br />
<strong>2012</strong> SCORE<br />
100%<br />
A significant focus for <strong>Watercare</strong> is to ensure an efficient delivery of planned capital work across the business. To achieve this,<br />
the company set a target that capital expenditure should be within 20% of the approved financial budget. For 2011/12, the<br />
actual capital expenditure was 96.5%, within 3.5% of budget and meeting the target fully.<br />
2011<br />
100%<br />
7b. Percentage performance against target: demand managment.<br />
Target: 100% of demand management outcomes achieved.<br />
TARGET 100%<br />
<strong>2012</strong> SCORE<br />
Implement<br />
demand<br />
management<br />
in everyday<br />
business at<br />
<strong>Watercare</strong><br />
Progress<br />
towards regional<br />
water<br />
demand<br />
management<br />
target<br />
Develop<br />
cost-benefit<br />
analysis tool<br />
for demand<br />
management<br />
Future supply<br />
planning balances<br />
costbeneficial<br />
efficiency<br />
options<br />
Water loss<br />
strategies and<br />
management<br />
approaches<br />
developed<br />
Understand<br />
customer<br />
water use<br />
patterns<br />
Promote<br />
water<br />
efficient<br />
devices and<br />
communicate<br />
waterefficient<br />
messages<br />
Work with<br />
large water<br />
users to<br />
reduce<br />
demand<br />
Work with<br />
Auckland<br />
Council to<br />
reduce water<br />
consumption<br />
Undertake<br />
trials and<br />
pilot studies<br />
to improve<br />
water<br />
efficiency<br />
2011<br />
75%<br />
78%<br />
Future asset requirements are largely driven by demand for water. By developing and implementing demand management<br />
programmes, <strong>Watercare</strong> aims to reduce or delay future capital expenditure. Implementation of the Regional Water Demand<br />
Management Plan, developed last year has started. Progress towards the 15% reduction in per capita demand by 2025 has been<br />
made. Further projects will be developed in <strong>2012</strong>/13 to carry on implementing the plan and engaging with stakeholders.<br />
7c. Percentage performance against target: maintenance management systems.<br />
Target: 100% (wholesale business management systems only).<br />
TARGET 100%<br />
<strong>2012</strong> SCORE<br />
All assets<br />
recorded in<br />
asset register<br />
Assets<br />
register computerised<br />
and available<br />
to staff<br />
Asset<br />
financial<br />
information<br />
recorded<br />
Key assets<br />
have<br />
assigned<br />
maintenance<br />
programmes<br />
Maintenance<br />
programmes<br />
recorded in<br />
asset register<br />
Maintenance<br />
programme<br />
based on<br />
criticality<br />
Maintenance<br />
undertaken<br />
according to<br />
plan<br />
Maintenance<br />
history<br />
recorded for<br />
key assets<br />
Consistent<br />
maintenance<br />
practices<br />
companywide<br />
Maintenance<br />
programme<br />
prioritised<br />
using RCM<br />
100%<br />
2008 2009 2010 2011<br />
95% 100% 100% 100%<br />
Maintenance management systems have been enhanced with the implementation of enterprise asset management software (SAP).<br />
All wholesale asset information now resides within this repository, facilitating the decision-making-process to determine whether<br />
to repair/replace/rehabilitate an asset based on condition, cost, health and safety, the environment and operational impact.<br />
7d. Percentage performance against target: maintenance optimisation development.<br />
Target: 100% (wholesale business optimisation development only).<br />
TARGET 100%<br />
<strong>2012</strong> SCORE<br />
Develop<br />
maintenance<br />
philosophy<br />
Develop<br />
action plan<br />
Develop<br />
maintenance<br />
vision and<br />
strategy<br />
Implement<br />
maintenance<br />
vision and<br />
strategy<br />
Establish<br />
workflow<br />
management<br />
Evaluate<br />
effectiveness<br />
with key<br />
performance<br />
indicators<br />
50% of RCM<br />
strategy<br />
implemented<br />
100% of<br />
RCM strategy<br />
implemented<br />
Implement<br />
workflow<br />
management<br />
Computerised<br />
maintenance<br />
management<br />
system<br />
100%<br />
2008 2009 2010 2011<br />
85% 90% 90% 95%<br />
Reliability-Centred Maintenance (RCM) is the framework for the wholesale business maintenance programme which forms a<br />
fundamental part of the asset management programme. Implementation of the enterprise asset management software (SAP)<br />
has increased opportunities for optimisation following its seamless integration with RCM.<br />
PAGE 56 effective asset management
<strong>Watercare</strong> Services Limited<br />
<strong>2012</strong> ANNUAL REPORT<br />
<strong>Watercare</strong> at work<br />
Major Mangere plant<br />
improvements now complete<br />
Pictured on site at <strong>Watercare</strong>’s Mangere<br />
Wastewater Treatment Plant are (left to right):<br />
Projects Manager John Heywood; Senior<br />
Process Engineer Sanjay Kumarasingham;<br />
Project Engineer Alan Brooks; and Process<br />
Engineer Jonathan Piggot.<br />
<strong>Watercare</strong> recently completed a major fiveyear<br />
operational upgrade project on the<br />
sludge dewatering and conveying systems<br />
at Mangere Wastewater Treatment Plant<br />
in response to forecasted growth in solid<br />
waste levels from an increasing Auckland<br />
population. The project was initiated to<br />
resolve a number of operational obstacles,<br />
including breakdowns in existing plant.<br />
The upgrade involved the overhaul of<br />
four existing centrifuges on site and the<br />
installation of two new, large centrifuges<br />
in lieu of two of the old ones, to provide<br />
an 80% increase in the plant’s capacity to<br />
process sludge. A new conveying system<br />
with a lime blender was constructed to add<br />
the lime <strong>Watercare</strong> uses in the process of<br />
converting dewatered digested sludge into<br />
environmentally sustainable bio-solids. Air<br />
extraction improvements on the enclosed<br />
screw conveyors and lime mixer provide<br />
better working environments for staff, and<br />
improved odour control for local residents.<br />
For Aucklanders, the outcome of<br />
<strong>Watercare</strong>’s $6.14 million investment at<br />
Mangere is a wastewater treatment service<br />
that’s now even more capable of meeting<br />
the needs of a growing city.<br />
effective asset management PAGE 57
<strong>Watercare</strong> Services Limited<br />
<strong>2012</strong> ANNUAL REPORT<br />
8<br />
sound<br />
financial<br />
management<br />
Management of the company to meet business<br />
objectives at the lowest cost.<br />
PAGE 58 sound financial management
<strong>Watercare</strong> Services Limited<br />
<strong>2012</strong> ANNUAL REPORT<br />
PercentaGe<br />
Treasury Manager Jason Isherwood<br />
finalises <strong>Watercare</strong>’s financial data<br />
prior to reporting the company’s<br />
month-end performance to the<br />
Board of Directors.<br />
7<br />
7<br />
FoCuS<br />
FoCuS<br />
6 6<br />
FoCuS<br />
FoCuS<br />
8<br />
8<br />
FoCuS<br />
FoCuS<br />
FoCuS<br />
FoCuS<br />
5<br />
5<br />
100<br />
95<br />
90 100<br />
85 95<br />
80 90<br />
75 85<br />
70 80<br />
65 75<br />
60 70<br />
55 65<br />
50 60<br />
45 55<br />
40 50<br />
35 45<br />
30 40<br />
25 35<br />
20 30<br />
15 25<br />
10 20<br />
15<br />
10<br />
PercentaGe<br />
FoCuS 4<br />
FoCuS 4<br />
FoCuS<br />
FoCuS<br />
1<br />
1<br />
FoCuS<br />
FoCuS<br />
3<br />
3<br />
FoCuS<br />
FoCuS<br />
2<br />
2<br />
Overall score<br />
for focus arEA<br />
97 %<br />
See page 5<br />
<strong>Watercare</strong> is required by regulation to manage its operations<br />
efficiently with a view to keeping overall costs to customers<br />
(collectively) at minimum levels, while maintaining the long<br />
term integrity of its assets. By law it cannot pay a dividend to<br />
its shareholder, Auckland Council. Sound financial management<br />
within this context requires <strong>Watercare</strong> to procure its inputs<br />
and resources efficiently, control operating expenditures<br />
and maintain debt at prudent levels that optimise the cost of<br />
capital. In this way costs to customers can be held at minimum<br />
levels. While financial management targets for the year were<br />
either fully met or were very close to being met, the financial<br />
management challenge extends well beyond the last year.<br />
<strong>Watercare</strong> forward financial projections are incorporated into<br />
the Auckland Council <strong>2012</strong>-2022 Long Term Plan.<br />
sound financial management PAGE 59
<strong>Watercare</strong> Services Limited<br />
<strong>2012</strong> ANNUAL REPORT<br />
KEY<br />
8 sound<br />
financial<br />
management<br />
Supporting Information<br />
Fig. 55 Major suppliers and contractors<br />
Fig. 56 Suppliers by spend and industry<br />
Fig. 57 Interest rate performance<br />
Fig. 58 Ethics and business integrity<br />
Fig. 59 Product information disclosure<br />
Fig. 60 Product life cycle, health and safety impact assessment<br />
Fig. 61 Financial implications of climate change<br />
Target met<br />
Target not met<br />
Good performance<br />
but could do better<br />
Presentation of ruler<br />
updated from 2011<br />
8a. Performance against Statement of Corporate Intent target: Funds from operations (FFO), ratio.<br />
Funds generated from operations as a ratio of interest cost. Target: higher than or equal to 2.5.<br />
TARGET 100%<br />
10 20 30 40 50 60 70 80 90 100<br />
<strong>2012</strong> SCORE<br />
100%<br />
The funds from operations (FFO) to interest cover ratio for the year ending 30 June <strong>2012</strong> was 3.22, higher than the budget<br />
figure of 2.94 and the required target at a minimum of 2.50. Cost savings achieved during the year led to lower than budgeted<br />
operating expenses and more than offset the reduced revenues arising from lower than projected water volumes. Interest<br />
expense was also significantly below budget, due to a combination of lower than budgeted new borrowings and a lower than<br />
projected cost of funds.<br />
2008 2009 2010 2011<br />
40% 100% 100% 100%<br />
8b. Percentage performance against target: savings through efficient procurement.<br />
Target: achieve efficiency savings outcomes.<br />
TARGET 100%<br />
<strong>2012</strong> SCORE<br />
Establish<br />
spend<br />
categories<br />
for benchmarking<br />
and<br />
reporting<br />
Develop and<br />
implement<br />
a category<br />
review plan<br />
Develop<br />
procurement<br />
systems<br />
for market<br />
review<br />
Implement<br />
process for<br />
reviewing<br />
and monitoring<br />
preferred<br />
suppliers<br />
Achieve savings<br />
of 0.5%<br />
of operating<br />
expenditure<br />
Adopt a<br />
procurement<br />
policy for use<br />
of preferred<br />
suppliers<br />
Achieve savings<br />
of 1%<br />
of operating<br />
expenditure<br />
Achieve savings<br />
of 1.5%<br />
of operating<br />
expenditure<br />
Achieve savings<br />
of 2%<br />
of operating<br />
expenditure<br />
Implement<br />
procurement<br />
planning<br />
process<br />
98%<br />
2008 2009 2010 2011<br />
65% 90% 95% 95%<br />
In total, savings of $3.5 million were achieved in 2011/12 exceeding the target of $3 million. All of Government Agreements<br />
delivered significant savings in IT, office consumables and fleet purchases. All of Government Agreements are centralised<br />
contracts for the supply of selected common goods and services purchased across government agencies. Other significant<br />
savings were achieved in the chemical category, bio-solids disposal and meter reading services. All other targets were achieved<br />
with the exception of implementing a procurement planning process which will be formalised in <strong>2012</strong>.<br />
8c. Percentage performance against target: interest rate percentage.<br />
Target: Treasury benchmark of 5.52%.<br />
TARGET 100%<br />
10 20 30 40 50 60 70 80 90 100<br />
<strong>2012</strong> SCORE<br />
99%<br />
<strong>Watercare</strong> locks-in long-term interest rate cover to provide certainty over future funding costs. This makes it difficult to achieve<br />
performance against a short term benchmark. Despite this, the company’s actual weighted average interest rate excluding<br />
credit margins and fees at 5.57 per cent was only marginally above the 5.52 per cent benchmark.<br />
2008 2009 2010 2011<br />
100% 90% 50% 100%<br />
8d. Percentage performance against target: actual operating expense.<br />
Percentage performance against budget. Target: 5% below budget.<br />
TARGET 100%<br />
10 20 30 40 50 60 70 80 90 100<br />
<strong>2012</strong> SCORE<br />
90%<br />
<strong>Watercare</strong> is required to minimise operating costs and seeks to achieve actual operating expenses of at least 5% below budget.<br />
For 2011/12, the company achieved an actual operating expense that was 4% below budget as a result of labour cost savings,<br />
lower asset operating costs and reduced other costs including professional fees and general overheads.<br />
2008 2009 2010 2011<br />
75% 75% 95% 100%<br />
PAGE 60 sound financial management
<strong>Watercare</strong> Services Limited<br />
<strong>2012</strong> ANNUAL REPORT<br />
<strong>Watercare</strong> at work<br />
Laboratory team anticipating<br />
strong future growth<br />
<strong>Watercare</strong>’s Laboratory<br />
Services team comprises<br />
over 80 people and is<br />
poised for further growth.<br />
<strong>Watercare</strong>’s Laboratory Services business<br />
has recently completed a significant<br />
expansion programme and is poised<br />
for further growth during the next five<br />
years. The company operates a stateof-the-art<br />
laboratory facility in Mangere<br />
which specialises in providing water and<br />
environmental testing services – as well<br />
as air quality monitoring expertise – both<br />
internally to <strong>Watercare</strong> operational teams,<br />
and externally to corporate clients which<br />
include industrial companies, regulatory<br />
authorities and government agencies.<br />
<strong>Watercare</strong> recently completed a major<br />
expansion of the laboratory operation’s<br />
organic chemistry department, and has also<br />
introduced new Labware software which<br />
provides a platform for future growth and<br />
will allow the laboratory team to better<br />
meet clients’ needs. The laboratory employs<br />
more than 80 people and is made up of<br />
six analytical departments: microbiology;<br />
inorganic chemistry; organic chemistry;<br />
general chemistry; air quality; and<br />
sampling logistics.<br />
<strong>Watercare</strong>’s Commercial Services Manager<br />
Ian Shand says the Laboratory Services team<br />
carries out 870,000 analyses on over<br />
102,000 samples each year, as well as<br />
continuously monitoring air quality for<br />
clients at a number of sites throughout<br />
New Zealand. “Recently we’ve been doing a<br />
considerable amount of work with clients to<br />
provide specialised testing services in the<br />
areas of National Environmental Standards<br />
(NES) monitoring, odour and wastewater<br />
analysis, large roading projects and<br />
industrial discharge monitoring”. Ian adds<br />
that the Auckland laboratory currently<br />
tests drinking water for over one third of<br />
New Zealand’s population, and is one of the<br />
few laboratories in the country that is<br />
accredited for water sampling services.<br />
“We’re proud of what we’ve achieved<br />
already, and we’re preparing for further<br />
significant growth in the future.”<br />
Ian says that the Mangere laboratory<br />
operates 365 days per year, and that<br />
business continuity is of utmost importance<br />
to the laboratory operation’s clients.<br />
<strong>Watercare</strong> has invested in emergency<br />
back-up facilities which include a power<br />
generator, a water reservoir and off-site<br />
emergency laboratories.<br />
sound financial management PAGE 61
<strong>Watercare</strong> Services Limited<br />
<strong>2012</strong> ANNUAL REPORT<br />
Environmental<br />
Resources<br />
Management<br />
ERM Independent Assurance <strong>Report</strong> to <strong>Watercare</strong> Services Limited<br />
ERM New Zealand Limited (ERM) was engaged by <strong>Watercare</strong> Services Limited (<strong>Watercare</strong>) to provide independent assurance of selected non-financial data contained<br />
within <strong>Watercare</strong>’s <strong>2012</strong> <strong>Annual</strong> <strong>Report</strong>, to the scope of work outlined below.<br />
Our Brief<br />
We were asked to provide external independent assurance as to whether the material data and disclosures contained within the following sections of the<br />
<strong>Watercare</strong> <strong>2012</strong> <strong>Annual</strong> <strong>Report</strong> were appropriately reported:<br />
• Performance Rulers relating to: Safe & Reliable Water Supply; Healthy Waterways; Health, Safety and Wellbeing; Customer Satisfaction; Stakeholder Relations;<br />
Sustainable Development; and Effective Asset Management.<br />
• Data contained within the ‘Sustainability Impacts of Company Activity’ section.<br />
• Global <strong>Report</strong>ing Initiative (GRI) G3 Application Level A+ requirements.<br />
The scope excluded data and statements relating to financial information as well as data that had been assured in 2011 and not changed for the <strong>2012</strong> <strong>Annual</strong> <strong>Report</strong>.<br />
Data reported within the <strong>2012</strong> Statement of Service Performance and duplicated within the <strong>2012</strong> Performance Rulers detailed above have been assured by<br />
<strong>Watercare</strong>’s financial auditors and have consequently also been excluded from the scope of ERM’s assurance.<br />
Our Approach<br />
We delivered our work in accordance with ERM’s assurance methodology, which is based on the following international assurance and audit standards: ISAE 3000,<br />
ISO14064-3, and ISO 19011.<br />
We planned and performed our work to obtain all the relevant information and explanations that we believe were necessary to gather sufficient evidence to provide<br />
a basis for our assurance conclusions as to whether the reported information and data set out in the ‘Our Brief’ were appropriately reported i.e. that nothing has come<br />
to our attention through the course of our work that the data are materially mis-reported (limited assurance).<br />
Our assurance activities included:<br />
• Face-to-face interviews at corporate level to understand and test the processes in place for reporting non-financial data and underlying data management system.<br />
This was followed up with a review of relevant documentation;<br />
• Review of the presentation of information relevant to the scope of our work in the report to ensure consistency with our findings.<br />
Respective Responsibilities and ERM’s Independence<br />
<strong>Watercare</strong> was responsible for preparing the <strong>2012</strong> <strong>Annual</strong> <strong>Report</strong>, including the collection and presentation of data and statements within it. The ERM team, led by<br />
Tracey Ryan, Managing Partner, ERM New Zealand, was responsible for expressing assurance conclusions in line with the scope of work agreed with <strong>Watercare</strong>.<br />
During 2011/12, ERM did not work with <strong>Watercare</strong> on other consulting engagements.<br />
Our Conclusion<br />
On the basis of its scope of work, and in consideration of the assurance engagement brief and approach presented above, ERM concludes that in all<br />
material respects, the above selected sustainability performance data for 2011-12 are appropriately presented in the report. The report also adheres<br />
to the GRI G3 Application Level A+.<br />
Key Findings<br />
Based on the scope of work, and without affecting our assurance conclusion, ERM identified the following key findings:<br />
• The recruitment of a dedicated Sustainability Manager during the reporting year demonstrates <strong>Watercare</strong>’s on-going commitment to corporate sustainability as well<br />
as to addressing the key operational issue of user demand management.<br />
• A large portion of the mechanisms used to gather data used within the <strong>Annual</strong> <strong>Report</strong> are integrated electronic systems that help to minimise the potential for<br />
data inaccuracies and calculation/transposition errors. While we are satisfied with the final data presentations, we have discussed with management potential<br />
improvements to the process for compiling data tables in the annual report.<br />
ERM congratulates <strong>Watercare</strong> on its <strong>2012</strong> <strong>Annual</strong> <strong>Report</strong>.<br />
ERM New Zealand Ltd,<br />
20 August <strong>2012</strong>,<br />
Auckland, New Zealand<br />
ERM New Zealand Limited (ERM) is an independent global provider of environmental, social and corporate responsibility consulting and assurance services. ERM has prepared this statement for<br />
<strong>Watercare</strong> Services Limited in accordance with ERM’s standard terms and the standard practised by members of the environmental consulting profession performing this type of service at the same<br />
time. No other warranty, express or implied, is given by ERM as a result of the provision of this statement. To the extent permitted by law, this statement is provided for informational purposes<br />
only, without the right to rely, and ERM will not be liable for any reliance which may be placed on this statement by a third party. This statement may not be used by any third party without ERM’s<br />
express written permission.<br />
PAGE 62 vErification report
<strong>Watercare</strong> Services Limited<br />
<strong>2012</strong> ANNUAL REPORT<br />
Financial<br />
report<br />
<strong>2012</strong><br />
Contents<br />
<strong>Watercare</strong>’s Rain Forest<br />
Express railway continues<br />
to be a hugely popular<br />
attraction for both tourists<br />
and Auckland families.<br />
Historical financial summary<br />
and key statistics 64<br />
Financial commentary 66<br />
Responsibility for the financial statements<br />
and statement of service performance 71<br />
<strong>Report</strong> of the Auditor-General 72<br />
Financial statements<br />
Statement of Comprehensive Income 74<br />
Statement of Financial Position 75<br />
Statement of Cash Flows 76<br />
Statement of Changes in Equity 77<br />
Statement of Comprehensive Income<br />
by business unit 78<br />
Statement of Financial Position<br />
by business unit 79<br />
Statement of Cash Flows by business unit 79<br />
Statement of Accounting Policies 80<br />
Notes to the financial statements<br />
1. Revenue 85<br />
2. Price adjustment 85<br />
3. Operating expenses 86<br />
4. Depreciation and amortisation 86<br />
5. Finance costs 86<br />
6. Revaluation of derivative<br />
financial instruments 87<br />
7. Operating cash flows 87<br />
8. Income tax expense 88<br />
9. Deferred tax liability 89<br />
10. Issued capital 89<br />
11. Subsidiaries and Integration<br />
of retail business 90<br />
12. Revaluation reserves 92<br />
13. Property, plant and equipment 94<br />
14. Intangible assets 97<br />
15. Inventories 99<br />
16. Trade and other receivables 99<br />
17. Prepaid expenses 99<br />
18. Trade and other payables 99<br />
19. Accrued expenses 100<br />
20. Provisions 100<br />
21. Borrowings 101<br />
22. Financial assets and liabilities 103<br />
23. Related parties 109<br />
24. Commitments 110<br />
25. Contingencies 111<br />
26. Retirement benefit plans 111<br />
27. Remuneration 111<br />
28. Events occurring after balance date 111<br />
Statutory information<br />
Employees’ remuneration range 112<br />
2011 Statement of Service Performance<br />
Environmental care 113<br />
Health, safety and well-being 113<br />
Stakeholder relationships 113<br />
Customer service commitment 114<br />
Asset management 114<br />
Economic performance 114<br />
Customer services performance 115<br />
G3 cross-reference table 116<br />
Index 120<br />
Glossary 120<br />
<strong>2012</strong> financial report PAGE 63
<strong>Watercare</strong> Services Limited<br />
<strong>2012</strong> ANNUAL REPORT<br />
Historical financial summary and key statistics<br />
AS AT 30 June <strong>2012</strong><br />
2003 2004 2005* 2006 2007 2008 2009 2010 2011 <strong>2012</strong><br />
$000 $000 $000 $000 $000 $000 $000 $000 $000 $000<br />
FINANCIAL PERFORMANCE<br />
Operating revenue 163,627 165,240 166,628 167,899 168,983 167,345 184,629 198,116 373,107 441,950<br />
Price adjustment – (15,711) (10,000) – – – – – – –<br />
Operating expenses 137,628 133,470 137,713 144,070 159,196 165,763 170,427 189,002 361,273 436,998<br />
Operating surplus before: 25,999 16,059 18,915 23,829 9,787 1,582 14,202 9,114 11,834 4,952<br />
Loss on disposal and provision<br />
for redundant property,<br />
plant and equipment and<br />
other restructuring costs (3,287) (3,102) (3,254) (1,026) (7,719) (4,793) (11,589) (6,140) (6,162) (8,517)<br />
Contributions towards cost<br />
of constructing property,<br />
plant and equipment ** – – – 610 3,790 1,428 259 1,111 – –<br />
Revaluation of derivative<br />
financial instruments – – (2,673) 2,561 3,021 (3,222) (16,599) (20,483) (13,567) (60,618)<br />
Decommissioning of<br />
oxidation ponds (2,770) – – – – – – – – –<br />
Operating surplus/(deficit)<br />
before tax 19,942 12,957 12,988 25,974 8,879 (5,005) (13,727) (16,398) (7,895) (64,183)<br />
Current tax 1,611 2,478 (25) 2,079 (28) – – – – –<br />
Deferred tax 10,516 8,508 4,303 7,909 3,639 (2,208) (3,363) 11,311 4,438 (18,878)<br />
Net surplus/(deficit) after tax 7,815 1,971 8,710 15,986 5,268 (2,797) (10,364) (27,709) (12,333) (45,305)<br />
FINANCIAL POSITION<br />
Non-current assets<br />
Property, plant and equipment 1,569,273 1,571,546 1,585,453 1,959,687 1,977,280 2,025,034 2,357,369 2,413,113 7,688,196 7,730,309<br />
Intangibles *** – – – 13,539 18,429 18,844 16,375 14,374 30,229 39,554<br />
Investments 14,425 15,714 17,456 – – – – – – –<br />
Derivative financial instruments – – – – – 5,579 12,220 5,284 12,285 23,609<br />
Inventories 2,022 1,921 1,821 2,378 2,797 2,640 2,599 3,237 3,040 2,637<br />
Prepaid expenses – – – – – – – – – 24,033<br />
1,585,720 1,589,181 1,604,730 1,975,604 1,998,506 2,052,097 2,388,563 2,436,008 7,733,750 7,820,142<br />
Current assets 18,823 19,823 18,121 33,535 35,491 19,414 114,101 34,782 87,586 78,744<br />
Total assets 1,604,543 1,609,004 1,622,851 2,009,139 2,033,997 2,071,511 2,502,664 2,470,790 7,821,336 7,898,886<br />
Non-current liabilities<br />
Borrowings 229,000 129,000 200,000 200,000 200,000 200,000 350,000 416,500 987,604 1,063,910<br />
Deferred tax liability 31,167 39,675 256,090 377,656 347,502 342,348 420,666 402,049 848,828 829,950<br />
Derivative financial instruments – – – – – 4,460 27,725 40,298 59,110 133,336<br />
Payables, provisions and accruals 10,864 9,420 972 926 1,194 880 966 1,053 10,492 10,304<br />
271,031 178,095 457,062 578,582 548,696 547,688 799,357 859,900 1,906,034 2,037,500<br />
Current liabilities<br />
Bank overdraft – 458 44 148 132 111 – 446 558 –<br />
Borrowings 130,293 241,954 175,713 161,505 174,174 207,349 204,560 109,225 241,295 232,156<br />
Payables, provisions,<br />
accruals and derivative<br />
financial instruments 29,590 25,835 29,760 23,149 26,179 41,219 47,796 48,606 92,054 92,921<br />
159,883 268,247 205,517 184,802 200,485 248,679 252,356 158,277 333,907 325,077<br />
Total liabilities 430,914 446,342 662,579 763,384 749,181 796,367 1,051,713 1,018,177 2,239,941 2,362,577<br />
PAGE 64 <strong>2012</strong> financial report
<strong>Watercare</strong> Services Limited<br />
<strong>2012</strong> ANNUAL REPORT<br />
Historical financial summary and key statistics (continued)<br />
AS AT 30 June <strong>2012</strong><br />
2003 2004 2005* 2006 2007 2008 2009 2010 2011 <strong>2012</strong><br />
$000 $000 $000 $000 $000 $000 $000 $000 $000 $000<br />
Equity<br />
Issued capital 260,693 260,693 260,693 260,693 260,693 260,693 260,693 260,693 260,693 260,693<br />
Revaluation reserves 863,754 848,488 575,826 843,712 873,086 862,745 1,043,205 1,071,655 1,429,619 1,424,231<br />
Retained earnings 49,182 53,481 123,753 141,350 151,037 151,706 147,053 120,265 111,972 72,274<br />
Capital reserve – – – – – – – – 3,779,111 3,779,111<br />
Total equity 1,173,629 1,162,662 960,272 1,245,755 1,284,816 1,275,144 1,450,951 1,452,613 5,581,395 5,536,309<br />
Total funds employed 1,604,543 1,609,004 1,622,851 2,009,139 2,033,997 2,071,511 2,502,664 2,470,790 7,821,336 7,898,886<br />
CASH FLOW SUMMARY<br />
Net cash flows – operating 60,131 54,669 65,627 66,777 70,370 59,208 81,297 74,624 176,035 163,394<br />
Net cash flows – investing (46,349) (66,854) (69,972) (52,673) (83,023) (92,362) (138,387) (126,245) (192,231) (229,173)<br />
Net cash flows – financing (13,601) 11,661 4,759 (14,208) 12,669 33,175 57,411 50,965 16,116 67,167<br />
Net change in cash flows 181 (524) 414 (104) 16 21 321 (656) (80) 1,388<br />
Bank/(overdraft) at start of year (115) 66 (458) (44) (148) (132) (111) 210 (446) (526)<br />
Bank/(overdraft) at end of year 66 (458) (44) (148) (132) (111) 210 (446) (526) 862<br />
KEY STATISTICS<br />
Debt to capitalisation (book value) 23% 23% 27% 22% 23% 24% 28% 27% 18% 19%<br />
Debt to capitalisation (historical cost) 53% 53% 48% 47% 48% 50% 58% 58% 23% 24%<br />
Funds flow from operations<br />
to interest ratio 3.9 3.6 3.5 3.7 3.6 2.9 2.9 2.9 3.3 3.2<br />
EBITDA total interest ratio 4.0 3.7 3.5 3.7 3.6 2.9 2.9 2.9 3.3 3.2<br />
EBITDA interest expense ratio 4.2 3.9 3.8 3.8 3.7 3.4 3.9 3.5 3.5 3.5<br />
Total liabilities to total assets 27% 28% 41% 38% 37% 38% 42% 41% 29% 30%<br />
Secured liabilities to total assets 2% 2% 2% 0% 0% 0% 0% 0% 0% 0%<br />
Return on average equity 0.8% 0.2% 0.8% 1.5% 0.4% (0.2%) (0.8%) (2.0%) (0.4%) (0.8%)<br />
Economic value added/<br />
(deducted) ($000) (75,237) (109,876) (93,980) (99,499) (123,577) (130,737) (128,769) (134,659) (278,348) (412,816)<br />
Capital expenditure ($000) 42,810 66,209 70,651 64,489 86,416 120,174 129,860 123,324 (191,943) (234,670)<br />
Number of employees 352 335 329 343 363 363 381 387 611 645<br />
* The company adopted NZ IFRS with effect from 1 July 2005 and has restated the comparative information for the year ended 30 June 2005 in accordance<br />
with NZ IFRS.<br />
** Contributions towards cost of constructing property, plant and equipment is included in operating revenue from 2011 financial year.<br />
*** Intangibles have been disclosed separately from the June 2006 financial year onwards.<br />
<strong>2012</strong> financial report PAGE 65
<strong>Watercare</strong> Services Limited<br />
<strong>2012</strong> ANNUAL REPORT<br />
FINANCIAL COMMENTARY<br />
The financial result for the year was highlighted by an operating surplus from trading operations of $5.0 million compared with a budgeted<br />
operating deficit of $4.4 million.<br />
The reported operating surplus was prior to the adjustment for the unfavourable revaluation of derivative instruments of $60.6 million and the<br />
loss on disposal of fixed assets and other restructuring costs of $8.5 million. The resulting net deficit after tax of $45.3 million was compared with<br />
a budgeted net deficit of $3.2 million. (2011 – Net deficit after tax of $12.3 million).<br />
KEY POINTS<br />
• Revenue was 2.6% below budget primarily due to the effect of lower water volumes and lower infrastructure growth charges.<br />
• Total expenses including operating expenses, depreciation and interest expense were 4.6% lower than budget for the financial year.<br />
• Under NZ IFRS, the company revalues its interest rate swaps and forward foreign exchange contracts to fair value. This revaluation resulted<br />
in a decrease in current year operating surplus from trading operations by $60.6 million (2011 – decrease in operating surplus from trading<br />
operations by $13.6 million).<br />
• The company recorded a loss disposal of fixed assets of $8.4 million being primarily the write-down of assets that were replaced during<br />
the year and some residual cleanup of assets inherited through integration. Other restructuring costs of $0.1 million contribute to the total<br />
unbudgeted costs of $8.5 million.<br />
• On 19 September 2011, Standard & Poor’s upgraded its corporate credit ratings on <strong>Watercare</strong> Services Limited. The long-term rating was<br />
raised to ‘AA-’ from ‘A’ and the short-term rating was raised to ‘A-1+’ from ‘A-1’. As at 30 June <strong>2012</strong>, the outlook on these ratings was stable.<br />
The credit ratings on <strong>Watercare</strong> debt guaranteed by Auckland Council remained unchanged at ‘AA’ long-term and ‘A-1+’ short-term.<br />
• A $125 million medium-term note issue was completed in two tranches, of $75 million in October 2011 and $50 million in December 2011.<br />
The notes carry a coupon interest rate of 5.685% and are due to mature on 26 October 2018. The proceeds were used to refinance existing<br />
debt and fund capital expenditure requirements over the remainder of 2011/12.<br />
• No price adjustment was paid in the <strong>2012</strong> year (2011 – $nil).<br />
• On 1 November 2010 the company acquired the water and wastewater businesses conducted by Metrowater Limited, Manukau Water<br />
Limited, North Shore City Council, Waitakere City Council, Rodney District Council and Franklin District Council in accordance with the Local<br />
Government (Tamaki Makaurau Reorganisation) Act 2009, the Local Government (Auckland Council) Act 2009 and the Local Government<br />
(Auckland Transitional Provisions) Act 2010. The company has provided total water and wastewater services to the Auckland region since<br />
1 November 2010.<br />
• This financial commentary includes the budget for the <strong>2012</strong> year and notes on significant variances. Comparisons are also provided to last<br />
year being a period where <strong>Watercare</strong> provided retail water and wastewater services for eight months in the financial year, the period since<br />
integration on 1 November 2010. As a result, revenue and costs were higher in the 30 June <strong>2012</strong> financial year as <strong>Watercare</strong> has provided<br />
retail water and wastewater services for the full 12 months.<br />
STATEMENT OF COMPREHENSIVE INCOME<br />
For the year ended 30 June <strong>2012</strong><br />
Total Comprehensive income<br />
<strong>2012</strong> <strong>2012</strong> 2011 2013<br />
Actual Budget Actual Budget<br />
$000 $000 $000 $000<br />
Operating surplus (deficit) from trading operations 4,952 (4,415) 11,834 357<br />
Loss on disposal and provision for redundant property,<br />
plant and equipment and other restructuring costs (8,517) – (6,162) –<br />
Loss on revaluation of derivative financial instruments (60,618) – (13,567) –<br />
Operating (deficit) surplus before tax (64,183) (4,415) (7,895) 357<br />
Deferred tax 18,878 1,236 (4,438) (100)<br />
Net (deficit) after tax (45,305) (3,179) (12,333) 257<br />
Asset revaluation, net of tax – – 361,873 –<br />
Total comprehensive income for the year, net of tax (45,305) (3,179) 349,540 257<br />
The operating surplus from trading of $5.0 million was favourable compared with the budgeted operating deficit of $4.4 million primarily due to<br />
favourable variances in interest expense, depreciation and operating expenses. These were partially offset by the unfavourable variance<br />
in revenue.<br />
Total comprehensive income (deficit) for the year of ($45.3 million) after tax, compared with budgeted comprehensive income (deficit) of<br />
($3.2 million) after tax, represents an unfavourable variance of $42.1 million. This primarily reflects the negative revaluation of financial<br />
instruments of $60.6 million and the loss on disposal of assets and other restructuring costs of $8.5 million.<br />
PAGE 66 <strong>2012</strong> financial report
<strong>Watercare</strong> Services Limited<br />
<strong>2012</strong> ANNUAL REPORT<br />
FINANCIAL COMMENTARY (continued)<br />
Revenue<br />
<strong>2012</strong> <strong>2012</strong> <strong>2012</strong> 2011 2013<br />
Actual Budget Variance to<br />
Actual<br />
Budget<br />
$000 $000<br />
Budget<br />
$000 $000<br />
Water 129,543 137,676 (5.9%) 131,438 137,930<br />
Wastewater 263,624 262,360 0.5% 203,773 271,540<br />
Trade waste 12,462 12,510 (0.4%) 14,038 13,318<br />
Other 36,321 41,206 (11.9%) 23,858 36,774<br />
Operating revenue 441,950 453,752 (2.6%) 373,107 459,563<br />
Water revenue was $129.6 million for the year, 5.9% lower than the budget of $137.7 million due to lower than expected water sales volumes as<br />
a result of the wet summer.<br />
Wastewater revenue was $263.6 million for the year, 0.5% higher than the budget of $262.4 million.<br />
Trade waste revenue was $12.5 million for the year and was less than the budget by 0.4%.<br />
Other revenue was $36.3 million for the year and was 11.9% below budget primarily due to lower infrastructure growth charges as a result of<br />
less developer activity.<br />
Price adjustment<br />
<strong>2012</strong> <strong>2012</strong> <strong>2012</strong> 2011 2013<br />
Actual Budget Variance to<br />
Actual<br />
Budget<br />
$000 $000<br />
Budget<br />
$000 $000<br />
Water – – – – –<br />
Wastewater – – – – –<br />
Trade waste – – – – –<br />
– – – – –<br />
Price adjustments are unbudgeted discretionary payments. The Directors determine the amount, and the distribution between customer groups,<br />
after having regard to the financial position of the company and future expenditure requirements. The Directors decided that no price adjustment<br />
would be made for <strong>2012</strong> (2011 – $Nil).<br />
Operating expenses<br />
<strong>2012</strong> <strong>2012</strong> <strong>2012</strong> 2011 2013<br />
Actual Budget Variance to<br />
Actual<br />
Budget<br />
$000 $000<br />
Budget<br />
$000 $000<br />
Water 71,542 75,441 5.2% 63,529 72,526<br />
Wastewater 113,048 116,912 3.3% 93,011 123,862<br />
Total expenses 184,590 192,353 4.0% 156,540 196,387<br />
Operating expenses were $7.8 million or 4.0% lower than budget for the year primarily due to savings in net labour, asset operating costs,<br />
professional services and general overheads. These favourable variances were partially offset by higher than budgeted expenditure in<br />
maintenance costs.<br />
Operating expenses in the water business unit were $3.9 million or 5.2% lower than budget. The savings were primarily due to lower chemicals<br />
and energy costs as a result of lower demand. Labour costs were lower than budget due to vacancies and reduced over time and callouts across<br />
the region. Additionally savings were achieved in professional services and overheads including lower travel and training costs. The saving were<br />
partially offset by higher than budgeted maintenance costs, in particular, reactive jobs in the retail network.<br />
Operating expenses in the wastewater business unit were $3.8 million or 3.3% lower than budget. The savings were primarily due to lower asset<br />
operating costs as a result of lower treatment costs of biosolids and savings on services at the Mangere Treatment Plant. Labour costs were lower<br />
than budget due primarily to vacancies and lower overtime. Additionally savings were achieved in professional services due to the rescheduling<br />
of planning studies. Savings in overheads included lower training, travel and subscriptions costs. The savings were partially offset by higher than<br />
budgeted maintenance costs including repairs to the reactor blowers and engines at the Mangere Treatment Plant.<br />
<strong>2012</strong> financial report PAGE 67
<strong>Watercare</strong> Services Limited<br />
<strong>2012</strong> ANNUAL REPORT<br />
FINANCIAL COMMENTARY (continued)<br />
Depreciation and Amortisation<br />
<strong>2012</strong> <strong>2012</strong> <strong>2012</strong> 2011 2013<br />
Actual Budget Variance to<br />
Actual<br />
Budget<br />
$000 $000<br />
Budget<br />
$000 $000<br />
Water 80,070 82,730 3.2% 71,106 77,052<br />
Wastewater 99,752 100,950 1.2% 72,520 100,662<br />
179,822 183,680 2.1% 143,626 177,715<br />
Depreciation and amortisation for <strong>2012</strong> was 2.1% below budget primarily due to the actual impact of the asset revaluation of 30 June 2011 on<br />
depreciation being less than was estimated at the time of the budget preparation.<br />
Finance costs<br />
<strong>2012</strong> <strong>2012</strong> <strong>2012</strong> 2011 2013<br />
Actual Budget Variance to<br />
Actual<br />
Budget<br />
$000 $000<br />
Budget<br />
$000 $000<br />
Water<br />
Paid and payable 3,618 3,249 (11.4%) 27,899 7,700<br />
Capitalised on asset construction (2,990) (3,022) (1.1%) (1,998) (4,467)<br />
628 227 (176.7%) 25,901 3,233<br />
Wastewater<br />
Paid and payable 75,587 85,753 11.9% 37,922 84,369<br />
Capitalised on asset construction (3,629) (3,846) (5.6%) (2,716) (2,499)<br />
71,958 81,907 12.1% 35,206 81,870<br />
Total<br />
Paid and payable 79,205 89,002 11.0% 65,821 92,069<br />
Capitalised on asset construction (6,619) (6,868) (3.6%) (4,714) (6,966)<br />
72,586 82,134 11.6% 61,107 85,103<br />
Total finance costs of $72.6 million were 11.6% below budget. The lower interest costs were primarily due to lower interest rates being achieved<br />
than budgeted. The amount of interest being capitalised to capital projects of $6.6 million was 3.6% below budget.<br />
Tax<br />
<strong>2012</strong> <strong>2012</strong> <strong>2012</strong> 2011 2013<br />
Actual Budget Variance to<br />
Actual<br />
Budget<br />
$000 $000<br />
Budget<br />
$000 $000<br />
Current tax – – – – –<br />
Deferred tax 18,878 (1,236) N/A 4,438 100<br />
18,878 (1,236) N/A 4,438 100<br />
No tax was payable on the trading result for the year.<br />
PAGE 68 <strong>2012</strong> financial report
<strong>Watercare</strong> Services Limited<br />
<strong>2012</strong> ANNUAL REPORT<br />
FINANCIAL COMMENTARY (continued)<br />
Statement of Financial Position<br />
As at 30 June <strong>2012</strong><br />
The company was in a strong financial position with net equity of $5.5 billion at year-end. The net equity decreased by $45.1 million from<br />
30 June 2011 due mainly to the reported net deficit after tax for the year.<br />
Property, plant and equipment<br />
<strong>2012</strong> <strong>2012</strong> <strong>2012</strong> 2011 2013<br />
Actual Budget Variance to<br />
Actual<br />
Budget<br />
$000 $000<br />
Budget<br />
$000 $000<br />
Water 3,259,783 3,234,411 0.8% 3,188,117 3,533,469<br />
Wastewater 4,470,526 4,519,687 (1.1%) 4,500,079 4,743,700<br />
7,730,309 7,754,098 (0.3%) 7,688,196 8,277,169<br />
The analysis by business group for the movements in property, plant and equipment for <strong>2012</strong> is:<br />
Water Wastewater Total<br />
$000 $000 $000<br />
Net additions, integration and other movements 149,222 65,410 214,632<br />
Asset revaluation (impairment) (before tax) (1,625) (1,182) (2,807)<br />
Depreciation (75,931) (93,781) (169,712)<br />
71,666 (29,553) 42,113<br />
The increase for property, plant and equipment was a result of planned spend on capital projects during the financial year. Significant capital<br />
expenditure projects in the year included work on the new Hunua Number 4 trunk watermain, expansion of the Waikato Treatment Plant and the<br />
Northern Waitakere wastewater servicing project.<br />
Intangible assets<br />
<strong>2012</strong> <strong>2012</strong> <strong>2012</strong> 2011 2013<br />
Actual Budget Variance to<br />
Actual<br />
Budget<br />
$000 $000<br />
Budget<br />
$000 $000<br />
Water 14,150 9,166 54.4% 14,207 13,060<br />
Wastewater 25,404 16,457 54.4% 16,022 23,446<br />
39,554 25,623 54.4% 30,229 36,506<br />
The increase in intangible assets during the year reflects the completion of the new information systems including the implementation of SAP.<br />
Borrowings<br />
<strong>2012</strong> <strong>2012</strong> <strong>2012</strong> 2011 2013<br />
Actual Budget Variance to<br />
Actual<br />
Budget<br />
$000 $000<br />
Budget<br />
$000 $000<br />
1,296,066 1,295,314 (0.1%) 1,228,899 1,385,704<br />
Borrowings at year-end were 0.1% or $0.7 million higher than budget. Borrowings include commercial paper of $129.1 million, $13.5 million<br />
drawn under a revolving credit facility, related party loans of $476.8 million, medium term notes of $526.6 million and a bank loan of<br />
$150 million.<br />
Deferred tax liability<br />
<strong>2012</strong> <strong>2012</strong> <strong>2012</strong> 2011 2013<br />
Actual Budget Variance to<br />
Actual<br />
Budget<br />
$000 $000<br />
Budget<br />
$000 $000<br />
829,950 849,704 (2.3%) 848,828 960,521<br />
The deferred tax liability primarily comprises temporary differences between the revalued property, plant and equipment and the values<br />
recognised for tax purposes plus differences in the company’s depreciation rates and those permitted by the Inland Revenue Department.<br />
At 30 June <strong>2012</strong>, deferred taxation was lower than budget, principally due to the deferred tax effect of the revaluation of derivative financial<br />
instruments during the year.<br />
<strong>2012</strong> financial report PAGE 69
<strong>Watercare</strong> Services Limited<br />
<strong>2012</strong> ANNUAL REPORT<br />
FINANCIAL COMMENTARY (continued)<br />
STATEMENT OF CASH FLOWS<br />
For the year ended 30 June <strong>2012</strong><br />
No price adjustment was paid to customers during the financial year to 30 June <strong>2012</strong>. As such, all of the company’s cash flow from operations<br />
was available for either capital expenditure or debt repayment. Borrowings increased as a result of the shortfall between operating cash flows<br />
and capital expenditure.<br />
Net cash flows from operating activities<br />
<strong>2012</strong> <strong>2012</strong> <strong>2012</strong> 2011 2013<br />
Actual Budget Variance to<br />
Actual<br />
Budget<br />
$000 $000<br />
Budget<br />
$000 $000<br />
163,394 182,237 (10.3%) 176,035 197,213<br />
Net operating cash flows at $163.4 million were 10.3% lower than budget for <strong>2012</strong>. This was due to operating cashflows including the payment<br />
of $23.9 million for the lease of land on Puketutu Island. This payment was budgeted for in the 2011 financial year capital expenditure budget.<br />
The lease has however, been classified as an operating lease under NZ IAS 17 and the $23.9 million as a prepayment of an operating expense.<br />
Net cash flows from investing activities<br />
<strong>2012</strong> <strong>2012</strong> <strong>2012</strong> 2011 2013<br />
Actual Budget Variance to<br />
Actual<br />
Budget<br />
$000 $000<br />
Budget<br />
$000 $000<br />
(229,173) (240,907) 4.9% (192,231) (292,766)<br />
The net cash flow from investing activities was 4.9% lower than budget due to minor delays in some wastewater and operations capital<br />
expenditure projects.<br />
Net cash flows from financing activities<br />
<strong>2012</strong> <strong>2012</strong> <strong>2012</strong> 2011 2013<br />
Actual Budget Variance to<br />
Actual<br />
Budget<br />
$000 $000<br />
Budget<br />
$000 $000<br />
67,167 58,670 14.5% 16,116 95,554<br />
The net cash flow from financing activities shows a net increase in borrowing in <strong>2012</strong> from the prior year. The increase in debt resulted from the<br />
higher level of capital expenditure relative to the operating cash flows.<br />
The audited financial statements are set out on pages 74 to 111.<br />
PAGE 70 <strong>2012</strong> financial report
<strong>Watercare</strong> Services Limited<br />
<strong>2012</strong> ANNUAL REPORT<br />
RESPONSIBILITY FOR THE FINANCIAL STATEMENTS<br />
AND STATEMENT OF SERVICE PERFORMANCE<br />
Financial Statements<br />
We have ensured that the financial statements fairly reflect the financial position of the company as at 30 June <strong>2012</strong> and its financial<br />
performance and cash flows for the year ended on that date.<br />
We have ensured that the accounting policies used by the company accord with New Zealand Equivalents to International Financial<br />
<strong>Report</strong>ing Standards. This includes the early adoption of accounting standards issued by the New Zealand Institute of Chartered<br />
Accountants, to the extent that they do not conflict with an existing accounting standard and the information is available.<br />
We believe proper accounting records have been kept, enabling the financial position of the company to be determined and that the<br />
financial statements fully comply with the Financial <strong>Report</strong>ing Act 1993.<br />
We consider adequate steps have been taken to safeguard the assets of the company and to prevent and detect fraud and<br />
other irregularities.<br />
Statement of Service Performance<br />
We are responsible for establishing a Statement of Corporate Intent, which sets targets and other measures by which the company’s<br />
performance can be judged in relation to its objectives.<br />
We consider the results reported in the statement of service performance fairly reflect the achievements for the year ended 30 June <strong>2012</strong>.<br />
We have pleasure in presenting the financial statements and the statement of service performance for <strong>Watercare</strong> Services Limited for the<br />
year ended 30 June <strong>2012</strong>, which were approved and authorised for release on 23 August <strong>2012</strong>.<br />
For and on behalf of management:<br />
K M Ford<br />
Chief Executive<br />
B T Monk<br />
Chief Financial Officer<br />
For the Board:<br />
R B Keenan<br />
Chairman<br />
D J Clarke<br />
deputy Chairman<br />
M N Allen P S Drummond C J Harland<br />
Director Director Director<br />
S M Huria A G Lanigan J G Todd<br />
Director Director Director<br />
<strong>2012</strong> financial report PAGE 71
<strong>Watercare</strong> Services Limited<br />
<strong>2012</strong> ANNUAL REPORT<br />
INDEPENDENT AUDITOR’S REPORT<br />
TO THE READERS OF WATERCARE SERVICES LIMITED AND GROUP’S FINANCIAL STATEMENTS<br />
AND STATEMENT OF SERVICE PERFORMANCE FOR THE YEAR ENDED 30 JUNE <strong>2012</strong><br />
The Auditor-General is the auditor of <strong>Watercare</strong> Services Limited (the company) and group. The Auditor-General has appointed me, Jamie<br />
Schmidt, using the staff and resources of Deloitte, to carry out the audit of the financial statements and statement of service performance of the<br />
company and group on her behalf.<br />
We have audited:<br />
• the financial statements of the company and group on pages 74 to 111, that comprise the statements of financial position as at 30 June <strong>2012</strong>,<br />
the statements of comprehensive income, statements of changes in equity and statements of cash flows for the year ended on that date and<br />
the notes to the financial statements that include accounting policies and other explanatory information; and<br />
• the statement of service performance of the company and group on pages 113 to 115.<br />
Opinion on the financial statements and the statement of service performance<br />
In our opinion,<br />
• the financial statements of the company and group on pages 74 to 111:<br />
– comply with generally accepted accounting practice in New Zealand;<br />
– give a true and fair view of the company and group’s:<br />
- financial position as at 30 June <strong>2012</strong>; and<br />
- financial performance and cash flows for the year ended on that date; and<br />
• the statement of service performance of the company and group on pages 113 to 115:<br />
– complies with generally accepted accounting practice in New Zealand; and<br />
– gives a true and fair view of the company’s service performance achievements measured against the performance targets adopted<br />
for the year ended 30 June <strong>2012</strong>.<br />
Opinion on other legal requirements<br />
In accordance with the Financial <strong>Report</strong>ing Act 1993 we report that, in our opinion, proper accounting records have been kept by the company<br />
and group as far as appears from an examination of those records.<br />
Our audit was completed on 23 August <strong>2012</strong>. This is the date at which our opinion is expressed.<br />
The basis of our opinion is explained below. In addition, we outline the responsibilities of the Board of Directors and our responsibilities, and<br />
explain our independence.<br />
Basis of opinion<br />
We carried out our audit in accordance with the Auditor-General’s Auditing Standards, which incorporate the International Standards on Auditing<br />
(New Zealand). Those standards require that we comply with ethical requirements and plan and carry out our audit to obtain reasonable<br />
assurance about whether the financial statements and statement of service performance are free from material misstatement.<br />
Material misstatements are differences or omissions of amounts and disclosures that would affect a reader’s overall understanding of the<br />
financial statements and statement of service performance. If we had found material misstatements that were not corrected, we would have<br />
referred to them in our opinion.<br />
An audit involves carrying out procedures to obtain audit evidence about the amounts and disclosures in the financial statements and statement<br />
of service performance. The procedures selected depend on our judgement, including our assessment of risks of material misstatement of the<br />
financial statements and statement of service performance whether due to fraud or error.<br />
In making those risk assessments, we consider internal control relevant to the preparation of the company and group’s financial statements and<br />
statement of service performance that give a true and fair view of the matters to which they relate.<br />
We consider internal control in order to design audit procedures that are appropriate in the circumstances but not for the purpose of expressing<br />
an opinion on the effectiveness of the company and group’s internal control.<br />
An audit also involves evaluating:<br />
• the appropriateness of accounting policies used and whether they have been consistently applied;<br />
• the reasonableness of the significant accounting estimates and judgements made by the Board of Directors;<br />
• the adequacy of all disclosures in the financial statements and statement of service performance; and<br />
• the overall presentation of the financial statements and statement of service performance.<br />
We did not examine every transaction, nor do we guarantee complete accuracy of the financial statements and statement of service performance.<br />
In accordance with the Financial <strong>Report</strong>ing Act 1993, we report that we have obtained all the information and explanations we have required. We<br />
believe we have obtained sufficient and appropriate audit evidence to provide a basis for our audit opinion.<br />
PAGE 72 <strong>2012</strong> financial report
<strong>Watercare</strong> Services Limited<br />
<strong>2012</strong> ANNUAL REPORT<br />
Responsibilities of the Board of Directors<br />
The Board of Directors is responsible for preparing financial statements and a statement of service performance that:<br />
• comply with generally accepted accounting practice in New Zealand;<br />
• give a true and fair view of the company and group’s financial position, financial performance and cash flows; and<br />
• give a true and fair view of the company and group’s service performance.<br />
The Board of Directors is also responsible for such internal control as it determines is necessary to enable the preparation of financial statements<br />
and a statement of service performance that are free from material misstatement, whether due to fraud or error.<br />
The Board of Directors’ responsibilities arise from the Local Government (Auckland Transitional Provisions) Act 2010 and the<br />
Financial <strong>Report</strong>ing Act 1993.<br />
Responsibilities of the Auditor<br />
We are responsible for expressing an independent opinion on the financial statements and statement of service performance and reporting that<br />
opinion to you based on our audit. Our responsibility arises from section 15 of the Public Audit Act 2001 and section 22 of the Local Government<br />
(Auckland Transitional Provisions) Act 2010.<br />
Independence<br />
When carrying out the audit, we followed the independence requirements of the Auditor-General, which incorporate the independence<br />
requirements of the New Zealand Institute of Chartered Accountants.<br />
Other than the audit and the provision of tax services and review of financial information systems, which are compatible with those<br />
independence requirements, we have no relationship with or interests in the company or any of its subsidiaries.<br />
Jamie Schmidt<br />
Deloitte<br />
On behalf of the Auditor-General<br />
Auckland, New Zealand<br />
Matters relating to the electronic presentation of the audited financial statements and statement of service performance<br />
This audit report relates to the financial statements and statement of service performance of <strong>Watercare</strong> Services Limited (“<strong>Watercare</strong>”) for the year ended 30 June<br />
<strong>2012</strong> included on the <strong>Watercare</strong> website. <strong>Watercare</strong>’s Board of Directors is responsible for the maintenance and integrity of <strong>Watercare</strong>’s website. We have not been<br />
engaged to report on the integrity of <strong>Watercare</strong>’s website. We accept no responsibility for any changes that may have occurred to the financial statements and<br />
statement of service performance since they were initially presented on the website.<br />
The audit report refers only to the financial statements and statement of service performance named above. It does not provide an opinion on any other information<br />
which may have been hyperlinked to or from the financial statements and statement of service performance. If readers of this report are concerned with the<br />
inherent risks arising from electronic data communication they should refer to the published hard copy of the audited financial statements and statement of service<br />
performance and the related audit report dated 23 August <strong>2012</strong> to confirm the information included in the audited financial statements and statement of service<br />
performance presented on this website.<br />
Legislation in New Zealand governing the preparation and dissemination of financial information may differ from legislation in other jurisdictions.<br />
<strong>2012</strong> financial report PAGE 73
<strong>Watercare</strong> Services Limited<br />
<strong>2012</strong> ANNUAL REPORT<br />
Statement of Comprehensive Income<br />
for the year ended 30 June <strong>2012</strong><br />
<strong>2012</strong> 2011<br />
Group and Company Group and Company<br />
Notes $000 $000<br />
Revenue Note 1, page 85 441,950 373,107<br />
Total revenue 441,950 373,107<br />
Operating expenses<br />
Asset operating costs (73,523) (56,070)<br />
Maintenance costs (38,143) (39,012)<br />
Employee benefit expenses (38,948) (27,659)<br />
Other expenses (33,976) (33,799)<br />
Total operating expenses Note 3, page 86 (184,590) (156,540)<br />
Depreciation and amortisation Note 4, page 86 (179,822) (143,626)<br />
Finance costs Note 5, page 86 (72,586) (61,107)<br />
Total expenses (436,998) (361,273)<br />
Operating surplus from trading operations 4,952 11,834<br />
Loss on disposal and provision for redundant property,<br />
plant and equipment and other restructuring costs (8,517) (6,162)<br />
Loss on revaluation of derivative financial instruments Note 6, page 87 (60,618) (13,567)<br />
Operating deficit before tax (64,183) (7,895)<br />
Income tax benefit/(expense)<br />
Deferred tax Note 8, page 88 18,878 (4,438)<br />
Income tax benefit/(expense) 18,878 (4,438)<br />
Net deficit for the year (45,305) (12,333)<br />
Other comprehensive income net of tax<br />
Gain on revaluation of property, plant and equipment and adjustments Note 12, page 92 – 361,873<br />
Other comprehensive income for the year, net of tax – 361,873<br />
Total comprehensive income for the year, net of tax (45,305) 349,540<br />
The financial statements should be read in conjunction with the accounting policies and notes on pages 80 to 111.<br />
PAGE 74 <strong>2012</strong> financial report
<strong>Watercare</strong> Services Limited<br />
<strong>2012</strong> ANNUAL REPORT<br />
Statement of FINANCIAL POSITION<br />
AS AT 30 June <strong>2012</strong><br />
<strong>2012</strong> 2011<br />
Group and Company Group and Company<br />
Notes $000 $000<br />
ASSETS<br />
Current<br />
cash and cash equivalents 862 32<br />
Trade and other receivables Note 16, page 99 71,590 79,508<br />
Prepaid expenses Note 17, page 99 3,473 3,401<br />
Inventories Note 15, page 99 2,793 4,092<br />
Derivative financial instruments Note 22, page 103 26 553<br />
total current assets 78,744 87,586<br />
Non-current<br />
Prepaid expenses Note 17, page 99 24,033 –<br />
Inventories Note 15, page 99 2,637 3,040<br />
Derivative financial instruments Note 22, page 103 23,609 12,285<br />
Intangible assets Note 14, page 97 39,554 30,229<br />
Property, plant and equipment Note 13, page 95 7,730,309 7,688,196<br />
Total non-current assets 7,820,142 7,733,750<br />
Total assets 7,898,886 7,821,336<br />
EQUITY & LIABILITIES<br />
Current<br />
Bank overdraft – 558<br />
Trade and other payables Note 18, page 99 24,484 16,157<br />
Accrued expenses Note 19, page 100 61,834 67,927<br />
Provisions Note 20, page 100 6,241 4,796<br />
Borrowings Note 21, page 101 232,156 241,295<br />
Derivative financial instruments Note 22, page 103 362 3,174<br />
total current liabilities 325,077 333,907<br />
Non-current<br />
Accrued expenses Note 19, page 100 8,840 9,100<br />
Provisions Note 20, page 100 1,464 1,392<br />
Borrowings Note 21, page 101 1,063,910 987,604<br />
Derivative financial instruments Note 22, page 103 133,336 59,110<br />
Deferred tax liability Note 9, page 89 829,950 848,828<br />
Total non-current liabilities 2,037,500 1,906,034<br />
Total liabilities 2,362,577 2,239,941<br />
EQUITY ATTRIBUTABLE TO OWNERS OF THE PARENT<br />
retained earnings 72,274 111,972<br />
Revaluation reserves Note 12, page 92 1,424,231 1,429,619<br />
Capital reserve Note 11, page 91 3,779,111 3,779,111<br />
Issued capital Note 10, page 89 260,693 260,693<br />
Total equity 5,536,309 5,581,395<br />
Total equity and liabilities 7,898,886 7,821,336<br />
The financial statements should be read in conjunction with the accounting policies and notes on pages 80 to 111.<br />
<strong>2012</strong> financial report PAGE 75
<strong>Watercare</strong> Services Limited<br />
<strong>2012</strong> ANNUAL REPORT<br />
Statement of Cash flows<br />
for the year ended 30 June <strong>2012</strong><br />
<strong>2012</strong> 2011<br />
Group and Company Group and Company<br />
Notes $000 $000<br />
OPERATING ACTIVITIES<br />
Cash was provided from:<br />
Receipts from customers 445,197 384,722<br />
Dividends received 91 34<br />
Interest received 753 1,041<br />
446,041 385,797<br />
Cash was applied to:<br />
Employees and suppliers (208,941) (153,203)<br />
Finance costs paid (73,706) (56,559)<br />
(282,647) (209,762)<br />
Net cash flows – operating activities Note 7, page 87 163,394 176,035<br />
INVESTING ACTIVITIES<br />
Cash was provided from:<br />
Cash acquired from Manukau Water Limited Note 11, page 91 – 11,953<br />
Cash acquired from <strong>Watercare</strong> Harbour Clean-Up Trust Note 11, page 90 220 –<br />
Sale of property, plant and equipment and intangibles 86 70<br />
306 12,023<br />
Cash was applied to:<br />
Purchase and construction of property, plant and equipment and intangibles (222,860) (193,935)<br />
Interest capitalised on construction of property, plant and equipment<br />
and intangibles Note 5, page 86 (6,619) (4,714)<br />
Bank overdraft acquired from Metrowater Limited Note 11, page 91 – (5,605)<br />
(229,479) (204,254)<br />
Net cash flows – investing activities (229,173) (192,231)<br />
FINANCING ACTIVITIES<br />
Cash was provided from:<br />
Short-term deposits – 15,000<br />
Proceeds from medium-term notes issue (net) 76,649 150,000<br />
Proceeds from bank term loan facility 50,000 –<br />
Commercial paper issued (net) 4,976 24,916<br />
Revolving credit facility (net) 2,000 –<br />
133,625 189,916<br />
Cash was applied to:<br />
Revolving credit facility (net) – (5,000)<br />
Repay loan from Auckland Council – related party Note 23, page 109 (66,458) (168,800)<br />
(66,458) (173,800)<br />
Net cash flows – financing activities 67,167 16,116<br />
Net change in cash flows 1,388 (80)<br />
Cash and cash equivalents at the beginning of year (526) (446)<br />
Cash and cash equivalents at the end of year 862 (526)<br />
Cash and cash equivalents comprises:<br />
Bank balances 577 32<br />
Short term deposits maturing within three months 285 –<br />
Bank overdraft – (558)<br />
862 (526)<br />
The financial statements should be read in conjunction with the accounting policies and notes on pages 80 to 111.<br />
PAGE 76 <strong>2012</strong> financial report
<strong>Watercare</strong> Services Limited<br />
<strong>2012</strong> ANNUAL REPORT<br />
Statement of Changes in equity<br />
for the year ended 30 June <strong>2012</strong><br />
Issued<br />
capital<br />
Revaluation<br />
reserves<br />
<strong>2012</strong><br />
Group and Company<br />
Retained<br />
earnings<br />
Capital<br />
reserve<br />
Notes $000 $000 $000 $000 $000<br />
Total<br />
Balance at 1 July 2011 260,693 1,429,619 111,972 3,779,111 5,581,395<br />
Comprehensive income<br />
Net deficit for the year – – (45,305) – (45,305)<br />
Other comprehensive income<br />
Transfer to retained earnings on disposal<br />
of property, plant and equipment Note 12, page 92 – (5,388) 5,388 – –<br />
Total comprehensive income<br />
for the year, net of tax – (5,388) (39,917) – (45,305)<br />
Transactions with owners<br />
<strong>Watercare</strong> Harbour Clean-up Trust acquired<br />
control at the beginning of year Note 11, page 90 – – 219 – 219<br />
Total transactions with owners – – 219 – 219<br />
Balance at 30 June <strong>2012</strong> 260,693 1,424,231 72,274 3,779,111 5,536,309<br />
2011<br />
Group and Company<br />
Issued<br />
capital<br />
Revaluation<br />
reserves<br />
Retained<br />
earnings<br />
Capital<br />
reserve<br />
Total<br />
Notes $000 $000 $000 $000 $000<br />
Balance at 1 July 2010 260,693 1,071,655 120,265 – 1,452,613<br />
Comprehensive income<br />
Net deficit for the year – – (12,333) – (12,333)<br />
Other comprehensive income<br />
Gain on revaluation of property,<br />
plant and equipment Note 12, page 92 – 361,873 – – 361,873<br />
Transfer to retained earnings on disposal<br />
of property, plant and equipment Note 12, page 92 – (3,909) 3,909 – –<br />
Total comprehensive income<br />
for the year, net of tax – 357,964 (8,424) – 349,540<br />
Transactions with owners<br />
Capital reserve on business integration – – – 3,779,111 3,779,111<br />
Metrowater Community Trust<br />
acquired on integration – – 131 – 131<br />
Total transactions with owners Note 11, page 92 – – 131 3,779,111 3,779,242<br />
Balance at 30 June 2011 260,693 1,429,619 111,972 3,779,111 5,581,395<br />
The financial statements should be read in conjunction with the accounting policies and notes on pages 80 to 111.<br />
<strong>2012</strong> financial report PAGE 77
<strong>Watercare</strong> Services Limited<br />
<strong>2012</strong> ANNUAL REPORT<br />
STATEMENT OF COMPREHENSIVE INCOME BY BUSINESS UNIT<br />
for the year ended 30 June <strong>2012</strong><br />
<strong>2012</strong> <strong>2012</strong> <strong>2012</strong> 2011 2011 2011<br />
Group and Company<br />
Group and Company<br />
Water Wastewater Total Water Wastewater Total<br />
$000 $000 $000 $000 $000 $000<br />
Revenue<br />
Water and wastewater 129,543 263,624 393,167 131,438 203,773 335,211<br />
Trade waste – 12,462 12,462 – 14,038 14,038<br />
Other revenue 20,348 15,973 36,321 9,066 14,792 23,858<br />
Total revenue 149,891 292,059 441,950 140,504 232,603 373,107<br />
Operating expenses<br />
Asset operating costs (26,534) (46,989) (73,523) (19,577) (36,493) (56,070)<br />
Maintenance costs (19,485) (18,658) (38,143) (18,361) (20,651) (39,012)<br />
Employee benefit expenses (13,708) (25,240) (38,948) (12,386) (15,273) (27,659)<br />
Other expenses (11,815) (22,161) (33,976) (13,205) (20,594) (33,799)<br />
Total operating expenses (71,542) (113,048) (184,590) (63,529) (93,011) (156,540)<br />
Depreciation and amortisation (80,070) (99,752) (179,822) (71,106) (72,520) (143,626)<br />
Finance costs (628) (71,958) (72,586) (25,901) (35,206) (61,107)<br />
Total expenses (152,240) (284,758) (436,998) (160,536) (200,737) (361,273)<br />
Operating (deficit)/surplus<br />
from trading operations (2,349) 7,301 4,952 (20,032) 31,866 11,834<br />
Loss on disposal and provision for redundant<br />
property, plant and equipment and other<br />
restructuring costs (4,808) (3,709) (8,517) (3,215) (2,947) (6,162)<br />
Loss on revaluation of derivative<br />
financial instruments (2,070) (58,548) (60,618) (5,191) (8,376) (13,567)<br />
Operating (deficit)/surplus before tax (9,227) (54,956) (64,183) (28,438) 20,543 (7,895)<br />
Income tax benefit/(expense)<br />
Deferred tax 2,714 16,164 18,878 (1,686) (2,752) (4,438)<br />
Income tax benefit/(expense) 2,714 16,164 18,878 (1,686) (2,752) (4,438)<br />
Net (deficit)/surplus for the year (6,513) (38,792) (45,305) (30,124) 17,791 (12,333)<br />
Other comprehensive income net of tax<br />
Gain on revaluation and impairment of property,<br />
plant and equipment and adjustments – – – 137,512 224,361 361,873<br />
Other comprehensive income for the year, net of tax – – – 137,512 224,361 361,873<br />
Total comprehensive income for the year, net of tax (6,513) (38,792) (45,305) 107,388 242,152 349,540<br />
The financial statements should be read in conjunction with the accounting policies and notes on pages 80 to 111.<br />
PAGE 78 <strong>2012</strong> financial report
<strong>Watercare</strong> Services Limited<br />
<strong>2012</strong> ANNUAL REPORT<br />
STATEMENT OF FINANCIAL POSITION BY BUSINESS UNIT<br />
AS AT 30 June <strong>2012</strong><br />
<strong>2012</strong> <strong>2012</strong> <strong>2012</strong> 2011 2011 2011<br />
Group and Company<br />
Group and Company<br />
Water Wastewater Total Water Wastewater Total<br />
$000 $000 $000 $000 $000 $000<br />
ASSETS<br />
Current<br />
Current assets 38,517 40,227 78,744 40,722 46,864 87,586<br />
Total current assets 38,517 40,227 78,744 40,722 46,864 87,586<br />
Non-current<br />
Prepaid expenses 25 24,008 24,033 – – –<br />
Inventories 133 2,504 2,637 635 2,405 3,040<br />
Derivative financial instruments 1,079 22,530 23,609 5,429 6,856 12,285<br />
Intangibles 14,150 25,404 39,554 14,207 16,022 30,229<br />
Property, plant and equipment 3,259,783 4,470,526 7,730,309 3,188,117 4,500,079 7,688,196<br />
Total non-current assets 3,275,170 4,544,972 7,820,142 3,208,388 4,525,362 7,733,750<br />
Total assets 3,313,687 4,585,199 7,898,886 3,249,110 4,572,226 7,821,336<br />
LIABILITIES<br />
Current<br />
Current liabilities 47,927 277,150 325,077 143,791 190,116 333,907<br />
Total current liabilities 47,927 277,150 325,077 143,791 190,116 333,907<br />
Non-current<br />
Accrued expenses 4,226 4,614 8,840 4,368 4,732 9,100<br />
Provisions 482 982 1,464 524 868 1,392<br />
Borrowings 48,602 1,015,308 1,063,910 436,205 551,399 987,604<br />
Derivative financial instruments 6,091 127,245 133,336 26,126 32,984 59,110<br />
Deferred tax liability 273,457 556,493 829,950 319,452 529,376 848,828<br />
Total non-current liabilities 332,858 1,704,642 2,037,500 786,675 1,119,359 1,906,034<br />
Total liabilities 380,785 1,981,792 2,362,577 930,466 1,309,475 2,239,941<br />
Equity attributable to owners of the parent 2,932,902 2,603,407 5,536,309 2,318,644 3,262,751 5,581,395<br />
Total equity and liabilities 3,313,687 4,585,199 7,898,886 3,249,110 4,572,226 7,821,336<br />
STATEMENT OF CASH FLOWS BY BUSINESS UNIT<br />
FOR THE YEAR ENDED 30 June <strong>2012</strong><br />
<strong>2012</strong> <strong>2012</strong> <strong>2012</strong> 2011 2011 2011<br />
Group and Company<br />
Group and Company<br />
Water Wastewater Total Water Wastewater Total<br />
$000 $000 $000 $000 $000 $000<br />
Net cash flows – operating activities 74,540 88,854 163,394 59,305 116,730 176,035<br />
Net cash flows – investing activities (120,501) (108,672) (229,173) (79,978) (112,253) (192,231)<br />
Net cash flows – financing activities 27,108 40,059 67,167 7,118 8,998 16,116<br />
Net change in cash flows (18,853) 20,241 1,388 (13,555) 13,475 (80)<br />
The financial statements should be read in conjunction with the accounting policies and notes on pages 80 to 111.<br />
<strong>2012</strong> financial report PAGE 79
<strong>Watercare</strong> Services Limited<br />
<strong>2012</strong> ANNUAL REPORT<br />
STATEMENT OF ACCOUNTING POLICIES<br />
FOR THE YEAR ENDED 30 JUNE <strong>2012</strong><br />
REPORTING ENTITY<br />
The financial statements are for <strong>Watercare</strong> Services Limited, a council organisation wholly owned by Auckland Council, as defined in the Local Government Act<br />
2002 incorporated and domiciled in New Zealand. The consolidated financial statements of the group are for the economic entity of <strong>Watercare</strong> Services Limited<br />
and its subsidiaries. Separate financial statements of the parent are not presented in these financial statements as the subsidiary financial statements are<br />
immaterial to the consolidated group, as detailed in Note 11, page 90.<br />
During the prior year, on 1 November 2010, as the result of the Auckland Council reorganisation, <strong>Watercare</strong> Services Limited integrated the water and<br />
wastewater businesses of Metrowater Limited, Manukau Water Limited, North Shore City Council, Waitakere City Council, Rodney District Council, Papakura<br />
District Council and Franklin District Council, in accordance with the Local Government (Tamaki Makaurau Reorganisation) Act 2009, the Local Government<br />
(Auckland Council) Act 2009 and the Local Government (Auckland Transitional Provisions) Act 2010. Consequently, <strong>Watercare</strong> Services Limited provides total<br />
water and wastewater services to the Auckland region (except Papakura).<br />
The group’s registered office and principal place of business is at 2 Nuffield Street, Newmarket, Auckland 1023.<br />
STATEMENT OF COMPLIANCE<br />
<strong>Watercare</strong> Services Limited is a public benefit entity (PBE) as defined under the New Zealand Equivalents to International Financial <strong>Report</strong>ing Standards (NZ IFRS).<br />
The financial statements and accounting policies comply with the specific recognition, measurement and disclosure requirements of NZ IFRS in relation to PBEs<br />
and New Zealand Generally Accepted Accounting Practice (NZGAAP).<br />
STATUTORY BASE<br />
<strong>Watercare</strong> Services Limited is a group registered under the Companies Act 1993 and is a reporting entity as defined by the Financial <strong>Report</strong>ing Act 1993. The<br />
financial statements have been prepared in accordance with the requirements of the Financial <strong>Report</strong>ing Act 1993, the Local Government Acts 1974 and 2002,<br />
Local Government (Auckland Transitional Provisions) Act 2010 and the Companies Act 1993.<br />
MEASUREMENT BASE<br />
The financial statements have been prepared on the historical cost basis, modified by the revaluation of land and buildings, certain infrastructural assets and<br />
derivative instruments as described in specific accounting policies below.<br />
FUNCTIONAL AND PRESENTATION CURRENCY<br />
The financial statements are prepared in New Zealand dollars and all values are rounded to the nearest thousand, unless otherwise stated.<br />
KEY MANAGEMENT DECISIONS<br />
The key areas where management has exercised its judgement in the preparation of these financial statements are as explained below:<br />
There are a number of assumptions and estimates used when performing depreciated replacement cost valuations of infrastructure assets. For example,<br />
estimates are made determining the remaining useful life over which an asset will be depreciated, replacement costs for assets and capitalised interest. In<br />
respect of estimated useful lives, if the estimated useful lives are not accurate this would lead to the annual depreciation charge being either higher or lower<br />
in the statement of comprehensive income. To minimise the estimation risk of asset useful lives the group continually assesses the condition of infrastructural<br />
assets and their remaining useful lives. Physical inspections and condition assessments are used by the group to ensure that the condition of major assets is<br />
understood and the carrying value of an asset reflects its actual condition. See Note 13, page 94 for additional information.<br />
SIGNIFICANT ACCOUNTING POLICIES<br />
The following specific accounting policies that materially affect the measurement of comprehensive income, financial position and cash flows have been applied<br />
consistently to all periods presented in these financial statements.<br />
1. BUSINESS UNIT REPORTING<br />
Business unit comprehensive income, financial position and cash flows are presented in the financial statements for water and wastewater services,<br />
reflecting the group’s legislative requirements. Revenues and expenses are apportioned to each unit on a direct basis plus an allocation of non-specific and<br />
overhead costs proportional to each unit’s actual revenues at year end. During the year, debt was reallocated between the business units to better reflect<br />
the returns expected from each unit and the incremental cost of capital. This rebalancing had resulted in an increase as at 1 July 2011 of $100.3 million in<br />
current borrowings, an increase of $410.4 million in non-current borrowings and a decrease of $510.7 million in equity for the Wastewater activity with an<br />
equal and opposite impact for the Water activity. Accordingly, costs directly attributable to debt such as finance costs and loss on revaluation of derivative<br />
instruments have been allocated in proportion to the debt as at balance date in Wastewater and Water activities.<br />
All operations are carried out within New Zealand. There are no material transactions between the two business units.<br />
2. BASIS OF CONSOLIDATION<br />
The purchase method is used to prepare the consolidated financial statements, which involves adding together like items of assets, liabilities, equity,<br />
income and expenses on a line-by-line basis. All significant intragroup balances, transactions, revenues and expenses are eliminated on consolidation.<br />
3. INTEGRATION OF RETAIL BUSINESS<br />
The group has adopted the public benefit entity exemption from NZ IFRS 3 available for local authority reorganisations where no consideration has been<br />
transferred. The group therefore, is not required to measure assets and liabilities at their fair value at acquisition date and no consideration was paid for<br />
the net assets acquired. During the prior year, the net assets acquired were recorded at the accounting book value of the previous local network operators<br />
(deemed cost) in the company’s financial statements and where necessary, adjustments were made to the carrying value of the assets and liabilities being<br />
recognised in the company’s opening balance sheet to achieve consistency in the accounting policies. The contribution value of the net assets has been<br />
recorded separately in the capital reserve. See Note 11, page 91 for additional information.<br />
4. GOODS AND SERVICES TAX (GST)<br />
The statement of comprehensive income and the statement of financial position are stated excluding GST, with the exception of receivables and payables,<br />
which include GST. The net amount of GST recoverable from or payable to the Inland Revenue Department is included as part of receivables or payables in<br />
the statement of financial position.<br />
PAGE 80 <strong>2012</strong> financial report
<strong>Watercare</strong> Services Limited<br />
<strong>2012</strong> ANNUAL REPORT<br />
STATEMENT OF ACCOUNTING POLICIES (continued)<br />
FOR THE YEAR ENDED 30 JUNE <strong>2012</strong><br />
SIGNIFICANT ACCOUNTING POLICIES (continued)<br />
5. OPERATING REVENUE<br />
The group measures revenue at the fair value of the amounts received or receivable, net of returns, trade allowances, duties and taxes paid. It accounts for<br />
revenue for the major activities as follows:<br />
Water and wastewater revenue<br />
Water revenue comprises the amounts received and receivable, including estimated amounts of unread meters at balance date for water supplied to<br />
customers in the ordinary course of business. Wastewater revenue is a combination of fixed charge and a percentage of water used. Both are shown net of<br />
prompt payment discounts and leak remissions.<br />
Provision of services<br />
Sales of services are recognised at fair value of the amounts received or receivable as the services are rendered, or to reflect the percentage completion of<br />
the related services where rendered over time.<br />
Interest income<br />
Interest income is recognised using the effective interest method.<br />
Dividend income<br />
Dividend income is recognised on the date when the group’s right to receive payment is established.<br />
Development contributions, financial contributions and infrastructure growth charge<br />
Development contributions, financial contributions and infrastructure growth charges received towards the construction of property, plant and equipment<br />
are recognised at the time an application is approved.<br />
Vested assets revenue<br />
Vested assets revenue is recognised when control over the assets is obtained.<br />
6. GRANT EXPENDITURE<br />
The company provides funding to its subsidiaries in the form of grants, which is treated as expenditure in the company’s books and as income in the<br />
subsidiaries books. On consolidation this expenditure is offset by the income in the subsidiaries books whilst the actual expenditure is recognised in the<br />
group accounts when the subsidiaries incur the expenditure.<br />
7. FINANCE COSTS<br />
Finance costs directly attributable to the acquisition, construction or production of a qualifying asset that necessarily takes a substantial period of time to<br />
get ready for its intended use or sale are capitalised as part of the cost of that asset. All other finance costs are expensed in the period they occur. Finance<br />
costs consist of interest and other costs that are incurred in connection with the borrowing of funds.<br />
8. BUSINESS INTEGRATION COSTS<br />
Costs associated with planning the integration of the water and the wastewater businesses in the Auckland region were expensed in the period in which<br />
they were incurred, except for related capital projects.<br />
9. LEASES<br />
The group leases certain property, plant and equipment where the lessor effectively retains substantially all the risks and benefits of ownership. Amounts<br />
payable under the terms of these leases are recognised as an expense spread evenly over the term of the lease.<br />
10. RESEARCH AND DEVELOPMENT<br />
Research costs are expensed as incurred. Development expenditure on individual projects is capitalised and recognised as an asset when it meets the<br />
definition and criteria for capitalisation as an asset and it is probable that the group will receive future economic benefits from the asset. Assets which have<br />
finite lives are stated at cost less accumulated amortisation and are amortised on a straight-line basis over their useful lives.<br />
11. PROPERTY, PLANT AND EQUIPMENT<br />
Classes of assets<br />
Property, plant and equipment is allocated to classes, being:<br />
– Land (including improvements)<br />
– Buildings<br />
– Pipelines<br />
– Tanks, tunnels, roads and reservoirs<br />
– Dams<br />
– Machinery<br />
– Motor vehicles<br />
– Office equipment<br />
– Work in progress<br />
Initial recognition<br />
The cost of purchased property, plant and equipment is the initial purchase price plus directly attributable costs of bringing the assets to the location and<br />
condition necessary for their intended use.<br />
Constructed assets are initially recorded as work in progress at the cost of construction (including materials and direct labour), finance costs and other<br />
direct costs until the asset is ready for productive use. Finance costs incurred during the course of construction that are attributable to a project are<br />
capitalised, using the finance rate applicable to the funding. When the asset is ready for productive use the on-going operating and finance costs are<br />
recorded as expenses.<br />
<strong>2012</strong> financial report PAGE 81
<strong>Watercare</strong> Services Limited<br />
<strong>2012</strong> ANNUAL REPORT<br />
STATEMENT OF ACCOUNTING POLICIES (continued)<br />
FOR THE YEAR ENDED 30 JUNE <strong>2012</strong><br />
SIGNIFICANT ACCOUNTING POLICIES (continued)<br />
11. PROPERTY, PLANT AND EQUIPMENT (continued)<br />
Subsequent recognition<br />
Land and buildings are carried at fair values that reflect current market values, which is the amount that would be expected from an orderly sale,<br />
determined by an independent registered valuer at least every three years.<br />
Pipelines, tanks, tunnels, roads, reservoirs, dams and machinery are also carried at fair value, which is deemed to be depreciated replacement cost because<br />
the assets are of a specialised nature. The depreciated replacement costs are determined on the basis of an independent valuation prepared by external<br />
valuers at least every three years.<br />
The revaluation process involves assessing the current replacement cost and remaining useful lives of the specialised property, plant and equipment.<br />
Any property, plant and equipment that has been acquired after the most recent valuation is carried at cost less accumulated depreciation and impairment<br />
until the next revaluation.<br />
Motor vehicles and office equipment are carried at cost less accumulated depreciation. Work in progress is carried at cost.<br />
The changes in the value of each class of property, plant and equipment as a result of the revaluations are recorded in other comprehensive income and<br />
accumulated in a revaluation reserve. The group maintains a revaluation reserve for each class of assets. Where cumulative decreases exceed cumulative<br />
increases in the value of a class of assets, the net amount is recognised as an expense in determining the surplus or deficit for the year. Any revaluation<br />
increase is credited to the asset class revaluation reserve, except to the extent that it reverses a revaluation decrease for the same asset previously charged<br />
as an expense in determining the surplus or deficit for the year. Any accumulated depreciation at the date of the revaluation is transferred to the gross<br />
carrying amount of the asset and the asset cost is restated to the revalued amount.<br />
Impairment<br />
Asset carrying values are reviewed for impairment whenever events or changes in circumstances indicate the carrying amount may not be recoverable.<br />
An impairment loss is recognised if the estimated recoverable amount of an asset is less than its carrying amount. The recoverable amount is the higher of<br />
an asset’s fair value less costs to sell and value in use. For revalued assets, value in use is the depreciated replacement cost for an asset, where the future<br />
economic benefits of the asset are not primarily dependent on the asset’s ability to generate net cash inflows, and where the entity would, if deprived of<br />
the asset, replace its remaining future economic benefits. The value in use for cash-generating assets is the present value of expected future cash flows. If<br />
an asset’s carrying amount exceeds its recoverable amount, the asset is impaired and the carrying amount is written down to the recoverable amount.<br />
For revalued assets, the impairment loss is recognised in other comprehensive income to the extent that the impairment loss does not exceed the amount<br />
in the revaluation surplus for that same class of asset. The reversal of an impairment loss on a revalued asset is credited to the revaluation reserve.<br />
However, to the extent that an impairment loss on the same class of asset was previously recognised within surplus or deficit, a reversal of that impairment<br />
loss is also recognised within surplus or deficit. For assets not carried at a revalued amount the total impairment loss and the reversal of an impairment loss<br />
(for assets other than goodwill) is recognised in the surplus or deficit.<br />
Depreciation<br />
Depreciation is provided on a straight-line basis on all property, plant and equipment, other than freehold land, at rates calculated to allocate their cost or<br />
revalued amounts over their estimated useful lives. Assets are depreciated to a nil residual value.<br />
for <strong>2012</strong> <strong>2012</strong> 2011<br />
Asset class Range of useful lives in years Average useful life in years<br />
Buildings 10 to 109 62 65<br />
Pipelines 2 to 399 109 113<br />
tanks, tunnels, roads and reservoirs 3 to 200 79 79<br />
dams 3 to 200 185 189<br />
machinery 1 to 200 49 44<br />
motor vehicles 1 to 8 6 4<br />
Office equipment 1 to 20 7 5<br />
12. INTANGIBLE ASSETS<br />
Computer software assets and network models are recorded at cost less accumulated amortisation and accumulated impairment losses. Amortisation is<br />
charged on a straight-line basis over their estimated useful lives.<br />
Easements are recognised at cost, being the costs directly attributable in bringing the asset to its intended use. Easements have an indefinite useful life and<br />
are not amortised, but are instead tested for impairment annually.<br />
Resource Management Act consents are recorded at cost less accumulated amortisation and accumulated impairment losses. Amortisation is charged on a<br />
straight-line basis, over the term of the consent.<br />
Intangible assets’ carrying values are reviewed at the end of each year to determine whether there is any indication that those assets have suffered an<br />
impairment loss. If any impairment loss has occurred, the carrying value of the asset is adjusted and the loss recognised in determining the surplus or<br />
deficit for the year.<br />
for <strong>2012</strong> <strong>2012</strong> 2011<br />
Asset class Range of useful lives in years Average useful life in years<br />
Network models 1 to 4 4 4<br />
computer software 1 to 10 5 7<br />
resource consents 1 to 39 30 33<br />
PAGE 82 <strong>2012</strong> financial report
<strong>Watercare</strong> Services Limited<br />
<strong>2012</strong> ANNUAL REPORT<br />
STATEMENT OF ACCOUNTING POLICIES (continued)<br />
FOR THE YEAR ENDED 30 JUNE <strong>2012</strong><br />
SIGNIFICANT ACCOUNTING POLICIES (continued)<br />
13. INCOME<br />
Current tax<br />
Current tax is calculated by reference to the amount of income taxes payable or recoverable in respect of the taxable profit or loss for the year. Current tax<br />
for current and prior years is recognised as a liability (or asset) to the extent it is unpaid (or refundable).<br />
Deferred tax<br />
Deferred tax is accounted for using the comprehensive balance sheet liability method in respect of temporary differences arising from differences between<br />
the carrying amounts of assets and liabilities in the financial statements and the corresponding tax base of those items.<br />
In principle, deferred tax liabilities are recognised for all temporary differences. Deferred tax assets are recognised to the extent that it is probable that<br />
sufficient taxable amounts will be available against which deductible temporary differences or unused tax losses and tax offsets can be utilised.<br />
Current and deferred tax assets and liabilities are measured at the tax rates that are expected to apply to year(s) when the asset and liability giving rise to<br />
them are realised or settled, based on tax rates (and tax laws) that have been enacted or substantively enacted by the reporting date.<br />
14. INVENTORIES<br />
Inventories comprise consumables, spare parts and treated water.<br />
Consumables are recorded at the lower of cost (determined on a weighted average basis) and net realisable value.<br />
Spare parts are recorded at cost less an adjustment for the reduction in economic benefits due to obsolescence. The cost of spare parts is recorded<br />
as an expense when used for repairs and maintenance on existing plant and equipment, or recorded as part of the cost of the new asset if used in the<br />
construction of new property, plant and equipment.<br />
Treated water in the network and reservoirs is recorded at the lower of cost and net realisable value.<br />
15. PROVISIONS<br />
The group provides for the cost of employees’ entitlements to annual leave, sick leave and gratuities under the terms of their employment contracts. These<br />
amounts are expected to be settled within one year and are therefore recorded in current provisions.<br />
The group provides for the liability for employees’ long service leave under the terms of their employment contracts. The liability is calculated as the<br />
present value of the expected future payments after allowing for wage and salary increases, the rate of staff turnover and term of service with the group.<br />
Long service leave is recorded in current and non-current provisions. The amount recorded in non-current provisions represents the portion which is due<br />
for payment beyond one year from the reporting date.<br />
Other provisions are recognised when the group has a present obligation as a result of a past event and it is probable that there is a future outflow of<br />
resources and the amount of the provision can be reliably measured.<br />
The amount recorded as a provision is the best estimate of the consideration required to settle the obligation at the end of each year.<br />
16. CONTRACT RETENTIONS<br />
Certain construction contracts entitle the group to retain specified amounts to ensure the performance of contract obligations. These retentions are<br />
recorded as a liability, and either used to remedy contract performance or paid to the contractor at the end of the retention period.<br />
17. FOREIGN CURRENCIES<br />
The cost of assets purchased with foreign currencies is calculated using the exchange rate on the date of purchase. Any difference between this cost and<br />
the amount later required to settle the transaction is recognised as a foreign exchange gain or loss.<br />
Operating expenses in foreign currencies are converted at the rate of exchange on the date of the transaction.<br />
18. FINANCIAL INSTRUMENTS<br />
A financial instrument is any contract that gives rise to a financial asset of one entity and a financial liability or equity instrument in another. As such, the<br />
group recognises all its financial instruments as soon as it becomes a party to the contractual provisions of the financial instrument.<br />
At each reporting date the group includes in its statement of financial position a range of financial assets that include cash and short-term deposits, trade<br />
and other receivables, and derivative instruments. Similarly it also reflects in its statement of financial position a number of financial liabilities that include<br />
bank overdrafts, trade and other payables, borrowings and derivative instruments.<br />
A derivative is a financial instrument or other contract that satisfies all of the following characteristics: its value changes in response to the change in a<br />
specified variable such as an interest rate, financial instrument price, commodity price, foreign exchange rate, index of prices or rates, credit rating or credit<br />
index; it requires no initial investment or an initial investment that is smaller than would be required for other types of similar contracts and it will be<br />
settled at some future date.<br />
Sourcing fair values<br />
For financial instruments that are traded in active markets, quoted market prices are used as a measure of fair value. Where quoted market prices do not<br />
exist, fair values are estimated using present value or other market-accepted valuation techniques, using methods and assumptions that are based on<br />
market conditions and risks existing at balance date.<br />
Recognition and measurement of financial assets<br />
Financial assets are initially measured at fair value and for the purpose of subsequent measurement, the group has categorised financial assets into the<br />
following categories. Each category determines the process of subsequent measurement and how the resulting surplus or deficit should be reflected in the<br />
statement of comprehensive income. The group does not currently have financial assets in the held-to-maturity and available-for-sale categories.<br />
Loans and receivables<br />
The group’s cash and cash equivalents and trade and other receivables fall into this category of financial instruments. These are initially recorded at their<br />
fair value plus transaction costs because they have fixed or determinable payments that are not quoted in an active market. Fair value is estimated as the<br />
present value of future cash flows.<br />
<strong>2012</strong> financial report PAGE 83
<strong>Watercare</strong> Services Limited<br />
<strong>2012</strong> ANNUAL REPORT<br />
STATEMENT OF ACCOUNTING POLICIES (continued)<br />
FOR THE YEAR ENDED 30 JUNE <strong>2012</strong><br />
SIGNIFICANT ACCOUNTING POLICIES (continued)<br />
18. FINANCIAL INSTRUMENTS (continued)<br />
Loans and receivables (continued)<br />
After initial recognition, they are recorded at amortised cost using the effective interest method, less provision for impairment. The amount of impairment<br />
loss is the difference between the assets’ carrying amount and the present value of estimated future cash flows, discounted at the original effective interest<br />
rate. The amount of the impairment loss is recognised in determining the surplus or deficit for the year.<br />
The collection of trade receivables is reviewed on an on-going basis and debts known to be uncollectible are written off. When there is objective evidence<br />
that the group will not be able to collect all amounts due according to the original terms of the receivables, a provision is made for doubtful receivables to<br />
recognise impairment in the carrying value of receivables at balance date. This amount provided is recorded in determining surplus or deficit.<br />
Financial assets at fair value through profit or loss<br />
All derivative financial instruments fall into this category, except for those designated as, and effective as, hedging instruments, for which the hedge<br />
accounting requirements apply. The group does not apply hedge accounting.<br />
Financial assets carried at fair value through profit or loss are initially recorded at fair value.<br />
Financial assets can be classified as at fair value through profit or loss only if they are either classified as held for trading or upon initial recognition they are<br />
designated as at fair value through profit and loss. The group does not currently have any financial assets in the categories of held for trading or designated<br />
upon initial recognition as at fair value through profit or loss.<br />
Recognition and measurement of financial liabilities<br />
Financial liabilities are initially recorded at their fair value plus transaction costs.<br />
Financial liabilities are recorded subsequently at amortised cost using the effective interest method, except for financial liabilities held for trading or<br />
designated at fair value through profit or loss. Those liabilities are recorded subsequently at fair value with gains or losses recognised in surplus or deficit.<br />
Trade and other payables represent liabilities for goods and services provided to the group prior to the end of the financial year which are unpaid. The<br />
amounts are unsecured and are usually paid within 30 days of recognition.<br />
The group does not currently have any financial liabilities in the categories of held for trading or designated at fair value through profit or loss.<br />
Borrowings are recorded at fair value, net of transaction costs.<br />
Borrowings are subsequently measured at amortised cost using the effective interest method, with interest expense recognised on an effective interest<br />
basis. Fees and expenses for establishing new borrowings are amortised over the term of those borrowings using the effective interest method. Accrued<br />
interest is presented separately within accruals.<br />
Borrowings are classified as current liabilities unless the group has an unconditional right to defer settlement of the liability for at least 12 months after the<br />
reporting date.<br />
Derivative financial instruments<br />
Derivative instruments are used by the group to manage its exposures to interest rate and foreign currency risks.<br />
Derivative financial instruments are recorded at fair value in the statement of financial position and fair value changes are accounted for through surplus<br />
or deficit.<br />
Derecognition of financial instruments<br />
Financial assets are derecognised only when the contractual rights to the cash flows from the financial asset have expired, or when the financial asset and<br />
all substantial risks and rewards associated with it have been transferred.<br />
Financial liabilities are derecognised when they have either been extinguished, discharged, cancelled or have expired.<br />
19. STATEMENT OF CASH FLOWS<br />
For the purpose of the statement of cash flows, cash and cash equivalents include cash on hand net of outstanding bank overdrafts. The following terms<br />
are used in the statement of cash flows:<br />
– “Operating activities” are amounts received for the supply of services by the group, and payments made to employees and suppliers necessary to<br />
support those services, including finance costs. Operating activities also include any transactions or events that are not investing or financing activities;<br />
– “Investing activities” are amounts paid or received for the acquisition and disposal of property, plant and equipment and other investments not<br />
included in cash equivalents; and<br />
– “Financing activities” are the receipt and repayment of the principal on borrowings, and contributions from, and distributions to, shareholders.<br />
20. INSURANCE<br />
Any uninsured loss is recorded in determining the surplus or deficit for the year in which the loss is incurred. Insurance recoveries are recorded only when<br />
there is virtual certainty of receipt.<br />
21. ACCOUNTING STANDARDS AND INTERPRETATIONs<br />
The External <strong>Report</strong>ing Board (XRB) is currently in the process of establishing a new Accounting Standards Framework based on a multi-sector, reporting<br />
tiers approach. The new accounting standards framework will consist of two sets of accounting standards, one to be applied by entities with a for-profit<br />
objective and the other to be applied by public benefit entities. In the interim, all new New Zealand equivalents to International Financial <strong>Report</strong>ing<br />
Standards (NZ IFRSs) and amendments to existing NZ IFRSs approved in and subsequent to, June 2011 would be applicable to profit-oriented entities only.<br />
This means that the financial reporting requirements for public benefit entities (PBEs) are frozen for the short-term. Consequently, new or amended NZ IFRS<br />
released during the year are not applicable to public benefit entities and hence no disclosure has been made.<br />
CHANGES IN ACCOUNTING POLICIES<br />
There have been no changes in accounting policies during the year.<br />
PAGE 84 <strong>2012</strong> financial report
<strong>Watercare</strong> Services Limited<br />
<strong>2012</strong> ANNUAL REPORT<br />
NOTES TO THE FINANCIAL STATEMENTS<br />
FOR THE YEAR ENDED 30 JUNE <strong>2012</strong><br />
1. REVENUE<br />
The water and wastewater revenue represents the amounts invoiced to customers and the accrual of unbilled water and wastewater revenue. This revenue<br />
excludes any price adjustment (refer Note 2).<br />
<strong>2012</strong> 2011<br />
Group and Company<br />
Group and Company<br />
$000 $000<br />
Revenue from sale of goods<br />
Retail and bulk water 129,543 131,438<br />
Revenue from rendering of services<br />
Wastewater revenue 263,624 203,773<br />
Trade waste revenue 12,462 14,038<br />
Total water and wastewater revenue 405,629 349,249<br />
Water and wastewater revenue is shown net of leak remissions and prompt payment discount (PPD).<br />
Below is a breakdown of leak remission and PPD:<br />
Water and wastewater revenue 398,060 346,358<br />
Leak remission – water (1,968) (689)<br />
Leak remission – wastewater (2,396) (994)<br />
Prompt payment discount – water (356) (4,031)<br />
Prompt payment discount – wastewater (173) (5,433)<br />
Water and wastewater revenue net of remissions and PPD 393,167 335,211<br />
Trade waste revenue 12,462 14,038<br />
Total water and wastewater revenue 405,629 349,249<br />
Other revenue<br />
Infrastructure growth charge 14,012 7,374<br />
Developer and financial contributions 3,389 3,945<br />
New meters and service connections 4,667 2,690<br />
Vested assets revenue 816 –<br />
Other revenue 12,587 9,011<br />
Dividend income 97 34<br />
Interest income 753 804<br />
Total other revenue 36,321 23,858<br />
Total revenue 441,950 373,107<br />
2. PRICE ADJUSTMENT<br />
Section 57(1)(a) of the Local Government (Auckland Council) Act 2009 states that the company must manage its operations efficiently with a view to<br />
keeping the overall costs of water supply and wastewater services to its customers (collectively) at the minimum levels consistent with the effective<br />
conduct of its undertakings and the maintenance of the long-term integrity of its assets.<br />
Further, Section 18(j) of the Local Government (Auckland Transitional Provisions) Act 2010 stipulates that until the year ended 30 June <strong>2012</strong>, the company<br />
must promptly decide, for any year in which a surplus arises, whether or not to return the surplus to its customers; and if it is to return the surplus, decide<br />
on and implement the method by which the surplus may be returned (for example, by way of rebate, discount, or adjustment of charges calculated by<br />
reference to prior or future charges to its customers).<br />
Pursuant to this section the group decided that no price adjustment would be paid for the year ended 30 June <strong>2012</strong> (2011: nil).<br />
<strong>2012</strong> financial report PAGE 85
<strong>Watercare</strong> Services Limited<br />
<strong>2012</strong> ANNUAL REPORT<br />
NOTES TO THE FINANCIAL STATEMENTS (continued)<br />
FOR THE YEAR ENDED 30 JUNE <strong>2012</strong><br />
3. OPERATING EXPENSES<br />
<strong>2012</strong> 2011<br />
Group and Company Group and Company<br />
Notes $000 $000<br />
Operating expenses include:<br />
Auditors’ remuneration – annual audit of the financial statements 508 470<br />
– audit fee relating to integration of retail business – 140<br />
– other services provided 19 208<br />
Directors’ fees Note 27, page 111 484 560<br />
Environmentally significant costs – chemicals 10,360 9,329<br />
– energy 16,556 13,544<br />
Cost of consumables and spare parts consumed 3,209 3,184<br />
(Decrease)/increase in provision for obsolescence of inventory (234) 251<br />
Operating leases and rent 4,245 3,010<br />
Increase in provision for doubtful debts 77 1,313<br />
Bad debts written off 612 30<br />
Salaries and wages – paid to employees 53,763 46,480<br />
– capitalised on construction of property, plant and equipment<br />
or recorded within asset operating costs and maintenance costs (16,748) (20,598)<br />
– included in employee benefit expenses 37,015 25,882<br />
Auditors’ remuneration for other assurance services included the review of financial information systems and assistance on taxation matters. Prior year<br />
other services included the review of financial and information systems.<br />
4. DEPRECIATION AND AMORTISATION<br />
<strong>2012</strong> 2011<br />
Group and Company Group and Company<br />
$000 $000<br />
Buildings 3,621 2,720<br />
Pipelines 109,326 85,941<br />
Tanks, tunnels, roads and reservoirs 10,334 12,984<br />
dams 1,823 1,910<br />
machinery 42,717 31,740<br />
motor vehicles 341 334<br />
Office equipment 1,550 1,447<br />
Network models 1,252 1,109<br />
computer software 8,080 4,693<br />
resource consents 778 748<br />
Total depreciation and amortisation 179,822 143,626<br />
5. FINANCE COSTS<br />
<strong>2012</strong> 2011<br />
Group and Company Group and Company<br />
$000 $000<br />
Interest on bank overdraft and borrowings, paid and payable 79,206 65,821<br />
Capitalised interest on construction of property, plant and equipment (<strong>2012</strong>: 6.60% , 2011: 6.79%) (6,619) (4,714)<br />
Net finance costs 72,586 61,107<br />
PAGE 86 <strong>2012</strong> financial report
<strong>Watercare</strong> Services Limited<br />
<strong>2012</strong> ANNUAL REPORT<br />
NOTES TO THE FINANCIAL STATEMENTS (continued)<br />
FOR THE YEAR ENDED 30 JUNE <strong>2012</strong><br />
6. REVALUATION OF DERIVATIVE FINANCIAL INSTRUMENTS<br />
<strong>2012</strong> 2011<br />
Group and Company Group and Company<br />
$000 $000<br />
Interest rate swaps contracts loss 61,434 12,593<br />
Forward foreign exchange contracts (gain)/loss (816) 974<br />
Net revaluation loss 60,618 13,567<br />
7. OPERATING CASH FLOWS<br />
<strong>2012</strong> 2011<br />
Group and Company Group and Company<br />
$000 $000<br />
Reconciliation of net deficit after tax to net cash flows from operating activities<br />
Net deficit for the year (45,305) (12,333)<br />
Non-cash and non-operating items:<br />
depreciation and amortisation 179,822 143,626<br />
Redundant assets written off and gain or loss on disposal 8,465 2,556<br />
vested assets revenue (816) –<br />
Contributions towards cost of constructing property, plant and equipment (3,389) (3,945)<br />
deferred tax (18,878) 4,438<br />
Movements in working capital:<br />
(Increase)/decrease in assets:<br />
inventories 1,703 (1,556)<br />
trade and other receivables 7,918 16,060<br />
Derivative financial instruments – asset (10,797) (7,393)<br />
Prepaid expenses (24,105) 258<br />
Increase/(decrease) in liabilities:<br />
Trade and other payables and accruals (3,779) 15,860<br />
Derivative financial instruments – liability 71,414 20,960<br />
Payables relating to investing activities – 574<br />
Provisions 1,141 (3,070)<br />
Net cash flows from operating activities 163,394 176,035<br />
<strong>2012</strong> financial report PAGE 87
<strong>Watercare</strong> Services Limited<br />
<strong>2012</strong> ANNUAL REPORT<br />
NOTES TO THE FINANCIAL STATEMENTS (continued)<br />
FOR THE YEAR ENDED 30 JUNE <strong>2012</strong><br />
8. INCOME TAX<br />
<strong>2012</strong> 2011<br />
Group and Company Group and Company<br />
$000 $000<br />
Operating deficit before tax (64,183) (7,895)<br />
Income tax calculated at current rate of 28% (2011: 30%) (17,971) (2,368)<br />
Dividend and other income exempt from taxation (242) (2)<br />
Non deductible expenses 99 377<br />
Imputation credits on dividends received (38) (14)<br />
Prior year and other adjustments (726) (551)<br />
Tax effect of non-deductible items and prior period adjustments (907) (190)<br />
Tax depreciation on buildings acquired on integration being non-deductible from 1 July 2011 – 6,064<br />
Deferred tax as a result of reducing the corporate tax rate from 30% to 28% from 1 July 2011 – 932<br />
Tax effect of non-recurring items – 6,996<br />
Income tax (benefit)/expense (18,878) 4,438<br />
Represented by:<br />
deferred tax (18,878) 4,438<br />
Income tax (benefit)/expense (18,878) 4,438<br />
<strong>2012</strong> 2011<br />
Group and Company Group and Company<br />
Imputation credits $000 $000<br />
Total imputation credits 30,134 30,096<br />
The imputation credit account is a memorandum account and does not form part of the statement of financial position.<br />
PAGE 88 <strong>2012</strong> financial report
<strong>Watercare</strong> Services Limited<br />
<strong>2012</strong> ANNUAL REPORT<br />
NOTES TO THE FINANCIAL STATEMENTS (continued)<br />
FOR THE YEAR ENDED 30 JUNE <strong>2012</strong><br />
9. DEFERRED TAX LIABILITY<br />
<strong>2012</strong> 2011<br />
Group and Company Group and Company<br />
$000 $000<br />
Balance at I July 2011 848,828 402,049<br />
Deferred tax arising on integration recorded in capital reserve – 301,613<br />
Deferred tax recognised in other comprehensive income –<br />
resulting from the revaluation of property, plant and equipment – 140,728<br />
Deferred tax recognised in other comprehensive income, resulting from<br />
transfer to retained earnings relating to disposal of property, plant and equipment 2,095 1,520<br />
Deferred tax recognised in other comprehensive income, resulting from transfer from<br />
revaluation reserve relating to disposal of property, plant and equipment (2,095) (1,520)<br />
Deferred tax recognised in the deficit for the year (18,878) (2,558)<br />
Tax depreciation on buildings acquired on integration being non-deductible from<br />
1 July 2011 – 6,064<br />
Deferred tax on tax losses and property, plant and equipment as a result of the<br />
reduction of the corporate tax rate from 30% to 28% from 1 July 2011<br />
recognised in the deficit for the year – 932<br />
Balance at 30 June <strong>2012</strong> 829,950 848,828<br />
The balance relates to:<br />
Depreciation temporary differences 1,002,921 967,457<br />
Provisions and accrued expenses temporary differences (31,515) (15,652)<br />
tax losses (141,456) (102,977)<br />
Total deferred tax liability 829,950 848,828<br />
The group’s subsidiary <strong>Watercare</strong> Harbour Clean-Up Trust was exempt from tax and the group’s other subsidiaries Auckland City Water Limited and Te Motu<br />
A Hiaroa (Puketutu Island) Park Trust were both non-trading entities. Metrowater Community Trust, a subsidiary of <strong>Watercare</strong> was also exempt from tax and<br />
it was wound up during December 2011.<br />
The depreciation temporary differences for property, plant and equipment arose because the carrying value of property, plant and equipment was higher<br />
for accounting purposes than for taxation purposes, for example due to:<br />
– The revaluation of certain assets; and<br />
– The group’s depreciation rates being lower than those permitted by tax legislation.<br />
The provisions and accrued expenses temporary differences principally related to the mark-to-market revaluation of financial instruments. These expenses<br />
were recognised for accounting purposes but cannot be deducted for tax purposes until the amounts become payable.<br />
During the prior year, under Section 83 of the Local Government (Auckland Transitional Provisions) Act 2010 the company integrated the closing tax<br />
position of Metrowater Limited and Manukau Water Limited. Additionally, the closing accounting book value for all assets inherited from the Councils was<br />
legislated to be the opening tax book value of the company at 1 November 2010.<br />
10. ISSUED CAPITAL<br />
The total number of authorised and issued shares at balance date was 260,693,164 (2011: 260,693,164) ordinary shares of $1 each. All ordinary issued<br />
shares were fully paid and carry equal voting rights to:<br />
– one vote on a poll at a meeting of the company on any resolution; and<br />
– an equal share in the distribution of the surplus assets of the company.<br />
Under Section 57(1)(b) of the Local Government (Auckland Council) Act 2009 the company must not pay any dividend or distribute any surplus in any way,<br />
directly or indirectly to its shareholder. The capital management policy of the group is detailed in Note 22, page 109.<br />
<strong>2012</strong> financial report PAGE 89
<strong>Watercare</strong> Services Limited<br />
<strong>2012</strong> ANNUAL REPORT<br />
NOTES TO THE FINANCIAL STATEMENTS (continued)<br />
FOR THE YEAR ENDED 30 JUNE <strong>2012</strong><br />
11. SUBSIDIARIES AND INTEGRATION OF RETAIL BUSINESS<br />
SUBSIDIARIES<br />
The group disclosures in these financial statements represent the consolidated numbers of <strong>Watercare</strong> Services Limited (company) and its subsidiaries. The<br />
net assets at balance date of each of the company’s subsidiaries are immaterial to the consolidated financial position of the group. As at the balance date,<br />
the details of the company’s subsidiaries, net assets, revenue and net surplus or deficit for each subsidiary after inter-entity eliminations are as follows:<br />
Water Utility Consumer Assistance Trust<br />
The Water Utility Consumer Assistance Trust was formed in October 2011 and is a charitable trust. Its principal activity is to assist eligible residential<br />
customers of the company who are unable to pay their water and wastewater charges by approving a payment arrangement which may include<br />
recommending to <strong>Watercare</strong> a write-off of part or the entire amount owed. <strong>Watercare</strong> has the power to appoint two out of five of the Trustees on the<br />
Trust board. The Trust is fully funded by <strong>Watercare</strong>. The net assets of Water Utility Consumer Assistance Trust at balance date comprise a cash and cash<br />
equivalent balance of $9,712 (2011: $nil) and accrued expenses of $5,179 (2011: $nil). The Trust recorded revenue of $145 and a net surplus of $4,533<br />
for the year (2011: $nil).<br />
<strong>Watercare</strong> Harbour Clean-Up Trust<br />
The <strong>Watercare</strong> Harbour Clean-Up Trust was set up during December 2002 by several local authorities as The Waitemata Harbour Clean-Up Trust and is<br />
a charitable trust. Its principal activity is to promote and monitor the cleaning up of Auckland’s Waitemata harbour with a view to preserving its natural<br />
beauty for the benefit and enjoyment of the public. During 2010/ 2011, <strong>Watercare</strong> became the primary funder of this Trust and at 30 June <strong>2012</strong> two<br />
of the four Trustees on the board were current <strong>Watercare</strong> employees. The name of the Trust was changed to <strong>Watercare</strong> Harbour Clean-Up Trust during<br />
December 2011. The net assets acquired from the Trust as at 1 July 2011 comprise cash and cash equivalents of $219,572 and payables of $727.<br />
The net assets of the Trust at balance date comprise a cash and cash equivalents balance of $295,992 (2011: $nil) and accrued expenses of $25,730<br />
(2011: $nil). The Trust recorded revenue of $48,205 and a net surplus of $51,418 for the year (2011: $nil).<br />
Metrowater Community Trust<br />
The Metrowater Community Trust was formed in February 2001 to assist low income families and individuals who cannot afford to pay their water and<br />
wastewater bills and individuals who have special needs in relation to water use. The Metrowater Community Trust was wound up during December<br />
2011 and all liabilities were settled and assets were distributed to the Water Utility Consumer Assistance Trust. At the date of winding up the net assets<br />
of Metrowater Community Trust were $nil (2011: cash balance of $32,084 and accrued expenses of $15,206). The Metrowater Community Trust recorded<br />
revenue of $143 and a net deficit of $16,900 for the year (2011: revenue of $nil and a net deficit of $114,643).<br />
Auckland City Water Limited<br />
Auckland City Water Limited is 100% owned by <strong>Watercare</strong> and it is non-trading company. The net assets of Auckland City Water Limited at balance date<br />
comprise $nil (2011: $nil).<br />
Te Motu A Hiaroa (Puketutu Island) Park Trust<br />
The objective of the Te Motu A Hiaroa (Puketutu Island) Park Trust is to make Puketutu Island available as a public park, thereby providing a significant<br />
addition to the open space, amenity and recreational assets for Auckland’s population. The Trust is a 100% subsidiary of <strong>Watercare</strong> and was non-trading<br />
during the year.<br />
The total net assets of all the above subsidiaries included in the consolidated financial position of the group are $274,795 (2011: $16,878), comprising<br />
cash and cash equivalents balance of $305,704 (2011: $32,084) and accrued expenses of $30,909 (2011: $15,206).<br />
INTEGRATION OF RETAIL BUSINESS<br />
During the prior year, as at 1 November 2010, the retail water and wastewater businesses in the Auckland region were integrated as below into the<br />
company as part of the Auckland local body reorganisation:<br />
Business integrated<br />
Metrowater Limited<br />
Manukau Water Limited<br />
North Shore City Council<br />
Waitakere City Council<br />
Rodney District Council<br />
Franklin District Council<br />
Papakura District Council<br />
Auckland City Council<br />
Subsidiaries acquired<br />
Metrowater Community Trust<br />
Auckland City Water Limited<br />
Principal activity<br />
retail water and wastewater services<br />
retail water and wastewater services<br />
retail water and wastewater services<br />
retail water and wastewater services<br />
retail water and wastewater services<br />
retail water and wastewater services<br />
retail water and wastewater services<br />
retail water and wastewater services<br />
Principal activity<br />
assists water users (low income or special water usage needs)<br />
Non-trading company<br />
PAGE 90 <strong>2012</strong> financial report
<strong>Watercare</strong> Services Limited<br />
<strong>2012</strong> ANNUAL REPORT<br />
NOTES TO THE FINANCIAL STATEMENTS (continued)<br />
FOR THE YEAR ENDED 30 JUNE <strong>2012</strong><br />
11. SUBSIDIARIES AND INTEGRATION OF RETAIL BUSINESS (continued)<br />
INTEGRATION OF RETAIL BUSINESS (continued)<br />
BUSINESSES<br />
INTEGRATED<br />
MetroWater<br />
Limited<br />
Manukau<br />
Water<br />
Limited<br />
North<br />
Shore<br />
City<br />
Council<br />
Waitakere<br />
City<br />
Council<br />
Rodney<br />
District<br />
Council<br />
Franklin<br />
District<br />
Council<br />
Auckland<br />
City<br />
Council<br />
Papakura<br />
District<br />
Council<br />
Auckland<br />
Regional<br />
Council Adjustments Total<br />
$000 $000 $000 $000 $000 $000 $000 $000 $000 $000 $000<br />
Current assets<br />
Cash and<br />
bank balances – 11,953 – – – – – – – – 11,953<br />
Trade and other<br />
receivables 32,604 32,946 9,485 9,409 7,251 729 – – – – 92,424<br />
Inventories – – 72 – – – – – – – 72<br />
Non-current<br />
assets<br />
Property, plant<br />
and equipment 1,386,590 1,019,143 1,204,462 482,515 323,940 154,985 70,418 84,111 – 8,799 4,734,963<br />
Intangible assets 4,541 2,368 459 – – – – – – – 7,368<br />
Current liabilities<br />
Bank overdraft (5,605) – – – – – – – – – (5,605)<br />
Trade and<br />
other payables (17,636) (11,869) (1,293) (1,382) (305) (61) – (9,534) – – (42,080)<br />
Retentions (660) (495) (2,494) (213) (247) (263) – – – – (4,372)<br />
Employee benefit<br />
liabilities (776) (351) (524) (208) (64) (18) – – – – (1,941)<br />
Non-current<br />
liabilities<br />
Borrowings (215,000) (134,368) (95,489) (145,428) (63,015) (21,977) (22,436) (8,297) (6,048) – (712,058)<br />
Deferred tax<br />
liability (279,537) (19,612) – – – – – – – (2,464) (301,613)<br />
Net assets<br />
integrated 904,521 899,715 1,114,678 344,693 267,560 133,395 47,982 66,280 (6,048) 6,335 3,779,111<br />
Capital reserve (904,521) (899,715) (1,114,678) (344,693) (267,560) (133,395) (47,982) (66,280) 6,048 (6,335) (3,779,111)<br />
Adjustments for accounting policy differences:<br />
– The net assets of the integrated companies were transferred into the financial statements of the company at net book value and subsequently adjusted<br />
for differences in accounting policies as explained below. See accounting policy 3 on integration of retail business.<br />
– The company’s policy is to capitalise finance costs incurred during the course of construction that are attributable to a project using the finance rate<br />
applicable to the funding. To achieve consistency between the company’s policy and the integrated businesses, finance costs attributable to the<br />
integrated property, plant and equipment were estimated using the depreciated replacement cost method and capitalised as at 1 November 2010. This<br />
resulted in an increase of $8.8 million to property, plant and equipment with an increase to deferred tax liability of $2.5 million and a net increase of<br />
$6.3 million to capital reserve as shown under adjustments above.<br />
There were no other adjustments made to achieve consistency in accounting policies.<br />
<strong>2012</strong> financial report PAGE 91
<strong>Watercare</strong> Services Limited<br />
<strong>2012</strong> ANNUAL REPORT<br />
NOTES TO THE FINANCIAL STATEMENTS (continued)<br />
FOR THE YEAR ENDED 30 JUNE <strong>2012</strong><br />
11. SUBSIDIARIES AND INTEGRATION OF RETAIL BUSINESS (continued)<br />
INTEGRATION OF RETAIL BUSINESS (continued)<br />
Summary of assets and liabilities acquired<br />
The group acquired two subsidiaries, Metrowater Community Trust and Auckland City Water Limited (non-trading company) as part of the Auckland local<br />
body reorganisation. The net assets acquired from the subsidiaries as at 1 November 2010 were as shown below:<br />
Metrowater<br />
Community Trust<br />
Auckland City Water<br />
Limited<br />
Total<br />
SUBSIDIARIES ACQUIRED $000 $000 $000<br />
Current assets<br />
Cash and bank balances 51 – 51<br />
Trade and other receivables 90 – 90<br />
Current liabilities<br />
Trade and other payables (10) – (10)<br />
Net assets acquired 131 – 131<br />
12. REVALUATION RESERVES<br />
<strong>2012</strong> 2011<br />
Group and Company<br />
Group and Company<br />
$000 $000<br />
Balances at beginning of year 1,429,619 1,071,655<br />
Revaluation – net of deferred tax – 361,873<br />
Transferred to retained earnings on disposal of property, plant and equipment – net of tax (5,388) (3,909)<br />
Total revaluation reserves 1,424,231 1,429,619<br />
Comprising:<br />
Land 48,517 48,517<br />
Buildings 31,953 31,953<br />
Pipelines 837,391 844,715<br />
Tanks, tunnels, roads and reservoirs 281,782 281,705<br />
dams 79,171 79,171<br />
machinery 145,417 143,558<br />
Total revaluation reserves 1,424,231 1,429,619<br />
Analysis:<br />
Land<br />
Balances at beginning of year 48,517 47,163<br />
revaluation – 1,354<br />
Total land revaluation reserves 48,517 48,517<br />
Buildings<br />
Balances at beginning of year 31,953 33,319<br />
revaluation – (1,080)<br />
Transferred to retained earnings on disposal of property, plant and equipment – net of tax – (286)<br />
Total buildings revaluation reserves 31,953 31,953<br />
PAGE 92 <strong>2012</strong> financial report
<strong>Watercare</strong> Services Limited<br />
<strong>2012</strong> ANNUAL REPORT<br />
NOTES TO THE FINANCIAL STATEMENTS (continued)<br />
FOR THE YEAR ENDED 30 JUNE <strong>2012</strong><br />
12. REVALUATION RESERVES (continued)<br />
<strong>2012</strong> 2011<br />
Group and Company Group and Company<br />
$000 $000<br />
Pipelines<br />
Balances at beginning of year 844,715 569,176<br />
revaluation – 277,625<br />
Transferred to retained earnings on disposal of property, plant and equipment – net of tax (7,324) (2,086)<br />
Total pipelines revaluation reserves 837,391 844,715<br />
Tanks, tunnels, roads and reservoirs<br />
Balances at beginning of year 281,705 266,364<br />
revaluation – 13,556<br />
Transferred to retained earnings on disposal of property, plant and equipment – net of tax 77 1,785<br />
Total tanks, tunnels, roads and reservoirs revaluation reserves 281,782 281,705<br />
Dams<br />
Balances at beginning of year 79,171 69,940<br />
revaluation – 9,235<br />
Transferred to retained earnings on disposal of property, plant and equipment – net of tax – (4)<br />
Total dams revaluation reserves 79,171 79,171<br />
Machinery<br />
Balances at beginning of year 143,558 85,693<br />
revaluation – 61,183<br />
Transferred to retained earnings on disposal of property, plant and equipment – net of tax 1,859 (3,318)<br />
Total machinery revaluation reserves 145,417 143,558<br />
The revaluation reserve arises on the revaluation of property, plant and equipment. Where revalued property, plant and equipment was sold, the portion of<br />
the revaluation reserve that relates to that asset was effectively realised and transferred directly to retained earnings.<br />
<strong>2012</strong> financial report PAGE 93
<strong>Watercare</strong> Services Limited<br />
<strong>2012</strong> ANNUAL REPORT<br />
NOTES TO THE FINANCIAL STATEMENTS (continued)<br />
FOR THE YEAR ENDED 30 JUNE <strong>2012</strong><br />
13. PROPERTY, PLANT AND EQUIPMENT<br />
Property, plant and equipment – movement in gross carrying value<br />
2011 <strong>2012</strong><br />
Group and Company<br />
Opening value Additions Disposals Depreciation Impairment Reclassification Closing value<br />
$000 $000 $000 $000 $000 $000 $000<br />
Land 119,339 4,879 – – – 29 124,247<br />
Buildings 113,352 2,905 – – – 301 116,558<br />
Pipelines 5,477,954 104,430 (3,841) – (2,871) 4,256 5,579,928<br />
Tanks, tunnels, roads and reservoirs 680,072 1,397 (16) – – (27,777) 653,676<br />
Dams 210,475 546 – – – (5,189) 205,832<br />
Machinery 795,384 61,602 (2,507) – (16) 28,010 882,473<br />
Motor vehicles 4,182 737 (20) – – – 4,899<br />
Office equipment 13,004 72 – – – 241 13,317<br />
7,413,762 176,568 (6,384) – (2,887) (129) 7,580,930<br />
Work in progress 288,288 43,942 – – – – 332,230<br />
Gross carrying value 7,702,050 220,510 (6,384) – (2,887) (129) 7,913,160<br />
Property, plant and equipment – movement in accumulated depreciation<br />
2011 <strong>2012</strong><br />
Group and Company<br />
Opening value Additions Disposals Depreciation Impairment Reclassification Closing value<br />
$000 $000 $000 $000 $000 $000 $000<br />
Buildings (99) – – (3,621) – – (3,720)<br />
Pipelines (2,716) – 505 (109,326) 79 (9) (111,467)<br />
Tanks, tunnels, roads and reservoirs (56) – 1 (10,334) – – (10,389)<br />
Dams (71) – – (1,823) – – (1,894)<br />
Machinery (535) – 116 (42,717) – (14) (43,150)<br />
Motor vehicles (3,414) – 14 (341) – – (3,741)<br />
Office equipment (6,963) – – (1,550) – 23 (8,490)<br />
Accumulated depreciation (13,854) – 636 (169,712) 79 – (182,851)<br />
PAGE 94 <strong>2012</strong> financial report
<strong>Watercare</strong> Services Limited<br />
<strong>2012</strong> ANNUAL REPORT<br />
NOTES TO THE FINANCIAL STATEMENTS (continued)<br />
FOR THE YEAR ENDED 30 JUNE <strong>2012</strong><br />
13. PROPERTY, PLANT AND EQUIPMENT (continued)<br />
Property, plant and equipment – movement in net book values including revaluation<br />
2011 <strong>2012</strong><br />
Group and Company<br />
Opening value Additions Disposals Depreciation Impairment Reclassification Closing value<br />
$000 $000 $000 $000 $000 $000 $000<br />
Land 119,339 4,879 – – – 29 124,247<br />
Buildings 113,253 2,905 – (3,621) – 301 112,838<br />
Pipelines 5,475,238 104,430 (3,336) (109,326) (2,792) 4,247 5,468,461<br />
Tanks, tunnels, roads and reservoirs 680,016 1,397 (15) (10,334) – (27,777) 643,287<br />
Dams 210,404 546 – (1,823) – (5,189) 203,938<br />
Machinery 794,849 61,602 (2,391) (42,717) (16) 27,996 839,323<br />
Motor vehicles 768 737 (6) (341) – – 1,158<br />
Office equipment 6,041 72 – (1,550) – 264 4,827<br />
7,399,908 176,568 (5,748) (169,712) (2,808) (129) 7,398,079<br />
Work in progress 288,288 43,942 – – – – 332,230<br />
Net book value 7,688,196 220,510 (5,748) (169,712) (2,808) (129) 7,730,309<br />
The reclassification of assets between categories results from the on-going project to improve asset data quality. The predominant reason for<br />
reclassification was to split broadly categorised assets into their component assets. It was not practical to reclassify the prior year comparatives, due to the<br />
size of the asset register.<br />
PROPERTY, PLANT AND EQUIPMENT – ComparAtives<br />
Property, plant and equipment – movement in gross carrying value<br />
2010 2010 2011<br />
Company 1 November Group and Company<br />
Opening value Integrated Additions Disposals Depreciation Revaluation Reclassification Closing value<br />
$000 $000 $000 $000 $000 $000 $000 $000<br />
Land 75,162 41,133 83 (288) – 1,880 1,369 119,339<br />
Buildings 99,367 17,145 3,016 (71) – (6,396) 291 113,352<br />
Pipelines 887,353 4,253,327 61,123 (2,889) – 279,026 14 5,477,954<br />
Tanks, tunnels,<br />
roads and reservoirs 625,932 48,359 9,266 (1,189) – (3,760) 1,464 680,072<br />
Dams 190,850 1,880 8,505 – – 9,240 – 210,475<br />
Machinery 439,819 307,895 26,936 (1,485) – 23,853 (1,634) 795,384<br />
Motor vehicles 4,358 272 45 (493) – – – 4,182<br />
Office equipment 9,965 1,519 3,365 (313) – – (1,532) 13,004<br />
2,332,806 4,671,530 112,339 (6,728) – 303,843 (28) 7,413,762<br />
Work in progress 160,441 63,432 64,415 – – – – 288,288<br />
Gross carrying value 2,493,247 4,734,962 176,754 (6,728) – 303,843 (28) 7,702,050<br />
<strong>2012</strong> financial report PAGE 95
<strong>Watercare</strong> Services Limited<br />
<strong>2012</strong> ANNUAL REPORT<br />
NOTES TO THE FINANCIAL STATEMENTS (continued)<br />
FOR THE YEAR ENDED 30 JUNE <strong>2012</strong><br />
13. PROPERTY, PLANT AND EQUIPMENT (continued)<br />
PROPERTY, PLANT AND EQUIPMENT – ComparAtives (continued)<br />
Property, plant and equipment – movement in accumulated depreciation<br />
2010 2010 2011<br />
Company 1 November Group and Company<br />
Opening value Integrated Additions Disposals Depreciation Revaluation Reclassification Closing value<br />
$000 $000 $000 $000 $000 $000 $000 $000<br />
Buildings (2,303) – – 71 (2,720) 4,896 (43) (99)<br />
Pipelines (24,955) – – 1,614 (85,941) 106,563 3 (2,716)<br />
Tanks, tunnels,<br />
roads and reservoirs (10,779) – – 1,189 (12,984) 22,585 (67) (56)<br />
Dams (1,749) – – – (1,910) 3,588 – (71)<br />
Machinery (29,762) – – 921 (31,740) 61,125 (1,079) (535)<br />
Motor vehicles (3,572) – – 492 (334) – – (3,414)<br />
Office equipment (7,014) – – 312 (1,447) – 1,186 (6,963)<br />
Accumulated depreciation (80,134) – – 4,599 (137,076) 198,757 – (13,854)<br />
Property, plant and equipment – movement in net book values including revaluation<br />
2010 2010 2011<br />
Company 1 November Group and Company<br />
Opening value Integrated Additions Disposals Depreciation Revaluation Reclassification Closing value<br />
$000 $000 $000 $000 $000 $000 $000 $000<br />
Land 75,162 41,133 83 (288) – 1,880 1,369 119,339<br />
Buildings 97,064 17,145 3,016 – (2,720) (1,500) 248 113,253<br />
Pipelines 862,398 4,253,327 61,123 (1,275) (85,941) 385,589 17 5,475,238<br />
Tanks, tunnels,<br />
roads and reservoirs 615,153 48,359 9,266 – (12,984) 18,825 1,397 680,016<br />
Dams 189,101 1,880 8,505 – (1,910) 12,828 – 210,404<br />
Machinery 410,057 307,895 26,936 (564) (31,740) 84,978 (2,713) 794,849<br />
Motor vehicles 786 272 45 (1) (334) – – 768<br />
Office equipment 2,951 1,519 3,365 (1) (1,447) – (346) 6,041<br />
2,252,672 4,671,530 112,339 (2,129) (137,076) 502,600 (28) 7,399,908<br />
Work in progress 160,441 63,432 64,415 – – – – 288,288<br />
Net book value 2,413,113 4,734,962 176,754 (2,129) (137,076) 502,600 (28) 7,688,196<br />
All assets subject to valuation are independently valued at least every three years. The most recent valuation was completed at 30 June 2011. ANA<br />
Group completed the valuation in association with Beca Valuations Limited (Beca) who completed a peer review of the work. The assumptions used in<br />
determining the depreciated replacement cost of pipelines, tanks, roads, tunnels, reservoirs, dams and machinery were that:<br />
– construction costs based on recent contract-based construction work and the unit rates reflect the costs of replacing assets;<br />
– the useful lives of assets are calculated as the lesser of their physical life or the point where the asset is to be replaced for economic reasons;<br />
– the capital price goods index (CPGI) was used where indexation is appropriate. At the time of valuation the CPGI was available to the March 2011<br />
quarter; and<br />
– capitalised interest was applied to qualifying asset types in accordance with the estimated construction period and applicable cost of debt.<br />
Beca completed the valuation of land and buildings. The land valuation was based on relevant market prices and buildings were valued using the<br />
depreciated replacement cost.<br />
The Local Government Acts 1974 and 2002 restrict the business activities of the group and effectively prevent selling of key assets. Many of the assets<br />
are specialised in nature, reflecting the activities of the group. As there is no active market for such assets and the income from them is not determined by<br />
the market, property, plant and equipment, other than land, buildings, motor vehicles and office equipment, are revalued to depreciated replacement cost,<br />
which reflects their deemed fair values.<br />
Each year, other than in the years in which the assets are revalued, the group assesses whether there was any material change in the value of property,<br />
plant and equipment. The movement in asset values between June 2011 and June <strong>2012</strong> was assessed using indices deemed suitable by the registered<br />
valuer ANA Group and Beca. The increase in asset value of 1.5% was not considered material by management and accordingly the assets were not revalued<br />
at 30 June <strong>2012</strong>.<br />
PAGE 96 <strong>2012</strong> financial report
<strong>Watercare</strong> Services Limited<br />
<strong>2012</strong> ANNUAL REPORT<br />
NOTES TO THE FINANCIAL STATEMENTS (continued)<br />
FOR THE YEAR ENDED 30 JUNE <strong>2012</strong><br />
13. PROPERTY, PLANT AND EQUIPMENT (continued)<br />
<strong>2012</strong> 2011<br />
Group and Company Group and Company<br />
Work in progress relates to the following projects: $000 $000<br />
Water treatment plants 58,795 17,884<br />
Wastewater treatment plant 21,880 43,857<br />
Wastewater pump stations and sewers 117,229 116,519<br />
Watermains, pump stations and reservoirs 95,076 73,837<br />
Dams and raw water transmission pipelines 7,727 8,205<br />
Other 31,523 27,986<br />
Total work in progress 332,230 288,288<br />
14. INTANGIBLE ASSETS<br />
Intangibles – movement in gross carrying value<br />
2011 <strong>2012</strong><br />
Group and Company<br />
Opening value Additions Disposals Amortisation Reclassification Closing value<br />
$000 $000 $000 $000 $000 $000<br />
Network models 5,974 – – – (294) 5,680<br />
Computer software 28,456 13,186 – – 455 42,097<br />
Resource consents 18,400 6,106 – – (32) 24,474<br />
Easements 484 14 – – – 498<br />
Gross carrying value 53,314 19,306 – – 129 72,749<br />
Intangibles – movement in accumulated amortisation<br />
2011 <strong>2012</strong><br />
Group and Company<br />
Opening value Additions Disposals Amortisation Reclassification Closing value<br />
$000 $000 $000 $000 $000 $000<br />
Network models (2,361) – – (1,252) (103) (3,716)<br />
Computer software (15,884) – – (8,080) 105 (23,859)<br />
Resource consents (4,840) – – (778) (2) (5,620)<br />
Accumulated amortisation (23,085) – – (10,110) – (33,195)<br />
Intangibles – movement in net book values<br />
2011 <strong>2012</strong><br />
Group and Company<br />
Opening value Additions Disposals Amortisation Reclassification Closing value<br />
$000 $000 $000 $000 $000 $000<br />
Network models 3,613 – – (1,252) (397) 1,964<br />
Computer software 12,572 13,186 – (8,080) 560 18,238<br />
Resource consents 13,560 6,106 – (778) (34) 18,854<br />
Easements 484 14 – – – 498<br />
Net book value 30,229 19,306 – (10,110) 129 39,554<br />
<strong>2012</strong> financial report PAGE 97
<strong>Watercare</strong> Services Limited<br />
<strong>2012</strong> ANNUAL REPORT<br />
NOTES TO THE FINANCIAL STATEMENTS (continued)<br />
FOR THE YEAR ENDED 30 JUNE <strong>2012</strong><br />
14. INTANGIBLE ASSETS (continued)<br />
INTANGIBLE ASSETS – Comparatives<br />
Intangibles – movement in gross carrying value<br />
2010 2010 2011<br />
Company 1 November Group and Company<br />
Opening value Integration Additions Disposals Amortisation Reclassifications Closing value<br />
$000 $000 $000 $000 $000 $000 $000<br />
Network models 3,301 3,346 – (673) – – 5,974<br />
Computer software 13,960 258 14,994 (784) – 28 28,456<br />
Resource consents 14,619 3,764 17 – – – 18,400<br />
Easements 484 – – – – – 484<br />
Gross carrying value 32,364 7,368 15,011 (1,457) – 28 53,314<br />
Intangibles – movement in accumulated amortisation<br />
2010 2010 2011<br />
Company 1 November Group and Company<br />
Opening value Integration Additions Disposals Amortisation Reclassifications Closing value<br />
$000 $000 $000 $000 $000 $000 $000<br />
Network models (2,137) – – 885 (1,109) – (2,361)<br />
Computer software (11,761) – – 570 (4,693) – (15,884)<br />
Resource consents (4,092) – – – (748) – (4,840)<br />
Accumulated amortisation (17,990) – – 1,455 (6,550) – (23,085)<br />
Intangibles – movement in net book values<br />
2010 2010 2011<br />
Company 1 November Group and Company<br />
Opening value Integration Additions Disposals Amortisation Reclassifications Closing value<br />
$000 $000 $000 $000 $000 $000 $000<br />
Network models 1,164 3,346 – 212 (1,109) – 3,613<br />
Computer software 2,199 258 14,994 (214) (4,693) 28 12,572<br />
Resource consents 10,527 3,764 17 – (748) – 13,560<br />
Easements 484 – – – – – 484<br />
Net book value 14,374 7,368 15,011 (2) (6,550) 28 30,229<br />
PAGE 98 <strong>2012</strong> financial report
<strong>Watercare</strong> Services Limited<br />
<strong>2012</strong> ANNUAL REPORT<br />
NOTES TO THE FINANCIAL STATEMENTS (continued)<br />
FOR THE YEAR ENDED 30 JUNE <strong>2012</strong><br />
15. INVENTORIES<br />
<strong>2012</strong> 2011<br />
Group and Company Group and Company<br />
$000 $000<br />
Spare parts at cost 3,768 4,530<br />
consumables at cost 2,503 2,011<br />
treated water at cost 679 710<br />
Work in progress – 838<br />
Project stock 248 1,045<br />
Provision for obsolescence (1,768) (2,002)<br />
Total inventory 5,430 7,132<br />
Represented as:<br />
current inventory 2,793 4,092<br />
Non-current inventory 2,637 3,040<br />
Total inventory 5,430 7,132<br />
16. TRADE AND OTHER RECEIVABLES<br />
<strong>2012</strong> 2011<br />
Group and Company Group and Company<br />
$000 $000<br />
Current<br />
Trade receivables – related parties 1,445 2,985<br />
Trade receivables – other 33,698 38,124<br />
Provision for doubtful debts (3,205) (3,128)<br />
31,938 37,981<br />
Other receivables 2,780 1,380<br />
Unbilled revenue accrual 36,872 40,147<br />
Total trade and other receivables 71,590 79,508<br />
17. PREPAID EXPENSES<br />
During the year, an amount of $23.9 million was paid to Kelliher Charitable Trust towards lease of land at Puketutu Island for disposal of biosolids by <strong>Watercare</strong>.<br />
The lease is for a period of 55 years with one right of renewal of 15 years. At balance date, the unamortised amount was $23.5 million of which $0.4 million was<br />
included within current prepaid expenses and $23.1 million within non-current prepaid expenses.<br />
18. TRADE AND OTHER PAYABLES<br />
<strong>2012</strong> 2011<br />
Group and Company Group and Company<br />
$000 $000<br />
Current<br />
contract retentions 8,707 11,045<br />
trade creditors – other 15,161 3,794<br />
Trade creditors – related parties 327 1,201<br />
Other payables 289 117<br />
Total trade and other payables 24,484 16,157<br />
<strong>2012</strong> financial report PAGE 99
<strong>Watercare</strong> Services Limited<br />
<strong>2012</strong> ANNUAL REPORT<br />
NOTES TO THE FINANCIAL STATEMENTS (continued)<br />
FOR THE YEAR ENDED 30 JUNE <strong>2012</strong><br />
19. accrued expenses<br />
<strong>2012</strong> 2011<br />
Group and Company Group and Company<br />
$000 $000<br />
Current<br />
Capital work in progress accruals 29,235 21,146<br />
interest payable 11,497 11,013<br />
Income received in advance 5,916 4,896<br />
Operating costs accruals 15,186 30,872<br />
Total current accrued expenses 61,834 67,927<br />
Non-current<br />
income received in advance 8,840 9,100<br />
Total non-current accrued expenses 8,840 9,100<br />
Total accrued expenses 70,674 77,027<br />
Income received in advance includes $9.1 million (2011: $9.4 million) relating to the amount received in accordance with the franchise fee agreement<br />
between the network operator United Water International Pty Limited (United Water) and Papakura District Council (integrated into the company on<br />
1 November 2010). The franchise agreement grants the operator, the right to use the fixed utility systems owned by the group for the provision of<br />
water and wastewater services within the Papakura district. Under the franchise agreement United Water is responsible for upgrading and maintaining<br />
the network so that at the end of the contract period, the network shall be in a better overall condition than the condition at the time the contract was<br />
commenced. The $13m fee received at the commencement of the agreement covers the right to use the assets for a 50-year period and is recognised as<br />
revenue evenly over the term of the agreement.<br />
20. provisionS<br />
<strong>2012</strong> 2011<br />
Group and Company Group and Company<br />
$000 $000<br />
Current<br />
employee entitlements 5,019 3,790<br />
decommissioning costs 1,222 847<br />
Other provisions – 159<br />
Total current provisions 6,241 4,796<br />
Non-current<br />
employee entitlements 1,464 1,392<br />
Total non-current provisions 1,464 1,392<br />
Total provisions 7,705 6,188<br />
Employee<br />
entitlements<br />
Decommissioning<br />
costs<br />
Other<br />
provisions<br />
Total<br />
$000 $000 $000 $000<br />
Balance at 1 July 2011 5,182 847 159 6,188<br />
Additions during the year 5,556 1,912 – 7,468<br />
Reductions resulting from payments (4,255) (1,537) (159) (5,951)<br />
Balance at 30 June <strong>2012</strong> 6,483 1,222 – 7,705<br />
PAGE 100 <strong>2012</strong> financial report
<strong>Watercare</strong> Services Limited<br />
<strong>2012</strong> ANNUAL REPORT<br />
NOTES TO THE FINANCIAL STATEMENTS (continued)<br />
FOR THE YEAR ENDED 30 JUNE <strong>2012</strong><br />
21. BORROWINGS<br />
<strong>2012</strong> 2011<br />
Group and Company Group and Company<br />
$000 $000<br />
Current<br />
Related party term loan (unsecured) 89,312 67,154<br />
Medium-term notes (unsecured) 227 50,000<br />
commercial paper (unsecured) 129,117 124,141<br />
Bank loan (unsecured) 13,500 –<br />
Total current borrowings 232,156 241,295<br />
Non-current<br />
Related party term loan (unsecured) 387,488 476,104<br />
Medium-term notes (unsecured) 526,422 400,000<br />
term loan (unsecured) 150,000 100,000<br />
Bank loan (unsecured) – 11,500<br />
Total non-current borrowings 1,063,910 987,604<br />
Repayment schedule:<br />
Related party term loan (unsecured)<br />
Less than one year 89,312 67,154<br />
One to two years 78,754 89,798<br />
Two to three years 136,394 79,128<br />
Three to four years 18,918 136,275<br />
Beyond four years 153,422 170,903<br />
Medium-term notes<br />
Less than one year 227 50,000<br />
One to two years 220,239 –<br />
Two to three years 150,251 220,000<br />
Three to four years 30,264 150,000<br />
Beyond four years 125,668 30,000<br />
Term loan<br />
Beyond four years 150,000 100,000<br />
Bank loan<br />
Less than one year 13,500 –<br />
One to two years – 11,500<br />
Commercial paper<br />
current 129,117 124,141<br />
Total borrowings 1,296,066 1,228,899<br />
<strong>2012</strong> financial report PAGE 101
<strong>Watercare</strong> Services Limited<br />
<strong>2012</strong> ANNUAL REPORT<br />
NOTES TO THE FINANCIAL STATEMENTS (continued)<br />
FOR THE YEAR ENDED 30 JUNE <strong>2012</strong><br />
21. BORROWINGS (continued)<br />
<strong>2012</strong> 2011<br />
Group and Company Group and Company<br />
Interest rates at balance date: % %<br />
Related party term loan<br />
average 6.24 5.13<br />
Average including interest rate swaps 6.80 5.78<br />
Medium-term notes<br />
average 5.99 6.23<br />
Average including interest rate swaps 5.59 5.98<br />
Term loan<br />
average 4.07 3.51<br />
Average including interest rate swaps 7.10 6.85<br />
Bank loan<br />
average 3.55 3.61<br />
Average including interest rate swaps 3.55 3.61<br />
Commercial paper<br />
average 2.80 2.76<br />
Average including interest rate swaps 5.02 6.08<br />
Total debt<br />
average 5.52 5.15<br />
Average including interest rate swaps 6.13 5.95<br />
Lenders under the bank loans and holders of medium-term notes and short-term commercial paper, receive the benefit of the negative pledge undertaking<br />
from the group. This undertaking limits the extent to which the group can give security to lenders and requires the group to ensure that the following<br />
financial ratios are achieved at all times;<br />
– Total liabilities do not exceed 60 per cent of total tangible assets;<br />
– Total liabilities plus total contingent liabilities do not exceed 65 per cent of total tangible assets;<br />
– Shareholders’ funds are not less than $500 million;<br />
– Earnings before interest, tax, depreciation and amortisation is greater than 1.75 times interest expense;<br />
– Total tangible assets of the group are to be greater than 90 per cent of total tangible assets of the borrowing group.<br />
The group complied with these financial covenant ratios during the years ended 30 June <strong>2012</strong> and 30 June 2011.<br />
The group has an agreement with Auckland Council under which Auckland Council guarantees repayment of certain of the group’s borrowings and<br />
obligations under interest rate swap agreements.<br />
The group has the following undrawn committed facilities available:<br />
<strong>2012</strong> 2011<br />
Group and Company Group and Company<br />
$000 $000<br />
Bank overdraft facilities, expires on cancellation 5,100 4,542<br />
Term loan facility, expires October 2016 – 50,000<br />
Revolving advances, expires May 2013 (2011: expires May 2013) 61,500 63,500<br />
Commercial paper standby facility expires July <strong>2012</strong> (2011: expires July <strong>2012</strong>) 200,000 200,000<br />
Total undrawn committed facilities 266,600 318,042<br />
Commercial paper held by the group is represented by multiple issues that spread interest rate and maturity risk. As each issue matures the group replaces<br />
it with a new issue, if required. The provider of the commercial paper standby facility acts as a lender of last resort, should the group be unable to issue new<br />
commercial paper when it matures. The group’s treasury risk management policy requires standby facilities to be maintained to meet 50% of outstanding<br />
commercial paper and other uncommitted short-term debt repayable within 60 days. The group complied with its treasury risk management policy during<br />
the years ended 30 June <strong>2012</strong> and 30 June 2011.<br />
<strong>Watercare</strong>’s treasury policy requires that facilities due to expire are replaced six months prior to the maturity date of the existing facilities. In accordance<br />
with the treasury policy, <strong>Watercare</strong> established, effective 1 July <strong>2012</strong> a replacement commercial paper standby facility of $200 million with $100 million<br />
maturing in July 2015 and the other $100 million maturing in July 2017.<br />
PAGE 102 <strong>2012</strong> financial report
<strong>Watercare</strong> Services Limited<br />
<strong>2012</strong> ANNUAL REPORT<br />
NOTES TO THE FINANCIAL STATEMENTS (continued)<br />
FOR THE YEAR ENDED 30 JUNE <strong>2012</strong><br />
22. FINANCIAL ASSETS AND LIABILITIES<br />
Categories of financial assets and liabilities<br />
The carrying amounts presented in the statement of financial position relate to the following categories of assets and liabilities:<br />
<strong>2012</strong> 2011<br />
Group and Company<br />
Group and Company<br />
Carrying amount Fair value Carrying amount Fair value<br />
$000 $000 $000 $000<br />
FINANCIAL ASSETS – CURRENT<br />
Loans and receivables<br />
Cash and cash equivalents 862 862 32 32<br />
Trade and other receivables 71,590 71,590 79,508 79,508<br />
Fair value through profit or loss<br />
Derivative financial instruments 26 26 553 553<br />
FINANCIAL ASSETS – NON CURRENT<br />
Fair value through profit or loss<br />
Derivative financial instruments 23,609 23,609 12,285 12,285<br />
96,087 96,087 92,378 92,378<br />
FINANCIAL LIABILITIES – CURRENT<br />
Amortised cost<br />
Trade and other payables 24,484 24,484 16,157 16,157<br />
accrued expenses* 55,918 55,918 63,031 63,031<br />
Bank overdraft (unsecured) – – 558 558<br />
Medium-term notes (unsecured) 227 227 50,000 51,244<br />
Related party term loan (unsecured) 89,312 90,223 67,154 67,770<br />
Commercial paper (unsecured) 129,117 129,555 124,141 124,450<br />
Bank loan (unsecured) 13,500 13,507 – –<br />
Fair value through profit or loss<br />
Derivative financial instruments 362 362 3,174 3,174<br />
FINANCIAL LIABILITIES – NON CURRENT<br />
Amortised cost<br />
Medium-term notes (unsecured) 526,422 559,654 400,000 423,156<br />
Term loan (unsecured) 150,000 150,777 100,000 100,369<br />
Bank loan (unsecured) – – 11,500 11,500<br />
Related party term loan (unsecured) 387,488 391,579 476,104 481,084<br />
Fair value through profit or loss<br />
Derivative financial instruments 133,336 133,336 59,110 59,110<br />
1,510,166 1,549,622 1,370,929 1,401,603<br />
* Excludes current and non-current income received in advance of $14.8 million (2011: $14 million) as it was not categorised as a financial liability, refer<br />
Note 19 page 100.<br />
The calculation of fair values for each category of financial assets and financial liabilities is explained below. The methods and valuation techniques used<br />
for the purpose of measuring fair value are unchanged compared to the previous reporting period. No reclassification of financial assets was made during<br />
the years ended 30 June <strong>2012</strong> or 30 June 2011.<br />
<strong>2012</strong> financial report PAGE 103
<strong>Watercare</strong> Services Limited<br />
<strong>2012</strong> ANNUAL REPORT<br />
NOTES TO THE FINANCIAL STATEMENTS (continued)<br />
FOR THE YEAR ENDED 30 JUNE <strong>2012</strong><br />
22. FINANCIAL ASSETS AND LIABILITIES (continued)<br />
Loans and receivables<br />
Due to their relatively short-term nature, the carrying amount of trade receivables was considered a reasonable approximation of fair value.<br />
Amortised cost<br />
Due to their relatively short-term nature, the carrying amount of trade payables was considered a reasonable approximation of fair value.<br />
The fair value of loans and borrowings was calculated based on the present value of contractual principal and interest cash flows, discounted at the market<br />
rate of interest in the reporting period.<br />
Fair value through profit and loss<br />
Interest rate swaps were measured at the present value of future cash flows estimated and discounted based on the applicable yield curves derived from<br />
quoted interest rates. Forward foreign exchange contracts were measured using observable market forward exchange rates.<br />
Fair value hierarchy<br />
The fair value hierarchy groups financial assets and liabilities into three levels as explained below based on the significance of inputs used in measuring<br />
the fair value of the financial assets and liabilities.<br />
Level 1: Quoted prices (unadjusted) in active markets for identical assets or liabilities;<br />
Level 2: Inputs other than quoted prices included within level 1 that are observable for the asset or liability, either directly (i.e. as prices) or indirectly<br />
(i.e. derived from prices); and<br />
Level 3: Inputs for the asset or liability that are not based on observable market data (unobservable inputs).<br />
The level in which the financial asset or liability was classified was determined based on the lowest level of significant input to the fair value measurement.<br />
The only financial assets and financial liabilities that were measured at fair value in the statement of financial position were derivative financial<br />
instruments. The valuation for derivative financial instruments was based on level 2 fair value hierarchy. The derivative financial instruments that the group<br />
held at balance date comprised interest rate swaps and forward foreign exchange contracts.<br />
Fair values at balance date were assessed using a range of market interest rates between 2.69% and 4.04% (2011: 2.68% and 5.35 %), derived from the<br />
interest rate swap curve.<br />
There were no transfers between levels 1, 2 and 3 during the year ended 30 June <strong>2012</strong>.<br />
Financial instrument risks<br />
Risk management objectives and policies<br />
The group’s management monitors and manages the financial risks relating to the operations of the group through internal risk reports which analyse<br />
exposures by degree and magnitude of risks. The main types of risks are market risk, credit risk and liquidity risk.<br />
The group seeks to manage the effects of these risks by using derivative financial instruments to minimise these risk exposures. The use of financial<br />
derivatives was governed by the group’s policies approved by the Board of Directors, which provide written principles on interest rate risk, credit risk,<br />
the use of derivative and non-derivative financial instruments, and the investment of excess liquidity. Compliance with policies and exposure limits was<br />
reviewed by the Board of Directors on a regular basis.<br />
Market risk<br />
The group was exposed to market risk through its use of financial instruments and specifically to interest rate, foreign currency and certain other price risks.<br />
The group managed its market risk by regularly assessing the impact of changes in the market interest rates and foreign currency rates on the<br />
group’s portfolio.<br />
Interest rate risk<br />
Interest rate risk is the risk that the fair value or future cash flows of a financial instrument will fluctuate because of changes in market interest rates.<br />
The group is exposed to interest rate risk when it borrows funds at floating interest rates. The risk was managed by the group through monitoring market<br />
interest rates and reviewing the impact of these on interest rate exposure.<br />
The group’s borrowings comprise of both fixed rates and floating rates of interest. It is group policy to ensure that a proportion of interest rate exposure is<br />
maintained on a fixed-rate basis. To achieve this, the group enters into contracts that allow some of its floating interest rate exposure to be swapped from<br />
floating to fixed, and vice versa. The contracts are called interest rate swaps and interest rate options.<br />
The group’s exposure to market interest rates relates primarily to the group’s debt obligations which are disclosed in Note 21, page 102.<br />
The group regularly analyses its interest rate exposure. Within this analysis, consideration is given to potential renewals of existing positions, alternative<br />
financing, alternative protective positions and the mix of fixed and variable interest rates.<br />
PAGE 104 <strong>2012</strong> financial report
<strong>Watercare</strong> Services Limited<br />
<strong>2012</strong> ANNUAL REPORT<br />
NOTES TO THE FINANCIAL STATEMENTS (continued)<br />
FOR THE YEAR ENDED 30 JUNE <strong>2012</strong><br />
22. FINANCIAL ASSETS AND LIABILITIES (continued)<br />
The notional principal, contract amounts of agreements and fixed interest rates in place, at balance date, to manage interest rate risk were as follows:<br />
<strong>2012</strong> 2011<br />
Group and Company<br />
Group and Company<br />
Fixed interest rate Notional amount Fixed interest rate Notional amount<br />
Interest rate swaps % $000 % $000<br />
Receivable maturities (fixed to floating):<br />
Within one year – – 6.86% 50,000<br />
One to two years 5.26% 170,000 – –<br />
two to three years 5.74% 150,000 5.26% 170,000<br />
three to four years 5.10% 30,000 5.74% 150,000<br />
Four to five years – – 5.10% 30,000<br />
Beyond five years 5.69% 125,000 – –<br />
Payable maturities (floating to fixed):<br />
Within one year 6.84% 45,000 5.48% 125,000<br />
One to two years 2.85% 20,000 – –<br />
two to three years 6.25% 15,000 – –<br />
three to four years 4.51% 100,000 6.25% 15,000<br />
Four to five years 4.95% 80,000 5.17% 110,000<br />
Beyond five years 5.92% 870,000 6.30% 720,000<br />
As interest rates change, these derivative financial instruments are revalued to fair value and the change in fair value is recorded in surplus or deficit.<br />
Interest rate sensitivity<br />
The following sensitivity analysis is based on the interest rate risk exposures in existence at balance date.<br />
At balance date, if interest rates had moved, as illustrated in the table below, with all other variables held constant, post-tax deficit and equity would have<br />
been affected as follows:<br />
Post-tax deficit<br />
(Higher)/lower<br />
<strong>2012</strong> 2011<br />
Group and Company<br />
Equity<br />
Higher/(lower)<br />
Post-tax deficit<br />
(Higher)/lower<br />
Group and Company<br />
Equity<br />
Higher/(lower)<br />
Judgments of reasonably possible movements: $000 $000 $000 $000<br />
Interest paid<br />
1% (100 basis points) higher for the year (2,725) (2,725) (1,656) (1,656)<br />
1% (100 basis points) lower for the year 2,725 2,725 1,656 1,656<br />
Revaluation of derivative financial instruments<br />
1% (100 basis points) higher at year-end 37,744 37,744 21,548 21,548<br />
1% (100 basis points) lower at year-end (43,012) (43,012) (23,596) (23,596)<br />
Foreign currency risk<br />
Foreign currency risk is the risk that the fair value of future cash flows of a financial instrument will fluctuate because of changes in foreign exchange rates.<br />
Most of the group’s transactions are carried out in New Zealand dollars.<br />
From time to time the group is exposed to foreign currency risk on transactions denominated in foreign currencies. This was predominantly for the<br />
purchase of equipment, parts and chemicals in foreign currency. Where amounts exceed $100,000 the group manages this risk with forward foreign<br />
exchange contracts or options.<br />
<strong>2012</strong> financial report PAGE 105
<strong>Watercare</strong> Services Limited<br />
<strong>2012</strong> ANNUAL REPORT<br />
NOTES TO THE FINANCIAL STATEMENTS (continued)<br />
FOR THE YEAR ENDED 30 JUNE <strong>2012</strong><br />
22. FINANCIAL ASSETS AND LIABILITIES (continued)<br />
The group has forward foreign exchange contracts at balance date as follows:<br />
<strong>2012</strong><br />
Group and Company<br />
Average exchange Foreign exchange Contract value<br />
Carrying amount<br />
and fair value<br />
RATE FC 000 NZ$000 NZ$000<br />
USD<br />
3 months and beyond 0.767 1,473 1,920 (42)<br />
AUD<br />
Less than 3 months – – – –<br />
3 months and beyond 0.776 397 512 (6)<br />
Total forward foreign exchange contracts 2,432 (48)<br />
2011<br />
Group and Company<br />
Average exchange Foreign exchange Contract value<br />
Carrying amount<br />
and fair value<br />
RATE FC 000 NZ$000 NZ$000<br />
USD<br />
Less than 3 months 0.737 274 372 (41)<br />
3 months and beyond 0.721 3,575 4,961 (542)<br />
EUR<br />
3 months and beyond 0.515 150 292 (19)<br />
GBP<br />
Less than 3 months 0.452 88 194 (23)<br />
AUD<br />
Less than 3 months 0.734 3,113 4,241 (216)<br />
3 months and beyond 0.758 420 554 (23)<br />
Total forward foreign exchange contracts 10,614 (864)<br />
PAGE 106 <strong>2012</strong> financial report
<strong>Watercare</strong> Services Limited<br />
<strong>2012</strong> ANNUAL REPORT<br />
NOTES TO THE FINANCIAL STATEMENTS (continued)<br />
FOR THE YEAR ENDED 30 JUNE <strong>2012</strong><br />
22. FINANCIAL ASSETS AND LIABILITIES (continued)<br />
Foreign currency sensitivity<br />
The following sensitivity analysis is based on the foreign currency risk exposures in existence at year-end. At balance date, had the New Zealand dollar<br />
exchange rate changed, as illustrated in the table below, with all other variables held constant, post-tax deficit and equity would have been affected<br />
as follows:<br />
Post-tax deficit<br />
(Higher)/lower<br />
<strong>2012</strong> 2011<br />
Group and Company<br />
Equity<br />
Higher/(lower)<br />
Post-tax deficit<br />
(Higher)/lower<br />
Group and Company<br />
Equity<br />
Higher/(lower)<br />
Sensitivity to reasonable movements $000 $000 $000 $000<br />
Change in United States dollar exchange rate<br />
10% increase (123) (123) (309) (309)<br />
10% decrease 150 150 380 380<br />
Change in Euro Monetary Union euro exchange rate<br />
10% increase – – (18) (18)<br />
10% decrease – – 22 22<br />
Change in United Kingdom pound exchange rate<br />
10% increase – – (11) (11)<br />
10% decrease – – 13 13<br />
Change in Australian dollar exchange rate<br />
10% increase (33) (33) (289) (289)<br />
10% decrease 40 40 353 353<br />
Credit risk<br />
Credit risk is the risk that a counterparty will default on its contractual obligations resulting in financial loss to the group. Financial instruments which<br />
potentially subject the group to credit risk principally consist of cash and cash equivalents, derivative assets held for risk management, and trade and<br />
other receivables.<br />
The group’s cash and cash equivalents are placed with major trading banks with a minimum AA- credit rating assigned by international credit-rating<br />
agencies. Debtors and other receivables arise from the group’s statutory functions. Therefore, there are no procedures in place to monitor the credit quality<br />
of debtors and other receivables with reference to credit evaluations or external credit rating. However, there was no concentration of credit risk with<br />
respect to receivables as the company has a large number of customers. The ageing of the trade receivables at balance date was as follows:<br />
Carrying<br />
amount<br />
<strong>2012</strong> 2011<br />
Group and Company<br />
Provision for<br />
doubtful debts<br />
Net carrying<br />
amount<br />
Carrying<br />
amount<br />
Group and Company<br />
Provision for<br />
doubtful debts<br />
Carrying<br />
amount<br />
$000 $000 $000 $000 $000 $000<br />
Not past due 22,395 (75) 22,320 18,415 – 18,415<br />
Past due one to thirty days 2,466 (198) 2,268 7,229 (302) 6,927<br />
Past due thirty to sixty days 1,624 (156) 1,468 3,337 (124) 3,213<br />
Past due more than sixty days 8,658 (2,776) 5,882 12,128 (2,702) 9,426<br />
Total 35,143 (3,205) 31,938 41,109 (3,128) 37,981<br />
<strong>2012</strong> 2011<br />
Group and Company Group and Company<br />
Movement in the provision for doubtful debts $000 $000<br />
Balance at 1 July 2011 3,128 –<br />
Acquisition through integration on 1 November 2010 – 1,845<br />
additions during the year 689 1,313<br />
Bad debts written off (612) (30)<br />
Balance at 30 June <strong>2012</strong> 3,205 3,128<br />
<strong>2012</strong> financial report PAGE 107
<strong>Watercare</strong> Services Limited<br />
<strong>2012</strong> ANNUAL REPORT<br />
NOTES TO THE FINANCIAL STATEMENTS (continued)<br />
FOR THE YEAR ENDED 30 JUNE <strong>2012</strong><br />
22. FINANCIAL ASSETS AND LIABILITIES (continued)<br />
Liquidity risk<br />
Liquidity risk is the risk arising from the group not being able to meet its financial obligations.<br />
Ultimate responsibility for liquidity risk management rests with the board of directors, which has an appropriate liquidity risk management framework<br />
for the management of the group’s short, medium and long-term funding and liquidity management requirements. The group manages liquidity risk by<br />
maintaining adequate reserves and banking facilities, monitoring forecast and actual cash flows and by matching this with the maturity profiles of<br />
financial liabilities.<br />
The group’s objective is to maintain a balance between continuity of funding and flexibility through the use of medium-term notes, term loans, overdraft,<br />
revolving credit facility and commercial paper. The liquidity risk associated with the short-term commercial paper debt is mitigated by a standby facility of<br />
$200 million.<br />
The following tables detail the gross undiscounted cash flows of the financial liabilities on the basis of their earliest possible contractual maturity (including<br />
interest payments where applicable). Cash flows for financial liabilities without fixed amount or timing restrictions are based on the conditions existing at<br />
balance date.<br />
Gross contractual maturity analysis<br />
CURRENT<br />
NON-CURRENT<br />
Group and Company<br />
0-6 months 7-12 months 1-2 years 2-3 years Over 3 years<br />
Gross nominal<br />
cash outflow<br />
<strong>2012</strong> $000 $000 $000 $000 $000 $000 $000<br />
Carrying<br />
amount<br />
Financial liabilities<br />
Trade and other payables 24,484 – – – – 24,484 24,484<br />
Accrued expenses* 55,918 – – – – 55,918 55,918<br />
Forward exchange contracts 6 68 – – – 74 74<br />
Interest rate swaps 9,805 10,941 20,067 14,554 110,036 165,403 133,624<br />
Borrowings 221,813 72,759 356,466 321,740 533,890 1,506,668 1,296,066<br />
Total 312,026 83,768 376,533 336,294 643,926 1,752,547 1,510,166<br />
CURRENT<br />
NON-CURRENT<br />
Group and Company<br />
0-6 months 7-12 months 1-2 years 2-3 years Over 3 years<br />
Gross nominal<br />
cash outflow<br />
2011 $000 $000 $000 $000 $000 $000 $000<br />
Carrying<br />
amount<br />
Financial liabilities<br />
Bank overdraft 558 – – – – 558 558<br />
Trade and other payables 16,157 – – – – 16,157 16,157<br />
Accrued expenses* 63,031 – – – – 63,031 63,031<br />
Forward exchange contracts 494 212 158 – – 864 864<br />
Interest rate swaps 10,009 7,948 10,550 9,379 29,347 67,233 61,420<br />
Borrowings 246,618 53,542 157,902 351,628 649,018 1,458,708 1,228,899<br />
Total 336,867 61,702 168,610 361,007 678,365 1,606,551 1,370,929<br />
* Excludes current and non-current income received in advance of $14.8 million (2011: $14 million) as it was not categorised as a financial liability, refer<br />
Note 19, page 100.<br />
The group monitors rolling forecasts of liquidity reserves on the basis of expected cash flow. At balance date the group had $267 million of unused credit<br />
facilities (commercial paper, overdraft facility and revolving credit facility) available for its immediate use (2011: $318 million).<br />
PAGE 108 <strong>2012</strong> financial report
<strong>Watercare</strong> Services Limited<br />
<strong>2012</strong> ANNUAL REPORT<br />
NOTES TO THE FINANCIAL STATEMENTS (continued)<br />
FOR THE YEAR ENDED 30 JUNE <strong>2012</strong><br />
22. FINANCIAL ASSETS AND LIABILITIES (continued)<br />
Capital management<br />
The capital structure of the group consists of equity attributable to the owners of the parent, comprising issued capital, reserves and retained earnings as<br />
disclosed on page 77 and debt including borrowings and covenants compliance as disclosed in Note 21 on page 102.<br />
The group’s policy is to maintain a strong capital base so as to maintain investor, creditor and market confidence and to sustain future development of<br />
the business. The objective of the group is to maintain an optimal capital structure to reduce the cost of capital. In ensuring that the group has sufficient<br />
solvency to satisfy all its operational needs, it closely monitors the ratio between the funds that it receives from operation and its finance costs.<br />
The group continues to focus on the maintenance of the long-term integrity of its assets whilst keeping the overall costs to its customers at minimum levels<br />
and there has been no change in the group’s overall strategy for capital management during the years ended 30 June <strong>2012</strong> and 30 June 2011.<br />
23. RELATED PARTIES<br />
<strong>2012</strong> 2011<br />
Shareholder % Shares % Shares<br />
Auckland Council 100% 260,693,164 100% 260,693,164<br />
Other related parties<br />
During the prior year, Metrowater Limited and Manukau Water Limited (subsidiaries of Auckland City Council and Manukau City Council respectively) were<br />
related parties until integration with the company on 1 November 2010. Metrowater Community Trust (formerly a Metrowater Limited subsidiary) and<br />
Auckland City Water Limited (dormant company) were related parties until 1 November 2010 after which they became subsidiaries of the company.<br />
Details of the integration of retail business are disclosed in Note 11, page 91. The group’s subsidiaries are set out in Note 11, page 90.<br />
Transactions with related parties<br />
<strong>Watercare</strong> entered into borrowing arrangements with Auckland Council on the terms set out in Note 21, page 102. <strong>Watercare</strong> also entered into interest<br />
rate swap arrangements with Auckland Council (with a notional value of $130 million, 2011: $155 million) with a fair value of $3.7 million<br />
(2011: $5.1 million) as at balance date. The balances outstanding and transactions relating to the borrowings from Auckland Council during the year<br />
were as follows:<br />
<strong>2012</strong> 2011<br />
Group and Company Group and Company<br />
$000 $000<br />
Loans from Auckland Council 476,800 543,258<br />
Interest payable on loans from Auckland Council 5,434 6,036<br />
Interest paid on loans from Auckland Council 22,702 15,688<br />
Loans repaid to Auckland Council 66,458 168,800<br />
Interest receivable on interest rate swaps with Auckland Council 316 305<br />
Interest paid on swaps (net) with Auckland Council 3,367 –<br />
During the year the group provided funding to its subsidiaries listed in Note 11, page 90. Also in the normal course of business, <strong>Watercare</strong> received monies<br />
and incurred expenses on behalf of Te Motu A Hiaroa (Puketutu Island) Governance Trust and at balance date $236,427 was payable to the Trust<br />
by the group.<br />
The group provides retail water and wastewater services to its parent, Auckland Council and its controlled, jointly controlled and significantly influenced<br />
entities as well as to key management personnel of the company and its parent. These sales take place in the normal course of business. The group<br />
also entered into sales and purchases transactions with related parties in the normal course of business such as the payment of rates. These were not<br />
collectively significant. During the prior year, until integration on 1 November 2010 the group supplied bulk water and wastewater services predominantly<br />
to related parties in the Auckland region.<br />
<strong>2012</strong> 2011<br />
Group and Company Group and Company<br />
$000 $000<br />
Sales to related parties 94,783 136,058<br />
Trade receivables – related parties 1,445 2,985<br />
Purchases from related parties 4,247 2,915<br />
Trade payables – related parties 327 1,201<br />
receivable accruals 1,531 –<br />
Payables accruals 7,240 7,894<br />
<strong>2012</strong> financial report PAGE 109
<strong>Watercare</strong> Services Limited<br />
<strong>2012</strong> ANNUAL REPORT<br />
NOTES TO THE FINANCIAL STATEMENTS (continued)<br />
FOR THE YEAR ENDED 30 JUNE <strong>2012</strong><br />
24. COMMITMENTS<br />
<strong>2012</strong> 2011<br />
Group and Company Group and Company<br />
$000 $000<br />
Capital expenditure<br />
The capital expenditure committed to, but not recognised in these financial statements, at balance date was:<br />
Buildings 174 488<br />
Pipelines 251,376 63,463<br />
Tanks, tunnels, roads and reservoirs 1,000 4,295<br />
intangibles 556 –<br />
Other 20,290 35,018<br />
Total capital expenditure commitments 273,396 103,264<br />
Anticipated payment schedule:<br />
Less than one year 90,608 79,636<br />
One to two years 11,547 22,713<br />
Two to five years 171,241 915<br />
Total capital expenditure commitments 273,396 103,264<br />
The commitments relate to the following projects:<br />
Wastewater treatment plant 8,197 4,109<br />
Water treatment plants 3,838 10,253<br />
Bulk supply meters 6,793 6,797<br />
Expansion of the Waikato water treatment plant 7,136 11,156<br />
South Western interceptor 418 13,019<br />
Stage 1 Northern Waitakere wastewater 5,182 6,985<br />
Hunua No 4 Trunk Water Main 192,663 1,743<br />
Other projects 49,169 49,202<br />
Total capital expenditure commitments 273,396 103,264<br />
Operating leases<br />
Anticipated payments under non-cancellable operating leases:<br />
Less than one year 3,229 3,159<br />
One to two years 2,942 3,003<br />
Two to five years 4,584 6,361<br />
Beyond five years 49,312 49,288<br />
Total lease commitments 60,067 61,811<br />
The major lease commitments relate to long-term leases of the land forming the water catchments areas, which expires in July 2092. The annual rental of<br />
$510,000 (2011: $510,000) was included in these commitments at face value. Other leases include Newmarket office, East Tamaki office, parks, reservoirs<br />
and office equipment.<br />
PAGE 110 <strong>2012</strong> financial report
<strong>Watercare</strong> Services Limited<br />
<strong>2012</strong> ANNUAL REPORT<br />
NOTES TO THE FINANCIAL STATEMENTS (continued)<br />
FOR THE YEAR ENDED 30 JUNE <strong>2012</strong><br />
25. CONTINGENCIES<br />
In November 2011, the Department of Labour commenced proceedings against <strong>Watercare</strong> Services Limited for three charges laid in relation to the<br />
Onehunga gas explosion incident. In the event that <strong>Watercare</strong> Services Limited is proven to be liable, the maximum liability for each charge is estimated to<br />
be approximately $250,000.<br />
In the normal course of its business the group was exposed to claims, legal proceedings and arbitrations that may in some cases result in costs to the group.<br />
The directors believe that these were adequately provided for by the group within Note 20, page 100 of these financial statements and no additional<br />
material contingent liabilities requiring disclosure have been identified.<br />
26. RETIREMENT BENEFIT PLANS<br />
The employees of the group can elect to join the KiwiSaver scheme. KiwiSaver is a work-based savings scheme run through a selection of private providers.<br />
The obligation of the group is to contribute a specified percentage of payroll costs to the KiwiSaver scheme in line with employee contributions and the<br />
only obligation of the group to the KiwiSaver scheme was to make the specified contributions.<br />
The total defined contribution expense recognised in the surplus or deficit for <strong>2012</strong> was $798,338 (2011: $566,483).<br />
27. REMUNERATION<br />
The directors and key management personnel are included in this compensation.<br />
<strong>2012</strong> 2011<br />
Group and Company Group and Company<br />
Compensation of directors and key management personnel $000 $000<br />
Employees’ salaries and wages and directors’ fees 3,489 4,046<br />
Post-employment benefits 60 67<br />
Other long-term employee benefits – 8<br />
Termination benefits – 45<br />
Total compensation for directors and key executives 3,549 4,166<br />
<strong>2012</strong> 2011<br />
Group and Company Group and Company<br />
Directors’ remuneration Appointed $000 $000<br />
Graeme Hawkins (retired December 2010) december 2002 – 96<br />
David Clarke (Deputy Chairman) July 2008 66 72<br />
Peter Drummond march 2010 50 65<br />
Susan Huria July 2008 53 66<br />
Ross Keenan (Chairman) march 2010 96 100<br />
Patrick Snedden (resigned December 2011) december 2002 26 66<br />
Jeff Todd May 2007 60 77<br />
tony Lanigan may 2011 53 9<br />
catherine Harland may 2011 53 9<br />
mike Allen december 2011 27 0<br />
Total 484 560<br />
Directors’ fees paid during the 2011 financial year included additional fees of $165,451 paid to directors as a result of the increased workload and<br />
commitment leading up to the integration. Of this amount, $94,312 was a back payment relating to the year ended 30 June 2010.<br />
28. EVENTS OCCURRING AFTER BALANCE DATE<br />
No significant events have occurred since balance date requiring disclosure in these financial statements.<br />
<strong>2012</strong> financial report PAGE 111
<strong>Watercare</strong> Services Limited<br />
<strong>2012</strong> ANNUAL REPORT<br />
STATUTORY INFORMATION<br />
FOR THE YEAR ENDED 30 JUNE <strong>2012</strong><br />
EMPLOYEES REMUNERATION RANGE<br />
The table below shows the number of employees and former employees of the group, who in their capacity as employees, received remuneration and other<br />
benefits during the year of at least $100,000.<br />
<strong>2012</strong><br />
Group and Company<br />
Number of employees<br />
Employee remuneration range<br />
Remuneration<br />
Remuneration including<br />
redundancy & restructuring *<br />
Total<br />
$100,000 – $110,000 43 43<br />
$110,001 – $120,000 22 22<br />
$120,001 – $130,000 22 1 23<br />
$130,001 – $140,000 18 18<br />
$140,001 – $150,000 5 5<br />
$150,001 – $160,000 3 3<br />
$160,001 – $170,000 2 2<br />
$170,001 – $180,000 2 2<br />
$180,001 – $190,000 2 2<br />
$190,001 – $200,000 1 1<br />
$200,001 – $210,000 5 5<br />
$210,001 – $220,000 4 4<br />
$220,001 – $230,000 1 1<br />
$230,001 – $240,000 ** 1 1<br />
$240,001 – $250,000 2 2<br />
$270,001 – $280,000 1 1<br />
$300,001 – $310,000 1 1<br />
$330,001 – $340,000 2 2<br />
$370,001 – $380,000 ** 1 1<br />
$710,001 – $720,000 1 1<br />
* Includes $60,296 in redundancy and outstanding annual leave entitlements.<br />
** Includes outstanding leave entitlements paid out on termination.<br />
PAGE 112 <strong>2012</strong> financial report
<strong>Watercare</strong> Services Limited<br />
<strong>2012</strong> ANNUAL REPORT<br />
<strong>2012</strong> STATEMENT OF SERVICE PERFORMANCE<br />
(non-financial performance measures)<br />
Environmental Care<br />
(a)<br />
To promote conservation of the region’s water resources.<br />
(i) To maintain regional unaccounted for water losses at less than 17.7 million m 3 .<br />
<br />
A proportion of the water supplied by <strong>Watercare</strong> is not invoiced (non-revenue water) because it is used as part of the production process (such as<br />
flushing), for fire fighting, is meter inaccuracy or unauthorised usage. Some of these volumes are calculated based on the best information available<br />
and other industry accepted parameters. The balance of non-revenue water is unaccounted for water losses and was estimated at 15.2 million m 3<br />
against a target of 17.7 million m 3 for 2011/12.<br />
(b)<br />
To ensure the impact of the company’s activities on the environment is controlled.<br />
(i) Compliance with treatment plant discharge consents (excludes minor or technical non-compliance).<br />
Compliance with consents at the major urban wastewater treatment plants was 99% against a target of 100%. The non-compliance reported this year<br />
was due to illegal trade waste discharge and an off-site power failure, circumstances beyond <strong>Watercare</strong>’s control. There were several transient periods<br />
of technical or minor non-compliance 1 at the Mangere Wastewater Treatment Plant during the year. An upgrade programme has been implemented to<br />
address these.<br />
The remaining non-compliance levels were influenced by the poor performance of some of the rural wastewater treatment plants transferred to<br />
<strong>Watercare</strong> by councils upon integration. These plants performed at 64% against a target of 65%, by 2015, and a target of 100% compliance by 2020.<br />
<strong>Watercare</strong> has developed a longer-term strategy and more immediate measures, forecast to cost $50 million, to reduce the impacts of these plants on<br />
the environment.<br />
(ii) No successful Resource Management Act prosecutions against <strong>Watercare</strong>.<br />
there were no Resource Management Act prosecutions.<br />
Health, Safety and Wellbeing<br />
(a)<br />
To promote staff productivity and wellbeing.<br />
(i) To attain a lost-time injury frequency rate (LTIFR) of less than or equal to 5 hours per million hours worked.<br />
<strong>Watercare</strong> staff achieved a LTIFR rate of 1.39 which was within the target range.<br />
(ii) To target an unplanned absenteeism rate of less than 2.5%.<br />
<strong>Watercare</strong> achieved an unplanned absenteeism rate of 1.81% which achieved the target.<br />
(iii) To target annual staff turnover in the target range 10-12%.<br />
Voluntary staff turnover at 11.81% was within the target of 10 to 12% which is generally recognised as a healthy staffing refreshment rate.<br />
(b)<br />
To provide comprehensive development programmes.<br />
(i) To target a ratio of less than 1.6:1 of external to internal appointments.<br />
the ratio of new hires (excluding entry positions) to promotions is monitored and a more challenging target was set for this year of 1.6:1 compared<br />
to 2.25:1 last year. During the period <strong>Watercare</strong> achieved a ratio of 1 promotion to every 1.71 new hires, due to the nature of the candidate pool.<br />
(c)<br />
To provide employees with safe working conditions.<br />
(i) To maintain the tertiary level ACC workplace management practices accreditation.<br />
acc tertiary level accreditation was maintained following an audit in December 2011.<br />
Stakeholder Relationships<br />
(a) To maintain sound governance and contribute to the development of a productive working relationship with the Shareholder.<br />
(i) To hold briefings with the Shareholder at least quarterly and to undertake Council briefings as requested.<br />
<strong>Watercare</strong> briefed the Auckland Council formerly through quarterly reports and quarterly briefings through the year. The <strong>Watercare</strong> Board of Directors<br />
hosted the Auckland Council Councillors for a combined strategy session in May in preparation for the development of a new Water Strategy.<br />
1<br />
For instance, a technical non-compliance might be late completion of documentation, minor non-compliance might be a single reading above a target the impact<br />
of which is total load based where there is no material impact on the environment. In each case, the regulator, Auckland Council, our related party, is fully informed.<br />
<strong>2012</strong> financial report PAGE 113
<strong>Watercare</strong> Services Limited<br />
<strong>2012</strong> ANNUAL REPORT<br />
<strong>2012</strong> STATEMENT OF SERVICE PERFORMANCE (continued)<br />
(non-financial performance measures)<br />
Customer Service Commitment<br />
(a)<br />
To supply high quality and reliable drinking water.<br />
(i) To maintain 100% compliance with the Ministry of Health’s drinking water standards at graded plants.<br />
<strong>Watercare</strong> fully met the target in respect of the achievement of the Ministry of Health’s Drinking Water Standards for New Zealand (DWSNZ) at<br />
Ministry of Health-graded water treatment plants which supply the bulk of the drinking water to the Auckland Region. The DWSNZ standards are based<br />
on a quality assurance approach, underpinned by the requirement to develop public health risk-management plans.<br />
This is verified through a sampling programme at the water treatment plants and in the reticulation network, where approximately 80 sites are sampled<br />
per day. Compliance with the DWSNZ is reported in the Water Information for New Zealand (WINZ) database, and is assessed by the Drinking Water<br />
Assessor on an annual basis. The next assessment of grading for qualifying water treatment plants will take place in the final quarter of the <strong>2012</strong><br />
calendar year.<br />
(ii) To maintain the public health grading of water treatment plants and networks of ‘Aa’.<br />
Water quality has been maintained based on the 2010 grading assessment carried out by the Auckland District Health Board on behalf of the<br />
Ministry of Health 2 . All the metropolitan water treatment plants that supply the bulk of drinking water to the people in the Auckland Region meet the<br />
‘A’ grade standard.<br />
Of the smaller non-metropolitan plants transferred to <strong>Watercare</strong> on 1 November 2010, nine remain ungraded. <strong>Watercare</strong> is continuing with a<br />
programme of work to ensure all plants meet the ‘A’ grade standard by 2020, at a capital cost of $100 million for both water treatment plants and the<br />
distribution network.<br />
The same risk-based assessment used for water treatment plants also applies to the pipes and pump stations that make up the water distribution<br />
networks. The metropolitan network is graded ‘a’ under the Ministry of Health’s standards and supplies the bulk of the drinking water to the people<br />
in the Auckland Region. Of the 15 non-metropolitan networks (inherited on 1 November 2010), three are ‘a’ graded, three are ‘b’ graded and 9 are<br />
ungraded. <strong>Watercare</strong> has set in place a programme to ensure that all the networks meet the ‘a’ grade standard by 2020.<br />
(b)<br />
To provide for the safe transportation, treatment and disposal of bulk wastewater.<br />
(i) To target no more than fifteen dry-weather sewer overflows per 100km of wastewater pipe length per annum.<br />
<strong>Watercare</strong> reports on the number of wastewater overflows from its retail network during dry weather as a measure of the ability of the network to<br />
manage current demand. The result for 2011/12 was 2.3 overflows per 100km of waste water pipe.<br />
Asset Management<br />
(a)<br />
To develop and implement effective and efficient capital investment and maintenance programmes.<br />
(i) To ensure that capital projects have robust business cases.<br />
All <strong>Watercare</strong> capital projects are supported by robust business cases and are managed to ensure delivery to plan in a timely and cost effective manner.<br />
Performance of the project portfolio is reported on a monthly basis to the Board and quarterly to the shareholder, Auckland Council.<br />
Economic Performance<br />
(a)<br />
To ensure that financial strategies are consistent with achieving economic efficiency, intergenerational equity and an optimal cost<br />
of capital.<br />
(i) To meet the requirements of the Auckland City Council guarantee of <strong>Watercare</strong>’s debt.<br />
all requirements of the guarantee were met.<br />
(ii) To achieve a minimum funds flow from operations (FFO) to interest cover of 2.5 times before any price adjustments.<br />
The funds from operations (FFO) to interest cover ratio for the year ending 30 June <strong>2012</strong> was 3.23, higher than the budget figure of 2.94 and the<br />
required target a minimum of 2.50. Cost savings achieved during the year lead to lower than budgeted operating expenses and more than offset<br />
the reduced revenues arising from lower than projected water volumes.<br />
(b)<br />
To ensure that the regime for the pricing of water and wastewater services is enduring, transparent and reliable.<br />
(i) <strong>Annual</strong> (2011/12) average increase in total price of water services per property consistent with the current capital programme.<br />
A legacy of disparate volumetric and fixed water tariffs from the former councils in the Auckland region was replaced with a uniform water tariff of<br />
$1.30 (including GST) per cubic metre with effect from 1 July 2011, representing a decrease of 15% in budgeted water revenue. The uniform tariff was<br />
set to deliver water revenue consistent with the 2011/12 Funding Plan, which in turn was based on the current capital programme.<br />
(ii) <strong>Annual</strong> (2011/12) average increase in total price of wastewater services per property consistent with the current capital programme.<br />
All retail wastewater tariffs were increased uniformly by 4.5% with effect from 1 July 2011 in order to deliver wastewater revenue consistent with the<br />
2011/12 Funding Plan, which in turn was based on the current capital programme.<br />
(c)<br />
To ensure efficiency in capital expenditure is maintained.<br />
(i) To report capital expenditure relative to budget for water and wastewater.<br />
<strong>Watercare</strong>’s target is that capital expenditure should be within 20% of the approved financial budget. For 2011/12 the actual capital expenditure was<br />
96.5%, which was within 3.5% of budget.<br />
2<br />
The next grading assessment is due in the last calendar quarter of <strong>2012</strong>.<br />
PAGE 114 <strong>2012</strong> financial report
<strong>Watercare</strong> Services Limited<br />
<strong>2012</strong> ANNUAL REPORT<br />
<strong>2012</strong> STATEMENT OF SERVICE PERFORMANCE (continued)<br />
(non-financial performance measures)<br />
Customer Services Performance<br />
(a)<br />
To maintain delivery of cost-effective services.<br />
(i) To maintain the average household bill at less than 1.5% of the average household income.<br />
the average monthly household water and wastewater bill from <strong>Watercare</strong> was $52.30 for the period 1 July 2011 to 30 Jun <strong>2012</strong>. Based on<br />
Statistics NZ average monthly household income in Auckland of $7,219, the bill represents 0.72% of the average household income.<br />
(b)<br />
To maintain delivery of high quality water and wastewater services.<br />
(i) 80% of customers surveyed satisfied with overall water and wastewater services.<br />
Of the customers who contacted <strong>Watercare</strong> to report faults and were surveyed by independent researchers, 82.2% were satisfied, this being an<br />
overall score of at least 7 out of a possible 9.<br />
(ii) To achieve less than five water quality complaints per 1,000 connections.<br />
<strong>Watercare</strong> monitors the number and type of water quality complaints received from customers. The result of 4.1 complaints per 1000 connections<br />
covering taste, odour and appearance per 1,000 connections was lower than the target of five per year.<br />
(c)<br />
To maintain good customer relationships.<br />
(i) To ensure 95% of all complaints and enquiries are “closed” within 10 working days.<br />
The target of ‘closed’ complaints and enquiries measures the time taken for an issue to be resolved and feedback given to the customer. A 10-day<br />
target is considered industry best practice. Performance was 99.7% for the 2011/12 period. Complaints performed at 96.4% and enquiries at 99.8%.<br />
Complaints (1,355) made up 5.1% of the total enquiries (26,762).<br />
(ii) To achieve an average call centre operator connect time of
<strong>Watercare</strong> Services Limited<br />
<strong>2012</strong> ANNUAL REPORT<br />
G3 cross-reference tabLe<br />
KEY:<br />
Fully reported<br />
Partially reported<br />
Not reported<br />
<strong>Watercare</strong>’s <strong>Annual</strong> <strong>Report</strong> <strong>2012</strong> has been prepared in accordance with the G3 framework of the Global <strong>Report</strong>ing<br />
Initiative (GRI) Sustainability <strong>Report</strong>ing Guidelines. This framework exists to assist organisations to report their<br />
economic, environmental and social performance in a consistent and comparable manner. The following pages show<br />
how <strong>Watercare</strong> reports its performance against the G3 indicators. Against each indicator, <strong>Watercare</strong> has fully reported,<br />
partially reported or not reported. The key (left) explains the symbols used. The GRI disclosures for strategy and<br />
analysis, organisational profile, report parameters in governance and management approach (parts I and II)<br />
are excluded from the G3 cross-reference table but are covered in pages 1 to 62 of this report.<br />
The GRI aims, objectives and guidelines can be found on their website www.globalreporting.org.<br />
ECONOMIC INDICATORS<br />
ASPECT: ECONOMIC PERFORMANCE REFERENCE RULER<br />
EC1<br />
Direct economic value generated and distributed, including revenues, operating costs, employee compensation,<br />
donations and other community investments, retained earnings, and payments to capital providers and governments.<br />
Page 63-116<br />
EC2 Financial implications and other risks and opportunities for the organisation’s activities due to climate change. Figure 61<br />
EC3 Coverage of the organisation’s defined benefit plan obligations. Figure 24 3E<br />
EC4 Significant financial assistance received from government. Self funded<br />
ASPECT: MARKET PRESENCE REFERENCE RULER<br />
EC5 Range of ratios of standard entry level wage compared to local minimum wage at significant locations of operation. Figure 24 3E<br />
EC6 Policy, practices, and proportion of spending on locally-based suppliers at significant locations of operation. Figure 55; 56<br />
EC7<br />
Procedures for local hiring and proportion of senior management hired from the local community at significant locations<br />
of operation.<br />
Merit based<br />
ASPECT: indirect economic impacts REFERENCE RULER<br />
EC8<br />
Development and impact of infrastructure investments and services provided primarily for public benefit through<br />
commercial, in-kind, or pro bono engagement.<br />
Figure 54<br />
EC9 Understanding and describing significant indirect economic impacts, including the extent of impacts. Page 46 5A<br />
ENVIRONMENTAL INDICATORS<br />
ASPECT: MATERIALS REFERENCE RULER<br />
EN1 Materials used by weight or volume. Figure 52<br />
EN2 Percentage of materials used that are recycled input materials. Figure 52<br />
ASPECT: ENERGY REFERENCE RULER<br />
EN3 Direct energy consumption by primary energy source. Figure 42<br />
EN4 Indirect energy consumption by primary source. Being revised<br />
EN5 Energy saved due to conservation and efficiency improvements. Being revised<br />
EN6<br />
Initiatives to provide energy-efficient or renewable energy based products and services, and reductions in energy<br />
requirements as a result of these initiatives.<br />
Figure 42<br />
6B<br />
EN7 Initiatives to reduce indirect energy consumption and reductions achieved. 6B<br />
ASPECT: WATER REFERENCE RULER<br />
EN8 Total water withdrawal by source. Figure 1<br />
EN9 Water sources significantly affected by withdrawal of water. Pages 24-28; 54-56<br />
EN10 Percentage and total volume of water recycled and reused. Figure 1<br />
ASPECT: BIODIVERSITY REFERENCE RULER<br />
EN11<br />
Location and size of land owned, leased, managed in, or adjacent to, protected areas and areas of high biodiversity value<br />
outside protected areas.<br />
Figure 46<br />
6F<br />
EN12<br />
Description of significant impacts of activities, products, and services on biodiversity in protected areas and areas of<br />
high biodiversity value outside protected areas.<br />
Figure 47<br />
6E<br />
EN13 Habitats protected or restored. Figure 46 6F<br />
EN14 Strategies, current actions and future plans for managing impacts on biodiversity. Figure 46 6F<br />
EN15<br />
Number of IUCN Red List species and national conservation list species with habitats in areas affected by operations,<br />
by level of extinction risk.<br />
Under review<br />
PAGE 116 <strong>2012</strong> financial report
<strong>Watercare</strong> Services Limited<br />
<strong>2012</strong> ANNUAL REPORT<br />
G3 cross-reference tabLe (continued)<br />
ENVIRONMENTAL INDICATORS (CONTINUED)<br />
ASPECT: emissions, effluents and waste REFERENCE RULER<br />
EN16 Total direct and indirect greenhouse gas emissions by weight. Figure 37 6A<br />
EN17 Other relevant indirect greenhouse gas emissions by weight. Figure 37 6A<br />
EN18 Initiatives to reduce greenhouse gas emissions and reductions achieved. Figure 38 6A<br />
EN19 Emissions of ozone-depleting substances by weight. Figure 37<br />
EN20 NOx, SOx, and other significant air emissions by type and weight. Figure 38 6A<br />
EN21 Total water discharge by quality and destination. Figure 15 2C<br />
EN22 Total weight of waste by type and disposal method. Figure 42-45 6C; 6D<br />
EN23 Total number and volume of significant spills. Figure 17 2B<br />
EN24<br />
EN25<br />
Weight of transported, imported, exported, or treated waste deemed hazardous under the terms of the Basel Convention<br />
Annex I, II, III, and VIII, and percentage of transported waste shipped internationally.<br />
Identity, size, protected status, and biodiversity value of water bodies and related habitats significantly affected by the<br />
reporting organisation’s discharges of water and runoff.<br />
No international<br />
transport<br />
Pages 50-51;<br />
44-47<br />
Figure 15; 46; 47<br />
ASPECT: products and services REFERENCE RULER<br />
EN26 Initiatives to mitigate environmental impacts of products and services, and extent of impact mitigation. Pages 6-7<br />
EN27 Percentage of products sold and their packaging materials that are reclaimed by category. Not applicable<br />
ASPECT: compliance REFERENCE RULER<br />
EN28<br />
Monetary value of significant fines and total number of non-monetary sanctions for non-compliance with environmental<br />
laws and regulations.<br />
Table 14<br />
5C<br />
ASPECT: TRANSPORT REFERENCE RULER<br />
EN29<br />
Significant environmental impacts of transporting products and other goods and materials used for the organisation’s<br />
operations, and transporting members of the workforce.<br />
Not significant<br />
ASPECT: OVERALL REFERENCE RULER<br />
EN30 Total environmental protection expenditures and investments by type. Pages 63-116<br />
Figure 7; 61<br />
LABOUR PRACTICES AND DECENT WORK INDICATORS<br />
ASPECT: emPLOYMENT REFERENCE RULER<br />
LA1 Total workforce by employment type, employment contract, and region. Figure 28<br />
LA2 Total number and rate of employee turnover by age group, gender and region. Figure 23; 25 3D; 3F<br />
LA3 Benefits provided to full-time employees that are not provided to temporary or part-time employees, by major operations. Figure 28<br />
ASPECT: LABOUR/MANAGEMENT RELATIONS REFERENCE RULER<br />
LA4 Percentage of employees covered by collective bargaining agreements. Figure 28<br />
LA5<br />
Minimum notice period(s) regarding significant operational changes, including whether it is specified in collective<br />
agreements.<br />
Figure 28<br />
ASPECT: OCCUPATIONAL HEALTH AND SAFETY REFERENCE RULER<br />
LA6<br />
Percentage of total workforce represented in formal joint management-worker health and safety committees that help<br />
monitor and advise on occupational health and safety programmes.<br />
Figure 21<br />
LA7 Rates of injury, occupational diseases, lost days, and absenteeism, and number of work-related fatalities by region. Figure 20; 22 3A; 3B; 3C<br />
LA8<br />
Education, training, counselling, prevention, and risk-control programmes in place to assist workforce members, their<br />
families, or community members regarding serious diseases.<br />
Figure 21<br />
3E<br />
LA9 Health and safety topics covered in formal agreements with trade unions. Figure 21<br />
<strong>2012</strong> financial report PAGE 117
<strong>Watercare</strong> Services Limited<br />
<strong>2012</strong> ANNUAL REPORT<br />
G3 cross-reference tabLe (continued)<br />
LABOUR PRACTICES AND DECENT WORK INDICATORS (CONTINUED)<br />
ASPECT: TRAINING AND EDUCATION REFERENCE RULER<br />
LA10 Average hours of training per year per employee by employee category. Figure 24 3E<br />
LA11<br />
Programmes for skills management and lifelong learning that support the continued employability of employees and assist<br />
them in managing career endings.<br />
Figure 28<br />
3C<br />
LA12 Percentage of employees receiving regular performance and career development reviews. Figure 28<br />
ASPECT: diversity and equal opportunity REFERENCE RULER<br />
LA13<br />
Composition of governance bodies and breakdown of employees per category according to gender, age group, minority<br />
group membership, and other indicators of diversity.<br />
Figure 26<br />
3G<br />
LA14 Ratio of basic salary of men to women by employee category. Figure 26<br />
HUMAN RIGHTS INDICATORS<br />
ASPECT: INVESTMENT AND PROCUREMENT PRACTICES REFERENCE RULER<br />
HR1<br />
Percentage and total number of significant investment agreements that include human rights clauses or that have<br />
undergone human rights screening.<br />
Not applicable<br />
HR2 Percentage of significant suppliers and contractors that have undergone screening on human rights and actions taken. Not applicable<br />
HR3<br />
Total hours of employee training on policies and procedures concerning aspects of human rights that are relevant to<br />
operations, including the percentage of employees trained.<br />
Not applicable<br />
ASPECT: NON-DISCRIMINATION REFERENCE RULER<br />
HR4 Total number of incidents of discrimination and actions taken. None recorded<br />
ASPECT: FREEDOM OF ASSOCIATION AND COLLECTIVE BARGAINING REFERENCE RULER<br />
HR5<br />
Operations identified in which the right to exercise freedom of association and collective bargaining may be at significant<br />
risk, and actions taken to support these rights.<br />
Not material<br />
ASPECT: CHILD LABOUR REFERENCE RULER<br />
HR6<br />
Operations identified as having significant risk for incidents of child labour, and measures taken to contribute to the<br />
elimination of child labour.<br />
Not applicable<br />
ASPECT: FORCED AND COMPULSORY LABOUR REFERENCE RULER<br />
HR7<br />
Operations identified as having significant risk for incidents of forced or compulsory labour, and measures to contribute to<br />
the elimination of forced or compulsory labour.<br />
Not applicable<br />
ASPECT: security practices REFERENCE RULER<br />
HR8<br />
Percentage of security personnel trained in the organisation’s policies or procedures concerning aspects of human rights<br />
that are relevant to operations.<br />
Not applicable<br />
ASPECT: INDIGENOUS RIGHTS REFERENCE RULER<br />
HR9 Total number of incidents of violations involving rights of indigenous people and actions taken. Not applicable<br />
SOCIETY INDICATORS<br />
ASPECT: COMMUNITY REFERENCE RULER<br />
SO1<br />
Nature, scope and effectiveness of any programmes and practices that assess and manage the impacts of operations on<br />
communities, including entering, operating, and exiting.<br />
Figure 33<br />
5B<br />
ASPECT: CORRUPTION REFERENCE RULER<br />
SO2 Percentage and total number of business units analysed for risks related to corruption. Pages 17-20<br />
Figure 58<br />
SO3 Percentage of employees trained in organisation’s anti-corruption policies and procedures. Pages 17-20<br />
Figure 59<br />
SO4 Actions taken in response to incidents of corruption. Pages 17-20<br />
Figure 60<br />
ASPECT: PUBLIC POLICY REFERENCE RULER<br />
SO5 Public policy positions and participation in public policy development and lobbying. Figure 34<br />
SO6 Total value of financial and in-kind contributions to political parties, politicians, and related institutions by country. Figure 34<br />
ASPECT: ANTI-COMPETITIVE BEHAVIOUR REFERENCE RULER<br />
SO7 Total number of legal actions for anti-competitive behavior, anti-trust, and monopoly practices and their outcomes. Figure 14 5C<br />
ASPECT: COMPLIANCE REFERENCE RULER<br />
SO8<br />
Monetary value of significant fines and total number of non-monetary sanctions for non-compliance with laws<br />
and regulations.<br />
Figure 14<br />
5C<br />
PAGE 118 <strong>2012</strong> financial report
<strong>Watercare</strong> Services Limited<br />
<strong>2012</strong> ANNUAL REPORT<br />
G3 cross-reference tabLe (continued)<br />
PRODUCT RESPONSIBILITY PERFORMANCE INDICATORS<br />
ASPECT: CUSTOMER HEALTH AND SAFETY REFERENCE RULER<br />
PR1<br />
Life cycle stages in which health and safety impacts of products and services are assessed for improvement,<br />
and percentage of significant products and services categories subject to such procedures.<br />
Fundamental to<br />
organisation<br />
PR2<br />
Total number of incidents of non-compliance with regulations and voluntary codes concerning health and safety impacts<br />
of products and services during their life cycle, by type of outcomes.<br />
Figure 14<br />
1A-1C<br />
ASPECT: PRODUCT AND SERVICE LABELLING REFERENCE RULER<br />
PR3<br />
Type of product and service information required by procedures, and percentage of significant products and services<br />
subject to such information requirements.<br />
Figure 59<br />
1A-1C<br />
PR4<br />
Total number of incidents of non-compliance with regulations and voluntary codes concerning product and service<br />
information and labelling, by type of outcomes.<br />
Figure 14<br />
1A-1D; 6I<br />
PR5 Practices related to customer satisfaction, including results of surveys measuring customer satisfaction. Figure 26-31 4A-4C<br />
ASPECT: MARKETING COMMUNICATIONS REFERENCE RULER<br />
PR6<br />
Programmes for adherence to laws, standards, and voluntary codes related to marketing communications, including<br />
advertising, promotion, and sponsorship.<br />
Page 47<br />
5C<br />
PR7<br />
Total number of incidents of non-compliance with regulations and voluntary codes concerning marketing communications,<br />
including advertising, promotion, and sponsorship by type of outcomes.<br />
None reported<br />
ASPECT: CUSTOMER PRIVACY REFERENCE RULER<br />
PR8 Total number of substantiated complaints regarding breaches of customer privacy and losses of customer data. Figure 14<br />
ASPECT: COMPLIANCE REFERENCE RULER<br />
PR9<br />
Monetary value of significant fines for non-compliance with laws and regulations concerning the provision and use<br />
of products and services.<br />
Figure 14<br />
<strong>Report</strong> Application Levels<br />
Under the G3 framework, annual reports are graded at three different levels<br />
(C, B and A) according to the extent to which the framework has been applied.<br />
<strong>Watercare</strong>’s report has been self-declared and third-party checked.<br />
C C+ B B+ A A+<br />
MANDATORY Self-declared <br />
OPTIONAL<br />
Third-party checked<br />
GRI checked<br />
<br />
<strong>2012</strong> financial report PAGE 119
<strong>Watercare</strong> Services Limited<br />
<strong>2012</strong> ANNUAL REPORT<br />
Index<br />
Adopt A Stream 7, 14, 46, 51<br />
Asset management 18-19, 46, 54-57<br />
Audit and Risk Committee 10, 19-20<br />
Central Interceptor 8, 21<br />
Customer satisfaction 40-43<br />
Drinking Water Standards for New Zealand 26<br />
Emissions 6, 49-50<br />
Employment equity and diversity 37<br />
Environmental Advisory Group (EAG) 20, 22<br />
Graduate Engineering Programme 7, 37<br />
Governance 17-20<br />
Hunua No. 4 Watermain 7-8, 13-14, 16, 23<br />
Health, safety and well-being 34-37<br />
Healthy waterways 30-33<br />
Helensville Water Treatment Plant 47<br />
Kawakawa Bay wastewater treatment scheme 53<br />
Local boards 3, 21<br />
Local Government Acts 17<br />
Mangere Wastewater Treatment Plant 38-39, 57<br />
Midges 7, 51<br />
Networks map 3<br />
Odour 7, 27, 51, 53, 57, 61<br />
Overflows 7, 8, 22, 25, 30, 32<br />
Procurement 6, 13, 60<br />
Pukekohe water supply improvements 21, 28<br />
Puketutu Island 6, 14, 38-39, 50-52<br />
Rain Forest Express 7, 46, 63<br />
Safe and reliable water 24-29<br />
SAP Enterprise Asset Management Solution 6, 56<br />
Sound Financial Management 58-61<br />
Species preservation 50-51<br />
Staff training, staff turnover 37<br />
Stakeholder relations 44-47<br />
Statement of Intent (SOI) 19<br />
Statement of Service Performance 113-115<br />
Southwestern Interceptor 11-12, 33<br />
Sustainability 6-7, 14, 48-53<br />
Tangata Whenua 18, 23, 46<br />
Trade waste 2, 22, 32, 51<br />
Trees for Survival 6, 51<br />
Waikato Water Treatment Plant 54-55<br />
<strong>Watercare</strong> Coastal Walkway 6, 38<br />
<strong>Watercare</strong> Harbour Clean-Up Trust 6, 14, 29, 46, 49, 51<br />
Water quality 26-28, 38-39, 46, 51, 53<br />
Water Utility Consumer Assistance Trust 14, 29<br />
Zero Waste programme and recycling 14, 49-50<br />
glossary<br />
Adopt A Stream<br />
Asset Management Plan<br />
(AMP)<br />
Biogas<br />
Biosolids<br />
ERP<br />
G3<br />
Greenhouse gases<br />
Hansen<br />
Iwi<br />
Mana whenua<br />
Regional Demand<br />
Management Plan<br />
Reliability-Centred<br />
Maintenance (RCM)<br />
SAP<br />
Statement of Intent (SOI)<br />
Statement of Service<br />
Performance (SSP)<br />
Tāmaki Makaurau<br />
Tangata whenua<br />
Trade Waste<br />
Unaccounted-for<br />
water loss<br />
Wastewater<br />
Zero Waste<br />
<strong>Watercare</strong>’s free, student-centred science programme.<br />
A document that defines <strong>Watercare</strong>’s best engineering judgement of the revenue and capital investment required to maintain the<br />
integrity of its asset base over a 20-year period.<br />
A by-product of the wastewater treatment process that is comprised of approximately 65 per cent methane.<br />
A treated solid by-product of the wastewater treatment process.<br />
Enterprise resource planning (ERP) is a company-wide information system which consolidates information from various functions/<br />
departments. See SAP below.<br />
Version three of the Global <strong>Report</strong>ing initiative guidelines for sustainability reporting.<br />
Gases that trap heat in the atmosphere. Examples of greenhouse gases are methane, perfluorocarbons and nitrous oxide.<br />
A technology and information platform on which <strong>Watercare</strong> runs its customer business.<br />
Tribal group/s (origin: Maori).<br />
Territorial rights; tribal connection to a geographic region; associated with possession and occupation (origin: Maori).<br />
A plan that outlines how <strong>Watercare</strong> intends to achieve a 15% reduction in gross per capita water consumption by 2025.<br />
A framework which identifies the optimum time to maintain or replace assets based on operational performance, cost, health and<br />
safety and the environment.<br />
Systems, Applications and Products (SAP) is a company which offers enterprise resource planning solutions to companies to<br />
integrate information from various functions of that company under one system. See ERP above.<br />
The SOI represents <strong>Watercare</strong>’s public and legislative expression of accountability to its shareholder and establishes the agreement<br />
between the board and its shareholder.<br />
The SSP is a retrospective record of the performance of the company against the measures in its SOI.<br />
The Auckland isthmus region (origin: Maori).<br />
Indigenous people of the land (origin: Maori).<br />
Any discharge into a sewer in the course of an industry or trade process.<br />
Water that is lost before it reaches the customer. Losses can be real losses (through leaks) or apparent losses (for example, through<br />
theft or metering inaccuracies).<br />
Liquid or solid matter discharged into the sewer network from domestic, commercial or industrial locations.<br />
<strong>Watercare</strong>’s project to minimise or eliminate wastewater throughout the company.<br />
PAGE 120 <strong>2012</strong> financial report
WATERCARE SERVICES LIMITED<br />
REGISTRATION NUMBER: AK/519049<br />
REGISTERED OFFICE:<br />
2 Nuffield Street, Newmarket<br />
Auckland, Private Bag 92 521<br />
Wellesley Street, Auckland 1141<br />
Telephone: +64 9 539 7300<br />
Facsimile: +64 9 539 7334<br />
Email: communications@water.co.nz<br />
Website: www.watercare.co.nz<br />
<strong>Annual</strong><br />
<strong>Report</strong> <strong>2012</strong>