Ekahau Site Survey - Psiber
Ekahau Site Survey - Psiber
Ekahau Site Survey - Psiber

You also want an ePaper? Increase the reach of your titles
YUMPU automatically turns print PDFs into web optimized ePapers that Google loves.
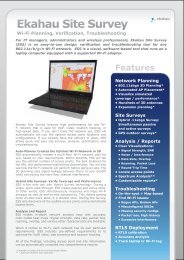
<strong>Ekahau</strong> <strong>Site</strong> <strong>Survey</strong><br />
Wi-Fi Planning, Verification, Troubleshooting<br />
User Guide<br />
v5.0
<strong>Ekahau</strong>, the <strong>Ekahau</strong> logo, <strong>Ekahau</strong> <strong>Site</strong> <strong>Survey</strong>, <strong>Ekahau</strong> Location <strong>Survey</strong>, <strong>Ekahau</strong> Heatmapper,<br />
<strong>Ekahau</strong> Engine, <strong>Ekahau</strong> RTLS Controller, <strong>Ekahau</strong> Positioning Engine, <strong>Ekahau</strong> Manager, <strong>Ekahau</strong><br />
Activator, <strong>Ekahau</strong> Finder, <strong>Ekahau</strong> Vision, <strong>Ekahau</strong> Tracker, <strong>Ekahau</strong> Logger, <strong>Ekahau</strong> T201, <strong>Ekahau</strong><br />
T301, <strong>Ekahau</strong> NIC-54, <strong>Ekahau</strong> NIC-300, <strong>Ekahau</strong> Client, and <strong>Ekahau</strong> Positioning Client are<br />
trademarks or registered trademarks of <strong>Ekahau</strong>.<br />
Other product and company names may be trademarks or trade names of their respective owners.<br />
The enclosed software contains implementations of <strong>Ekahau</strong>’s patent pending inventions.<br />
This manual and the <strong>Ekahau</strong> software described in it are copyrighted, with all rights reserved. This<br />
manual and the <strong>Ekahau</strong> software described in it may not be copied, except as otherwise provided<br />
in your software license.<br />
The contents of this document are provided “as is.” Except as may be required by applicable law,<br />
no warranties of any kind, either express or implied, including, but not limited to, the implied warranties<br />
of merchantability and fitness for a particular purpose, are made in relation to the accuracy,<br />
reliability or contents of this document. <strong>Ekahau</strong> reserves the right to revise this document or withdraw<br />
it at any time without prior notice.<br />
Export of this technology may be controlled by the United States Government. Diversion contrary<br />
to U.S. law prohibited.<br />
Your use of the <strong>Ekahau</strong> software described in this user manual and its documentation are governed<br />
by the terms set forth in your license agreement. Your use of this <strong>Ekahau</strong> software contrary to the<br />
terms of this User Manual may void the warranty, if any, described in your license agreement.<br />
Under no circumstances shall <strong>Ekahau</strong> be responsible for any loss of data or income, or any special,<br />
incidental, punitive, consequential or indirect damages howsoever caused.<br />
You may not use any <strong>Ekahau</strong> software or hardware products in hazardous environments (such<br />
as operation of nuclear facilities, aircraft navigation or control, environments containing high levels<br />
of dust, or mines) or in Life-Critical Solutions, unless you have advised <strong>Ekahau</strong> that they will be<br />
used in a hazardous environment or in a Life-Critical Solution and <strong>Ekahau</strong> has had an opportunity<br />
to evaluate further whether, and on what terms and conditions, the software or hardware products<br />
may be licensed for your intended use. The term “Life-Critical Solution” means an application<br />
software package or hardware device whose functioning or malfunctioning may result directly or<br />
indirectly in physical injury or loss of human life.<br />
<strong>Ekahau</strong> tags must always be used in compliance with the user environment and instructions contained<br />
in the User Manual for the tags.<br />
Copyright © <strong>Ekahau</strong>, Inc. 2000-2010. All rights reserved.
iii<br />
Table of Contents<br />
<strong>Ekahau</strong> <strong>Site</strong> <strong>Survey</strong><br />
1 Introduction ....................................................................................................................... 1<br />
1.1 Overview .................................................................................................................. 1<br />
1.2 Features ................................................................................................................... 1<br />
1.2.1 Feature Differences Between Professional and Standard ........................... 2<br />
1.3 Technical Support .................................................................................................... 2<br />
1.4 Backward Compatibility ............................................................................................ 2<br />
1.4.1 Compatibility with previous <strong>Ekahau</strong> <strong>Site</strong> <strong>Survey</strong> versions ........................... 2<br />
1.4.2 License compatibility with previous <strong>Ekahau</strong> <strong>Site</strong> <strong>Survey</strong> versions .............. 2<br />
2 Installation ......................................................................................................................... 5<br />
2.1 System Requirements and Software Limitations ..................................................... 5<br />
2.1.1 Supported Wi-Fi Adapters ........................................................................... 6<br />
2.2 How to Install ........................................................................................................... 6<br />
2.2.1 Wi-Fi Network Adapter Driver Update ......................................................... 6<br />
2.2.2 Upgrading the <strong>Ekahau</strong> <strong>Site</strong> <strong>Survey</strong> License ................................................ 7<br />
3 Designing, Deploying and Troubleshooting Wi-Fi Networks ...................................... 9<br />
3.1 <strong>Ekahau</strong> <strong>Site</strong> <strong>Survey</strong> and Other Wi-Fi Tools ............................................................ 10<br />
4 User Interface Overview ................................................................................................ 11<br />
4.1 Map View ............................................................................................................... 11<br />
4.2 Planning and <strong>Survey</strong> Tabs ..................................................................................... 12<br />
4.3 Visualization Selections ......................................................................................... 14<br />
4.4 Toolbar ................................................................................................................... 14<br />
4.5 The Access Point List ............................................................................................ 14<br />
4.5.1 Selecting Access Points ............................................................................ 15<br />
4.5.2 Searching for Access Points ...................................................................... 16<br />
4.5.3 Visualizing Selected Access Points ........................................................... 17<br />
4.5.4 Selecting My Access Points ....................................................................... 18<br />
4.5.5 Renaming Access Points ........................................................................... 18<br />
4.5.6 Replacing Access Points ........................................................................... 18<br />
4.5.6.1 Replacing Single-MAC and Multi-MAC Access Points ............... 19<br />
4.5.7 Adjusting the Properties of Measured Access Points ................................ 19<br />
4.5.8 Adjusting the Properties of Simulated Access Points ................................ 21<br />
4.5.9 One Access Point, Multiple MAC Addresses ............................................. 22<br />
4.5.9.1 Automatic and Manual Joining of Multi-MAC Access Points ...... 23<br />
4.5.9.2 Splitting Falsely Joined Access Points ....................................... 23<br />
4.5.10 802.11n Characteristics ........................................................................... 24<br />
4.5.10.1 Measured Access Points .......................................................... 25<br />
4.5.10.2 Simulated Access Points .......................................................... 25<br />
4.6 The <strong>Survey</strong>s List .................................................................................................... 26<br />
4.7 The Building View .................................................................................................. 26<br />
4.8 Menus .................................................................................................................... 26<br />
4.9 Software Preferences ............................................................................................ 28<br />
5 Starting to work with <strong>Ekahau</strong> <strong>Site</strong> <strong>Survey</strong> ................................................................... 29<br />
5.1 Starting <strong>Ekahau</strong> <strong>Site</strong> <strong>Survey</strong> .................................................................................. 29<br />
5.2 Setting the Map and Scale ..................................................................................... 29<br />
5.2.1 Changing the Map Image .......................................................................... 30<br />
5.3 Defining Network Requirements ............................................................................ 30<br />
6 Designing a Wi-Fi Network ............................................................................................ 33<br />
6.1 Creating a Network Plan with Auto-Planner ........................................................... 34<br />
6.1.1 Drawing and Editing Walls ......................................................................... 34
<strong>Ekahau</strong> <strong>Site</strong> <strong>Survey</strong><br />
6.1.1.1 Customizing the Wall Materials ................................................... 34<br />
6.1.1.2 Duplicating Maps with Similar Layouts ....................................... 35<br />
6.1.2 Indicating Network Coverage Areas .......................................................... 35<br />
6.1.3 Configuring Auto-Planner .......................................................................... 37<br />
6.2 Creating the Network Plan Manually Using Simulated Access Points ................... 38<br />
6.2.1 Optimizing Access Point Layout and Configuration ................................... 39<br />
6.3 Designing Wi-Fi Networks for Multi-Floor Buildings ............................................... 40<br />
6.3.1 Defining the Building Layout ...................................................................... 40<br />
6.3.2 Setting Floor Alignment Points .................................................................. 41<br />
6.3.3 Visualizing Floor-to-Floor Signal Coverage ............................................... 42<br />
7 <strong>Site</strong> <strong>Survey</strong>s - Ensuring Sufficient Coverage and Performance On-<strong>Site</strong> .................. 43<br />
7.1 Performing <strong>Site</strong> <strong>Survey</strong>s ........................................................................................ 43<br />
7.1.1 Configuring the Wi-Fi Device for Passive <strong>Survey</strong>s .................................... 45<br />
7.1.2 Configuring the Wi-Fi Devices for Hybrid <strong>Survey</strong>s ..................................... 46<br />
7.1.3 Moving and Deleting <strong>Survey</strong> Points ........................................................... 46<br />
7.1.4 GPS Assisted Outdoor <strong>Site</strong> <strong>Survey</strong>s ......................................................... 47<br />
7.1.4.1 Supported GPS Receivers .......................................................... 47<br />
7.1.4.2 Performing GPS Assisted <strong>Survey</strong>s ............................................. 47<br />
7.2 Post-Deployment and Pre-Deployment <strong>Survey</strong>s ................................................... 48<br />
7.3 Placing Access Points on the Map ......................................................................... 49<br />
7.4 Selecting My Access Points ................................................................................... 49<br />
7.5 Simultatenous <strong>Survey</strong> Work: Merging Two Projects as One ................................. 50<br />
7.6 Inspecting <strong>Survey</strong>s in More Detail ......................................................................... 50<br />
8 Analyzing the Wi-Fi Coverage and Performance ........................................................ 53<br />
8.1 Visualization Options .............................................................................................. 54<br />
8.1.1 Visualization Mode ..................................................................................... 55<br />
8.1.2 Signal Prediction ........................................................................................ 57<br />
8.1.3 Visualization Specific Options .................................................................... 58<br />
8.2 Adjusting the Legend ............................................................................................. 58<br />
8.3 Visualization Views ................................................................................................ 60<br />
8.3.1 Data Rate ................................................................................................... 60<br />
8.3.2 Interference / Noise ................................................................................... 61<br />
8.3.3 Network Health .......................................................................................... 62<br />
8.3.4 Network Issues .......................................................................................... 63<br />
8.3.5 Number of APs .......................................................................................... 64<br />
8.3.6 Signal Strength .......................................................................................... 65<br />
8.3.7 Signal-to-Noise Ratio ................................................................................. 66<br />
8.3.8 Strongest Access Point .............................................................................. 68<br />
8.3.9 Ping / Round Trip Time .............................................................................. 68<br />
8.3.10 Ping Packet Loss ..................................................................................... 69<br />
8.3.11 Associated Access Point .......................................................................... 70<br />
8.3.12 802.11n Channel Bonding ....................................................................... 71<br />
8.4 Different <strong>Survey</strong> Methods vs. Visualizations .......................................................... 72<br />
9 Troubleshooting - Detecting and Solving the Most Common Wi-Fi Problems ......... 75<br />
9.1 On-Spot Troubleshooting Using Live Network Status ............................................ 75<br />
9.1.1 Signals ....................................................................................................... 75<br />
9.1.2 Requirements ............................................................................................ 75<br />
9.1.3 802.11n Details .......................................................................................... 76<br />
9.1.4 Ping ............................................................................................................ 77<br />
9.2 Troubleshooting After the <strong>Survey</strong> ........................................................................... 78<br />
9.2.1 Finding Network Problems with a Single View .......................................... 78<br />
9.2.2 Basic Wireless Issues - Low Coverage, High Interference ........................ 78<br />
iv
v<br />
<strong>Ekahau</strong> <strong>Site</strong> <strong>Survey</strong><br />
9.2.3 Misconfigured SSIDs ................................................................................. 79<br />
9.2.4 Defective Access Points ............................................................................ 80<br />
9.2.5 Rogue Access Points ................................................................................. 80<br />
9.2.6 Misconfigured 802.11n settings ................................................................. 80<br />
9.2.7 Connectivity and Latency Issues ............................................................... 80<br />
9.3 Troubleshooting Non-Wi-Fi Interference Using Spectrum Analyzer ...................... 81<br />
9.3.1 Using Wi-Spy DBX Spectrum Analyzer ..................................................... 82<br />
10 Reporting, Exporting and Printing .............................................................................. 85<br />
10.1 Generating Reports .............................................................................................. 85<br />
10.2 Exporting and Printing Images ............................................................................. 87<br />
11 Real-Time Location Tracking (RTLS) Features .......................................................... 89<br />
12 Troubleshooting ........................................................................................................... 91<br />
13 Additional Information ................................................................................................. 93<br />
13.1 Meru Virtual Cell ................................................................................................... 93<br />
Index ..................................................................................................................................... 95
vi<br />
<strong>Ekahau</strong> <strong>Site</strong> <strong>Survey</strong>
1<br />
1 Introduction<br />
Welcome to <strong>Ekahau</strong> <strong>Site</strong> <strong>Survey</strong> (ESS). ESS is a tool for deploying and maintaining high-performance<br />
802.11 Wi-Fi networks. This user guide is designed to help you to understand and make use<br />
of the many features of <strong>Ekahau</strong> <strong>Site</strong> <strong>Survey</strong> and demonstrate how these features can benefit you<br />
in the design, deployment and troubleshooting of Wi-Fi networks.<br />
Note<br />
Do not operate <strong>Ekahau</strong> <strong>Site</strong> <strong>Survey</strong> and drive or carelessly walk at the same time. Stop using<br />
ESS and switch off the Wi-Fi device when it is forbidden to use radio equipment or when it may<br />
cause interference or danger.<br />
1.1 Overview<br />
Deploying and maintaining wireless networks offers many challenges beyond those of traditional<br />
wired networks. Because of the unpredictable and invisible nature of wireless, visual, professional<br />
tools are needed to achieve high performance. In order to support the business requirements of<br />
the organization, several important factors need to be considered:<br />
● Wi-Fi is invisible: it is hard to make a clear picture of how far your network will reach and how<br />
it will work in different locations.<br />
● Wireless is fluctuating and unpredictable: Whereas wired networks can be said to operate in<br />
a predictable way over a long period of time, wireless connections may work differently at any<br />
given time, depending on the conditions.<br />
● Wireless is ubiquitous: Whereas a wired Ethernet only has a certain number of connection<br />
points, wireless access points can host numerous simultaneous connections, offering connectivity<br />
over great distances.<br />
● Capacity planning is fairly straightforward in wired networks . However, wireless is a shared<br />
medium where the overall capacity is shared by multiple users at any given time.<br />
For these and many other reasons, proper tools are required when designing, deploying, maintaining<br />
and troubleshooting Wi-Fi networks. <strong>Ekahau</strong> <strong>Site</strong> <strong>Survey</strong> is a state-of-the-art tool that makes Wi-<br />
Fi understandable and allows you to get the best out of your Wi-Fi network.<br />
1.2 Features<br />
Chapter 1. Introduction<br />
<strong>Ekahau</strong> <strong>Site</strong> <strong>Survey</strong> is designed for use throughout the life cycle of your Wi-Fi network. Whether<br />
you are in the planning, deployment, verification, or troubleshooting phase, ESS has features to<br />
assist you. The key features of ESS are:<br />
● Automated Network Planning: Automatically determine the optimal the number and location<br />
for your access points prior to physical deployment (<strong>Ekahau</strong> <strong>Site</strong> <strong>Survey</strong> Pro only)<br />
● Verification: Perform active and passive indoor and GPS assisted outdoor site surveys to<br />
verify coverage and performance (GPS support in <strong>Ekahau</strong> <strong>Site</strong> <strong>Survey</strong> Pro only)<br />
● Analysis and Optimization: Visualize network coverage and performance, fine-tune them,<br />
and simulate changes in the network or environment<br />
● Troubleshooting: Solve various Wi-Fi issues<br />
● Reporting: Generate reports of Wi-Fi coverage and performance (<strong>Ekahau</strong> <strong>Site</strong> <strong>Survey</strong> Pro<br />
only)
1.2.1 Feature Differences Between Professional and Standard<br />
<strong>Ekahau</strong> <strong>Site</strong> <strong>Survey</strong> Standard includes tools for network verification, analysis, optimization, and<br />
troubleshooting. <strong>Ekahau</strong> <strong>Site</strong> <strong>Survey</strong> Professional version includes all the features in Standard,<br />
plus the following features:<br />
● Automated Network Planning: Design a network off-site in 3D. Also enables planning for<br />
extended coverage or capacity for an existing network<br />
● Automated Reporting: Automatically generates comprehensive network documentation,<br />
including coverage and performance maps, network infrastructure layout and configuration,<br />
and other information<br />
● GPS Enabled Outdoor <strong>Site</strong> <strong>Survey</strong>s: For performing outdoor site surveys without clicking<br />
on the map using a GPS receiver (GPS receiver not included)<br />
1.3 Technical Support<br />
<strong>Ekahau</strong> provides technical support free of charge for all customers for 30 days. Customers who<br />
have purchased <strong>Ekahau</strong> Support will receive <strong>Ekahau</strong> Support services for 12 months from the<br />
date of purchase.<br />
<strong>Ekahau</strong> Support includes:<br />
Chapter 1. Introduction<br />
● All upgrades and patches for the product(s) and documentation purchased<br />
● Free-of-charge support via e-mail at support@ekahau.com (preferred) and telephone during<br />
regular business hours (PST, EST, GMT+2)<br />
Bug fix patches are free of charge for all customers.<br />
To renew your <strong>Ekahau</strong> Support, please contact your <strong>Ekahau</strong> representative or sales@ekahau.com.<br />
1.4 Backward Compatibility<br />
<strong>Ekahau</strong> <strong>Site</strong> <strong>Survey</strong> is backwards compatible with the following <strong>Ekahau</strong> products:<br />
1.4.1 Compatibility with previous <strong>Ekahau</strong> <strong>Site</strong> <strong>Survey</strong> versions<br />
● The <strong>Ekahau</strong> <strong>Site</strong> <strong>Survey</strong> 5.0 is able to open older project files (.esx). ESS 5.0 can open files<br />
created with any previous <strong>Ekahau</strong> <strong>Site</strong> <strong>Survey</strong> 4.x version as well as with <strong>Ekahau</strong> <strong>Site</strong> <strong>Survey</strong><br />
2.2 version.<br />
● Older ESS 4.x versions are not able to open ESS 5.0 project files.<br />
● RTLS Compatibility: Only <strong>Ekahau</strong> RTLS Controller (ERC) 5.0 can open ESS 5.0 project files.<br />
None of the previous <strong>Ekahau</strong> Positioning Engine versions can open ESS 5.0 project files. If<br />
you have an older EPE version and want to use the latest ESS, you will need to update the<br />
EPE.<br />
1.4.2 License compatibility with previous <strong>Ekahau</strong> <strong>Site</strong> <strong>Survey</strong><br />
versions<br />
<strong>Ekahau</strong> <strong>Site</strong> <strong>Survey</strong> 5.0 and later versions require a new license that is not compatible with <strong>Ekahau</strong><br />
<strong>Site</strong> <strong>Survey</strong> 4.x versions. If you have a valid <strong>Ekahau</strong> <strong>Site</strong> <strong>Survey</strong> Support package, but you have<br />
2
3<br />
Chapter 1. Introduction<br />
not received a new <strong>Ekahau</strong> <strong>Site</strong> <strong>Survey</strong> 5.0 license, please contact <strong>Ekahau</strong> Support at support@ekahau.com<br />
or your <strong>Ekahau</strong> Sales representative.
Chapter 1. Introduction<br />
4
5<br />
2 Installation<br />
2.1 System Requirements and Software Limitations<br />
The following hardware and operating system are required to run the program:<br />
● Windows 7 (64 bit & 32 bit) , Vista (64 bit & 32 bit), or XP (32 bit only) Operating System<br />
● 1+ GB RAM, 2GB+ RAM recommended for large projects<br />
● 1GB free hard disk space<br />
● A supported Wi-Fi adapter (visit http://www.ekahau.com/devices)<br />
● Laptop computer (required for recording surveys, a desktop computer is sufficient planning<br />
and analysis)<br />
● Screen resolution of 1024 x 768 or higher, 32-bit color quality recommended<br />
Note<br />
<strong>Ekahau</strong> recommends Windows 7 OS (64 bit) with 4GB RAM for project larger than 300,000<br />
square feet.<br />
Note<br />
Currently GPS assisted site surveys are not supported in 64 bit operating systems.<br />
The following is required for simultaneous active and passive surveys (Hybrid <strong>Survey</strong>s):<br />
● Supported external Wi-Fi adapter for traditional passive surveys<br />
● Integrated Wi-Fi adapter for end-to-end connectivity testing<br />
● Network connection via the Integrated Wi-Fi adapter using Windows Wi-Fi management tool<br />
(Disable the third party Wi-Fi connectivity tool if enabled!)<br />
Please consider the following limitations that apply to the program:<br />
● The software may become unstable if a single Project file contains more than 10 000 access<br />
point MAC addresses<br />
● The software may become unstable if images larger than 5000 x 5000 pixels are used<br />
● The software may become unstable if more than 100 hours of survey data is recorded into a<br />
single Project<br />
Note<br />
Chapter 2. Installation<br />
USB Wi-Fi adapters are not fully supported in Windows XP OS. To take full advantage of <strong>Ekahau</strong><br />
<strong>Site</strong> <strong>Survey</strong> in laptop with Windows XP OS, <strong>Ekahau</strong> recommends using <strong>Ekahau</strong> NIC-300-<br />
Cardbus Wi-Fi adapter.
2.1.1 Supported Wi-Fi Adapters<br />
<strong>Ekahau</strong> <strong>Site</strong> <strong>Survey</strong> supports most common 802.11 Wi-Fi network adapters for conducting surveys<br />
regardless the card type. A wireless network adapter is not required if you do not wish to record<br />
signal data such if you just want to use the automated network planning feature.<br />
Please visit our website for the complete list of supported Wi-Fi adatpers:<br />
http://www.ekahau.com/devices<br />
The <strong>Ekahau</strong> <strong>Site</strong> <strong>Survey</strong> can conduct surveys in traditional passive mode as well as in active<br />
mode. When these surveys are conducted simultaneously, we call this as Hybrid <strong>Survey</strong>. The<br />
Hybrid <strong>Survey</strong> requires two Wi-Fi adapters to be used at the same time:<br />
● An external Wi-Fi adapter (such as <strong>Ekahau</strong> NIC-300-Cardbus or NIC-300-USB) for Passive<br />
<strong>Survey</strong><br />
● An integrated Wi-Fi adapter for end-to-end connectivy testing in Active <strong>Survey</strong><br />
Warning<br />
Intel Centrino Laptops with the built-in Wi-Fi chipset can be used for passive site surveys (RSSI<br />
measurement). However, since the measurement accuracy and network scanning speed is not<br />
optimal for passive site surveys, it is recommended to use a third-party network adapter, such<br />
as <strong>Ekahau</strong> NIC-300-Cardbus or NIC-300-USB instead for the passive site survey measurements.<br />
2.2 How to Install<br />
1. Make sure you have a supported network adapter inserted into your laptop (visit<br />
http://www.ekahau.com/devices for a list of supported adapters)<br />
2. Double-click the executable file (.exe file) to start installation<br />
3. Follow the on-screen instructions given by the Installation Wizard to install ESS<br />
4. Follow the on-screen instructions to install Wi-Fi adapter driver and <strong>Ekahau</strong> Wireless Utility<br />
(see below for details)<br />
2.2.1 Wi-Fi Network Adapter Driver Update<br />
The external Wi-Fi adapter driver needs to be updated in order to collect signal measurements.<br />
The Wi-Fi adapter driver will be updated automatically during the installation.<br />
Make sure you have a supported Wi-Fi adapter inserted when installing the product. Skip driver<br />
installation if you do not wish to conduct <strong>Survey</strong>s, or do not have a supported external wireless<br />
network adapter available at the time of the installation.<br />
Note<br />
Chapter 2. Installation<br />
6
7<br />
If you did not have a supported adapter at the time of the installation (or if you chose to install<br />
the driver later for some other reason), you can install the WLAN adapter driver and the wireless<br />
connection utility later by selecting the Install Cardbus/USB Wi-Fi Adapter Driver from the<br />
program folder in the Start menu.<br />
Note<br />
It is also highly recommended to update the integrated Wi-Fi adapter's driver if used for either<br />
passive survey or active survey.<br />
For Windows XP, the driver installation will also install the <strong>Ekahau</strong> Wireless Utility for managing<br />
the wireless connectivity. The Wireless Utility can be started from the Start menu. For more<br />
information, please use the help features in the Wireless Utility user interface. You may also choose<br />
to only install the driver and skip the Wireless Utility installation if you want to continue using a<br />
third party wireless utility.<br />
If you wish to stop using the program, and thus also the customized network adapter driver, simply<br />
run the Wi-Fi Adapter Driver Installer from the Start menu again, and select Uninstallation.<br />
2.2.2 Upgrading the <strong>Ekahau</strong> <strong>Site</strong> <strong>Survey</strong> License<br />
The first time you start the software, you will be prompted for a license key. If you are evaluating<br />
the software, you do not need a license.<br />
If you have purchased the product, you should have received the license key via e-mail. When<br />
prompted, type in the license key, as well as your name and company.<br />
The software license will be tied to a selected network adapter. When starting the software, you<br />
will need to select the network adapter you wish to pair the license key with. The network adapter<br />
does not need to be a Wi-Fi adapter, you can pair the license with a fixed Ethernet adapter also<br />
- the network adapter just needs to be present when the software is started. The adapter you select<br />
at this point does not limit what Wi-Fi cards can be used with the tool.<br />
After inserting the license, the tool will register the MAC address and the license key on-line. For<br />
this, an internet connection is required when starting the software for the first time.<br />
If you wish to continue in the evaluation mode and upgrade the license later, go to Help > About<br />
and select Upgrade License.<br />
Note<br />
Chapter 2. Installation<br />
After registering the software, the network adapter will be checked every time the software is<br />
started. If the network adapter is removed or disabled, the software will not start.
Chapter 2. Installation<br />
The evaluation license has several limitations. For evaluating the product for network design and<br />
site surveys, the limitations are:<br />
● Network planning is time-limited to 15 minutes<br />
● <strong>Survey</strong>ing is limited to 15 minutes<br />
● Opening (except the Example Project), merging, reporting, and saving are disabled<br />
8
9<br />
Chapter 3. Designing, Deploying and<br />
Troubleshooting Wi-Fi Networks<br />
3 Designing, Deploying and Troubleshooting Wi-Fi<br />
Networks<br />
Below is shown a typical example on how high-quality wireless networks are designed, deployed<br />
and managed using <strong>Ekahau</strong> <strong>Site</strong> <strong>Survey</strong>. Network deployment strategies may vary, but most of<br />
the network deployments include several of the following steps:<br />
1. Define the Requirements<br />
Determine what applications and the anticipated number of users the network will host.<br />
Determine service areas, network security policies,end user devices, funding and scheduling.<br />
From these, define the network coverage, performance,compatibility, and security requirements.<br />
Conduct a visual site inspection.<br />
In <strong>Ekahau</strong> <strong>Site</strong> <strong>Survey</strong>, you define the network requirements by selecting the type of application<br />
used in the network, such as “data” or “voice over IP”. You can also create your own custom<br />
network requirements. The requirements can be edited from <strong>Site</strong> > Edit Requirements .<br />
Once the requirements for your network have been defined, you can easily compare the network<br />
(simulated or measured) against the requirements using the Network Health visualization.<br />
2. Automatically Create the Network Plan with Auto-Planner (<strong>Ekahau</strong> <strong>Site</strong> <strong>Survey</strong> Pro only)<br />
Use the ESS Auto-Planner to create a network plan for you automatically. The Auto-Planner<br />
automatically simulate access point locations and configurations without going on-site. ESS<br />
can visualize predicted coverage and performance, based on your requirements. In addition,<br />
you can manually adjust the AP locations and configurations or just manually create the<br />
complete network plan with simulated access points if needed.<br />
3. Perform Pre-Deployment <strong>Site</strong> <strong>Survey</strong><br />
The goal of the pre-deployment survey is to verify the accuracy of the network plan prior to<br />
purchasing and installing all the equipment. By performing pre-deployment site surveys, you<br />
can be more confident of the number of APs and that their installation locations are optimal.<br />
During the pre-deployment survey, you will also find all the third-party or rogue access points<br />
that may be radiating to the facility.<br />
When on site, power up an access point in one of the location defined in the Network Plan<br />
phase. Perform a site survey in the coverage area of the AP. Use the Freeze Access Point<br />
feature, and move the access point to the next location. Repeat this process for all the APs<br />
planned in the network design. The end results is a site survey of the whole facility, without<br />
having to purchase all the necessary network equipment.<br />
4. Fine-tune the Network Design<br />
If the network meets your requirements, you can directly proceed to the next step. If the network<br />
does not meet the requirements, fine-tune the configuration using the simulation capabilities<br />
ESS in until it does.<br />
5. Deploy the Network Infrastructure<br />
Based on the network plan, and the pre-deployment site surveys, deploy the wireless network<br />
infrastructure. Use ESS to store notes about the installation.<br />
6. Conduct a verification survey<br />
Verify the network coverage and performance by conducting a site survey throughout the<br />
entire site.<br />
7. Analyze and fine-tune to finalize the network design<br />
Analyze the network coverage and performance. If the verification survey reveals that the<br />
network still does not meet the network requirements, fine tune and re-survey until it does.<br />
Use the simulation and optimization features of ESS to perfect the network.<br />
8. Create documentation (<strong>Ekahau</strong> <strong>Site</strong> <strong>Survey</strong> Pro only)<br />
Use the reporting feature to create complete documentation of the network installation, coverage,<br />
and performance with the click of a button.<br />
9. Troubleshooting, Monitoring, Maintenance, Expansion
Chapter 3. Designing, Deploying and<br />
Troubleshooting Wi-Fi Networks<br />
Problems do occur that cannot be “seen” from the Wi-Fi Controller, but have to be investigated<br />
on the client side. Use <strong>Ekahau</strong> <strong>Site</strong> <strong>Survey</strong> in combination with your Wi-Fi Controller to keep<br />
your wireless network up and running. Use the Live Network Status feature to quickly detect<br />
and solve basic Wi-Fi issues such as finding defective and / or missconfigured Wi-Fi Access<br />
Points. Conduct periodic site surveys to ensure flawless operation. Design for additional<br />
coverage or performance using the network planning features by simply opening the surveyed<br />
project file, and adding simulated access points on the surveyed data.<br />
3.1 <strong>Ekahau</strong> <strong>Site</strong> <strong>Survey</strong> and Other Wi-Fi Tools<br />
<strong>Ekahau</strong> <strong>Site</strong> <strong>Survey</strong> is a comprehensive tool that assists during the entire life cycle of a Wi-Fi<br />
network. However, there are other tools available that are complementary and worth considering<br />
also:<br />
● Wi-Fi Management softwares are designed to assist in the set-up, monitoring and management<br />
of the network. While Wi-Fi controllers assist you in setting up the network configurations<br />
and monitoring the network on a high level, site survey tools can provide more detailed<br />
information not visible to the Wi-Fi controller. Some scenarios that ESS can solve are: Broken<br />
APs, unsuccessful configuration updates to the APs, rogue APs beyond the reach of your Wi-<br />
Fi APs, and coverage holes not detected by your APs. In addition, <strong>Ekahau</strong> <strong>Site</strong> <strong>Survey</strong> provides<br />
state-of-the-art tools for network planning and expansion whereas some controllers may<br />
provide basic tools for "ballpark" type network planning.<br />
● Spectrum Analyzers help understand the radio frequency in more detail. Whereas <strong>Ekahau</strong><br />
<strong>Site</strong> <strong>Survey</strong> provides a view to the audible Wi-Fi signals, a spectrum analyzer shows the non-<br />
Wi-Fi interference: It allows you to solve problems caused by such interfering devices as<br />
microwave ovens, wireless video cameras, and baby monitors. <strong>Ekahau</strong> recommends using<br />
Wi-Spy DBX Spectrum Analyzer which can be purchased together with <strong>Ekahau</strong> <strong>Site</strong> <strong>Survey</strong>.<br />
To purchase the the Wi-Spy DBX Spectrum Analyzer, please contact <strong>Ekahau</strong> Sales at<br />
sales@ekahau.com.<br />
● Packet Analyzers (Protocol Analyzers) solve issues that are not related to the Wi-Fi signals,<br />
but lie in the packet level. You can figure out exactly what kind of packets are being sent and<br />
received, and detect otherwise hard-to-detect problems, such as issues related to AP/Client<br />
configuration or incompatibility between the devices.<br />
10
11<br />
4 User Interface Overview<br />
Figure 4.1. User Interface Overview<br />
1. Access Point, <strong>Survey</strong> list, and Building view tabs<br />
2. Toolbar<br />
3. Visualizations Selections<br />
4. Miniature Ping view - The digits on the top left are the last digits of the associated AP MAC<br />
address<br />
5. Miniature Signal view<br />
6. Spectrum analyzer quick launch<br />
7. Planning and <strong>Survey</strong> tabs<br />
8. Map view<br />
4.1 Map View<br />
Chapter 4. User Interface Overview<br />
The map view is the most commonly used view in ESS. Use the map view to:<br />
● Create network plans<br />
● Perform site surveys<br />
● Place and move access points<br />
● Analyze and optimize the network coverage and performance<br />
Zooming the map is done using the zooming buttons in the toolbar, using the mouse wheel, or<br />
from the View menu. You can also zoom by right-clicking on the map when using the Edit, Simulated<br />
Access Point, and Wall tools.
Figure 4.2. ESS map view<br />
Chapter 4. User Interface Overview<br />
1. Select and add map<br />
2. Drawing walls is not required if network planning is not used<br />
3. An 802.11g access point on channel 1<br />
4. <strong>Survey</strong> route - Arrows indicate survey direction<br />
5. Visualization Legend - Click to adjust visualization value range and color scheme<br />
4.2 Planning and <strong>Survey</strong> Tabs<br />
Use the Planning and <strong>Survey</strong> tabs to access the most commonly used tools:<br />
12
13<br />
Icon<br />
Icon<br />
The Planning Tab<br />
These tools are needed when working with a predictive design of a Wi-Fi network.<br />
Name<br />
Edit<br />
Scale<br />
Simulated<br />
Access Point<br />
Floor Alignment<br />
Wall<br />
Coverage Area<br />
Auto-Planner<br />
The <strong>Survey</strong> Tab<br />
Description<br />
Edit Items on the Map. Allows you to perform various functions to items<br />
on the map, such as move and delete.<br />
Indicate Scale. Indicate the scale of the map. Can also be used as a<br />
distance measurement tool.<br />
Place a Simulated Access Point on the Map. Optionally select the<br />
properties of the AP prior to placing it.<br />
Place a Floor Alignment Point. Aligns the floor with the neighboring<br />
floors. Only needed when the 3D planner is used.<br />
Draw Walls. Only needed when the 3D planner is used.<br />
Indicate Coverage Areas for Auto-Planner. Draw areas where you<br />
want Auto-Planner to provide Wi-Fi coverage and to place access points.<br />
Open Auto-Planner. Click to open the Auto-Planner configuration dialog<br />
and configure the Auto-Planner.<br />
<strong>Survey</strong> - These tools are needed when performing site surveys or troubleshooting the network<br />
Name<br />
Edit<br />
Scale<br />
Record <strong>Survey</strong><br />
<strong>Survey</strong> Inspector<br />
GPS Reference<br />
Point Tool<br />
Chapter 4. User Interface Overview<br />
Description<br />
Edit items on the map. Allows you to perform various functions to items<br />
on the map, such as move and delete.<br />
Indicate Scale. Indicate the scale of the map. Can also be used as a<br />
distance measurement tool.<br />
Perform <strong>Survey</strong>s: Record signal measurements around the facility. Enable<br />
the tool, and walk around the map while clicking on your current location<br />
when you stop, start walking or change direction. If you check the Auto-<br />
Place APs After <strong>Survey</strong> checkbox, the access points will be automatically<br />
located after the survey.<br />
The GPS Record button is used for performing GPS assisted outdoor<br />
surveys.<br />
Inspect surveyed data in detail. Click on the tool, and you will see the<br />
surveyed measurements on the map. Double click on the measurement<br />
to see measurement details.<br />
Place GPS Reference Points on the map. Without the reference points,<br />
the GPS coordinates cannot be converted to map coordinates, and thus<br />
the GPS information cannot be displayed on the map.
Icon<br />
Icon<br />
Name<br />
Miniature Signal<br />
View<br />
Network Adapter<br />
Setting<br />
Miniature Ping<br />
View<br />
Description<br />
Displays the currently measured signal strength (green) and noise<br />
(red) values. Click to access the Live Network Status view. Shows "No<br />
Devices" if no devices are present.<br />
Change Network Adapter Settings: Click on the network adapter to<br />
change its settings or to select a different adapter to be used.<br />
End-to-end Testing: Click to configure the host that is being used for<br />
end-to-end network connection testing and to access the Live Network<br />
Status Ping view<br />
4.3 Visualization Selections<br />
You can select the visualization by adjusting the two drop-down menus at the top of the screen -<br />
one selects the visualization and the other selects the access points to show the visualization for.<br />
More about visualizations in chapter Analyzing the Wi-Fi Coverage and Performance on page 53.<br />
4.4 Toolbar<br />
The toolbar includes the icons for the most common actions:<br />
Name<br />
Open<br />
Save<br />
Report<br />
Zoom In<br />
Zoom Out<br />
Zoom to Fit<br />
Zoom 1:1<br />
Chapter 4. User Interface Overview<br />
Description<br />
Open a Project<br />
Save the Project<br />
Generate a Report in PDF or RTF<br />
Zoom in to see an area in more detail<br />
Zoom out to see a wider area of the map at once<br />
Fit the map into the window<br />
4.5 The Access Point List<br />
Zoom to see the map in its actual pixel size<br />
Both simulated and measured access points are listed in the Access Point List on the left-hand<br />
side of the screen. The access points are grouped by floor. Only the access points on the floor<br />
you are currently viewing are displayed by default. To see APs on other floors, click on the floor<br />
name to see the APs for that floor.<br />
14
15<br />
Figure 4.3. Access point list view<br />
Chapter 4. User Interface Overview<br />
1. Search for specific AP(s) such as all APs manufactured by D-Link<br />
2. Quickly select a group of APs<br />
3. There are 12 APs on this floor, out of which 3 are shown<br />
4. Perform actions to APs: Select All/None, Freeze, Join, Automatically Place APs on map, Edit<br />
5. This AP is selected (Notice the orange color)<br />
6. This AP is selected - Click here to select or de-select<br />
4.5.1 Selecting Access Points<br />
There are several methods to select which access points to visualize, edit, or select as My APs.<br />
APs can be selected one by one either from the map or from the AP list:<br />
● To select APs on the map, simply click on the AP to be selected. Click on the AP again to<br />
de-select it. The selected AP will be highlighted on the map, and in the AP list.<br />
● To select APs on the AP List, click on the handle on the left-hand side of the AP list to select<br />
an AP - an orange color will indicate that the AP has been selected. Click on the handle again<br />
to de-select. You will also see the AP being highlighted on the map.<br />
Simulated APs can be selected in the same way as measured APs. However, simulated multiradio<br />
APs can be selected one radio at a time:<br />
● To select radios on the map, click on the rectangle on the right-hand side of the AP. The<br />
rectangle will become highlighted with orange when it is selected.<br />
● To select radios on the AP List, click on the handle on the left-hand side of the radio properties<br />
field.
Figure 4.4. Selecting one radio at a time<br />
Selecting Multiple Access Points at Once<br />
To select multiple access points at once, you have two options:<br />
● To select all the access points, choose Actions > Select All. Please note that if a search<br />
is used, this action will only select all the searched access points. To deselect all access<br />
points, select Actions > Select None.<br />
● To quickly select the APs with a given SSID, channel, or band , click Quick Select, and<br />
click on the SSID, channel or band to select only the appropriate APs. You can also select<br />
only simulated or measured access points. If you select multiple criteria, such as SSID and<br />
band, only the access points matching all the criteria will be selected.<br />
Figure 4.5. Access Point Quick Selection<br />
4.5.2 Searching for Access Points<br />
Use the Search text box to search one or more APs. Only the APs matching the search criteria<br />
will be displayed. To display all access points, either delete the search field or click on the X button<br />
next to the search field. The following search options are available:<br />
Example Search Terms<br />
00:17:0f, 00:17:0f:12:ab:a1<br />
Chapter 4. User Interface Overview<br />
Description<br />
Search by a partial or complete MAC address<br />
16
17<br />
Example Search Terms<br />
Nortel, Siemens, Simulated AP 4<br />
guest, tsunami<br />
802.11a, 802.11b<br />
my<br />
other<br />
Chapter 4. User Interface Overview<br />
Description<br />
Search by the name of the AP. The name is defaulted<br />
to the vendor with measured access points.<br />
Search by the SSID the AP is on<br />
Search by the 802.11 standard the AP supports<br />
Search only the APs selected as My<br />
4.5.3 Visualizing Selected Access Points<br />
Search only the APs not selected as My<br />
You can limit the access points to be included in the heat map visualizations from the drop-down<br />
menu next to the Visualization Selection menu.<br />
● Showing the visualization for All Access Points displays the visualization (heat map) using<br />
the information from all the access points. For example, if you want to see the total number<br />
of access points on a given map, select Show Number of APs for All Access Points<br />
● If My Access Points is selected, the visualizations will only be shown using the data of the<br />
access points checked as My from the AP List. For example, if you want to see the coverage<br />
area of your network, select Show Signal Strength for My Access Points. Selecting All<br />
Access Points instead of My Access Points would include neighboring and rogue access<br />
points, and thus overly optimistic results would be displayed.<br />
● Having Other Access Points selected is the exact opposite for selecting My Access Points.<br />
For example, if you want to show the signals from access points that are not in your network,<br />
select Show Signal Strength for Other Access Points.<br />
● If Selected Access Points is selected, only the access points that have been selected in the<br />
Access Points list will be taken into account into the visualization. For example, if you wanted<br />
to see the coverage area of a single access point, first highlight that access point from the<br />
AP list, and then select Show Signal Strength for Selected Access Points. See the example<br />
picture below.<br />
Figure 4.6. Visualizing only selected access points
Chapter 4. User Interface Overview<br />
1. In the example, ESS visualizes only those APs that are selected (notice the orange color)<br />
4.5.4 Selecting My Access Points<br />
During the site survey, all the audible access points will be detected. It is important to segregate<br />
the access points in your network from the other access points, such as the APs radiating from<br />
the nextdoor building. The My checkbox in the AP list indicates whether an AP is in your network<br />
or not.<br />
You can select My APs either one by one, or by selecting multiple access points first and then<br />
selecting or de-selecting the My checkbox to select or de-select multiple APs to/from My APs. For<br />
example, if you have Nortel APs (and there are no other Nortel APs around):<br />
1. De-select all the APs from My selection: Click Actions > Select All and then choose Actions<br />
> Deselect from My. Now none of the APs are selected as My.<br />
2. Next, type "Nortel" into the Search text box<br />
3. then click Actions > Select All to select all the Nortel APs.<br />
4. To select all the searched Nortel APs as My, click Actions > Select as My, and all the Nortel<br />
APs will now be selected as My.<br />
4.5.5 Renaming Access Points<br />
By default, the measured access points are named by the AP brand, such as Nortel, Cisco or<br />
Siemens. The simulated APs are named using running numbers by default. To rename the APs,<br />
simply click on the name field, and type in a custom AP name.<br />
4.5.6 Replacing Access Points<br />
If an access point breaks down, there is no need to perform a new survey. There are two options<br />
you can do:<br />
● If the access point is replaced by another, identical AP in the same location: In the AP<br />
List, click on the MAC address of the access point and select Replace MAC, and type in the<br />
MAC address of the new access point to the Replacing MAC field.<br />
18
19<br />
Figure 4.7. When replacing access points, remember to select the correct Vendor setting (if<br />
not selected by default) to ensure that the multi-MAC access points are replaced correctly.<br />
● If the access point is not replaced by an identical AP: Deselect the access point form the<br />
My Access Points using the <strong>Survey</strong>s list.<br />
Note<br />
Chapter 4. User Interface Overview<br />
If the access point is replaced by another AP, but not with an identical one, you need to perform<br />
a new survey within the coverage area of the new access point.<br />
4.5.6.1 Replacing Single-MAC and Multi-MAC Access Points<br />
When replacing access points distributing just one MAC address, use the "Generic - one<br />
MAC replaced" Vendor option.<br />
In case of Multi-MAC access points (APs that are sending out one MAC per SSID), ensure that<br />
the vendor has been selected correctly to apply the changes to the whole MAC range of the AP.<br />
If your vendor has not been listed, there are several options:<br />
● Change the MAC addresses of the replaced AP one-by one using the Generic - one MAC<br />
Replaced vendor option .<br />
● Use the Generic - Up to 16 Virtual MACs Replaced option to replace all the MAC addresses<br />
automatically. This option should be used if the last hex number (4 bits) of the MAC address<br />
changes between different SSIDs.<br />
● Use the Generic - Up to 64 Virtual MACs Replaced option to replace all the MAC addresses<br />
automatically. This option should be used if the last 6 bits of the MAC address change between<br />
different SSIDs.<br />
4.5.7 Adjusting the Properties of Measured Access Points<br />
By deafult, the names of the measured access points are defaulted as the AP manufacturers. To<br />
change the name, edit the text box.<br />
Edit the AP notes by clicking on the note icon. This information may include AP mounting information,<br />
name of the person responsible for installation, cabling information and so on. An empty
paper is displayed if there are no notes for the AP, and a paper with text will be displayed if notes<br />
are written for the AP.<br />
In some cases, the surveyed network shows high interference due to inoptimal channel selections<br />
of the APs. <strong>Ekahau</strong> <strong>Site</strong> <strong>Survey</strong> allows you to simulate how interference (and thus, network performance)<br />
would change if the AP channels were changed. To simulate a channel change for a<br />
measured AP, simply click on the 802.11 channel selection drop-down menu and change the<br />
channel. 802.11b band channels are presented in blue, 802.11g channels in green, 802.11a<br />
channels in orange, and 802.11n channels in purple. The impact of the channel change will be<br />
visualized on the map thereafter.<br />
Figure 4.8. Channel selection view<br />
Chapter 4. User Interface Overview<br />
1. 802.11g Band (Green)<br />
2. 802.11n Band channel selection (Purple)<br />
3. 802.11a Band (Orange)<br />
4. 802.11b Band (Blue)<br />
20
21<br />
Figure 4.9. Working with access points<br />
Chapter 4. User Interface Overview<br />
1. The names of Cisco APs are automatically shown<br />
2. Notes<br />
3. Measured 802.11n properties<br />
4. If "Selected Access Points" is selected, the visualization will be displayed only for selected<br />
APs<br />
5. This AP is selected - Select and de-select from here or from the map<br />
6. Multi-MAC and SSID access point - This AP has three SSIDs and MACs<br />
7. The channels of the AP - Click to see how changing the channel(s) would impact the network<br />
8. Selected as "My" which means that this AP belongs to my network<br />
9. Name (defaults to brand)<br />
4.5.8 Adjusting the Properties of Simulated Access Points<br />
For simulated APs, you can change the following parameters:<br />
● AP Band: Whether the AP is 802.11a, 802.11b, 802.11g, or 802.11n. Select from the 802.11<br />
technology button.<br />
● AP Channel: The frequency channel the AP is operating at. Select from the channel button.<br />
● AP Radio Transmission Power: The transmission power at which the AP radio is transmitting<br />
the signal. Click on the Edit... button and edit the text field to adjust.<br />
● Antenna Type: Directly impacts the coverage area of an AP. Click on the Edit... button and<br />
click on the drop-down menu to select an antenna.<br />
● Antenna Height: The higher the antenna, the weaker the signal strength will be below the<br />
AP. To adjust the height, click on the Edit... button and edit the height text field.<br />
● Antenna down tilt: Some antennas are meant to be tilted down for optimal coverage. To<br />
adjust the downtilt, click on the Edit... button and type in the downtilt in degrees to the textbox.<br />
● Notes: Add text information about the access point.
Chapter 4. User Interface Overview<br />
To edit the properties of multiple APs at once, select the simulated access points you would<br />
like to edit, and click Actions > Edit Selected Simulated Access Points.<br />
Figure 4.10. Adjusting simulated access points<br />
1. 802.11 Technology (a/b/g/n)<br />
2. Click on the Edit... button to adjust antenna properties<br />
3. Tx Power, Height, and Antenna downtilt properties<br />
4. Antenna type<br />
5. Channel<br />
6. 802.11n properties<br />
4.5.9 One Access Point, Multiple MAC Addresses<br />
Many modern access points can be configured to broadcast several MAC addresses from a single<br />
physical access point. An example of this feature is when an AP is configured for multiple SSIDs.<br />
In order for <strong>Ekahau</strong> <strong>Site</strong> <strong>Survey</strong> to work properly in "multi-MAC environments", the MAC addresses<br />
coming from a single AP should be joined together. <strong>Ekahau</strong> <strong>Site</strong> <strong>Survey</strong> can join the MAC addresses<br />
automatically and alternatively manually. To view all the (joined) MAC addresses one single AP<br />
broadcasts and their corresponding 802.11 technologies and encryption methods, click on the<br />
MAC address button.<br />
22
23<br />
Chapter 4. User Interface Overview<br />
Figure 4.11. This single physical access point broadcasts three different MAC addresses and<br />
SSIDs<br />
4.5.9.1 Automatic and Manual Joining of Multi-MAC Access Points<br />
Automatic Detection of Multi-MAC Access Points<br />
By default, <strong>Ekahau</strong> <strong>Site</strong> <strong>Survey</strong> automatically joins together all major Wi-Fi vendors' light-weight,<br />
enterprise access points working on a multi-SSID. This option can be removed from View > Auto-<br />
Detect Multi-MAC Access Points. You can also adjust the auto-detection to only automatically<br />
join only selected brands of access points.<br />
Manual Joining of MAC Addresses<br />
If the access points are not joined together automatically and are broadcasting several MAC<br />
addresses, they can be joined manually:<br />
1. Select all the access points from the AP List that are actually a single access point<br />
2. Select Actions > Join Selected Access Points<br />
The two MAC addresses are now treated as a single access point.<br />
Figure 4.12. Joining multi-MAC access points manually<br />
4.5.9.2 Splitting Falsely Joined Access Points<br />
There might be cases where <strong>Ekahau</strong> <strong>Site</strong> <strong>Survey</strong> falsely detects and joins access points as Multi-<br />
MAC AP. This might be the case for example with some legacy Cisco access points. These falsely<br />
joined APs can be recognized from oversized signal coverage and from multiple distributed high<br />
signal strength peaks.
To split an falsely joined access point, click on the MAC address button of the falsely joined AP<br />
on the AP List view and after that, click on the Split button of the MAC address you want to be<br />
distinquished.<br />
Figure 4.13. Splitting access points<br />
4.5.10 802.11n Characteristics<br />
802.11n is the latest iteration of Wi-Fi, promising higher bandwidth up to 600Mbps, range, reliability<br />
and throughput than its predecessors 802.11a/b/g standards. Some of the main technical characteristics<br />
that enable these improvements in 802.11n are the number of Spatial Streams which is<br />
related to MIMO (Multiple Input Multiple Output), Extension Channel, Greenfield, and Short Guard<br />
Interval (SGI):<br />
Spatial Streams<br />
In 802.11n the data stream is divided into multiple parts called spatial streams. Each spatial stream<br />
is transmitted through separate antennas to corresponding antennas on the receiving side. When<br />
the number of spatial streams is doubled from one to two, the maximum data rate is also doubled<br />
from 150Mbps to 300Mbps. With three spatial streams it is possible to achieve 450Mbps data rate<br />
and with four spatial streams 600Mbps data rate.<br />
Extension Channel<br />
The 802.11n's optional extension channel is used to double the available bandwidth to achieve<br />
higher data rates. This is done by bonding two channels to occupy 40MHz channel width. In legacy<br />
802.11 Wi-Fi networks, the typical channel width is 25MHz. Thus, there is a good chance that the<br />
40MHz extended channel overlaps with some nearby legacy Wi-Fi networks enough to cause<br />
interference. It is highly recommended to use extension channel only in 5GHz frequency band<br />
due to the limited number of non-overlapping channels available in 2.4GHz frequency band.<br />
Greenfield Mode<br />
The Greenfield mode is used to improve efficiency in pure 802.11n networks by eliminating the<br />
unnecessary support for 802.11a/b/g devices. When this mode is enabled, only 802.11n clients<br />
can access the network. Thus, if you have legacy 802.11 clients that cannot access the network,<br />
make sure that you have this mode disabled.<br />
Short Guard Interval (SGI)<br />
Chapter 4. User Interface Overview<br />
Guard Interval defines the time between each district data transmissions. It is used to ensure that<br />
the district transmissions in the network do not interfere with each other when there are propagation<br />
delays, echoes, and reflections. Typically the guard interval should be two to four times the<br />
transmission delay spread. In 802.11a/g networks, the (long) guard interval is 800 ns allowing 200<br />
24
25<br />
ns delay spread. By shortening the guard interval it is possible to increase throughput of the network.<br />
Most office and home environments have much smaller delay spread than 200 ns, typically 50-<br />
100 ns. Thus, Short Guard Interval of 400 ns can boost the throughput by avoiding unnecessary<br />
idle times in the network.<br />
4.5.10.1 Measured Access Points<br />
<strong>Ekahau</strong> <strong>Site</strong> <strong>Survey</strong> can measure the 802.11n characteristics during site surveys. To view the<br />
characteristics of an 802.11n AP, click the 11n button on the Access Point List view.<br />
Figure 4.14. 802.11n characteristics<br />
Chapter 4. User Interface Overview<br />
In the above example, the AP with Cisco: A307 SSID has bonded two channels, 52 and 56 where<br />
the channel 56 is the extension channel. The AP has SGI enabled, Greenfield mode disabled, and<br />
it uses two spatial streams.<br />
4.5.10.2 Simulated Access Points<br />
The 802.11n characteristics can also be adjusted when working with simulated 802.11n access<br />
points. To adjust the characteristcs of an 802.11n AP, click the Edit... button of the simulated AP<br />
on the Access Point List view. Note that access points with multiple radios need to be adjusted<br />
one radio at a time.<br />
Figure 4.15. Adjusting 802.11n characteristics of an simulated access point
Menu<br />
File<br />
File<br />
File<br />
File<br />
File<br />
4.6 The <strong>Survey</strong>s List<br />
Figure 4.16. <strong>Survey</strong>s list<br />
Every time you stop a survey (by right-clicking the mouse when surveying), a <strong>Survey</strong> will be added<br />
to the <strong>Survey</strong>s list. The <strong>Survey</strong>s list will show the name of the survey, as well as the map the survey<br />
was performed on.<br />
Using the <strong>Survey</strong>s list, you can select and de-select the surveys. If you want to visualize the network<br />
coverage and performance for specific surveys only (such as only the surveys that have been<br />
performed recently), simply de-select the other surveys. To select, de-select, and delete multiple<br />
<strong>Survey</strong>s, simply select more than one <strong>Survey</strong>, right-click on one of the surveys, and select the<br />
desired action from the context menu.<br />
Similarly to access point notes, you can also write down notes for each survey. Simply click the<br />
note icon to edit the survey notes.<br />
4.7 The Building View<br />
The building view is only necessary when creating three dimensional network plans. For information<br />
on how to use the Building View, see chapter Designing a Wi-Fi Network.<br />
4.8 Menus<br />
Chapter 4. User Interface Overview<br />
Use the menus to access file operations, site specific operations, zooming and more.<br />
Selection<br />
New<br />
Open<br />
Save<br />
Save As<br />
Export as XML<br />
Description<br />
Create a new Project<br />
Open an existing Project<br />
Save the Project using the existing<br />
file name<br />
Save the Project using a different<br />
file name<br />
Export the Project as an XML file<br />
26
27<br />
Menu<br />
File<br />
File<br />
File<br />
File<br />
File<br />
File<br />
Edit<br />
Edit<br />
View<br />
View<br />
View<br />
View<br />
View<br />
View<br />
View<br />
View<br />
View<br />
View<br />
<strong>Site</strong><br />
<strong>Site</strong><br />
<strong>Site</strong><br />
<strong>Site</strong><br />
<strong>Site</strong><br />
<strong>Site</strong><br />
Chapter 4. User Interface Overview<br />
Selection<br />
Export Image<br />
Print Image<br />
Report<br />
Merge<br />
Preferences<br />
Exit<br />
Undo<br />
Redo<br />
Zoom In<br />
Zoom Out<br />
Zoom to Fit<br />
Zoom 1:1<br />
<strong>Survey</strong>s<br />
GPS Reference Points<br />
Access Points<br />
Access Point Names<br />
Floor Alignment Points<br />
Walls<br />
Add Map<br />
Duplicate Map<br />
Change Map Image<br />
Remove Map<br />
Active Map<br />
Edit Requirements<br />
Description<br />
Export the currently displayed map<br />
image and visualization<br />
Print the currently displayed map<br />
image and visualization<br />
Generate a report of the network<br />
Merge another Project with the current<br />
Project<br />
Change the product preferences,<br />
such as the length unit<br />
Exit the program<br />
Undo the previous action<br />
Redo the undone action<br />
Zoom in to see an area in more<br />
detail<br />
Zoom out to see a wider area of the<br />
map at once<br />
Fit the map into the window<br />
Zoom to see the map in its actual<br />
pixel size<br />
Show or hide the survey routes<br />
Show or hide the GPS Reference<br />
Points<br />
Show or hide the access point icons<br />
Show or hide the access point<br />
names<br />
Show or hide the Floor Alignment<br />
Points<br />
Show or hide the Walls<br />
Add a map to the Project<br />
Make a duplicate of the currently<br />
displayed map<br />
Change the currently displayed map<br />
image<br />
Remove a map from the Project<br />
Select the currently displayed map<br />
Edit the network requirements
Menu<br />
<strong>Site</strong><br />
<strong>Site</strong><br />
<strong>Site</strong><br />
<strong>Site</strong><br />
<strong>Site</strong><br />
<strong>Site</strong><br />
Device<br />
Device<br />
Help<br />
Help<br />
Help<br />
Chapter 4. User Interface Overview<br />
Selection<br />
Start Auto-Planner<br />
Locate <strong>Survey</strong>ed Access Points<br />
Clear <strong>Survey</strong>ed Access Points Locations<br />
Auto-Detect Multi-MAC APs<br />
Replaced Access Points<br />
Edit Project Notes<br />
Live Network Status<br />
Devices<br />
Quick Guide<br />
User Guide<br />
About<br />
4.9 Software Preferences<br />
Description<br />
Open Auto-Planner dialog and<br />
choose network requirements for<br />
the network simulation<br />
Automatically place the access<br />
points (that were detected during<br />
the survey) on the map<br />
Clear all AP locations from the map<br />
Automatically detect access points<br />
distributing multiple MAC addresses<br />
View Replaced Access Points<br />
Edit text notes about the Project<br />
View the currently audible Wi-Fi<br />
signals, and quickly troubleshoot<br />
issues without a map<br />
Shows the currently connected Wi-<br />
Fi devices<br />
Open the Quick Guide<br />
Open the User Guide<br />
See product information, upgrade<br />
license<br />
To adjust software preferences, go to File > Preferences. The preferences include:<br />
● Changing the length unit (meters / feet)<br />
● Setting the regulatory domain to limit network adapter scanning<br />
● Enabling or disabling Real-Time Location Tracking System features<br />
● Enabling or disabling automatic map scrolling while surveying<br />
28
29<br />
5 Starting to work with <strong>Ekahau</strong> <strong>Site</strong> <strong>Survey</strong><br />
5.1 Starting <strong>Ekahau</strong> <strong>Site</strong> <strong>Survey</strong><br />
After the installation, ensure the following before starting <strong>Ekahau</strong> <strong>Site</strong> <strong>Survey</strong>:<br />
● For traditional passive surveys: A supported Wi-Fi adapter is enabled and connected to your<br />
laptop (Visit http://www.ekahau.com/devices for the list of supported adapters)<br />
● For Hybrid <strong>Survey</strong>s: A supported external Wi-Fi adapter is connected to your laptop and a<br />
supported integrated Wi-Fi adapter is enabled and associated with a Wi-Fi network using the<br />
Windows Wi-Fi Management tool<br />
● All other programs are closed<br />
● You are logged in as the computer administrator, or have administrative privileges<br />
To start <strong>Ekahau</strong> <strong>Site</strong> <strong>Survey</strong>, click Start > Programs > <strong>Ekahau</strong> > <strong>Ekahau</strong> <strong>Site</strong> <strong>Survey</strong>.<br />
5.2 Setting the Map and Scale<br />
The functionality of the program mostly relies on the floor plan(s) of the facility. You will need to<br />
insert at least one map and set its scale. For multi-floor buildings, add multiple maps, one for each<br />
floor.<br />
Note<br />
Maps larger than 5000 x 10000 pixels are not recommended to be used as this slows down the<br />
software. For optimal performance, please use maps smaller than 5000 x 5000 pixels.<br />
To insert a map, click <strong>Site</strong> > Add Map or click the + sign next to the map selector.<br />
The following image formats are supported for maps:<br />
● BMP, WBMP<br />
● JPG, JPEG<br />
● PNG<br />
● GIF<br />
● SVG (SVG drawings)<br />
● DWD, DXF (CAD drawings)<br />
Chapter 5. Starting to work with <strong>Ekahau</strong><br />
<strong>Site</strong> <strong>Survey</strong><br />
You also need to set the scale for each map. To set the scale, you need to know the distance<br />
between two points on the map. It is recommended to use a measuring tape to measure the distance<br />
between the points. Once measuring the real-world distance, set the scale in ESS:<br />
● Select the scale tool<br />
● Indicate the distance between the two points by clicking the first point, and holding down the<br />
left mouse button while moving the mouse pointer to the second point<br />
● You will see a line between the two points, and a tooltip indicating the number of pixels. Click<br />
on the tooltip on the ft / m field and type in the distance between the two points in feet or<br />
meters.
Figure 5.1. Use common objects whose width / length is typically known such as doors to set the<br />
correct scale<br />
1. The door width is 1 meter / 3.3 feet which in this map image corresponds to 50 pixels.<br />
Tip<br />
To set the length unit between feet and meters, go to File > Preferences.<br />
Note<br />
It is highly important to set the correct scale! Otherwise some visualizations and simulations<br />
may not be shown correctly.<br />
5.2.1 Changing the Map Image<br />
In some cases, the underlying map image used needs to be changed, without losing all the infromation<br />
about the surveys or about the predictive design. To change the underlying map image,<br />
go to <strong>Site</strong> > Change Map Image.<br />
Note<br />
Chapter 5. Starting to work with <strong>Ekahau</strong><br />
<strong>Site</strong> <strong>Survey</strong><br />
The replacing map image needs to be of the same size and scale as the original map image.<br />
5.3 Defining Network Requirements<br />
Each Wi-Fi installation is different. Whether the network is used for e-mails, voice over Wi-Fi, or<br />
location tracking, the application determines what kind of coverage and performance is required<br />
from the network. <strong>Ekahau</strong> <strong>Site</strong> <strong>Survey</strong> allows you to set the requirements for the network, and see<br />
30
31<br />
Chapter 5. Starting to work with <strong>Ekahau</strong><br />
<strong>Site</strong> <strong>Survey</strong><br />
if the requirements are met, with a single view. In <strong>Ekahau</strong> <strong>Site</strong> <strong>Survey</strong>, the following criteria are<br />
included in a Requirement:<br />
● Signal strength (minimum signal strength for the strongest AP)<br />
● Signal-to-noise ratio (minimum SNR, given a minimum allowed data rate in the network)<br />
● Data rate (minimum)<br />
● Number of audible APs (the minimum number of audible APs, given a minimum signal<br />
strength)<br />
● Ping Round Trip Time (minimum round trip time for ping)<br />
● Packet Loss (packet loss %, calculated from the last 10 packets)<br />
In addition to requirements, you can choose the following conditions that affect the coverage and<br />
network performance:<br />
● Use Noise from (the source of the noise data - choose either Measured Data, Simulated<br />
Interference or Automatic which uses Measured Data when available )<br />
● Network load (the estimated amount of wireless traffic in the network)<br />
● Adapter (the end users' wireless adapter)<br />
To define the Requirements, select <strong>Site</strong> > Edit Requirements.<br />
Figure 5.2. Setting the wireless network requirements using the Requirements dialog<br />
The Requirement defines what your network is used for. You can either select one of the predefined<br />
Requirements, such as Basic Connectivity or Voice over WLAN. If none of the Requirements<br />
matches the purpose your network will be used for, you can either customize the existing profiles<br />
or create new ones. If you want to keep the existing Requirement, and want to make a slightly<br />
different one, you can make a duplicate of the selected Requirement. The requirements are<br />
explained in more detail in chapter Visualizing Network Coverage and Performance.
Chapter 5. Starting to work with <strong>Ekahau</strong><br />
<strong>Site</strong> <strong>Survey</strong><br />
32
33<br />
6 Designing a Wi-Fi Network<br />
Note<br />
The network design capabilities are only available in <strong>Ekahau</strong> <strong>Site</strong> <strong>Survey</strong> Pro version. You may<br />
skip this chapter if you want to directly perform to performing site survey, or troubleshooting.<br />
When designing a new Wi-Fi network, <strong>Ekahau</strong> <strong>Site</strong> <strong>Survey</strong> is able to create a network plan for you<br />
automatically. In ESS this feature is called as Auto-Planner. The Auto-Planner saves you significant<br />
amounts of time by cutting down the manual work of placing access points and configuring their<br />
channels by hand.<br />
Prior to deploying a Wi-Fi network with the Auto-Planner, you will need to indicate the coverage<br />
area(s) where you need Wi-Fi coverage. In addition, you will need to draw walls for the coverage<br />
area(s) so that ESS can calculate the optimal AP locations and configuration(s). In case you want<br />
to deploy a network plan for multi-floor building(s), please refer to chapter Designing Wi-Fi Networks<br />
for Multi-Floor Buildings on page 40 for more information on how to define multi-floor buildings.<br />
Proper network planning will reduce costs in the long run, and will lead to better coverage and<br />
performance also. After creating the network plan, you will know:<br />
● The optimal locations for your Wi-Fi access points<br />
● Antennas and their alignment<br />
● Optimal AP configurations, such as transmission power and channels<br />
● The predicted coverage and performance of your network<br />
Figure 6.1. A network plan with walls, simulated access points, and floor alignment points<br />
Note<br />
Chapter 6. Designing a Wi-Fi Network
If you leave the access point transmit power settings to Automatic Radio Management (Radio<br />
Resource Management, Radio Management) from your wireless LAN management software,<br />
using the default 25mW transmit power is recommended when creating simulated APs .<br />
6.1 Creating a Network Plan with Auto-Planner<br />
Note<br />
You can use the Auto-Planner only with empty projects. In case there are simulated access<br />
points in the project, the Auto-Planner will clear them from the project. The auto-planner will not<br />
take in account recorded survey data either. Thus, the Auto-Planner cannot be used for network<br />
expansion.<br />
In order to create an accurate network plan, you will need to have the map(s) and scale(s) set.<br />
You will also need to define the main walls of the building. With this information, ESS can calculate<br />
the Wi-Fi signal propagation. Once the environment has been defined as well as the desired coverage<br />
area, you can use the Auto-Planner to create the network plan. Alternatively, you can create<br />
the network plan by yourself by placing and configuring simulated access points. Both methods<br />
are explained in detail in the following chapters. For more information on how to add maps and<br />
how to set scales, please refer to chapter Setting the Map and Scale on page 29<br />
6.1.1 Drawing and Editing Walls<br />
To define the environment, you will have to draw walls. To do this, you will need to go to the<br />
Planning tab and select the Wall tool. First, you will need to select the wall material that most<br />
closely matches the wall you're going to draw. To draw the walls, simply keep left-clicking on the<br />
map. If you want to end the wall drawing, just right-click.<br />
You can edit the walls that you have drawn by first selecting the Edit tool and left-clicking the wall<br />
you want to edit. You can edit multiple walls at the same time by holding down the Ctrl key while<br />
selecting the walls. To edit the wall(s), simply drag-and-drop the wall(s) to its new location. You<br />
can also change the wall material by right-clicking the wall and selecting Change Wall Type.<br />
Note<br />
Chapter 6. Designing a Wi-Fi Network<br />
By default, the walls are drawn in 15 degree angles. To draw walls in any angle, hold down the<br />
Ctrl key while drawing walls.<br />
6.1.1.1 Customizing the Wall Materials<br />
If you want to customize the wall materials, you will need working knowledge of XML or HTML,<br />
and a plain text editor. The wall materials are specified in the wallTypes.xml file, located in the<br />
34
35<br />
Tag<br />
id<br />
name<br />
width<br />
absorption<br />
color<br />
conf folder under the product installation folder. To edit the wall materials, open the wallTypes.xml<br />
file with a plain text editor, and add, remove or edit the wall materials. The tags are explained in<br />
the table below:<br />
Description<br />
An identifier for the wall material. Needs to be unique for each material.<br />
The name of the wall material, displayed in the user interface<br />
The width of the wall material<br />
The absorption factor of the wall material, in dB per meter<br />
The color of the wall material, represented as hex triplets. For more<br />
information, see http://en.wikipedia.org/wiki/Web_colors<br />
When inserting new wall materials, you will need to measure the signal strength both in front and<br />
behind the wall. Subtract the former from the later and you will get the signal loss in dB. Then<br />
measure the width of the wall, and calculate the absorption factor by diving the signal loss with<br />
the wall width in meters. Insert the new wall material into the conf file, save the file, and re-start<br />
ESS.<br />
Note<br />
Chapter 6. Designing a Wi-Fi Network<br />
It is recommended to make a backup copy of the wall materials list before editing it.<br />
6.1.1.2 Duplicating Maps with Similar Layouts<br />
If several floors have similar or fairly similar wall layouts, it is recommended to duplicate the map<br />
to avoid unnecessary drawing of walls. When you duplicate a map, the map image and the walls<br />
will be duplicated. This allows you to only draw the walls to a single floor, and use the same wall<br />
structure for the other floors. If the floors are slightly different, it may still be easier to duplicate the<br />
floor and then edit the walls for the areas that are not similar. Click <strong>Site</strong> > Duplicate Map to make<br />
a duplicate of the map.<br />
6.1.2 Indicating Network Coverage Areas<br />
In order to create the automated network plan, you will have to define the network coverage area<br />
where you would like to have Wi-Fi coverage. To do this, use the Coverage Area tool in the Planning<br />
tab to indicate the areas where you need Wi-Fi coverage. When using the tool, left-click to add<br />
points to the polygon, and right-click to end the polygon.
Chapter 6. Designing a Wi-Fi Network<br />
Figure 6.2. Coverage Area and Auto-Planner buttons<br />
1. Click the Coverage Area button to define network coverage areas<br />
2. Click the Auto-Planner button to open network requirements dialog and to create the network<br />
plan<br />
Figure 6.3. Drawing the network coverage area<br />
1. When you are drawing the network coverage area, the currently selected area will be displayed<br />
as lilac<br />
2. After you have drawn the desirable network coverage area, it will be bordered with a dash<br />
line and the lilac colour will disappear<br />
36
37<br />
6.1.3 Configuring Auto-Planner<br />
After you have defined the network coverage areas, click the Auto-Planner button to open the<br />
Auto-Planner dialog where you can select the Network Requirement, Access Point type as well<br />
as Channel Assignment.<br />
Figure 6.4. Auto-Planner dialog<br />
Chapter 6. Designing a Wi-Fi Network<br />
1. Choose the network requirement type for your plan - You can select from one of the predefined<br />
requirements or define your own requirement - How to edit or define your own network<br />
requirements is explained in more details in chapter Defining Network Requirements on page<br />
30 - Note that the in Auto-Planner only the Signal Strength and Number of APs requirements<br />
are taken in account<br />
2. Select the Wi-Fi band, either 2.4 GHz or 5 GHz - If you want to optimize your network for 5<br />
GHz Wi-Fi band, the network will be more dense than for 2.4 GHz<br />
3. Select the Access Point type you want to use in the network plan as well as Transmit power,<br />
Antenna height, and 802.11n characteristics<br />
4. Define the Channel Assignment you want to use for your network plan - You can select a<br />
predefined channel assignment, just a single channel for example if you are using Meru Access<br />
Points, or none meaning that you will assign the channels after the network plan has been<br />
deployed
Chapter 6. Designing a Wi-Fi Network<br />
After you have defined the requirements for you network plan, click the Create Plan button to<br />
deploy the network plan. The plan will be deployed for all floors in the building where you have<br />
defined the coverage areas. For separate floor maps that are not defined as a building, the network<br />
plan needs to be deployed separately for all floor maps.<br />
If you are not satiesfied with the network plan, you can just re-run the Auto-Planner with a different<br />
Requirement, Access Point type, and/or Channel Assignment. Every time you re-run the Auto-<br />
Planner, it will clear the previous Access Point layout(s) and the AP configurations. Alternatively,<br />
you can manually change the location of the Access Point(s) with the Select tool or add more<br />
simulated access points. For more details on how to work with simulated access points, please<br />
refer to chapter Creating the Network Plan Manually Using Simulated Access Points on page 38.<br />
Figure 6.5. An example Wi-Fi network plan created with the Auto-Planner - This particular network<br />
plan is optimized for Location Tracking<br />
6.2 Creating the Network Plan Manually Using Simulated<br />
Access Points<br />
Before you can start working with simulated access points, you need to define the environment<br />
which includes adding the necessary maps, defining the scale, and drawing walls. How to draw<br />
walls is explained in more details in chapter Drawing and Editing Walls on page 34. After the<br />
environment has been defined, you can start simulating your network to find out the optimal network<br />
configuration.<br />
38
39<br />
To start predicting the network performance, place one or more simulated access points on the<br />
map:<br />
1. Select the Simulated Access Point Tool from the Planning Tab<br />
2. Choose the access point you want to simulate. You can simulate either a pre-defined AP or<br />
a customized AP with a particular antenna.<br />
3. Place the access point on the map with a left-click. If Always Refresh Automatically visualization<br />
option is enabled, you should instantly see a visualization for the placed access point.<br />
4. Click either the rectangle on the right-hand side of the AP or the Edit... button on the AP List<br />
to edit the antenna, band, channel, and transmission power for the simulated access point.<br />
If you are simulating a 802.11n AP, you can also edit the Extension channel, # of Supported<br />
Spatial Streams, Greenfield, and Short Guard Interval properties.<br />
5. Repeat steps 2-4 to place more access points<br />
Figure 6.6. Editing simulated access point<br />
1. Click to edit a simulated access point<br />
Chapter 6. Designing a Wi-Fi Network<br />
You can move a simulated access point by simply dragging them on the map when the Edit tool<br />
is selected (hold down the left mouse button while moving the AP).<br />
To delete a simulated access point, right-click on the access point on the map and select "delete".<br />
After placing the APs on the map, the properties of the APs can be changed using the AP list.<br />
Refer to the chapter User Interface Overview to read more about changing the properties of the<br />
access points that have already been placed.<br />
6.2.1 Optimizing Access Point Layout and Configuration<br />
There are several ways to find the optimal number, placement and configuration for your APs.<br />
Here's one recommended method:<br />
1. Set the maps, scale, walls, and optionally building layout and floor alignment points<br />
2. Select Network Health for My APs, and select the appropriate Requirement<br />
3. Start placing access points and configuring them. Use the Network Health visualization to<br />
see if the network meets your requirements. If it does not, use the Network Issues visualization<br />
to see what the problem is. If it is low signal strength or overlap, add more access points or<br />
move the existing access points.<br />
If the problem is low signal-to-noise ratio, or low data rate, the problem may be in the channel<br />
separation - there is probably just too much channel interference. Optimize the channel separation<br />
by adjusting the channels of the APs - for 802.11b/g, channel separations such as 1-<br />
6-11, 1-4-8-11, 1-5-9-13, or 1-7-13 are typically recommended.<br />
4. Continue until you have found a satisfactory wireless network.
6.3 Designing Wi-Fi Networks for Multi-Floor Buildings<br />
In multi-floor buildings, signals propagate through floors, just like they propagate through walls. It<br />
is essential to take this into account when designing Wi-Fi networks, as the floor-to-floor signal<br />
propagation can be used to your benefit: You may need less access points as an access point on<br />
the floor above or below may cover an area that would have need an additional access point otherwise.<br />
However, the signals penetrating floors may also harm the network performance if there is cochannel<br />
interference created between access points on nearby floors. This must be accounted<br />
for also in the network design.<br />
To simulate a multi-floor model in ESS, you will need to define the building layout (the floor<br />
order, height, and floor material), and set at least three Floor Alignment Points per floor.<br />
6.3.1 Defining the Building Layout<br />
Figure 6.7. A sample building view enabling 3D planning for two floors<br />
1. Select building<br />
2. 3D planning status indicator<br />
3. Add / Remove buildings<br />
4. Floor material<br />
5. Map image<br />
6. Add / Remove floors<br />
Chapter 6. Designing a Wi-Fi Network<br />
40
41<br />
7. Floor height<br />
Chapter 6. Designing a Wi-Fi Network<br />
To define the building layout, go to the Building tab in the left-hand side lists.<br />
1. Assign a map image with the floor: You will need to select the appropriate map image for<br />
each floor. It is important to note that the lowest floor is on the bottom in the Building view. A<br />
single map can only be assigned for one floor.<br />
2. Select a floor material: Select the floor material that best matches your environment.<br />
3. Set the floor height: Measure the height of the floor (from floor to ceiling), and set it.<br />
A status indicator at the top of the screen will assist you in defining the building layout. Once the<br />
status indicator states OK, you will be able to see the simulated AP signals penetrating the floors.<br />
Use the Actions button to add buildings. This allows making network plans for multiple buildings<br />
within a single project.<br />
6.3.2 Setting Floor Alignment Points<br />
Map images between floors may differ in terms of rotation, and offset, for example. To align the<br />
floors for 3D prediction, you will need to use Floor Alignment Points.<br />
You will need to find three locations in the building that are identifiable at each floor. Stairwells,<br />
elevator shafts, building corners, and building pillars are good examples: Typically they are in the<br />
same locations on each floor. These will serve as your Floor Alignment Points. To mark them:<br />
1. Select the map you want to place the Floor Alignment Points to<br />
2. Select the Floor Alignment Point Tool in the Planning Tab<br />
3. Optionally name the floor alignment point, such as "Staircase West"<br />
4. Place the floor alignment point on the map by left-clicking.<br />
5. Repeat steps 2-4 so that each map has at least 3 Floor Alignment Points.
Figure 6.8. Two floors of a building with alignment points correctly placed in the same locations<br />
in both floors<br />
Note<br />
Chapter 6. Designing a Wi-Fi Network<br />
The floors that are connected to each other need to share three reference points. If you use<br />
reference points in different locations for different floors, ensure that each floor is connected by<br />
a minimum of three reference points.<br />
6.3.3 Visualizing Floor-to-Floor Signal Coverage<br />
To visualize how access points are audible from one floor to another:<br />
1. Ensure from the Building tab that your 3D propagation model has been correctly defined<br />
2. Clear the AP selections by clicking Actions > Select None<br />
3. Select a floor that you want to see the signals radiating to<br />
4. Using the AP list, select the access points that are of interest (for example, the access points<br />
on the floor above and floor below the floor you're currently looking at)<br />
5. Select Show Signal Strength for Selected Access Points. If any of the APs on the floors<br />
below and above are audible to this floor, you will see their coverage.<br />
42
43<br />
7 <strong>Site</strong> <strong>Survey</strong>s - Ensuring Sufficient Coverage and<br />
Performance On-<strong>Site</strong><br />
7.1 Performing <strong>Site</strong> <strong>Survey</strong>s<br />
With <strong>Ekahau</strong> <strong>Site</strong> <strong>Survey</strong>, you simultaneously perform traditional passive surveys as well as active<br />
surveys - this is called Hybrid <strong>Survey</strong>. Passive surveys measure signal strength, SNR, and other<br />
information, whereas active surveys measure end-to-end connectivity.<br />
During the active survey, an end-to-end connection is made to a specific host, ensuring that the<br />
network truly works and delivers the required performance. The end-to-end network connectivity<br />
testing can be used for:<br />
● Detecting significant latency - Excellent for investigating latency-sensitive applications such<br />
as VoIP over WLAN<br />
● Detecting dropped packets - Solve problems possibly caused by low coverage, roaming<br />
issues, and hardware defects<br />
● Visualize roaming areas - Visualize which AP the Wi-Fi adapter was connected to in different<br />
locations<br />
During the traditional passive survey, signal readings from all the audible access points are<br />
measured and all the audible access points will be discovered and added to the AP list. In addition<br />
to the access points in your network, you are likely to discover other access points as well: some<br />
may be audible from the neighboring office or even the neighboring building, and some may be<br />
"rogue" access points placed in your environment without authorization.<br />
To perform a Hybrid <strong>Survey</strong>, you will need two Wi-Fi network adapters. Please visit<br />
http://www.ekahau.com/devices for the list of supported adapters. The external network adapter<br />
(such as <strong>Ekahau</strong> NIC-300) will be used to capture passive signal readings whereas the integrated<br />
Wi-Fi adapter will be used for the end-to-end testing. The integrated Wi-Fi adapter has to be<br />
associated with a Wi-Fi network and the network has to allow ICMP echo requests (Ping).<br />
To perform a <strong>Site</strong> <strong>Survey</strong>:<br />
Chapter 7. <strong>Site</strong> <strong>Survey</strong>s - Ensuring Sufficient<br />
Coverage and Performance On-<strong>Site</strong><br />
● Ensure that both of your wireless network adapters (external & integrated) have been enabled<br />
in your laptop. Check the Miniature Signal View to see if the external network adapter is successfully<br />
scanning access points. Alternatively, you can use your integrated network adapter<br />
to scan access points when not performing end-to-end connectivity testing.<br />
Figure 7.1. The Miniature Signal View should show signals updating before starting the survey.<br />
● If you are using an inappropirate driver with your external adapter, a warning will be given.<br />
To achieve the optimal accuracy, use the driver provided by <strong>Ekahau</strong>. For information on how<br />
to update the driver, see chapter Wi-Fi Network Adapter Driver Update.<br />
Figure 7.2. A warning will be given if an inappropriate driver is used.
● When testing the end-to-end connectivity, ensure that you are able to collect Ping data. The<br />
Miniature Ping View will display No Ping Host message if valid Ping Host has not been found.<br />
By default, the Ping Host is Default Gateway, but it can be changed by clicking the Miniature<br />
Ping View.<br />
Figure 7.3. No Ping Host message will be displayed if valid Ping Host has not been set.<br />
● Click the Record <strong>Survey</strong> button. ESS will start the end-to-end connectivity testing automatically<br />
if the internal Wi-Fi adapter has been enabled for Hybrid <strong>Survey</strong> and valid Ping Host has been<br />
found / set.<br />
Figure 7.4. Miniature Ping View displaying successful Ping packets (green) vs. lost packets<br />
(red).<br />
● Click your current location on the map to start collecting signal information as well as end-toend<br />
connectivity measurements.<br />
● Start walking at a slow, steady speed. Click the map whenever you start or stop walking, and<br />
whenever you change your speed or direction.<br />
● Right-click the map when you want to finish the current survey and continue from another<br />
location.<br />
● Release the Record button when finished surveying.<br />
Note<br />
<strong>Ekahau</strong> <strong>Site</strong> <strong>Survey</strong> automatically scrolls the map when you click your location close to the edge<br />
of the screen. You can disable this feature from File > Preferences.<br />
The data is recorded continuously during a <strong>Survey</strong>, not just when you click on the map. The data<br />
will be interpolated on the map between two mouse clicks. If you do not stop at any point, but<br />
rather continue walking when reaching a given point, you only need to click on the map once at<br />
every turn. If you stop somewhere for more than one second, you should click on the map when<br />
you arrive, and click again on the same location as you leave. The upside of the continuous<br />
recording is that you gather more data during your survey. In addition, you only need to click twice<br />
(at the beginning and at the end) when walking a straight line, such as a hallway.<br />
If SSID Broadcast has been disabled in the access points, the SSID will not be detected by ESS.<br />
However, the MAC address and other information of the AP will still be detected. Enabling at least<br />
one SSID to be broadcast for the duration of the site survey may help in organizing and selecting<br />
the access points.<br />
Tip<br />
Chapter 7. <strong>Site</strong> <strong>Survey</strong>s - Ensuring Sufficient<br />
Coverage and Performance On-<strong>Site</strong><br />
You will see the signal strength of the strongest access point (red=low, green = high) on the<br />
survey route while performing the survey. If you do not see anything on the survey route while<br />
performing the survey, check your network adapter and network adapter driver.<br />
44
45<br />
Tip<br />
Keep the surveys fairly short to allow more flexibility for deleting and modifying the survey<br />
data. An optimal survey length varies from a few rooms to a wing of a building. Right-click to<br />
end the survey every now and then, and continue surveying by simply left-clicking on the map<br />
again. There is no need to manually create a new survey - the current survey is ended with a<br />
right-click, and a new survey is created automatically when you continue surveying.<br />
Warning<br />
Chapter 7. <strong>Site</strong> <strong>Survey</strong>s - Ensuring Sufficient<br />
Coverage and Performance On-<strong>Site</strong><br />
Do not insert or remove network adapters or other devices during the survey.<br />
7.1.1 Configuring the Wi-Fi Device for Passive <strong>Survey</strong>s<br />
To configure your Wi-Fi device, go to Device > Devices or click the Network Adapter Settings<br />
icon. From the Devices Window, you can see the connected Wi-Fi devices, their status and device<br />
information. To activate a different Wi-Fi device, select the adapter from the Devices list and click<br />
Activate. To configure the signal scan settings of the selected Wi-Fi adapter, click Scanning<br />
Configuration. This allows you to configure:<br />
● Bands: Select to scan either 2.4GHz or 5GHz frequency. Scanning just one band reduces<br />
the overall scan time, which allows more data to be collected over time, which, in turn, allows<br />
faster surveys.<br />
● Channels: Select which channels to scan on 2.4GHz by adding it to the Selected Channels<br />
list. Limiting the number of channels allows faster surveys. Channels will only be limited if<br />
Custom channels setting is selected.<br />
● Wait time per channel: Set the number of milliseconds to wait on each channel for 802.11<br />
packets (probe responses or beacons). The smaller the channel wait time, the less time the<br />
access point has to send packets to the network adapter, but the faster you can survey the<br />
facility. If your wireless network is extremely crowded, increase the wait time. If broadcast<br />
SSID is disabled in your access points, increase the wait time to 100ms or more.
Figure 7.5. The Scanning Configuration Tab<br />
Note<br />
Chapter 7. <strong>Site</strong> <strong>Survey</strong>s - Ensuring Sufficient<br />
Coverage and Performance On-<strong>Site</strong><br />
The scan settings cannot be configured for all Wi-Fi devices. For example, the scan settings in<br />
the built-in Wi-Fi adapter of an Intel Centrino cannot be configured.<br />
7.1.2 Configuring the Wi-Fi Devices for Hybrid <strong>Survey</strong>s<br />
The end-to-end network performance testing is always made with the laptop's integrated Wi-Fi<br />
network adapter. The integrated network adapter has to be connected to the Wi-Fi network to be<br />
able to measure the network performance. To connect, use Windows Wi-Fi Management tool.<br />
By default, <strong>Ekahau</strong> <strong>Site</strong> <strong>Survey</strong> pings the Default Gateway. You can change the Ping Host by<br />
clicking the Miniature Ping View icon. To ensure the defined Ping Host replies to ping, click the<br />
Start button. It is not necessary to leave the Ping enabled as ESS will enable it automatically when<br />
you start recording Hybrid <strong>Survey</strong>s.<br />
In Hybrid <strong>Survey</strong> mode, the traditional signal measurement is always made with the external Wi-<br />
Fi adapter. To configure the external Wi-Fi adapter, please see chapter Performing <strong>Site</strong> <strong>Survey</strong>s<br />
on page 43.<br />
7.1.3 Moving and Deleting <strong>Survey</strong> Points<br />
After the survey, it may be necessary to move or delete <strong>Survey</strong> points - perhaps because the<br />
location was not clicked properly in some locations. To move or delete <strong>Survey</strong> Points, right-click<br />
46
47<br />
on a survey point and select Move <strong>Survey</strong> Point or Delete <strong>Survey</strong> Point. When you delete a <strong>Survey</strong><br />
point from a survey, the <strong>Survey</strong> will be split into two.<br />
7.1.4 GPS Assisted Outdoor <strong>Site</strong> <strong>Survey</strong>s<br />
ESS allows you to use a GPS handheld to perform site surveys outdoors, without having to click<br />
on the map. For example, by connecting a GPS receiver to your Wi-Fi enabled laptop, you can<br />
simply drive around the coverage area of a municipal Wi-Fi network, and ESS will automatically<br />
plot the route on the map in addition to taking the Wi-Fi measurements.<br />
7.1.4.1 Supported GPS Receivers<br />
A GPS receiver is required for the GPS survey feature to work. The following GPS receivers are<br />
supported:<br />
● Bluetooh GPS devices, that support NMEA<br />
● USB GPS devices that support NMEA, Garmin Protocol or Trimble TAIP<br />
● Network connected GPS devices (usually using TCP/IP or UDP), that supports TAIP or NMEA<br />
● GPS devices connected to PC-CARD that supports NMEA<br />
● GPS devices that are connected to an RS-232 port, that support NMEA, Garmin or TAIP<br />
GPS Navigators are typically not supported, even if they have a USB connection.<br />
7.1.4.2 Performing GPS Assisted <strong>Survey</strong>s<br />
To perform an outdoor survey using GPS:<br />
Chapter 7. <strong>Site</strong> <strong>Survey</strong>s - Ensuring Sufficient<br />
Coverage and Performance On-<strong>Site</strong><br />
1. Connect a GPS receiver to your laptop<br />
2. Turn on the receiver, make sure it is outputting data in one of the supported formats. You will<br />
need to be outdoors for the GPS receiver to work properly.<br />
3. In the user interface, check the Use GPS checkbox. If you do not see the Use GPS checkbox<br />
in the top-right corner of the user interface, ensure that you have purchased ESS Professional<br />
version.<br />
4. If your GPS device has not been previously configured, a GPS configuration dialog will pop<br />
up.<br />
Typically, the default settings are recommended.<br />
When asked "Do you want to use this device", select Yes.<br />
In the output selection, ensure that the "share my GPS between several applications" option<br />
has been selected.<br />
5. ESS needs to be able to transform the GPS coordinates into map coordinates. For this, you<br />
will need to place three GPS Reference Points on the map.<br />
To place the Reference Points, use the GPS Reference Point Tool on the <strong>Survey</strong> tab. Click<br />
on the map to place a GPS Reference Point. When placing the Reference Points, you will<br />
need to either know the latitude/longitude coordinates for the Reference Point location, or<br />
alternatively be physically located there with your GPS receiver turned on, in which case the<br />
coordinates will be taken from the GPS receiver. Repeat until you have three reference points<br />
on the map.<br />
6. Now you should see the blue circle on the map, indicating your current location. If it is not,<br />
check if you see an exclamation mark next to the Use GPS button. If so, move your mouse<br />
over the exclamation mark to see the error.<br />
7. In the <strong>Survey</strong> tab, click the GPS Record button to start the survey.<br />
8. Drive or walk throughout the outdoor area you wish to survey.
9. End the survey by clicking the GPS record button again.<br />
Note<br />
If the GPS device is not detected, re-try the GPS device detection. If the GPS device is not<br />
detected after several retries, try using the advanced options to adjust the GPS configuration<br />
to your needs.<br />
Note<br />
To ensure measurement accuracy, take the reference points at least 300 meters (1000 feet)<br />
apart from one another, and don't place the reference points on a straight line.<br />
Tip<br />
Using an external antenna for the Wi-Fi network adapter improves the outdoor survey accuracy.<br />
7.2 Post-Deployment and Pre-Deployment <strong>Survey</strong>s<br />
Post-deployment surveys are performed after the complete network is already in place. Postdeployment<br />
surveys are used for network verification immediately after the network has been<br />
deployed, and for periodic checks to ensure the network is still operating at a required level. The<br />
periodic maintenance surveys may cover the entire area or just parts of it, whereas the verification<br />
surveys done immediately after the network has been built usually cover the whole desired coverage<br />
area. To perform post-deployment surveys, no specific actions need to be taken - just survey as<br />
specified in the previous section.<br />
Pre-deployment surveys are used for on-site validation of network plan. In pre-deployment surveys,<br />
you would use one or few access points to ensure the network coverage and performance<br />
on-site - prior the complete network has been deployed. Simply move the AP(s) between the<br />
planned locations and make a survey whenever the AP has been moved.<br />
To simulate a complete network with a limited number of access points in the pre-deployment<br />
survey phase, use the Freeze Access Point tool. The Freeze Access Point tool allows a single<br />
access point that as been placed in several locations to be treated as multiple access points. Using<br />
Freeze AP, you can individually visualize and analyze each location where the AP was placed. If<br />
Freeze AP is not used, you would simply see one AP detected, and be able to visualize one huge<br />
coverage area. Moreover, it allows simulating a complete network in terms of overlap, channel<br />
interference, and data rate, by using just one or a few access points.<br />
To use Freeze AP:<br />
Chapter 7. <strong>Site</strong> <strong>Survey</strong>s - Ensuring Sufficient<br />
Coverage and Performance On-<strong>Site</strong><br />
1. Turn on the access point<br />
2. Perform a survey within the coverage area of the access point<br />
3. Stop surveying, and unplug off the access point<br />
4. From the user interface, select the access point (and only that access point) and select Actions<br />
> Freeze Selected Access Points<br />
48
49<br />
5. Move the access point to the next location<br />
6. Repeat steps 2-4 until all the necessary AP locations have been surveyed<br />
Note<br />
Although the previous instructions are for one access points, several access points can also be<br />
used in the pre-deployment survey, and several access points can be frozen at once.<br />
7.3 Placing Access Points on the Map<br />
<strong>Ekahau</strong> <strong>Site</strong> <strong>Survey</strong> is able to place access points on the map automatically after the survey.<br />
These are estimated locations. You can disable the feature by unchecking the "Auto-Place APs"<br />
checkbox during the survey. If you have disabled the Automatic Placement, you can manually<br />
force the automatic on-demand placement of access points from <strong>Site</strong> > Place Access Points<br />
Automatically.<br />
The AP locations guessed by ESS may not be exact. You can move the AP to its exact location<br />
by simply dragging the AP to the desired location when using the Edit tool. After an AP has been<br />
manually moved, the Auto-Locate features will not try to locate the AP any more. Also, if you exit<br />
the program or re-open the project, the current AP locations will be fixed, and the Auto-Locate<br />
features will not try to locate those APs any more. However, all the newly discovered APs will still<br />
be automatically located.<br />
The Automatic Placement will only try to locate the access points that are well audible (surveyed<br />
signal strength has exceeded -50dBm in one or more locations). This is to avoid locating the access<br />
points inaccurately.<br />
To place an AP that has not been automatically placed, just drag and drop the AP from the AP list<br />
to the map.<br />
To find the position of a single AP, click on the "Drag on the map to place" text in the AP list and<br />
select Automatically Place Access Point.<br />
7.4 Selecting My Access Points<br />
After the surveys have been completed, and you have located your access points, you should<br />
indicate which APs actually belong to your network. My access points are defined by using the<br />
"My" checkbox in the AP list. By default, all the APs are checked as My. You need to uncheck the<br />
APs that are not a part of your wireless network.<br />
Warning<br />
Chapter 7. <strong>Site</strong> <strong>Survey</strong>s - Ensuring Sufficient<br />
Coverage and Performance On-<strong>Site</strong><br />
IMPORTANT: If your My APs are not properly selected, the visualizations as well as many other<br />
features will not work properly.<br />
To learn more about My Access Points, see chapter Selecting My Access Points.
7.5 Simultatenous <strong>Survey</strong> Work: Merging Two Projects<br />
as One<br />
If several persons are surveying the areas at one time, the results need to be merged as one in<br />
the end. The Merge feature imports surveys, access points, walls, everything in the Project To<br />
merge two or more files as one:<br />
● Open the first Project<br />
● Select File > Merge<br />
● Browse for the second Project which needs to be merged with the first one<br />
● If more than two surveyors have been on the field, repeat the previous step for all the Projects<br />
Warning<br />
In many cases, some access point locations are lost in Merge. Always check the AP locations<br />
of the Merged file and make the necessary corrections.<br />
Note<br />
Chapter 7. <strong>Site</strong> <strong>Survey</strong>s - Ensuring Sufficient<br />
Coverage and Performance On-<strong>Site</strong><br />
The Merge feature does not Merge surveys within the same map. The surveyors need to operate<br />
on different floors (maps) for the Merge to work properly.<br />
7.6 Inspecting <strong>Survey</strong>s in More Detail<br />
In some cases, if network is not behaving normally, the signal behavior may need closer inspection.<br />
During the survey, the network adapter keeps constantly scanning the network for signal readings<br />
from the access points. To see the individual signal measurements on the map, select the <strong>Survey</strong><br />
Inspector tool. To view the individual measurements and analyze the survey data in more detail,<br />
double-click on the position of the survey route you want to inspect, or right-click on a <strong>Survey</strong> in<br />
the <strong>Survey</strong>s list and select Inspect. A <strong>Survey</strong> Inspector window will open, displaying the recorded<br />
signal readings in the point nearest to the clicked location as well as measured Round Trip Time<br />
(Ping) and the associated Access Point during the measurement. An orange dot on the map will<br />
indicate which measurement point is currently analyzed.<br />
The window will also show the recorded data over time for a given survey. Use the Next and Previous<br />
buttons to move to the next and previous survey point along the survey path. To analyze<br />
the measurement data for select access point(s), highlight the APs on the AP list in the dialog.<br />
50
51<br />
Chapter 7. <strong>Site</strong> <strong>Survey</strong>s - Ensuring Sufficient<br />
Coverage and Performance On-<strong>Site</strong><br />
Figure 7.6. <strong>Survey</strong> Inspector allows you to analyze the signal behaviour in more detail<br />
1. Signal behaviour over time for the selected access points<br />
2. These signals were heard at the highlighted point on the graph<br />
3. Ping / Round Trip Time graph displaying the latency at the selected time interval<br />
4. The time window shown in the graph<br />
5. Move to next signal measurement
Chapter 7. <strong>Site</strong> <strong>Survey</strong>s - Ensuring Sufficient<br />
Coverage and Performance On-<strong>Site</strong><br />
52
53<br />
8 Analyzing the Wi-Fi Coverage and Performance<br />
There are various visualizations that allow you to estimate network coverage and performance.<br />
The visualizations are displayed as "heat maps" on the map image.<br />
The displayed visualization is selected using the two drop-down menus above the map window.<br />
The default visualization is Signal Strength for My Access Points. The first drop-down menu selects<br />
the visualization type, for example signal strength or data rate. The second drop-down selects<br />
what access points will be included in the visualization. If you want to visualize signal strength for<br />
one access point only, for example, you would select Show Signal Strength for Selected Access<br />
Points and just select the AP you want to see the signal strength for. The AP can be selected<br />
either from the map, or from the AP list.<br />
When the visualization is displayed, roll over the map with the mouse to see the actual values on<br />
the map at a given point as a tooltip.<br />
Figure 8.1. Visualization view<br />
1. Visualization type<br />
2. Visualized access points<br />
3. Refresh visualization button - Uncheck the box to manually refresh the visualization<br />
4. Visualization options<br />
5. Visualization<br />
6. Editing legend<br />
Note<br />
Chapter 8. Analyzing the Wi-Fi Coverage<br />
and Performance<br />
Automatic refresh option refreshes the visualization automatically when changes are made.<br />
Automatic refresh works well for small and medium-sized projects. If you are working with a<br />
large project, you may want to disable the automatic refresht to keep the software running<br />
smoothly, and only refresh the visualization when needed.
Visualization<br />
Data Rate<br />
Interference / Noise<br />
Network Health<br />
Network Issues<br />
For quick reference for visualization, see the tables below.<br />
Number of Access Points<br />
Signal Strength<br />
Signal-to-Noise Ratio<br />
Strongest Access Point<br />
Ping / Round Trip Time<br />
Ping Packet Loss<br />
Associated Access Poin<br />
802.11n Channel Bonding<br />
Visualize for<br />
All access points<br />
My Access Points<br />
Other Access Points<br />
Selected Access Points<br />
Note<br />
Chapter 8. Analyzing the Wi-Fi Coverage<br />
and Performance<br />
Purpose<br />
What is the estimated data rate (in Mbit/sec) for the<br />
clients<br />
How bad is the co-channel interference (in dBm)?<br />
Does the network meet your requirements?<br />
If requirements are not met, what is wrong?<br />
How many APs are audible in each location?<br />
How good is my signal coverage (in dBm)?<br />
How much stronger is the useful signal than the cochannel<br />
interference (in dB)?<br />
What is the strongest access point at each location?<br />
What is the network latency between a client and host?<br />
What is Packet Loss %? (Calculated from the last 10<br />
packets)<br />
With what Access Point was the client associated with?<br />
Where has 802.11n Channel Bonding been enabled?<br />
Purpose<br />
Display the visualization for all the access points<br />
Display the visualization only for the APs checked as<br />
"My"<br />
Display the visualization only for the APs NOT checked<br />
as "My"<br />
Display the visualization only for the APs selected from<br />
the list or the map<br />
In order to see any visualization, surveys need to be recorded, or at least one simulated access<br />
point needs to be placed on the map.<br />
8.1 Visualization Options<br />
Visualizations contain parameters that can optionally be set using Visualization Options. Some<br />
visualization options are specific to the selected visualization, whereas some are generic and<br />
apply to all the visualizations.<br />
The Visualization Options allow you to set parameters concerning the visualization accuracy,<br />
performance and overall appearance:<br />
54
55<br />
Figure 8.2. Some visualization options are generic, some are visualization specific<br />
1. Visualization Mode - See the visualization in Smooth mode (polygons) or Detailed mode<br />
(rectangles)<br />
2. Extrapolation - When Smooth Visualization Mode is selected, adjust the level of extrapolation<br />
in meters/feet<br />
3. Speed vs. Accuracy - Allows the visualizations to be refreshed more quickly at the expense<br />
of the accuracy, or vise versa<br />
4. Signal Prediction - Enable or disable all signal prediction. Can be used to predict signal<br />
propagation through other floors<br />
5. Visualization specific options (In this case for Signal Strength visualization)<br />
8.1.1 Visualization Mode<br />
The visualization heat maps are overlaid on the map using some amount of extrapolation, because<br />
every inch of the facility can not be surveyed. To adjust the amount of extrapolation, click the<br />
Options button next to the visualization selection.<br />
There are two Visualization Modes:<br />
Chapter 8. Analyzing the Wi-Fi Coverage<br />
and Performance<br />
● Detailed: The extrapolation is fixed. The Detailed Mode provides low extrapolation and<br />
accurate results. Does not allow adjusting the amount of extrapolation of data. Use Detailed<br />
mode when in-depth analysis is needed.<br />
● Smooth: Adjustable amount of detail, as the user can set the extrapolation (in feet or meters).
Chapter 8. Analyzing the Wi-Fi Coverage<br />
and Performance<br />
Figure 8.3. Visualization modes and extrapolation slider<br />
Figure 8.4. Detailed and Smooth visualization modes<br />
When designing large Projects with lots of walls and simulated access points, you may want to<br />
get visualizations updated quickly to find out the optimal number of access points, their locations<br />
and configurations as quickly as possible. At this point, the accuracy of the visualization may not<br />
be essential to find out the "ball park" locations and configurations of access points.<br />
In situations like these, you can increase the visualization speed by adjusting the slider above the<br />
Signal Prediction options. The Rough Sketch will provide the fastest response with the least amount<br />
of detail, whereas the Very Accurate setting will provide most detail, sacrificing some of the response<br />
time.<br />
Figure 8.5. Visualization speed vs. accuracy slider<br />
56
57<br />
Figure 8.6. Very Accurate Mode (on the left) and Rough Sketch Mode (on the right)<br />
8.1.2 Signal Prediction<br />
It may not always be feasible or even possible to survey all areas and rooms of the project. Instead,<br />
signal prediction can be used. There are two main types of signal prediction in ESS:<br />
● Signal prediction of simulated access points: All signals from the simulated APs are predicted.<br />
● Signal prediction of measured (surveyed) access points: The signals outside the surveyed<br />
areas are predicted.<br />
<strong>Ekahau</strong> <strong>Site</strong> <strong>Survey</strong> can predict signal propagation through floors. There are five options to choose:<br />
● Off - No signal prediction is used at all<br />
● Currect floor - Signal propagation in current floor is only predicted<br />
● One floor - Signal propagation to one floor above and below is predicted<br />
● Two floor - Signal propagation to two floors above and below is predicted<br />
Figure 8.7. Signal Prediction options<br />
Chapter 8. Analyzing the Wi-Fi Coverage<br />
and Performance<br />
By default, Signal Prediction is enabled. If it is necessary to see only the measured (surveyed)<br />
data of the access points, and disregard all the prediction calculations, disable Signal Prediction.
Chapter 8. Analyzing the Wi-Fi Coverage<br />
and Performance<br />
Figure 8.8. Viewing a measured access point with signal prediction (on the right) and without (on<br />
the left)<br />
8.1.3 Visualization Specific Options<br />
Some visualizations have specific options that only apply for them. These visualization specific<br />
options include:<br />
● Minimum Signal Strenght - The visualization is only shown in areas where the signal strength<br />
exceeds this threshold<br />
● Adapter - The visualization is shown according to how the selected adapter would have perceived<br />
the measured data<br />
● Network Load - Is used with simulation visualizations to demonstrate how different network<br />
loads affects on the network performance<br />
● Use Noise From - Defines wheter the visualization uses measured Noise or Simulated Co-<br />
Channel Interference - With Automatic option, the measured Noise is always used when<br />
available<br />
● Show Strongest Signal at Channel - Visualizes the selected strongest signal at<br />
the selected channel(s)<br />
8.2 Adjusting the Legend<br />
You can adjust the visualization appearance and value range by adjusting the Legend. The Legend<br />
can be adjusted by clicking on the Legend at the bottom-right corner of the screen. The Legend<br />
adjustments are automatically saved with the project. The following adjustments are provided:<br />
● Contours: The contour line between each color in the visualization can be enabled or disabled.<br />
● Value Range: Adjusts the range of values to be displayed. The Open setting at each end of<br />
the value range allows you to see the values outside the value range also.<br />
● Spacing: Each color in the visualization may represent one or many values. The spacing<br />
controls how many values each color represents.<br />
● Colors: Select the desired color range from the drop-down menu.<br />
● Requirements: Since the colors for these visualizations are fixed, and the results of Network<br />
Health and Network Issues visualizations depend on the Requirements, clicking the Legend<br />
when these visualizations are enabled allows you to edit the Requirements.<br />
58
59<br />
Visualization<br />
Data Rate<br />
Interference<br />
Network Health<br />
Network Isseus<br />
Number of APs<br />
Signal Strength<br />
Signal to Noise Ratio<br />
Strongest Access<br />
Point<br />
Ping / Round Trip<br />
Time<br />
Ping Packet Loss<br />
Associated Access<br />
Point<br />
802.11n Channel<br />
Bonding<br />
Figure 8.9. Adjusting the legend has a significant impact inn the visualizations<br />
Not all options are customizable for all visualizations. The table below explains the visualization<br />
default values and adjustment options:<br />
Legend Adjustment Options<br />
Contours On / Off<br />
Value Range, Spacing, Colors, Contours On / Off<br />
Requirements<br />
Requirements<br />
Value Range, Spacing, Colors, Contours On / Off<br />
Value Range, Spacing, Colors, Contours On / Off<br />
Value Range, Spacing, Colors, Contours On / Off<br />
Contours On / Off<br />
Contours On / Off<br />
Value Range, Spacing, Colors, Contours On / Off<br />
Contours On / Off<br />
Contours On / Off<br />
Chapter 8. Analyzing the Wi-Fi Coverage<br />
and Performance<br />
Default Values<br />
From 1Mbps up to 600Mbps<br />
-100dBm through -50 dBm or More<br />
Pass / Fail<br />
Pass / Fail<br />
1 through 10 or more APs<br />
-80dBm through -20 dBm or more<br />
0dB through 50 dB or more<br />
MAC addresses of the APs<br />
0.0 ms throught 1000.0 ms<br />
0 % through 100 %<br />
Automatic<br />
On / Off
8.3 Visualization Views<br />
8.3.1 Data Rate<br />
Data Rate is the is the speed at which the client device and the access point are communicating<br />
at. The higher the data rate, the more data is expected to be transferred between the client device<br />
and the access point in a period of time. In 802.11, the advertised data rate is the theoretical<br />
maximum at which the devices are able to communicate. However, the net data throughput between<br />
two devices is typically less than half of the advertised data rate.<br />
In ESS, the data rate is calculated using the following Visualization Options as parameters:<br />
● Network Load affects the data rate: The higher the network load, the more interference. The<br />
more interference, the lower the SNR, and the lower the SNR, the lower the data rate.<br />
● Different Adapters have different receiver sensitivity capabilities, and even support different<br />
802.11 standards. Thus, using different adapters may have a significant impact to the data<br />
rate . For example, an 802.11b adapter can only communicate at a maximum of 11Mbps.<br />
Note<br />
Chapter 8. Analyzing the Wi-Fi Coverage<br />
and Performance<br />
The data rate is calculated only for access points that are marked as My APs. If you are visualizing<br />
with Selected Access Points view, the APs that are currently Selected will work as sources<br />
of noise.<br />
60
61<br />
Figure 8.10. Data Rate visualization<br />
1. No data transfer possible<br />
2. High data rate (54Mbps)<br />
3. Low data rate<br />
4. Red = 1Mbps Green = 54Mbps<br />
8.3.2 Interference / Noise<br />
Chapter 8. Analyzing the Wi-Fi Coverage<br />
and Performance<br />
If two access points are close to each other on nearby channels, co-channel interference is generated.<br />
In many cases, some amount of co-channel interference is inevitable, but excessive cochannel<br />
interference will result in degraded performance in the wireless network.<br />
The Interference visualization will display the amount of estimated co-channel interference, based<br />
on the signal strengths and channels of the access points. Interference is affected by<br />
● Network Load: Network Load is the estimated amount of traffic in your network. The more<br />
Network Load, the more channel interference is generated. With low network usage, the<br />
load is typically between 1 and 10%. The network load of a typical enterprise Wi-Fi network<br />
is between 10 and 20 percent. If the network is extremely crowded, the network loads may<br />
reach 30 or even 40 percent.
● Adapter also has an impact to interference, since different adapters have slightly different<br />
radio characteristics.<br />
Figure 8.11. Interference visualization<br />
1. High interference<br />
2. Low interference<br />
3. Very low or no interference<br />
4. Adjust interference visualization value range, colors, etc.<br />
8.3.3 Network Health<br />
Chapter 8. Analyzing the Wi-Fi Coverage<br />
and Performance<br />
Network Health provides a summarized overview of the network. It shows whether all of your<br />
network requirements (see also chapter Defining Network Requirements) are met or not. If one<br />
or more of the network requirements are not yet, Network Health will fail, and red color will be<br />
displayed for those areas. If all of the network requirements are met, green color will be displayed.<br />
To adjust the requirements, click on the color legend, or click <strong>Site</strong> > Edit Requirements.<br />
62
63<br />
Figure 8.12. Network Health visualization<br />
1. Network meets requirements<br />
2. Network does not meet requirements<br />
3. Select requirement<br />
4. Click to adjust requirement<br />
8.3.4 Network Issues<br />
Chapter 8. Analyzing the Wi-Fi Coverage<br />
and Performance<br />
If one or more of your network requirements are not met in one or more locations (see also Network<br />
Health), the Network Issues visualization will display which requirement fails. If more than one<br />
requirement fail, only one failing requirement will be displayed.
Figure 8.13. Network Issues visualization<br />
1. Insufficient signal strength<br />
2. Network meets requirement<br />
3. Not enough audible access points<br />
4. Insufficient Signal-to-Noise Ratio<br />
5. Select requirement<br />
6. Click to adjust requirement - Each network issue is represented by a color<br />
8.3.5 Number of APs<br />
Chapter 8. Analyzing the Wi-Fi Coverage<br />
and Performance<br />
The Number of APs visualization shows how many access points are audible in a given location.<br />
The number of APs must be sufficient to ensure sufficient overlap in the network. Overlap is needed<br />
for seamless roaming between access points, as well as load balancing.<br />
The following selections will affect the Number of APs:<br />
● Minimum Signal Strength allows you to set a minimum signal strength for an AP that is to<br />
be included in the number of APs to be visualized. For example, if you set it to -90, the number<br />
of APs audible at stronger than -90dBm signal strength will be shown.<br />
64
65<br />
● Adapter affects the Number of APs visualization, as some adapters are more sensitive, and<br />
can thus hear more APs in a given location than the others.<br />
Figure 8.14. Number of APs visualization<br />
1. No audible APs<br />
2. Lots of audible APs<br />
3. Only 2 audible APs<br />
4. Click to adjust the visualization value range, colors, etc.<br />
8.3.6 Signal Strength<br />
Chapter 8. Analyzing the Wi-Fi Coverage<br />
and Performance<br />
The Signal Strength visualization displays the signal strength of the selected set of access points<br />
in dBm. By default, the signal strength of the strongest access points per location will be displayed.<br />
Signal Strength has the following options accessible via Visualization Options:<br />
● Viewed Signal allows you to disregard the signals from the strongest access points, visualizing<br />
the second or third strongest signals instead of the strongest one. This is useful for visualizing<br />
AP failover scenarios and redundancy.<br />
● Signals at Channel limits the Signal Strength visualization to only show the signals at a<br />
selected channel.
● The Adapter selection allows you to visualize the signal strength as the selected adapter<br />
would "see" it. For example, the signal strength may be sufficient using a high-quality network<br />
adapter, but may not be sufficient using a wireless VoIP phone with different antenna characteristics.<br />
<strong>Ekahau</strong> <strong>Site</strong> <strong>Survey</strong> has characterized and field-tested various wireless adapters and VoIP<br />
phones to allow accurate simulation when deploying wireless networks for different adapters.<br />
Figure 8.15. Signal Strength visualization<br />
1. High signal strength<br />
2. Low signal strength<br />
3. Signal strength below -80dBm<br />
4. Click to adjust signal strength visualization value range, colors, etc.<br />
8.3.7 Signal-to-Noise Ratio<br />
In wireless data communication, the signal strength must exceed the noise level. Otherwise two<br />
devices will not be able to communicate with one another. The Signal-to-Noise Ratio (SNR) visualization<br />
shows if the signal level exceeds the noise level, and by how many dB.<br />
Signal-to-Noise Ratio is affected by:<br />
Chapter 8. Analyzing the Wi-Fi Coverage<br />
and Performance<br />
66
67<br />
● Minimum Data Rate which should be adjusted if connections at low speeds are disallowed<br />
in the network. For example, if your network is only set to accept speeds 6Mbps or higher,<br />
set the Minimum Data Rate accordingly.<br />
● Network Load affects SNR as it affects interference. The higher the Network Load, the lower<br />
the SNR will be.<br />
● Different Wi-Fi Adapters have different characteristics for receiver sensitivity and antenna<br />
implementation. Thus, some adapters provide a higher SNR in a given location than others.<br />
Note<br />
Chapter 8. Analyzing the Wi-Fi Coverage<br />
and Performance<br />
In ESS, the Noise consists of co-channel interference generated by nearby 802.11 access<br />
points. To see the impact of non-802.11 noise sources, such as Microwave ovens, use a<br />
spectrum analyzer.<br />
Figure 8.16. Signal-to-Noise Ratio visualiation<br />
1. Low SNR<br />
2. High SNR<br />
3. SNR below 0dB (Noise level greater than signal level)<br />
4. Click to adjust SNR visualization value range, colors, etc.
Chapter 8. Analyzing the Wi-Fi Coverage<br />
and Performance<br />
8.3.8 Strongest Access Point<br />
The client devices have a tendency of associating to the strongest audible access point by default.<br />
To visualize which AP is the strongest in each location, use the Strongest AP visualization. The<br />
strongest AP visualization is affected by the Adapter selection, since some adapters are not able<br />
to associate to some access points. For example, an 802.11b/g adapter is not able to associate<br />
with an 802.11a access point.<br />
Figure 8.17. Strongest Access Point visualization<br />
1. No audible access points<br />
2. Red color shows where this AP is the strongest one<br />
3. Orange color shows where this AP is the strongest one<br />
4. The area where each AP is the strongest is color-coded per AP<br />
8.3.9 Ping / Round Trip Time<br />
Ping is perhaps the most common tool for ensuring the network is working by measuring the network<br />
latency. During the Hybrid <strong>Survey</strong>, the ESS sends ICMP request packets to the target host, which<br />
by default is Default Gateway, and listens for ICMP response packets and measures the Round<br />
Trip Time (RTT) of the packets.<br />
68
69<br />
The visualization displays the Round Trip Time of the Ping packets over the floor map. The visualization<br />
varies from 0.0 ms to 1000.0 ms. When the RTT approaches 1000 ms, the users may<br />
experience the network connection quality as decreased having problems from low quality VoIP<br />
calls to slow file / Internet browsing. The Legend of the visualization is not customizable.<br />
Figure 8.18. Ping / Round Trip Time visualization<br />
1. In this area the Round Trip Time has been 2.0 - 4.0 ms<br />
2. Click to enable or disable Contours<br />
3. <strong>Survey</strong> route<br />
8.3.10 Ping Packet Loss<br />
Chapter 8. Analyzing the Wi-Fi Coverage<br />
and Performance<br />
When ESS measures the network performance by pinging the target host, it measures the number<br />
of lost packets at the same time. Packet Loss occurs when ESS fails to receive a ICMP response<br />
packet to the ICMP request packet from the target host. The Packet Loss can be caused by several<br />
factors such as interference and / or congestion in the network medium, corrupted packets, faulty<br />
network hardware, or faulty network drivers.<br />
The Ping Packet Loss visualization displays the relative Packet Loss % over the floor map. The<br />
Packet Loss % is calculated from the 10 last packets.
Chapter 8. Analyzing the Wi-Fi Coverage<br />
and Performance<br />
Figure 8.19. Ping Packet Loss visualization<br />
1. Ping Packet Loss: 0 % - 10 %<br />
2. Ping Packet Loss: 50 % - 60 %<br />
3. Ping Packet Loss: 90 % - 100 %<br />
4. Click to adjust the visualization value range, colors, etc.<br />
8.3.11 Associated Access Point<br />
The Associated Access Point visualization displays the access point the client adapter was associated<br />
with in each floor area. The visualization is especially handy for recognizing roaming<br />
behaviour such as with which access point the wireless network adapters typically associates in<br />
each area. Thus, you can use the visualization to recognize areas where you might want to consider<br />
re-positioning access points for better load balancing.<br />
70
71<br />
Chapter 8. Analyzing the Wi-Fi Coverage<br />
and Performance<br />
Figure 8.20. Associated Access Point visualization<br />
1. Moving the mouse cursor over each area displays the MAC address and SSID of the Access<br />
Point the client adapter was associated with<br />
2. Each roaming area is represented with different colors<br />
3. Click to enable or disable Contours<br />
8.3.12 802.11n Channel Bonding<br />
To better visualize your 802.11n network characteristics, use the 802.11n Channel Bonding visualization<br />
to see in which areas Channel Bonding is used to achieve higher bandwidth and to<br />
recognize the area where it could be enabled.
Visualization<br />
Data Rata<br />
Interference / Noise<br />
Network Health<br />
Network Issues<br />
Figure 8.21. 802.11n Channel Bonding visualization<br />
1. 802.11n Channel Bonding enabled<br />
2. 802.11n Channel Bonding disabled<br />
3. Click to enable or disable visualization Contours<br />
8.4 Different <strong>Survey</strong> Methods vs. Visualizations<br />
Not all visualizations are available with just passive surveys, or when working with simulated<br />
access points. The visualizations that require Hybrid <strong>Survey</strong>s do not work for simulated data. The<br />
Network Health and Network Issues visualizations provide all the functionality only when using<br />
Hybrid <strong>Survey</strong>s<br />
The below table outlines which survey methods affect on each visualization:<br />
Number of Access Points<br />
Passive <strong>Survey</strong> (Traditional<br />
Signal Reading)<br />
X<br />
X<br />
X<br />
X<br />
X<br />
Chapter 8. Analyzing the Wi-Fi Coverage<br />
and Performance<br />
Hybrid <strong>Survey</strong> (End-toend<br />
Connectivity Testing)<br />
X<br />
X<br />
X<br />
X<br />
X<br />
Simulation<br />
X<br />
X<br />
X<br />
X<br />
X<br />
72
73<br />
Visualization<br />
Signal Strength<br />
Signal-to-Noise Ratio<br />
Strongest Access Point<br />
Ping / Round Trip Time<br />
Ping Packet Loss<br />
Associated Access Point<br />
802.11n Channel Bonding<br />
Passive <strong>Survey</strong> (Traditional<br />
Signal Reading)<br />
X<br />
X<br />
X<br />
X<br />
Chapter 8. Analyzing the Wi-Fi Coverage<br />
and Performance<br />
Hybrid <strong>Survey</strong> (End-toend<br />
Connectivity Testing)<br />
X<br />
X<br />
X<br />
X<br />
X<br />
X<br />
X<br />
Simulation<br />
X<br />
X<br />
X<br />
X
Chapter 8. Analyzing the Wi-Fi Coverage<br />
and Performance<br />
74
75<br />
9 Troubleshooting - Detecting and Solving the Most<br />
Common Wi-Fi Problems<br />
9.1 On-Spot Troubleshooting Using Live Network Status<br />
<strong>Ekahau</strong> <strong>Site</strong> <strong>Survey</strong> provides excellent tools for visualizing and troubleshooting your network on<br />
the map - we will cover these later in this chapter. However, <strong>Ekahau</strong> <strong>Site</strong> <strong>Survey</strong> also provides a<br />
powerful troubleshooting tool called Live Network Status. It works without a map, without having<br />
any surveys performed.<br />
In a typical troubleshooting scenario, the wireless network does not function in one or more locations<br />
for some reason at a particular time. With ESS, you need to take the laptop to the problematic<br />
area, and use the Live Network Status view to troubleshoot the issue. You can use the pre-defined<br />
Requirements to see whether the network meets different application requirements or not. To start<br />
the Live Network Status, click Device > Live Network Status, or click on the Miniature Signal<br />
View.<br />
9.1.1 Signals<br />
The Signals tab of Live Network Status displays the current signal measurements from all audible<br />
access points. Click Reset to clear the list of currently audible APs.<br />
Figure 9.1. Signals view displays all currently audible access points<br />
9.1.2 Requirements<br />
Chapter 9. Troubleshooting - Detecting<br />
and Solving the Most Common Wi-Fi<br />
Problems<br />
The Requirements tab of Live Network Status compares your network requirements with the current<br />
network measurements. If the network requirements are met at the moment, green color will be
shown for each measurement. If your network requirements are not met right now, red color will<br />
be shown for that requirement.<br />
You need to choose the access points that are considered yours when using the Live Network<br />
Status for troubleshooting. If you have not defined My APs (for example when using Live Network<br />
Status on a blank Project without any surveys performed), choose Identify My Access Points<br />
by SSID and select the SSID of your network. If you are working on an existing project with My<br />
APs defined, select Identify My Access Points by Access Point List. If you do not choose either,<br />
all of the APs will be considered to belong to your network - which may lead to overly optimistic<br />
results.<br />
Figure 9.2. Quick on-spot troubleshooting without a map<br />
Note<br />
To be able to compare Ping / Round Trip Time and Packet Loss measurements, the Ping tool<br />
must be started. To do this, go to the Ping tab and click the Start button. Remember to make<br />
sure you have valid Network Host configured.<br />
9.1.3 802.11n Details<br />
Chapter 9. Troubleshooting - Detecting<br />
and Solving the Most Common Wi-Fi<br />
Problems<br />
The 802.11n includes several improvements that offer higher throughput, range, reliability, and<br />
bandwidth than legacy 802.11 standards. However, sometimes these 802.11n settings may cause<br />
76
77<br />
interference and/or other problems with legacy 802.11 networks and devices. The 802.11n Details<br />
view is very helpful to identify problems related to 802.11n.<br />
The view displays the current signal measurements from 802.11n access points including their<br />
802.11n characteristics. With the 802.11n Details view it is possible to identify for example how<br />
many spatial streams different 802.11n access points are using and which channels are bonded<br />
thus consuming available channels from other access points and/or possibly even causing interference.<br />
The 802.11n Details view also displays whether SGI and Greenfield mode are used in<br />
the network. For example, you can check whether Greenfield mode is enabled in some of the<br />
802.11n access points when a 802.11g client can not access your 802.11n network. In this case<br />
the Greenfield mode should be disabled.<br />
Figure 9.3. LIve 802.11n network details<br />
Note<br />
The 802.11n details can also be viewed per each 802.11n AP by clicking their 11n button in<br />
the Access Points list.<br />
9.1.4 Ping<br />
Chapter 9. Troubleshooting - Detecting<br />
and Solving the Most Common Wi-Fi<br />
Problems<br />
The Ping tab in the Live Network Status view allows testing connectivity between the <strong>Site</strong> <strong>Survey</strong><br />
laptop and a selected server. The ping host is user configurable. By default, the Default Gateway<br />
is used as the ping host.<br />
The Ping tool can be used without performing any surveys.
Figure 9.4. Live Network Status with Ping tool<br />
Note<br />
Chapter 9. Troubleshooting - Detecting<br />
and Solving the Most Common Wi-Fi<br />
Problems<br />
You can define the target host as an IP address or as a host name. When performing Hybrid<br />
<strong>Survey</strong>s, ESS will automatically start the Ping tool. There is no need for starting it separately.<br />
9.2 Troubleshooting After the <strong>Survey</strong><br />
The amount of troubleshooting scenarios ESS can be used for is almost endless. Here we will<br />
present a couple of the most common Wi-Fi problem scenarios, and how to solve them with ESS.<br />
Unlike in the previous section, The scenarios in this chapter assume that a site survey has been<br />
performed, as the troubleshooting happens using the map.<br />
9.2.1 Finding Network Problems with a Single View<br />
After having your Requirements set, simply use the Network Issues visualization to identify network<br />
trouble spots. Select the appropriate visualization to look at a given network parameter in more<br />
detail.<br />
9.2.2 Basic Wireless Issues - Low Coverage, High Interference<br />
Problems like low coverage and high interference are easy to identify and troubleshoot.<br />
78
79<br />
With low coverage, identify the spots of low coverage by selecting Show Signal Strength for My<br />
Access Points. After identifying the spots with low coverage, first check that all of your APs are<br />
transmitting signals. If the APs are working properly, you may need to increase transmission power,<br />
or add more access points to the problematic areas (recommended). To simulate how adding an<br />
AP to the problematic area would impact the coverage and performance, use the Simulated<br />
Access Point tool in the Planning tab to place a Simulated AP on the map.<br />
Note<br />
Drawing walls prior to placing Simulated APs is recommended.<br />
To identify high interference or low Signal-to-Noise Ratio, use the respective visualizations. If SNR<br />
is below 0, or interference is above -70dBm, issues are likely to occur. After identifying the issue,<br />
ensure first that the channel separation of your network is optimal.<br />
Nearby access points should not be on the same or nearby channels. If there rogue or neighbor<br />
access points audible to your facility, check their signals and channels by selecting Show Signal<br />
Strength for Other APs. Use the Signals at Channel visualization option to see which channels<br />
are crowded. If you suspect that there is non-802.11 interference, such as cordless phones,<br />
microwave ovens or other machinery in the area, use the <strong>Ekahau</strong> DBx Spectrum Analyzer.<br />
To optimize the channel separation, change the channels from your access points to more suitable<br />
ones. This can be done for measured as well as simulated access points. When changing the<br />
channels, the visualizations are updated appropriately (using Always Refresh Automatically visualization<br />
option is recommended). Keep the Interference or SNR visualization active to see the<br />
impact of changing the channels.<br />
Tip<br />
Go to Visualization Options to visualize the calculated co-channel interference instead of<br />
measured noise when optimizing channel separation.<br />
9.2.3 Misconfigured SSIDs<br />
Sometimes in enterprise networks, the SSID configuration may not be correct for all the access<br />
points. In many cases, some of the APs are missing a given SSID because of either human error<br />
or an incomplete configuration update by the Wi-Fi controller.<br />
The quickest way to resolve this is to check the number of SSIDs in your network. To check the<br />
number of SSIDs, use the Quick Select button in the AP list. Select the desired SSID, and the<br />
respective APs will be selected in the AP list. You will see a per-floor summary of how many access<br />
points are selected per floor.<br />
Note<br />
Chapter 9. Troubleshooting - Detecting<br />
and Solving the Most Common Wi-Fi<br />
Problems
Alternatively to using Quick Select, you can type the desired SSID to the Search box in the<br />
Access Point list. Only the APs with that SSID will be displayed, and a per-floor access point<br />
count will be displayed, as well as the total number of searched access points.<br />
Tip<br />
You can also visualize the coverage easily per SSID by using Quick Select and selecting Show<br />
Signal Strength for Selected Access Points.<br />
9.2.4 Defective Access Points<br />
Defective APs can be found after the survey by looking at the AP locations. If ESS has not discovered<br />
any access points close to a location where an AP should be, the AP is probably broken.<br />
Visualizing Signal Strength for My Access Points may also reveal a broken AP: If there is low<br />
coverage near a location where an AP should be operating at, it's probably broken.<br />
The third way of discovering broken APs is to use the AP list: Either use the Quick Select or the<br />
Search box to select an SSID, and look at the total count of APs, or the count of APs per map in<br />
the AP list.<br />
Finally, the AP may provide good signal coverage, but the Ping Packet Loss may show 100 %<br />
loss for the AP. In this case, check the cabling of the AP, as well as the AP bridging and VLAN<br />
settings.<br />
9.2.5 Rogue Access Points<br />
Chapter 9. Troubleshooting - Detecting<br />
and Solving the Most Common Wi-Fi<br />
Problems<br />
ESS automatically locates access points after the survey. After identifying and selecting My APs,<br />
the detected rogue APs will be the ones that are displayed in red color. If there are APs that are<br />
not automatically located and are not a part of your network, they are probably not in your facility,<br />
and may not be distributing strong enough signals to interfere with your network.<br />
9.2.6 Misconfigured 802.11n settings<br />
The 802.11n includes several improvements that offer higher throughput, range, reliability, and<br />
bandwidth than legacy 802.11 standards. However, sometimes these 802.11n settings may cause<br />
interference or other problems with legacy 802.11 networks and devices.<br />
9.2.7 Connectivity and Latency Issues<br />
After performing Hybrid <strong>Survey</strong>s, it's easy to find connectivity and latency issues. Use the Ping<br />
Packet Loss and Ping Round Trip Time visualizations to identify such issues. The issues may be<br />
caused, for example, by high interference, excessive network traffic, or bad configurations in the<br />
APs or the wired network.<br />
80
81<br />
9.3 Troubleshooting Non-Wi-Fi Interference Using Spectrum<br />
Analyzer<br />
Wi-Fi devices operate on license-free frequency bands. This means that these frequency bands<br />
are not limited to Wi-Fi - devices other than Wi-Fi also operate on the same frequencies. Some<br />
examples of non-Wi-Fi devices that may operate on Wi-Fi frequencies are:<br />
● Microwave ovens<br />
● Wireless video cameras<br />
● Wireless headsets<br />
● Cordless phones<br />
● Zigbee (IEEE 802.15.4)<br />
Figure 9.5. Interference caused by a wirelesss video camera on 2.4 GHz frequency, as seen by<br />
a spectrum analyzer<br />
1. Interference intensity in dBm<br />
2. Interference on Wi-Fi channels 1-3<br />
3. Wi-Fi channels<br />
Chapter 9. Troubleshooting - Detecting<br />
and Solving the Most Common Wi-Fi<br />
Problems<br />
<strong>Ekahau</strong> <strong>Site</strong> <strong>Survey</strong> uses the Wi-Fi adapter to take signal measurements. In cases where the<br />
interference is caused by a non-Wi-Fi device, the interference issues may not be detected by the<br />
Wi-Fi adapter. Connectivity issues caused by non-Wi-Fi interference may include:<br />
● Occasional, momentary connectivity cut-offs<br />
● Low voice quality<br />
● Lower than expected network performance<br />
● One or more channels completely unusable momentarily or permanently<br />
● Other suspicious network issues
For the reasons mentioned above, it is highly recommended to use a spectrum analyzer when<br />
deploying or troubleshooting a wireless network. For <strong>Ekahau</strong> <strong>Site</strong> <strong>Survey</strong> users, using spectrum<br />
analyzer is recommended in the following scenarios:<br />
1. Network planning: Find out the interference sources before you deploy any access points<br />
by making spot-checks with the spectrum analyzer around the facility - Detecting the interference<br />
issues in advance may affect the access point placement and configuration<br />
2. Network verification: A Wi-Fi site survey done with <strong>Ekahau</strong> <strong>Site</strong> <strong>Survey</strong> is always highly<br />
recommended when verifying the network - This is typically done before the network production<br />
use starts, and periodically (for example, every month) - During the verification check, you<br />
may choose to perform spectrum analysis spot-checks at selected locations to ensure that<br />
there are no significant interference sources present<br />
3. Troubleshooting: The most common purpose for a spectrum analyzer is troubleshooting -<br />
Whenever Wi-Fi issues arise that are not solvable with a Wi-Fi site survey, <strong>Ekahau</strong> recommends<br />
using a spectrum analyzer - Typically, collecting a minute or two of data with a spectrum<br />
analyzer will reveal the underlying issue<br />
9.3.1 Using Wi-Spy DBX Spectrum Analyzer<br />
Firstly, you will need to insert the Wi-Spy DBx spectrum analyzer device to your computer, and<br />
install the appropriate software. The spectrum analysis software is called Chanalyzer. Consult the<br />
Wi-Spy DBx documentation for details on the installation.<br />
To start spectrum analysis, click the Spectrum Analysis button. This will start the Chanalyzer<br />
software, assuming that it has been installed on your computer.<br />
Figure 9.6. Wi-Spy Chanalyzer software quick launch<br />
It is important to note taking measurements using a spectrum analyzer requires a method different<br />
from Wi-Fi site surveys. Whereas during Wi-Fi site surveys it is acceptable to fairly quickly walk<br />
around the facility taking measurements, spectrum analysis is something done in selected locations<br />
only, spending more time (for example one minute) in a given location. This is because a spectrum<br />
analyzer typically needs more time to collect meaningful data.<br />
Prior to spectrum analysis, you will need to find out, whether the problems are on the 2.4 or 5GHz<br />
frequency space. For example, if the problems are found with 802.11g VoIP phones, but not with<br />
laptops operating on 802.11a, you should concentrate on analyzing the 2.4GHz frequency space.<br />
Use the Configuration Side Bar (explained below) to configure the spectrum analyzer to scan the<br />
appropriate frequency space.<br />
User Interface<br />
Chapter 9. Troubleshooting - Detecting<br />
and Solving the Most Common Wi-Fi<br />
Problems<br />
There are four main components to the Chanalyzer user interface, three of which are most<br />
important for typical use: The Spectral View, the Topographic View and the Configuration Side<br />
Bar. In all of the views, x-axis presents frequency. This is configurable. By default you are investigating<br />
the 2.4GHz frequency space – you can see channels at the bottom of the screen.<br />
● Spectral View shows the amount of interference (color) over time (the y-axis) - In this view,<br />
you can see how interference changes periodically - This is very helpful to troubleshoot<br />
momentary interference sources, such as Microwave ovens<br />
● Topographic View shows the amount of interference (color) and it’s amplitude, or in other<br />
words, the strength of the interference (y-axis)<br />
82
83<br />
● Planar View provides you with current measurement results (yellow line), as well as average<br />
(green) and maximum (blue) measurement results<br />
● Configuration Side Bar allows you to adjust the frequencies to look at - The following parameters<br />
should be typically configured:<br />
Frequency space to measure: The wider the measurement frequency is, the more comprehensive<br />
overview you will get - However, the wider the measurement frequency, the slower<br />
the results will be updated<br />
Start frequency means the lowest frequency that the spectrum analyzer will scan. For 2.4GHz,<br />
this could be 2400Mhz, for example<br />
Stop frequency means the highest frequency that the spectrum analyzer will scan - In the EU<br />
(13 channels used), you could use 2480 - In Japan (14 channels used), this could be set<br />
slightly higher, and in the US, slightly lower (11 channels used)<br />
Measurement accuracy vs. measurement speed: To increase the measurement accuracy,<br />
you can adjust the Step Size and Resolution Bandwidth - The smaller the step size, the higher<br />
the accuracy, but the longer time it will take for the analyzer to sweep the frequency – meaning<br />
lower measurement speed<br />
Figure 9.7. Wi-Spy DBX Spectrum Analyzer user interface<br />
1. Spectral View<br />
2. Topographic View<br />
3. Configuration Side Bar<br />
4. Planar View<br />
Note<br />
Chapter 9. Troubleshooting - Detecting<br />
and Solving the Most Common Wi-Fi<br />
Problems<br />
You can quick adjust the frequencies to look at by right-clicking over the Planar View's channels<br />
numbers without knowing the exact frequency of each channel.
Figure 9.8. Quick adjusting the frequencies to look at<br />
Finding Interference Issues<br />
Chapter 9. Troubleshooting - Detecting<br />
and Solving the Most Common Wi-Fi<br />
Problems<br />
When using a spectrum analyzer, the goal is to find the interferers in the Wi-Fi frequencies. The<br />
spectrum analyzer will display all the activity in the selected frequency space – meaning you will<br />
see Wi-Fi activity as well as other activity. If you have already deployed Wi-Fi at the site, you will<br />
need to be able to separate Wi-Fi signals from the actual interference. An example is shown in<br />
the image below. You can also use the Signatures tab in the right-hand side of the Chanalyzer<br />
user interface to see how Wi-Fi compares to the other interferers.<br />
Figure 9.9. Wi-Fi activity and microwave oven interference on channel 11<br />
1. Interference caused by a microwave oven<br />
2. Wi-Fi activity on channel 4<br />
3. Wi-Fi activity on channel 11<br />
84
85<br />
10 Reporting, Exporting and Printing<br />
Selection<br />
Folder<br />
File<br />
Paper<br />
Document Format<br />
Report title<br />
Cover page image<br />
Chapter 10. Reporting, Exporting and<br />
Printing<br />
With <strong>Ekahau</strong> <strong>Site</strong> <strong>Survey</strong>, you can easily output the network information by either generating a<br />
comprehensive report, or by exporting or printing the images one-by-one.<br />
10.1 Generating Reports<br />
Generating a report constructs a comprehensive report in RTF or PDF format. To generate a<br />
report, go to File > Report. From the dialog, choose the visualizations you want to be reported<br />
and make the following selections:<br />
Description<br />
The output location of the report<br />
The file name of the report, followed by the extension<br />
(.rtf or .pdf)<br />
The paper type of the report<br />
Choose Adobe PDF, or easily customizable and MS<br />
Word compatible RTF<br />
The title of the report<br />
Choose an Image file, such as a company logo, to be<br />
included in the front page of the report
Figure 10.1. Generating reports<br />
1. Renameable title of the report<br />
2. Customizable cover page image - Click to change the image<br />
3. Select the maps that should be included in the report<br />
4. Select the visualizations and Access Points that should be included in the report<br />
5. Choose the paper type and document format<br />
6. Type the name of the report file and select where the report should be saved<br />
The report includes:<br />
Chapter 10. Reporting, Exporting and<br />
Printing<br />
● Access point configurations as a table<br />
● Access point locations on the map<br />
● Access Point Notes<br />
● Network coverage and performance visualizations overlaid on a map<br />
● Network Requirements<br />
● <strong>Survey</strong> routes marked on the map<br />
● Optionally an image in the front page<br />
86
87<br />
10.2 Exporting and Printing Images<br />
To export or print the currently displayed image, click File > Export Image or File > Print Image.<br />
Note<br />
Chapter 10. Reporting, Exporting and<br />
Printing<br />
Your current selections will impact the image: For example, if you have selected a visualization<br />
for Selected Access Points, the exported or printed image will be constructed with the same<br />
settings. What you see in the user interface is what will be exported or printed.
Chapter 10. Reporting, Exporting and<br />
Printing<br />
88
89<br />
11 Real-Time Location Tracking (RTLS) Features<br />
Assets and people can be accurately tracked using a standard Wi-Fi network to improve safety<br />
and to locate assets quickly when necessary. <strong>Ekahau</strong> <strong>Site</strong> <strong>Survey</strong> fully integrates with <strong>Ekahau</strong><br />
Real-Time Location System. This allows you to use your existing site survey data to be used for<br />
calibrating the location system. To enable the location tracking features, check the Enable RTLS<br />
Features checkbox under File > Preferences. After re-starting the software, go to the Help menu,<br />
and open the <strong>Ekahau</strong> <strong>Site</strong> <strong>Survey</strong> Guide for Deploying RTLS for more information about the RTLS<br />
Features.<br />
If real-time location tracking (RTLS) is of interest, visit www.ekahau.com to read more about<br />
<strong>Ekahau</strong> RTLS, the industry-leading real-time location tracking system.<br />
Note<br />
Chapter 11. Real-Time Location Tracking<br />
(RTLS) Features<br />
If you have the RTLS Features enabled, but you do not use ESS to deploy <strong>Ekahau</strong> RTLS, you<br />
may receive a warning about undefined Rails and Open Spaces when saving a survey project.<br />
You can simply ignore this warning and choose Continue to save the survey project. However,<br />
if you want to avoid this warning in the future, uncheck the Enable RTLS Features checkbox<br />
under File > Preferences and re-start the software.
Chapter 11. Real-Time Location Tracking<br />
(RTLS) Features<br />
90
91<br />
12 Troubleshooting<br />
Chapter 12. Troubleshooting<br />
This chapter includes some of the most common troubleshooting scenarios.<br />
The program does not start or is very slow<br />
● Ensure you have enough memory in your laptop, and that all other system requirements are<br />
met<br />
● Ensure you are logged in as the computer administrator, or have administrative privileges<br />
● Ensure that the pixel sizes of the maps you have inserted are reasonable - preferably below<br />
5000 x 5000 pixels<br />
● Ensure all other programs are stopped when running <strong>Ekahau</strong> <strong>Site</strong> <strong>Survey</strong><br />
● Ensure that the scale has been set to each map<br />
● If the program is running slow, disable Google Desktop, third party Virus/Spamware Scanners<br />
(within reason - ensure your computer will not get affected) and other such applications<br />
The software does not accept my license<br />
● Ensure that you are connected to the Internet when starting the software for the first time<br />
● Ensure you have the license for the correct software, and for the correct version<br />
● Ensure the the same network adapter is in the computer which was registered when the<br />
product was started for the first time<br />
● Ensure the network adapter is connected and enabled when inserting the license<br />
● Ensure the license you have has not been registered previously by anyone else<br />
● The issue may be in the firewall or proxy. Try activating the license from another location.<br />
I can't see any signals in the Miniature Signal View. In other words, the network adapter is<br />
not scanning.<br />
● Ensure your Wi-Fi adapter is enabled<br />
● Ensure you have a supported Wi-Fi adapter. See www.ekahau.com/devices for details<br />
● Ensure you have the correct network adapter driver installed. If using an external Wi-Fi adapter,<br />
install the latest adapters from Start > Programs > <strong>Ekahau</strong> > <strong>Ekahau</strong> <strong>Site</strong> <strong>Survey</strong> > WLAN<br />
Adapter Driver Installer If using the integrated Wi-Fi in Intel Centrino, use the latest available<br />
driver from Intel<br />
● Exit <strong>Ekahau</strong> <strong>Site</strong> <strong>Survey</strong>, remove and re-insert (or disable and enabled) the wireless network<br />
adapter, then re-start <strong>Ekahau</strong> <strong>Site</strong> <strong>Survey</strong><br />
If the problem persists, contact support@ekahau.com.
Chapter 12. Troubleshooting<br />
92
93<br />
13 Additional Information<br />
13.1 Meru Virtual Cell<br />
Chapter 13. Additional Information<br />
The Meru Networks access points can operate in Virtual Cell mode. When in this mode, all the<br />
access points broadcast the same MAC address. This is unlike other access points, that broadcast<br />
at least one unique MAC address per access point.<br />
Because of Meru Virtual cell, the mobile devices only see a single MAC address being distributed<br />
by all the APs. Thus, the mobile devices think they're constantly connected to a single AP, even<br />
though they are actually roaming between several APs. According to Meru, this makes the roaming<br />
times shorted.<br />
Because the MAC address is typically the unique identifier of an access point, most site survey<br />
tools will not work well with Meru infrastructure - they cannot show per AP coverage or performance<br />
maps, just one huge coverage area for all the APs. Unlike most site survey tools, <strong>Ekahau</strong> <strong>Site</strong><br />
<strong>Survey</strong> can read the "unique MAC addresses" of the Meru access points, which will allow the APs<br />
to be displayed normally. <strong>Ekahau</strong> <strong>Site</strong> <strong>Survey</strong> displays the "Meru unique MAC addresses" instead<br />
of the MAC addresses seen by other 802.11 clients. This feature is enabled by default and requires<br />
no user intervention.
Chapter 13. Additional Information<br />
94
95<br />
Index<br />
Symbols<br />
802.11n<br />
characteristics, 24<br />
extension channel, 24<br />
greenfield mode, 24<br />
live details view, 76<br />
SGI, 24<br />
spatial streams, 24<br />
802.11n channel bonding, 71<br />
A<br />
access point<br />
list, 14<br />
measured, 19<br />
multiple MAC addresses per AP, 22<br />
simulated, 21, 38<br />
after the survey, 78<br />
analysis, 53<br />
associated access point, 70<br />
automated network planning, 33<br />
B<br />
backward compatibility, 2<br />
building view, 40<br />
D<br />
data rate, 60<br />
E<br />
exporting images, 85<br />
F<br />
floor alignment points, 41<br />
freezing access points, 48<br />
G<br />
gps site surveys, 47<br />
I<br />
interference, 61<br />
L<br />
license<br />
evaluation license limitations, 8<br />
live network status, 75<br />
802.11n details, 76<br />
ping, 77<br />
requirements, 75<br />
signals, 75<br />
location tracking, 89<br />
M<br />
map<br />
duplicating maps with similar layouts, 35<br />
map view, 11<br />
map scrolling, 44<br />
Index<br />
N<br />
network health, 62<br />
network issues, 63<br />
Network Load, 61<br />
network planning<br />
finding optimal AP layout and configuration, 39<br />
multi-floor, 40<br />
network requirements, 30<br />
visualizing on the map, 62<br />
number of APs, 64<br />
P<br />
packet loss, 69<br />
ping, 68<br />
printing images, 85<br />
professional version, 2<br />
R<br />
real-time location tracking system, 89<br />
reporting, 85<br />
round trip time, 68<br />
rtls, 89<br />
S<br />
setting scale, 29<br />
signal strength, 65<br />
signal-to-noise ratio, 66<br />
site surveys<br />
active survey, 43<br />
gps assisted outdoor surveys, 47<br />
hybrid survey, 43<br />
passive survey, 43<br />
post-deployment, 48<br />
pre-deployment (freeze access point), 48<br />
supported gps receivers, 47<br />
survey inspector, 50<br />
standard version, 2<br />
strongest AP, 68<br />
survey<br />
surveys list, 26<br />
survey inspector, 50<br />
T<br />
troubleshooting, 78<br />
connectivity and latency issues, 80<br />
defective access points, 80<br />
examples, 78<br />
high interference, 79<br />
low coverage, 78<br />
misconfigured 802.11n settings, 80<br />
misconfigured SSID, 79<br />
on the map, 63<br />
on-the-spot troubleshooting, 75<br />
rogue access points, 80
V<br />
visualization, 53<br />
legend, 58<br />
options, 54<br />
W<br />
walls<br />
customizing wall materials, 34<br />
drawing walls, 34<br />
Index<br />
96