DTIS, Volume I - Enhanced Integrated Framework (EIF)
DTIS, Volume I - Enhanced Integrated Framework (EIF)
DTIS, Volume I - Enhanced Integrated Framework (EIF)

You also want an ePaper? Increase the reach of your titles
YUMPU automatically turns print PDFs into web optimized ePapers that Google loves.
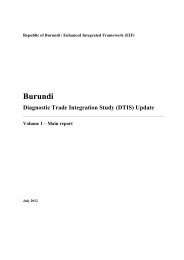
Table 4.2: Poverty Gap Ratios per Region, 2004 (in pct.)<br />
Central<br />
Central<br />
Poverty lines North North Central South South Male'<br />
Rf. 7.5 2.2 1.5 1.6 0.6 0.5 0.3<br />
Rf. 10 4.8 3.9 2.9 1.4 0.9 0.3<br />
Rf. 15 13.1 12.3 7.5 4.7 3.5 0.5<br />
Source: VPA-2<br />
While in Male’ the poorest quintile recorded an increase from 6 to 7 per cent of income<br />
in the period 1997 to 2004, regional atolls grew slightly more, in the range from 6 to 8<br />
per cent, with an average of 7 per cent.<br />
To estimate income inequality within and between regions and changes over time, the<br />
VPA-2 analysis shows that at country level the poorest quintile had not progressed (its<br />
share remained at 6 per cent. A similar result is found when using income deciles.<br />
Using Lorenz curves, the VPA-2 reveals no visible change for the years 1997 to 2004 as<br />
the curves overlap, implying a very similar overall household income inequality in the<br />
Maldives. When looking at Lorenz curves for Male’ and atoll level respectively the result<br />
confirms that inequality has shrunk over the period in both cases.<br />
In order to track income inequality between Male’ and the atolls during the period 1997-<br />
2004, Gini coefficient scores indicate that income inequality has increased significantly -<br />
up from 0.12 to 0.18, that is a rate of 50 per cent. In other words, 25 per cent of the<br />
population that lived in Male’ in 1997 earned 38 per cent of total household income. But<br />
in 2004, 30 per cent of the population living in Male’ accounted for 48 per cent of total<br />
household income. It can also be concluded that the overall income distribution in<br />
Maldives is, and remains, relatively unequal compared to neighbouring countries. The<br />
overall income distribution in Maldives, with a Gini coefficient of 0.41 is, and remains<br />
relatively unequal compared to neighbouring countries such as Sri Lanka (0.34), India<br />
(0.33), Pakistan (0.33) and Bangladesh (0.32). The Maldives Gini coefficient is close to<br />
that of Singapore (0.43), Trinidad and Tobago (0.40) and Saint Lucia (0.43), all island<br />
states where trade and/or tourism play an important role.<br />
The dynamic nature of poverty and inequality was established by assessing what changes<br />
in income levels were experienced by a large sample of households participating in both<br />
VPAs. Only a little less than half of these families stayed in the same income group after<br />
the seven years. About 40 per cent graduated to a higher income level and 13 per cent fell<br />
back to a lower level. Twenty-seven per cent had an income lower than the Rf. 15 per<br />
person per day poverty line in 2004. Of these 17 per cent was classified as chronically<br />
poor because their income was also below the Rf.15 line in 1997, while 10 per cent who<br />
were non-poor seven years earlier and had now fallen back into poverty over the period.<br />
42