Supalai - the DBS Vickers Securities Equities Research
Supalai - the DBS Vickers Securities Equities Research Supalai - the DBS Vickers Securities Equities Research
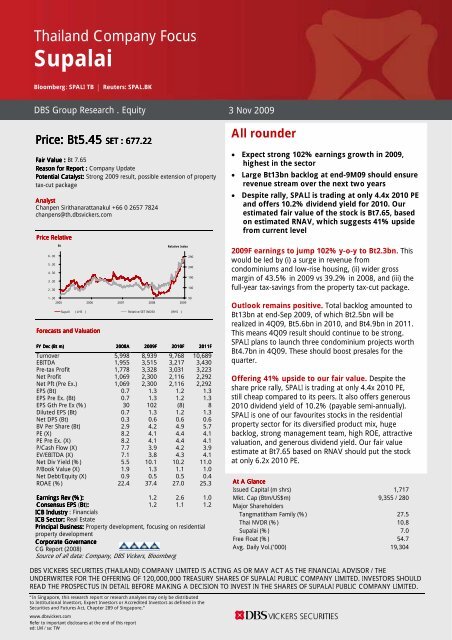
Thailand Company Focus Supalai Bloomberg: SPALI TB | Reuters: SPAL.BK DBS Group Research . Equity 3 Nov 2009 Price: Bt5.45 SET SET : 677.22 Fair Value : Bt 7.65 Reason for Report : Company Update Potential Catalyst: Strong 2009 result, possible extension of property tax-cut package Analyst Chanpen Sirithanarattanakul +66 0 2657 7824 chanpens@th.dbsvickers.com Price Relative 6 . 30 5 . 30 4 . 30 3 . 30 2 . 30 1 . 30 Bt Relative Index 2005 2006 2007 2008 2009 Supali ( LHS ) Relative SET INDEX ( RHS ) Forecasts and Valuation FY Dec (Bt m) 2008A 2009F 2010F 2011F Turnover 5,998 8,939 9,768 10,689 EBITDA 1,955 3,515 3,217 3,430 Pre-tax Profit 1,778 3,328 3,031 3,223 Net Profit 1,069 2,300 2,116 2,292 Net Pft (Pre Ex.) 1,069 2,300 2,116 2,292 EPS (Bt) 0.7 1.3 1.2 1.3 EPS Pre Ex. (Bt) 0.7 1.3 1.2 1.3 EPS Gth Pre Ex (%) 30 102 (8) 8 Diluted EPS (Bt) 0.7 1.3 1.2 1.3 Net DPS (Bt) 0.3 0.6 0.6 0.6 BV Per Share (Bt) 2.9 4.2 4.9 5.7 PE (X) 8.2 4.1 4.4 4.1 PE Pre Ex. (X) 8.2 4.1 4.4 4.1 P/Cash Flow (X) 7.7 3.9 4.2 3.9 EV/EBITDA (X) 7.1 3.8 4.3 4.1 Net Div Yield (%) 5.5 10.1 10.2 11.0 P/Book Value (X) 1.9 1.3 1.1 1.0 Net Debt/Equity (X) 0.9 0.5 0.5 0.4 ROAE (%) 22.4 37.4 27.0 25.3 Earnings Rev (%): 1.2 2.6 1.0 Consensus EPS (Bt Bt): 1.2 1.1 1.2 ICB Industry : Financials ICB Sector: Real Estate Principal Business: Property development, focusing on residential property development Corporate Governance CG Report (2008) Source of all data: Company, DBS Vickers, Bloomberg 290 240 190 140 90 All rounder • Expect strong 102% earnings growth in 2009, highest in the sector • Large Bt13bn backlog at end-9M09 should ensure revenue stream over the next two years • Despite rally, SPALI is trading at only 4.4x 2010 PE and offers 10.2% dividend yield for 2010. Our estimated fair value of the stock is Bt7.65, based on estimated RNAV, which suggests 41% upside from current level 2009F earnings to jump 102% y-o-y to Bt2.3bn. This would be led by (i) a surge in revenue from condominiums and low-rise housing, (ii) wider gross margin of 43.5% in 2009 vs 39.2% in 2008, and (iii) the full-year tax-savings from the property tax-cut package. Outlook remains positive. Total backlog amounted to Bt13bn at end-Sep 2009, of which Bt2.5bn will be realized in 4Q09, Bt5.6bn in 2010, and Bt4.9bn in 2011. This means 4Q09 result should continue to be strong. SPALI plans to launch three condominium projects worth Bt4.7bn in 4Q09. These should boost presales for the quarter. Offering 41% upside to our fair value. Despite the share price rally, SPALI is trading at only 4.4x 2010 PE, still cheap compared to its peers. It also offers generous 2010 dividend yield of 10.2% (payable semi-annually). SPALI is one of our favourites stocks in the residential property sector for its diversified product mix, huge backlog, strong management team, high ROE, attractive valuation, and generous dividend yield. Our fair value estimate at Bt7.65 based on RNAV should put the stock at only 6.2x 2010 PE. At A Glance Issued Capital (m shrs) 1,717 Mkt. Cap (Btm/US$m) 9,355 / 280 Major Shareholders Tangmatitham Family (%) 27.5 Thai NVDR (%) 10.8 Supalai (%) 7.0 Free Float (%) 54.7 Avg. Daily Vol.(‘000) 19,304 DBS VICKERS SECURITIES (THAILAND) COMPANY LIMITED IS ACTING AS OR MAY ACT AS THE FINANCIAL ADVISOR / THE UNDERWRITER FOR THE OFFERING OF 120,000,000 TREASURY SHARES OF SUPALAI PUBLIC COMPANY LIMITED. INVESTORS SHOULD READ THE PROSPECTUS IN DETAIL BEFORE MAKING A DECISION TO INVEST IN THE SHARES OF SUPALAI PUBLIC COMPANY LIMITED. “In Singapore, this research report or research analyses may only be distributed to Institutional Investors, Expert Investors or Accredited Investors as defined in the Securities and Futures Act, Chapter 289 of Singapore.” www.dbsvickers.com Refer to important disclosures at the end of this report ed: LM / sa: TW
- Page 2 and 3: Company Focus Supalai SWOT Analysis
- Page 4 and 5: Company Focus Supalai Businesses Th
- Page 6 and 7: Company Focus Supalai Competitive S
- Page 8 and 9: Company Focus Supalai Industry Outl
- Page 10 and 11: Company Focus Supalai Changing crit
- Page 12 and 13: Company Focus Supalai Financials -
- Page 14 and 15: Company Focus Supalai Financials -
- Page 16 and 17: Company Focus Supalai Share price p
- Page 18 and 19: Company Focus Supalai Income Statem
- Page 20: Company Focus Supalai RESTRICTIONS
Thailand Company Focus<br />
<strong>Supalai</strong><br />
Bloomberg: SPALI TB | Reuters: SPAL.BK<br />
<strong>DBS</strong> Group <strong>Research</strong> . Equity 3 Nov 2009<br />
Price: Bt5.45<br />
SET<br />
SET : 677.22<br />
Fair Value : Bt 7.65<br />
Reason for Report : Company Update<br />
Potential Catalyst: Strong 2009 result, possible extension of property<br />
tax-cut package<br />
Analyst<br />
Chanpen Sirithanarattanakul +66 0 2657 7824<br />
chanpens@th.dbsvickers.com<br />
Price Relative<br />
6 . 30<br />
5 . 30<br />
4 . 30<br />
3 . 30<br />
2 . 30<br />
1 . 30<br />
Bt<br />
Relative Index<br />
2005 2006 2007 2008 2009<br />
Supali ( LHS ) Relative SET INDEX ( RHS )<br />
Forecasts and Valuation<br />
FY Dec (Bt<br />
m) 2008A 2009F 2010F 2011F<br />
Turnover 5,998 8,939 9,768 10,689<br />
EBITDA 1,955 3,515 3,217 3,430<br />
Pre-tax Profit 1,778 3,328 3,031 3,223<br />
Net Profit 1,069 2,300 2,116 2,292<br />
Net Pft (Pre Ex.) 1,069 2,300 2,116 2,292<br />
EPS (Bt) 0.7 1.3 1.2 1.3<br />
EPS Pre Ex. (Bt) 0.7 1.3 1.2 1.3<br />
EPS Gth Pre Ex (%) 30 102 (8) 8<br />
Diluted EPS (Bt) 0.7 1.3 1.2 1.3<br />
Net DPS (Bt) 0.3 0.6 0.6 0.6<br />
BV Per Share (Bt) 2.9 4.2 4.9 5.7<br />
PE (X) 8.2 4.1 4.4 4.1<br />
PE Pre Ex. (X) 8.2 4.1 4.4 4.1<br />
P/Cash Flow (X) 7.7 3.9 4.2 3.9<br />
EV/EBITDA (X) 7.1 3.8 4.3 4.1<br />
Net Div Yield (%) 5.5 10.1 10.2 11.0<br />
P/Book Value (X) 1.9 1.3 1.1 1.0<br />
Net Debt/Equity (X) 0.9 0.5 0.5 0.4<br />
ROAE (%) 22.4 37.4 27.0 25.3<br />
Earnings Rev (%): 1.2 2.6 1.0<br />
Consensus EPS (Bt<br />
Bt): 1.2 1.1 1.2<br />
ICB Industry : Financials<br />
ICB Sector: Real Estate<br />
Principal Business: Property development, focusing on residential<br />
property development<br />
Corporate Governance<br />
CG Report (2008)<br />
Source of all data: Company, <strong>DBS</strong> <strong>Vickers</strong>, Bloomberg<br />
290<br />
240<br />
190<br />
140<br />
90<br />
All rounder<br />
• Expect strong 102% earnings growth in 2009,<br />
highest in <strong>the</strong> sector<br />
• Large Bt13bn backlog at end-9M09 should ensure<br />
revenue stream over <strong>the</strong> next two years<br />
• Despite rally, SPALI is trading at only 4.4x 2010 PE<br />
and offers 10.2% dividend yield for 2010. Our<br />
estimated fair value of <strong>the</strong> stock is Bt7.65, based<br />
on estimated RNAV, which suggests 41% upside<br />
from current level<br />
2009F earnings to jump 102% y-o-y to Bt2.3bn. This<br />
would be led by (i) a surge in revenue from<br />
condominiums and low-rise housing, (ii) wider gross<br />
margin of 43.5% in 2009 vs 39.2% in 2008, and (iii) <strong>the</strong><br />
full-year tax-savings from <strong>the</strong> property tax-cut package.<br />
Outlook remains positive. Total backlog amounted to<br />
Bt13bn at end-Sep 2009, of which Bt2.5bn will be<br />
realized in 4Q09, Bt5.6bn in 2010, and Bt4.9bn in 2011.<br />
This means 4Q09 result should continue to be strong.<br />
SPALI plans to launch three condominium projects worth<br />
Bt4.7bn in 4Q09. These should boost presales for <strong>the</strong><br />
quarter.<br />
Offering 41% upside to our fair value. Despite <strong>the</strong><br />
share price rally, SPALI is trading at only 4.4x 2010 PE,<br />
still cheap compared to its peers. It also offers generous<br />
2010 dividend yield of 10.2% (payable semi-annually).<br />
SPALI is one of our favourites stocks in <strong>the</strong> residential<br />
property sector for its diversified product mix, huge<br />
backlog, strong management team, high ROE, attractive<br />
valuation, and generous dividend yield. Our fair value<br />
estimate at Bt7.65 based on RNAV should put <strong>the</strong> stock<br />
at only 6.2x 2010 PE.<br />
At A Glance<br />
Issued Capital (m shrs) 1,717<br />
Mkt. Cap (Btm/US$m) 9,355 / 280<br />
Major Shareholders<br />
Tangmatitham Family (%) 27.5<br />
Thai NVDR (%) 10.8<br />
<strong>Supalai</strong> (%) 7.0<br />
Free Float (%) 54.7<br />
Avg. Daily Vol.(‘000) 19,304<br />
<strong>DBS</strong> VICKERS SECURITIES (THAILAND) COMPANY LIMITED IS ACTING AS OR MAY ACT AS THE FINANCIAL ADVISOR / THE<br />
UNDERWRITER FOR THE OFFERING OF 120,000,000 TREASURY SHARES OF SUPALAI PUBLIC COMPANY LIMITED. INVESTORS SHOULD<br />
READ THE PROSPECTUS IN DETAIL BEFORE MAKING A DECISION TO INVEST IN THE SHARES OF SUPALAI PUBLIC COMPANY LIMITED.<br />
“In Singapore, this research report or research analyses may only be distributed<br />
to Institutional Investors, Expert Investors or Accredited Investors as defined in <strong>the</strong><br />
<strong>Securities</strong> and Futures Act, Chapter 289 of Singapore.”<br />
www.dbsvickers.com<br />
Refer to important disclosures at <strong>the</strong> end of this report<br />
ed: LM / sa: TW
Company Focus<br />
<strong>Supalai</strong><br />
SWOT Analysis<br />
Strengths<br />
• <strong>Supalai</strong> (SPALI) is one of Thailand’s leading residential<br />
property developers. With its 20-year track record, SPALI has<br />
established its strong foothold in <strong>the</strong> Thai residential property<br />
industry.<br />
Weakness<br />
• Residential property sales are relatively volatile, depending<br />
on economic growth and consumer confidence.<br />
• Covering a diversified product mix e.g. detached houses,<br />
townhouses, condominium. These products are targeted<br />
mainly at <strong>the</strong> mid-income earners where demand is still<br />
strong.<br />
• Huge backlog (cumulative presales that have yet to be<br />
realized as revenue) of Bt13bn as of 30 Sep 2009 should<br />
ensure revenue stream until 2011.<br />
• Superior gross and net profit margins, compared to <strong>the</strong><br />
sector, thanks to <strong>the</strong> company’s effective cost and expenses<br />
control and its efficient design.<br />
• Strongest earnings growth in <strong>the</strong> sector in 2009F, while<br />
offering very generous dividend yield, payable semi-annually.<br />
Opportunities<br />
• Thailand’s economic growth has bottomed out in 1H09 and<br />
is expected to rebound strongly from a GDP contraction of<br />
3.2% to a GDP growth of 4.0% next year. This should result<br />
in increased housing demand next year.<br />
Threats<br />
• Potential increase in local interest rates next year<br />
• Expiration of tax-cut package could hurt demand near<br />
term<br />
• The extension of <strong>the</strong> government’s tax-cut package (cut in<br />
specific business tax, transfer fees and mortgage registration<br />
fees) by ano<strong>the</strong>r year to 29 Mar 2010 should mean a lot of tax<br />
savings for both home buyers and developers.<br />
• Introduction of <strong>the</strong> tax stimulus package that allows<br />
personal income tax deductions for <strong>the</strong> first Bt300,000 in<br />
payment for property purchase within 2009, should<br />
encourage consumers to buy <strong>the</strong>ir houses within 2009. The<br />
package is scheduled to expire on 31 Dec 2009. Any potential<br />
extension of <strong>the</strong> package by ano<strong>the</strong>r year, if any, should be<br />
positive and fur<strong>the</strong>r stimulate demand next year.<br />
• Recent Board of Investment’s relaxed housing criteria should<br />
present a good opportunity for SPALI to apply for BOI<br />
promotional privileges for some of its projects, which fall into<br />
BOI’s relaxed criteria.<br />
Source: <strong>DBS</strong> <strong>Vickers</strong><br />
Page 2
Company Focus<br />
<strong>Supalai</strong><br />
Company Background<br />
20-year track record in <strong>the</strong> industry. SPALI was founded<br />
in 1989 by Khun Prateep Tangmatitham and became<br />
listed on <strong>the</strong> Stock Exchange of Thailand (SET) in 2003.<br />
With its 20-year track record, SPALI has established its<br />
strong foothold in <strong>the</strong> Thai residential property industry.<br />
The company is now <strong>the</strong> only residential property<br />
company in Thailand that is ISO 9001: 2000 certified in all<br />
processes starting from planning, designing, construction,<br />
sales, to after-sales service for both its low-rise and highrise<br />
projects from The Engineering Institute of Thailand<br />
under Royal Patronage and AFAQ-EAQA. The company<br />
name <strong>Supalai</strong> means lucky and fortunate residence in<br />
Thai.<br />
Shareholding structure. SPALI’s major shareholder is <strong>the</strong><br />
Tangmatitham Family, which as of 26 Aug 2009, held a<br />
combined 27.5% stakes in <strong>the</strong> company.<br />
Shareholding Structure<br />
Tangmatith<br />
am Family<br />
28%<br />
Source: Company<br />
O<strong>the</strong>rs<br />
65%<br />
SPALI<br />
(Treasury<br />
shares)<br />
7%<br />
Treasury stock program. In 2008-early 2009, given <strong>the</strong><br />
sharp fall in SPALI’s share price to significantly below its<br />
book value, SPALI bought back 120m (6.99%) of its<br />
shares via <strong>the</strong> treasury stock program at an average price<br />
of Bt2.16 apiece. According to <strong>the</strong> SEC’s regulations,<br />
SPALI has up to three years to sell <strong>the</strong>se treasury shares,<br />
or cancel <strong>the</strong>m after three years. On 13 Oct 2009, SPALI’s<br />
board of directors approved <strong>the</strong> company to sell <strong>the</strong><br />
120m repurchased shares via public offering. The price<br />
will be determined by book-building method. Unsubscribed<br />
shares, if any, following <strong>the</strong> general public<br />
offer will be sold later on <strong>the</strong> main board of <strong>the</strong> SET.<br />
Proceeds would be used for its working capital and for<br />
land acquisition.<br />
Group Structure. While SPALI currently focuses on<br />
property development in Bangkok and <strong>the</strong> vicinities, <strong>the</strong><br />
company has four subsidiaries and affiliates, which<br />
concentrate on property development in four o<strong>the</strong>r major<br />
provinces in Thailand. These include:<br />
(i) <strong>Supalai</strong> Property Management Co., Ltd. (69.45%)<br />
which operates <strong>Supalai</strong> Pasak Resort Hotel in Saraburi<br />
(ii<br />
ii) Phuket Estate Co., Ltd. (99.89% owned)<br />
which owns <strong>Supalai</strong> Resort & Spa in Phuket<br />
(iii<br />
iii) <strong>Supalai</strong> Nor<strong>the</strong>ast Co., Ltd. (98.77%)<br />
which develops houses for sale in Khon Kaen<br />
(iv<br />
iv) Haadyai Nakarin Co., Ltd.<br />
which operates commercial complex and houses for sale<br />
in Haadyai, Sou<strong>the</strong>rn part of Thailand<br />
Dividend policy. SPALI has a policy to pay approximately<br />
45% of net profit after tax as dividend. The company’s<br />
board of directors may approve interim dividend payment<br />
from time to time when deemed that <strong>the</strong> company has<br />
enough profit to do so. The following chart shows <strong>the</strong><br />
company’s historical dividend payment. Note that in<br />
1H09, SPALI has already paid Bt0.25 dividend per share<br />
(DPS). Based on our conservative 41% payout ratio for<br />
2009, we estimate total DPS for 2009 at Bt0.55,<br />
suggesting ano<strong>the</strong>r Bt0.30 DPS for 2H09. None<strong>the</strong>less, if<br />
we assume a 45% payout ratio in line with its policy, total<br />
DPS for 2009 should be Bt0.60, suggesting ano<strong>the</strong>r<br />
Bt0.35 DPS for 2H09.<br />
Dividend payment record<br />
Btm<br />
0.35<br />
0.30<br />
0.25<br />
0.20<br />
0.15<br />
0.10<br />
0.05<br />
-<br />
2004 2005 2006 2007 2008 1H09<br />
1H 2H Payout (RHS)<br />
Source: Company, <strong>DBS</strong> <strong>Vickers</strong><br />
60%<br />
50%<br />
40%<br />
30%<br />
20%<br />
10%<br />
0%<br />
Page 3
Company Focus<br />
<strong>Supalai</strong><br />
Businesses<br />
Three main businesses. SPALI’s businesses can be classified<br />
into three main categories including (i) residential property<br />
development for sale, (ii) office for rent, and (iii) hotel and<br />
resort business. Currently, residential property development<br />
contributed 96% of total revenue, while rental and service<br />
income makes up <strong>the</strong> remaining 4% of total revenue.<br />
SPALI’s revenue breakdown (1H09)<br />
Low-rise<br />
housing<br />
revenue<br />
27%<br />
Office rents<br />
1%<br />
Service<br />
income<br />
1%<br />
O<strong>the</strong>rs<br />
1%<br />
Revenue recognition method. Sales of low-rise products are<br />
mainly based on pre-built basis (completed units), while sales<br />
of high-rise products are mostly based on off-plan basis.<br />
SPALI realizes its revenue based on completion method (upon<br />
title transfer).<br />
SPALI’s project cycle<br />
Low Rise - "Pre<br />
"<br />
Pre-built<br />
built"<br />
- Construction Commenced<br />
- Construction<br />
Commenced<br />
- Purchase Made<br />
Construction Preparation Period<br />
Construction Period<br />
Mortgage Approval/Cash Preparation<br />
- Transfer of ownership<br />
- 100% of Revenue Recognized<br />
Source: Company, <strong>DBS</strong> <strong>Vickers</strong><br />
Condominium<br />
revenue<br />
High Rise<br />
e - "Pre"<br />
Pre-sale<br />
sale"<br />
- Construction Complete<br />
- Purchase Made<br />
Monthly Installments Preiod<br />
(i) Property Development Business<br />
All types of residential property development. SPALI focuses<br />
on all types of residential property development including<br />
both low-rise (detached houses, duplexes, and townhouses),<br />
and high-rise (condominium). The company has now 31<br />
projects on hand toge<strong>the</strong>r with a number of land bank, which<br />
should ensure revenue stream for at least four years.<br />
Targeting mid-income income earners.<br />
e<br />
SPALI’s products are<br />
considered mid-end with an average selling price of about<br />
Bt2.5m, where demand remains strong. The following table<br />
shows SPALI’s products under various brands.<br />
SPALI’s products under various brands<br />
Brand<br />
ASP<br />
Detached House/Townhouse<br />
(Btm/unit)<br />
<strong>Supalai</strong> Suvarnabhumi 6-10<br />
<strong>Supalai</strong> Orchid Park 3-5<br />
<strong>Supalai</strong> Parkville 3-4<br />
<strong>Supalai</strong> Ville 2-3<br />
Condominium<br />
(Bt/sqm)<br />
<strong>Supalai</strong> Casa Riva 60,000-65,000<br />
<strong>Supalai</strong> Place 50,000-60,000<br />
<strong>Supalai</strong> Park 40,000-50,000<br />
City Home 35,000-40,000<br />
Source: Company, <strong>DBS</strong> <strong>Vickers</strong><br />
- Construction Commenced<br />
Source: Company, <strong>DBS</strong> <strong>Vickers</strong><br />
(ii) Office for Rent<br />
Operating one office tower for rent. SPALI owns and<br />
operates one office tower called “<strong>Supalai</strong> Grand Tower” for<br />
rent. The project is a 34-storey office tower located on Rama<br />
III Road, with total lettable area of 42,000 sqm. As of 30 Jun<br />
2009, occupancy rate was around 50% of <strong>the</strong> total lettable<br />
area.<br />
(iii) Hotel & resort<br />
- Transfer of ownership<br />
- 100% of Revenue Recognized<br />
Operating two hotels. SPALI owns and operates two hotels in<br />
Thailand. The first one is a 138-room hotel called <strong>Supalai</strong><br />
Pasak Resort and Spa, which is located in Saraburi province.<br />
The o<strong>the</strong>r is a 182-room resort Hotel called <strong>Supalai</strong> Resort<br />
and Spa Phuket which is managed by Best Western<br />
International under its “Best Western Premier” brand.<br />
Page 4
Company Focus<br />
<strong>Supalai</strong><br />
<strong>Supalai</strong>’s strategic locations<br />
Source: Company<br />
Page 5
Company Focus<br />
<strong>Supalai</strong><br />
Competitive Strengths<br />
Diversified product mix. The company now has 31 ongoing<br />
residential property projects worth Bt16.3bn in strategic<br />
locations in Greater Bangkok. These projects cover all types of<br />
residential property development (detached houses,<br />
townhouses, duplexes, and condominium), which are<br />
targeting at mid-income earners, with an average unit price<br />
of Bt2.5m.<br />
31 ongoing projects (Sep 2009)<br />
Project Type<br />
Units<br />
Total<br />
Value (Btm)<br />
Remaining<br />
(Btm)<br />
Condo - completed 8,644 21,879 2,543<br />
Condo - under construction 7,557 13,937 3,620<br />
Detached house 6,253 20,813 7,247<br />
Townhouse 3,805 10,136 2,932<br />
Total 26,259 66,765 16,342<br />
Source: Company, <strong>DBS</strong> <strong>Vickers</strong><br />
Rising market share. Based on <strong>the</strong> number of housing units<br />
(both low-rise and high-rise) transferred, SPALI’s market share<br />
has increased significantly during <strong>the</strong> past five years, from<br />
only 1.5% in 2005 to as high as 7.1% in 1H09. The jump in<br />
market share was due mainly to <strong>the</strong> strong jump in <strong>the</strong><br />
number of SPALI’s condominium units transferred during <strong>the</strong><br />
last five years.<br />
SPALI’s rising market share in residential property market<br />
8%<br />
7%<br />
6%<br />
5%<br />
4%<br />
3%<br />
2%<br />
1%<br />
0%<br />
2005 2006 2007 2008 1H09<br />
Source: Company, <strong>DBS</strong> <strong>Vickers</strong><br />
Note: SPALI’s market share is calculated by using SPALI’s no. of<br />
housing units registered divided by total units transferred by housing<br />
developers.<br />
Huge Bt13bn backlog ensuring future revenue stream. Total<br />
backlog (cumulative sales awaiting transfers) amounted to<br />
Bt13bn at end-Sep 2009, of which Bt2.5bn will be realized in<br />
4Q09, Bt5.6bn in 2010, and Bt4.9bn in 2011. This means<br />
4Q09 result should continue to be strong. SPALI’s<br />
cancellation & reject rates are also quite low compared to <strong>the</strong><br />
industry. Current cancellation & reject rates are only 3% for<br />
condominium and about 10.5% for low-rise products.<br />
Backlog (cumulative sales awaiting transfers)<br />
Btm<br />
10000<br />
8000<br />
6000<br />
4000<br />
2000<br />
0<br />
Source: Company, <strong>DBS</strong> <strong>Vickers</strong><br />
Presales (contracted value) showing continued recovery. After<br />
hitting its trough in 4Q08 due to political instability, SPALI’s<br />
presales have recovered steadily since 1Q09. We expect 4Q09<br />
presales to jump on both q-o-q and y-o-y with three new<br />
condominium projects to be launched in 4Q09.<br />
Presales continued to recover<br />
Btm<br />
3,500<br />
3,000<br />
2,500<br />
2,000<br />
1,500<br />
1,000<br />
500<br />
0<br />
5,925<br />
2,859<br />
952<br />
2,487<br />
2,207<br />
4,528<br />
5,620<br />
1,755 1,774<br />
2,502<br />
3Q08 4Q08 1Q09 2Q09 3Q09<br />
4,880<br />
2008 2009 2010 2011<br />
Cumulative Sales Awaiting To Transfer<br />
Sales Transferred in 3Q09<br />
Revenue Recognized<br />
Source: Company, <strong>DBS</strong> <strong>Vickers</strong><br />
Page 6
Company Focus<br />
<strong>Supalai</strong><br />
3 new condominium projects launch in 4Q09 to help boost<br />
presales and backlog. SPALI plans to launch three<br />
condominium projects worth Bt4.7bn in 4Q09, comprising<br />
two in Bangkok and one in downtown Phuket. Given <strong>the</strong><br />
good locations, 4Q09 presales (bookings) should jump again<br />
following <strong>the</strong> launches.<br />
Planned launches for 4Q09<br />
Project Name<br />
Area<br />
(Rai)<br />
Value<br />
(Btm)<br />
Price/Unit<br />
(Btm)<br />
High Rise<br />
1. Dindaeng 4 1,340 1.5 up<br />
2. Ratchayothin 9 2,200 1.5 up<br />
3. Downtown Phuket 5 1,200 1.0 up<br />
Grand Total 18 4,740<br />
Source: Company, <strong>DBS</strong> <strong>Vickers</strong><br />
Secured land bank for future launches. SPALI has secured 12<br />
plots of land for next year’s launches. These will comprise<br />
eight low-rise (detached house and townhouse) projects<br />
worth Bt5.6bn, and four condominium projects worth<br />
Bt7.0bn.<br />
Land banks to be developed from 2010 onwards<br />
Location<br />
Project<br />
Area<br />
(Rai)<br />
Area<br />
(Acres)<br />
Value<br />
(Btm)<br />
1. Phaholyothin 54/1 Low Rise (DH) 11 5 200<br />
2. Phoholyothin 50 Low Rise (DH) 25 11 500<br />
3. Ramindra Low Rise (DH) 29 13 560<br />
4. Phuket Low Rise (DH) 37 17 600<br />
5. Phathumthani Low Rise (DH) 65 30 980<br />
6. Rama II Low Rise (DH) 169 77 2,090<br />
7. Saimai Low Rise (TH) 15 7 290<br />
8. Nonthaburi Low Rise (TH) 25 11 400<br />
9. Rama III High Rise 3 1 600<br />
10. Lasal High Rise 12 5 1,500<br />
11. Petchkasem High Rise 6 3 1,580<br />
12. Charoennakorn High Rise 14 6 3,300<br />
Total 411 186 12,600<br />
Source: Company, <strong>DBS</strong> <strong>Vickers</strong><br />
Solid management team. SPALI’s top management has been<br />
in <strong>the</strong> property development business for more than 30 years.<br />
Given its long experience industry, SPALI has been able to<br />
grow its market share, revenue, and profit impressively and<br />
now rises to be one of <strong>the</strong> leading residential property<br />
developers in Thailand.<br />
Superior margins. SPALI has always achieved superior gross<br />
and net profit margin compared to <strong>the</strong> industry, thanks to its<br />
superior cost management via in-house professionals,<br />
efficient designs, and effective cost control. In 1H09, <strong>the</strong><br />
company’s gross margin was about 45%, <strong>the</strong> highest<br />
compared to <strong>the</strong> industry’s average of about 34%. The<br />
superior margins have been consistent over <strong>the</strong> last five years<br />
(2004-2008), when <strong>the</strong> company could achieve average gross<br />
margin of 42% (vs industry average of 32%), and net margin<br />
of 20% (vs industry average of 14%). We expect gross<br />
margin to come down from an extra-ordinary high level in<br />
1H09 to <strong>the</strong> company’s normal range of 40% next year, but<br />
still be relatively high compared to <strong>the</strong> industry.<br />
SPALI’s superior gross margin<br />
50%<br />
45%<br />
40%<br />
35%<br />
30%<br />
25%<br />
20%<br />
4Q05<br />
2Q06<br />
Source: <strong>DBS</strong> <strong>Vickers</strong><br />
Key Risks<br />
4Q06<br />
2Q07<br />
4Q07<br />
2Q08<br />
SPALI<br />
Industry<br />
Rising raw material costs. Rising raw material costs could<br />
negatively affect <strong>the</strong> company’s cost and margin.<br />
None<strong>the</strong>less, SPALI has effective construction cost control<br />
techniques throughout <strong>the</strong> production chain whereby<br />
contractors are given a lump sum amount for labour and raw<br />
materials. Contractors are committed to procure most of raw<br />
materials while <strong>the</strong> company buys some materials at discount<br />
from manufacturers or large-sized distributors. SPALI also<br />
closely monitors raw material prices and if necessary, a large<br />
quantity of <strong>the</strong> material would be procured for higher<br />
bargaining power.<br />
Interest rate risks. A significant rise in local interest rate could<br />
undeniably negatively impact demand and raise <strong>the</strong><br />
company’s interest costs. None<strong>the</strong>less, we currently expect<br />
interest rate to increase by only about 50bps next year, which<br />
is still a bit low compared to history. In addition, SPALI has<br />
recently managed to issue Bt1bn bond with 3.5 year maturity,<br />
which should help lock in <strong>the</strong> currently low interest cost for<br />
<strong>the</strong> next 3.5 years.<br />
4Q08<br />
2Q09<br />
Page 7
Company Focus<br />
<strong>Supalai</strong><br />
Industry Outlook<br />
Positive outlook. We see positive outlook for <strong>the</strong> residential<br />
property sector in 4Q09 and 1Q10, supported by (i)<br />
favourable demand vs supply situation, (ii) <strong>the</strong> low interest<br />
rates environment, (iii) rebounding consumer confidence, and<br />
(iv) an improving economy. Historical data suggests housing<br />
demand correlates strongly with GDP growth and consumer<br />
confidence. Given expectations of economic recovery in 2H09<br />
and 2010, consumer confidence and subsequently residential<br />
property demand should also improve.<br />
Demand is also falling, but at a smaller magnitude.<br />
According to AREA, total number of housing units sold<br />
dropped 27% y-o-y to 27,004 units in 1H09. We expect <strong>the</strong><br />
industry’s housing units sold to fall 15% y-o-y to about<br />
55,805 units in 2009. Average selling price is expected to<br />
increase 22% to Bt3.3m per unit in 2009, due mainly to <strong>the</strong><br />
increase contribution of more mid-end products closer to<br />
<strong>the</strong> city centres in 2009.<br />
Breakdown of total housing units sold in 1H09<br />
(i) Favourable demand vs supply situation<br />
New supply falling fast. According to <strong>the</strong> Agency for Real<br />
Estate Affairs (AREA), total number of newly launched units<br />
in Greater Bangkok fell 48% y-o-y to 20,258 units and is<br />
expected to fall 40% for <strong>the</strong> entire year from 2008 to<br />
40,675 units in 2009. In terms of value, that of new<br />
developments dropped 23% y-o-y to Bt67.0bn in 1H09, and<br />
is expected to drop 28% from 2008. Total cumulative<br />
inventory in <strong>the</strong> market dropped 6% from end-2008 to<br />
104,066 units at end-1H09 due to <strong>the</strong> sharp fall in supply.<br />
Detached<br />
House<br />
21%<br />
Townhouse<br />
20%<br />
Source: AREA, <strong>DBS</strong> <strong>Vickers</strong><br />
Duplex<br />
8% Shophouse<br />
3%<br />
Condominium<br />
48%<br />
Supply is falling faster than demand<br />
Units<br />
250,000<br />
200,000<br />
New launch<br />
Units sold<br />
Supply change<br />
Demand change<br />
150%<br />
100%<br />
150,000<br />
100,000<br />
50%<br />
0%<br />
-50%<br />
50,000<br />
-100%<br />
0<br />
1995 1996 1997 1998 1999 2000 2001 2002 2003 2004 2005 2006 2007 2008 2009F<br />
-150%<br />
Source: AREA<br />
Page 8
Company Focus<br />
<strong>Supalai</strong><br />
(ii) Interest rates to stay flat until 3Q10<br />
Interest rates to remain low. The Monetary Policy<br />
Committee (MPC) has aggressively cut <strong>the</strong> policy interest<br />
rate by 125bps in 1Q09 and ano<strong>the</strong>r 25bps to 1.25% in Apr<br />
2009. Local commercial banks have also cut MLR to about<br />
5.875% currently. We expect local interest rates to stay flat<br />
at current level until 3Q10, when we expect <strong>the</strong> MPC to<br />
start to increase <strong>the</strong> policy rate by 25bps to 1.50%. With<br />
interest rates to remain flat at least in <strong>the</strong> next six months,<br />
we see this as positive for <strong>the</strong> property sector.<br />
Interest rates to remain low<br />
18%<br />
16%<br />
14%<br />
12%<br />
10%<br />
8%<br />
6%<br />
4%<br />
2%<br />
0%<br />
Source: BoT, Reuters, <strong>DBS</strong> <strong>Vickers</strong><br />
(iii) Rebounding consumer confidence<br />
Consumer confidence rebounding. According to data from<br />
<strong>the</strong> University of Thai Chamber of Commerce, local<br />
Consumer Confidence Index (CCI) has rebounded for four<br />
consecutive months since Jun 2009.<br />
Consumer Confidence Rebounding<br />
88<br />
86<br />
84<br />
82<br />
80<br />
78<br />
76<br />
74<br />
72<br />
70<br />
13.8% 15.3%<br />
15.0%<br />
13.2%<br />
11.5%<br />
12.8% 8.5%<br />
11.3% 12.0% 11.8% 11.5% 7.5%7.5% 7.8%<br />
5.8% 6.9% 7.3%<br />
5.8% 6.0%<br />
5.9%<br />
7.8% 6.8%<br />
7.0%<br />
5.8% 5.8%<br />
4.3%<br />
3.0% 4.0% 5.8% 5.3%<br />
Jan-06<br />
1995<br />
1996<br />
1997<br />
1998<br />
1999<br />
2000<br />
2001<br />
2002<br />
2003<br />
2004<br />
2005<br />
2006<br />
2007<br />
2008<br />
Aug 09<br />
May-06<br />
MLR<br />
Sep-06<br />
Jan-07<br />
May-07<br />
Sep-07<br />
Jan-08<br />
May-08<br />
Mortgage rate<br />
Sep-08<br />
Jan-09<br />
May-09<br />
Sep-09<br />
Developers Sentiment Index rebounds. According to Real<br />
Estate Information Centre, which surveys listed and nonlisted<br />
housing developers, <strong>the</strong> Housing Developers Sentiment<br />
Index (HDSI) has been falling since 2Q08, and hit bottom in<br />
4Q08 before rebounding steadily since 1Q09.<br />
The 6-Month Expectation Index has also improved from<br />
40.2% in 4Q08 to 50.4% in 1Q09, 62.2% in 2Q09, and<br />
69.9 in 3Q09.<br />
Housing Developers’ Sentiment Index rising<br />
70<br />
60<br />
50<br />
40<br />
30<br />
20<br />
10<br />
0<br />
Listed<br />
Non-Listed<br />
Current Situation Index<br />
4Q07 1Q08 2Q08 3Q08 4Q08 1Q09 2Q09 3Q09<br />
Source: NESDB, <strong>DBS</strong> <strong>Vickers</strong><br />
(iv) An improving economy<br />
Thailand’s GDP expected to improve in 2H09 and 2010. We<br />
believe Thailand’s economy has already bottomed out in<br />
1H09 and GDP should turn positive y-o-y growth from 4Q09<br />
onwards. Our economist forecasts Thailand’s GDP will<br />
recover strongly from a contraction of 3.2% in 2009 to<br />
4.0% growth in 2010.<br />
Thailand: Annual GDP Growth (y-o-y)<br />
y)<br />
8%<br />
6%<br />
4%<br />
2%<br />
0%<br />
-2%<br />
-4%<br />
-6%<br />
-8%<br />
-10%<br />
-12%<br />
1998<br />
1999<br />
2000<br />
2001<br />
Source: NESDB, <strong>DBS</strong> <strong>Vickers</strong><br />
2002<br />
2003<br />
2004<br />
2005<br />
2006<br />
2007<br />
2008<br />
2009F<br />
2010F<br />
Source: BoT, Reuters, <strong>DBS</strong> <strong>Vickers</strong><br />
Page 9
Company Focus<br />
<strong>Supalai</strong><br />
Changing criteria for BOI housing projects. On 10 Jun, <strong>the</strong><br />
Board of Investment (BOI) had agreed to relax <strong>the</strong> criteria for<br />
BOI housing projects in Zone 1 (Bangkok and 5 o<strong>the</strong>r<br />
provinces including Samut Prakan, Samut Sakhon, Nakhon<br />
Pathom, Nonthaburi and Pathum Thani). There is no change<br />
on promotional criteria for projects located in Zone 2 and 3.<br />
BOI Investment Promotion Zones<br />
About <strong>the</strong> change. The changes include (i) minimum no. of<br />
units in <strong>the</strong> projects (from 150 to 50 units), (ii) maximum<br />
selling price per unit (from Bt0.6m to Bt1.0m for<br />
condominium and to Bt1.2m for detached houses and<br />
townhouses), and (iii) minimum usable area (from 31 sqm<br />
to 28 sqm for condominium and 70 sqm for detached<br />
houses and townhouses).<br />
Changing criteria for BOI housing projects in Zone 1<br />
Criteria<br />
Existing<br />
New<br />
1. Minimum units 150 50<br />
2. Minimum usable area (sqm)<br />
- Condominium 31 28<br />
- Detached houses & townhouses 31 70<br />
3. Maximum selling prices (Btm)<br />
- Condominium 0.6 1.0<br />
- Detached houses & townhouses 0.6 1.2<br />
Source: <strong>DBS</strong> <strong>Vickers</strong><br />
Reasons for <strong>the</strong> change. Based on BOI’s assessment, <strong>the</strong><br />
housing projects located in Zone 1 are subject to rising land<br />
and construction material costs (which make up about 70-<br />
80% of total cost), and increasing wages. The BOI<br />
<strong>the</strong>refore sees it necessary to increase <strong>the</strong> housing selling<br />
price criteria from Bt0.6m to Bt1.0m for condominium and<br />
Bt1.2m for detached houses and townhouses to match <strong>the</strong><br />
current situation. This is to enable low-income earners to<br />
own housing in Bangkok and its vicinities. As for projects<br />
located in zone 2 and zone 3, <strong>the</strong> BOI sees no necessity for<br />
criteria adjustment given that land prices in those locations<br />
have not increased much compared to those in zone 1.<br />
Zone 1 : includes Bangkok, Samut Prakan, Samut Sakhon, Nakhon<br />
Pathom, Nonthaburi and Pathum Thani (Bangkok and 5<br />
provinces)<br />
Zone 2 : includes Ang Thong, Ayutthaya, Chachoengsao, Chon Buri,<br />
Kanchanaburi, Nakhon Nayok, Phuket, Ratchaburi, Rayong,<br />
Samut Songkhram, Saraburi, and Suphanburi (12 provinces)<br />
Zone 3 : encompasses <strong>the</strong> remaining 58 provinces<br />
Source: BoI<br />
Positive for SPALI. The relaxed housing criteria benefits<br />
SPALI in <strong>the</strong> sense that <strong>the</strong> company can apply for BOI<br />
promotional privileges on <strong>the</strong> company’s projects that fit<br />
into <strong>the</strong> BOI’s relaxed criteria. Revenue from <strong>the</strong> BOI<br />
approved projects is tax-free for 5 years. This means<br />
SPALI’s effective tax rate could come down from next year<br />
onwards. None<strong>the</strong>less, we expect revenue contribution<br />
from <strong>the</strong> BOI approved projects to be quite small at no<br />
more than 10-15% in <strong>the</strong> short- to medium-term.<br />
Page 10
Company Focus<br />
<strong>Supalai</strong><br />
Quarterly / Interim Performance<br />
1H09 net profit already exceeded 2008 profit. SPALI’s 1H09<br />
net profit totalled Bt1.2bn. This already exceeded <strong>the</strong> net<br />
profit of Bt1.07bn made for <strong>the</strong> entire of 2008. The strong<br />
growth was due mainly to (i) <strong>the</strong> strong 45% jump in<br />
realized revenue, (ii) <strong>the</strong> wider gross profit margin from 40%<br />
in 1H08 to about 45% in 1H09 due to contribution of highmargin<br />
condominium projects, and (iii) <strong>the</strong> tax-savings from<br />
<strong>the</strong> government’s tax-cut package since 29 Mar 2008. Note<br />
that <strong>the</strong> government has introduced <strong>the</strong> tax-cut package<br />
since 29 Mar 2008 and has extended <strong>the</strong> package for<br />
ano<strong>the</strong>r one year until 28 Mar 2010. Under <strong>the</strong> tax-cut<br />
package, specific business tax, transfer fees, and mortgage<br />
rates will come down. This result in a substantial 4.2% of<br />
sales tax savings by all developers.<br />
Improving balance sheet. Cash flows from operations<br />
improved sharply to Bt1.1bn in 1H09. Net gearing also<br />
dropped steadily from 92% at end-2008 to 64% at end-<br />
1H09.<br />
Summary of property tax cut package<br />
For Developers & Home buyers<br />
Specific Business<br />
Tax<br />
Normal<br />
Tax Incentives<br />
3.30% 0.11% 29 Mar 08 -<br />
28 Mar 10<br />
Transfer Fees 2.00% 0.01% 30 Mar 08 -<br />
28 Mar 10<br />
Mortgage<br />
Registration Fees<br />
Total tax savings Developers<br />
1.00% 0.01% 31 Mar 08 -<br />
28 Mar 10<br />
Home Buyers 2.0%<br />
For Home buyers<br />
Actual payment to purchase<br />
property<br />
Interest paid on mortgage<br />
loans<br />
Source: Company, <strong>DBS</strong> <strong>Vickers</strong><br />
4.2% of sales<br />
Amount deductible from<br />
taxable income<br />
Who pays<br />
Developer<br />
Developer-<br />
Buyer<br />
Buyer<br />
Expiry Date<br />
300,000 baht 31-Dec-09<br />
100,000 baht Ongoing<br />
Quarterly / Interim Income Statement (Bt<br />
m)<br />
FY Dec<br />
3Q2008<br />
4Q2008<br />
1Q2009<br />
2Q2009<br />
2009<br />
Turnover 1,297 1,559 2,039 2,502<br />
Cost of Goods Sold (797) (973) (1,134) (1,368)<br />
Gross Profit 500 587 904 1,134<br />
O<strong>the</strong>r Oper. (Exp)/Inc (130) (128) (124) (144)<br />
Operating Profit 370 459 780 990<br />
O<strong>the</strong>r Non Oper. (Exp)/Inc 32 35 26 32<br />
Associates & JV Inc 0 0 0 0<br />
Net Interest (Exp)/Inc (22) (26) (26) (25)<br />
Exceptional Gain/(Loss) (50) 0 0 0<br />
Pre-tax Profit 330 467 781 998<br />
Tax (116) (262) (235) (300)<br />
Minority Interest (10) 10 (5) (11)<br />
Net Profit 204 215 541 686<br />
Net profit bef Except. 254 215 541 686<br />
EBITDA 421 512 826 1,043<br />
Sales Gth (%) (40.0) 20.2 30.7 22.7<br />
EBITDA Gth (%) (44.4) 21.6 61.3 26.2<br />
Operating Profit Gth (%) (48.3) 24.0 70.0 27.0<br />
Net Profit Gth (%) (57.1) 5.2 151.5 26.9<br />
Gross Margins (%) 38.5 37.6 44.4 45.3<br />
Operating Margins (%) 28.5 29.4 38.3 39.6<br />
Net Profit Margins (%) 15.8 13.8 26.5 27.4<br />
Source: Company, <strong>DBS</strong> <strong>Vickers</strong><br />
Page 11
Company Focus<br />
<strong>Supalai</strong><br />
Financials – Income Statement<br />
FY09F earnings expected to surge 102% y-o-y, y<br />
y, highest in <strong>the</strong><br />
industry. We estimate SPALI’s earnings to grow 102% y-o-y<br />
to Bt2.3bn, <strong>the</strong> highest in its history. This is mainly on <strong>the</strong><br />
back of (i) <strong>the</strong> strong 49% jump in realized revenue, (ii) <strong>the</strong><br />
wider gross profit due to contribution of high-margin<br />
condominium projects, and (iii) <strong>the</strong> tax-savings from <strong>the</strong><br />
government’s tax-cut package since 29 Mar 2008. Such<br />
strong earnings growth is <strong>the</strong> highest in <strong>the</strong> industry.<br />
FY10F earnings could ease, but still very strong. Given <strong>the</strong><br />
anticipated strong earnings growth in FY09F, coupled with<br />
<strong>the</strong> scheduled expiration of <strong>the</strong> government’s tax-cut<br />
package in Mar 2010, we estimate SPALI’s earnings could<br />
ease, but still very strong at Bt2.1bn in FY10F.<br />
If property-tax tax cut package is extended, it could boost our<br />
FY10-FY11F FY11F earnings. We assumed that <strong>the</strong> property-tax cut<br />
package would not be extended when it expires in late Mar<br />
2010. But if it is, our FY10F earnings could be lifted by 10%<br />
and 4%, respectively.<br />
Sales Trend<br />
Operating Cost Trend<br />
Profitability Trend<br />
Bt m<br />
10,000<br />
8,000<br />
6,000<br />
4,000<br />
2,000<br />
0<br />
2007A 2008A 2009F 2010F 2011F<br />
Total Revenue<br />
Revenue Growth (%) (YoY)<br />
50.9%<br />
45.9%<br />
40.9%<br />
35.9%<br />
30.9%<br />
25.9%<br />
20.9%<br />
15.9%<br />
10.9%<br />
5.9%<br />
7000<br />
6000<br />
5000<br />
4000<br />
3000<br />
2000<br />
1000<br />
0<br />
2007A 2008A 2009F 2010F 2011F<br />
O<strong>the</strong>r Operating Expenses (-)<br />
Cost of Goods Sold (-)<br />
2000<br />
1500<br />
1000<br />
500<br />
0<br />
2007A 2008A 2009F 2010F 2011F<br />
Net Profit (After-extraordinaries )<br />
Net Profit Growth (%) (YoY)<br />
110%<br />
90%<br />
70%<br />
50%<br />
30%<br />
10%<br />
(10%)<br />
FY Dec (Bt<br />
m) 2006A 2007A 2008A 2009F 2010F 2011F<br />
Turnover 4,518 4,796 5,998 8,939 9,768 10,689<br />
Cost of Goods Sold (2,608) (2,871) (3,647) (5,051) (5,861) (6,414)<br />
Gross Profit 1,910 1,925 2,350 3,889 3,907 4,276<br />
O<strong>the</strong>r Opg (Exp)/Inc (595) (564) (546) (564) (890) (1,080)<br />
Operating Profit<br />
1,315 1,193 1,804 3,325 3,017 3,196<br />
O<strong>the</strong>r Non Opg (Exp)/Inc 118 100 75 105 105 129<br />
Associates & JV Inc 0 0 0 0 0 0<br />
Net Interest (Exp)/Inc (48) (79) (102) (101) (91) (102)<br />
Exceptional Gain/(Loss) 0 0 0 0 0 0<br />
Pre-tax Profit 1,390 1,214 1,778 3,328 3,031 3,223<br />
Tax (473) (383) (691) (1,002) (887) (902)<br />
Minority Interest (37) (15) (18) (26) (27) (29)<br />
Preference Dividend 0 0 0 0 0 0<br />
Net Profit 880 816 1,069 2,300 2,116 2,292<br />
Net profit before Except. 880 816 1,069 2,300 2,116 2,292<br />
EBITDA 1,476 1,359 1,955 3,515 3,217 3,430.4<br />
Sales Gth (%) 34.6 6.2 25.0 49.0 9.3 9.4<br />
EBITDA Gth (%) 39.8 (7.9) 43.9 79.7 (8.5) 6.6<br />
Operating Profit Gth (%) 40.0 (9.2) 51.2 84.2 (9.2) 5.9<br />
Net Profit Gth (%) 5.9 (7.2) 30.9 115.2 (8.0) 8.3<br />
Gross Margins (%) 42.3 40.1 39.2 43.5 40.0 40.0<br />
Opg Margins (%) 29.1 24.9 30.1 37.2 30.9 29.9<br />
Net Profit Margins (%) 19.5 17.0 17.8 25.7 21.7 21.4<br />
% of Opg Expenses to Sales 13.2 15.3 9.1 6.3 9.1 10.1<br />
Effective Tax Rate (%) 34.0 31.6 38.9 30.1 29.3 28.0<br />
Source: Company, <strong>DBS</strong> <strong>Vickers</strong><br />
Page 12
Company Focus<br />
<strong>Supalai</strong><br />
Financials – Balance Sheet<br />
• Successfully issued Bt1bn domestic bond recently. In Sep<br />
2009, SPALI issued Bt1bn bond locally. The 3.5-year bond<br />
carries a coupon rate of 4.35% per annum. Proceeds are<br />
mainly for refinancing. This should help lock in <strong>the</strong> low<br />
interest rate cost for <strong>the</strong> next 3.5 years.<br />
• Net gearing to come down sharply by end-2009.<br />
We<br />
expect SPALI’s net gearing to come down sharply from 64%<br />
at end 1H09 to 48% by end-2009. This is on <strong>the</strong> back of (i)<br />
<strong>the</strong> expected strong profit in 2H09, and (ii) <strong>the</strong> potential cash<br />
inflow and gain from <strong>the</strong> planned sale of 120m repurchased<br />
shares in 4Q09 via public offering. Looking forward, net<br />
gearing should continue to come down to 47% at end-2010<br />
and 45% at end-2011.<br />
Breakdown of Assets (2009<br />
(<br />
2009) Breakdown of Capital C<br />
(2009(<br />
2009) Financial Leverage & Net Debt to Equity<br />
Inventory -<br />
77.0%<br />
Bank,<br />
Net Cash<br />
Fixed and<br />
Assets -<br />
Liquid<br />
Debtors - Assets -<br />
0.0%<br />
Common<br />
Shareholde<br />
s' Equity -<br />
50.2%<br />
ST<br />
Debt -<br />
5,100<br />
4,600<br />
4,100<br />
3,600<br />
3,100<br />
2,600<br />
2,100<br />
LT<br />
1,600<br />
Debt - 1,100<br />
2007A 2008A 2009F 2010F 2011F<br />
2.6<br />
2.1<br />
1.6<br />
1.1<br />
0.6<br />
0.1<br />
Net Debt/(Cash)<br />
Financial Leverage (X) (R.H.S)<br />
Net Debt to Equity (X) (R.H.S)<br />
FY Dec (Bt<br />
m) 2006A 2007A 2008A 2009F 2010F 2011F<br />
Net Fixed Assets 1,249 1,350 1,352 1,322 1,280.0 1,238<br />
Invts in Assocs & JVs 0 0 0 0 0 0<br />
O<strong>the</strong>r LT Assets 438 237 188 188 188 188<br />
Cash & ST Invts 116 152 101 112 189 280<br />
Inventory & Land Bank 6,130 8,646 11,240 13,471 15,455 17,448<br />
Debtors 0 0 0 0 0 0<br />
O<strong>the</strong>r Current Assets 378 238 592 593 593 594<br />
Total Assets 8,311 10,623 13,473 15,686 17,705 19,748<br />
ST Debt 1,680 1,465 3,542 1,763 1,763 1,763<br />
O<strong>the</strong>r Current Liab 1,602 2,218 3,195 4,379 4,773 5,017<br />
LT Debt 562 2,145 1,441 2,000 2,500 3,000<br />
O<strong>the</strong>r LT Liabilities 4 5 5 5 5 5<br />
Shareholder’s Equity 4,207 4,529 5,031 7,278 8,403 9,703<br />
Minority Interests 257 261 260 260 260 260<br />
Total Cap. & Liab. 8,311 10,623 13,473 15,686 17,705 19,748<br />
Total Debt 2,241.3 3,610.0 4,982.7 3,763.4 4,263.4 4,763.4<br />
Net Cash / (Debt) (2,125) (3,458) (4,882) (3,651) (4,075) (4,483)<br />
Coverage Ratios (x)<br />
Net Interest Cover 27.3 15.2 17.8 32.9 33.2 31.2<br />
Free Cashflow to interest Exp nm nm nm 5.7 nm nm<br />
Leverage Analysis (x)<br />
EBITDA Gross Interest Cover 30.7 17.3 19.2 34.7 35.4 33.5<br />
Total Debt to EBITDA 1.5 2.7 2.5 1.1 1.3 1.4<br />
Total Debt to Total Assets 0.3 0.3 0.4 0.2 0.2 0.2<br />
Total Debt to Capital 0.5 0.8 0.9 0.5 0.5 0.5<br />
Net Debt to Equity 0.5 0.7 0.9 0.5 0.5 0.4<br />
Net Debt to Equity ex MI 0.5 0.8 1.0 0.5 0.5 0.5<br />
Capex to Debt 0.1 0.0 0.0 0.0 0.0 0.0<br />
Liquidity Analysis (x)<br />
Cash Ratio 0.0 0.0 0.0 0.0 0.0 0.0<br />
Current Ratio 2.0 2.5 1.8 2.3 2.5 2.7<br />
Quick Ratio 0.0 0.0 0.0 0.0 0.0 0.0<br />
Source: Company, <strong>DBS</strong> <strong>Vickers</strong><br />
Page 13
Company Focus<br />
<strong>Supalai</strong><br />
Financials – Cash Flow<br />
Cash flow improving. We expect SPALI’s operating cash flow<br />
should increase sharply to Bt1.3bn in 2009 (from negative<br />
operating cash flow in 2008) , due to <strong>the</strong> strong jump in<br />
condominium and housing transfer in 2009.<br />
… and should remain strong. Looking forward, cash flow<br />
should remain strong, despite our assumptions that <strong>the</strong><br />
company will need to spend about Bt2.5-3.0bn on land<br />
acquisition during each of <strong>the</strong> next few years. This is to<br />
ensure continuous project launches and future revenue<br />
growth.<br />
Cash Flow Trend<br />
Free Cash Flow Per Share<br />
Free Cash Flow As At Year End<br />
2,911<br />
1.81<br />
2,411<br />
1,911<br />
1,411<br />
911<br />
411<br />
1.31<br />
0.81<br />
0.31<br />
2,500<br />
2,000<br />
1,500<br />
-89<br />
-589<br />
-1,089<br />
2007A 2008A 2009F 2010F 2011F<br />
(0.19)<br />
(0.69)<br />
2007A 2008A 2009F 2010F 2011F<br />
1,000<br />
500<br />
CF from Op CF from Invt CF from Fin<br />
Free Cash Flow Per ShareFree Operating Cash Flow<br />
2007A 2008A 2009F 2010F 2011F<br />
FY Dec (Bt<br />
m) 2006A 2007A 2008A 2009F 2010F 2011F<br />
Pre-Tax Profit 1,390 1,214 1,778 3,328 3,031 3,223<br />
Dep. & Amort. 38 66 76 86 96 106<br />
Tax Paid (473) (383) (691) (1,002) (887) (902)<br />
Assoc. & JV Inc/(loss) 0 0 0 0 0 0<br />
Chg in Wkg.Cap. (306) (1,721) (1,502) (1,138) (1,691) (1,850)<br />
O<strong>the</strong>r Operating CF 2 (1) 89 18 27 17<br />
Net Operating CF 614 (833) (275) 1,292 575 592<br />
Capital Exp.(net) (255) (171) (81) (24) (24) (24)<br />
O<strong>the</strong>r Invts.(net) 22 2 1 0 0 0<br />
Invts in Assoc. & JV 0 0 0 0 0 0<br />
Div from Assoc & JV 0 0 0 0 0 0<br />
O<strong>the</strong>r Investing CF 10 12 18 17 17 17<br />
Net Investing CF (223) (157) (61) (8) (8) (8)<br />
Div Paid (635) (403) (479) (687) (991) (992)<br />
Chg in Gross Debt (398) 1,378 870 (1,219) 500 500<br />
Capital Issues 681 50 174 0 0 0<br />
O<strong>the</strong>r Financing CF 0 0 (280) 634 0 0<br />
Net Financing CF (353) 1,026 285 (1,272) (491) (492)<br />
Net Cashflow 39 36 (51) 12 76 93<br />
Opg CFPS (Bt) 0.6 0.6 0.8 1.4 1.3 1.4<br />
Free CFPS (Bt) 0.2 (0.6) (0.2) 0.7 0.3 0.3<br />
Source: Company, <strong>DBS</strong> <strong>Vickers</strong><br />
Page 14
Company Focus<br />
<strong>Supalai</strong><br />
Financial Ratios (%)<br />
(<br />
• Gross margin to remain strong. We expect SPALI’s gross<br />
margin to jump to as high as 43.5% in 2009 due to <strong>the</strong><br />
contribution of higher-margin condominium projects, before<br />
coming down to a more sustainable level at 40% in 2010<br />
and 2011. None<strong>the</strong>less this is still relatively high compared<br />
with <strong>the</strong> industry’s average at about 34%.<br />
• High ROE. We expect SPALI’s ROE to jump to as high as<br />
37.4% in 2009 due to <strong>the</strong> strong jump in earnings, before<br />
coming down to 27.0% in 2010 and 25.3% in 2011, both of<br />
which are still relatively strong.<br />
ROAE / ROAA Trend (%) Margin Trend (%)<br />
Total Debt & Gross Interest Cover<br />
38.0%<br />
33.0%<br />
28.0%<br />
23.0%<br />
18.0%<br />
13.0%<br />
8.0%<br />
2007A 2008A 2009F 2010F 2011F<br />
Ret on Avg Equity (ROAE) %<br />
Ret on Avg Assets (ROAA) %<br />
40%<br />
35%<br />
30%<br />
25%<br />
20%<br />
15%<br />
10%<br />
0<br />
EBITDA Margin % EBIT Margin % Net Income Margin %<br />
2007A 2008A 2009F 2010F 2011F<br />
6000<br />
5000<br />
4000<br />
3000<br />
2000<br />
1000<br />
2007A 2008A 2009F 2010F 2011F<br />
Total Debt (+) Gross Interest Cover (X) (YoY)<br />
30.9x<br />
28.9x<br />
26.9x<br />
24.9x<br />
22.9x<br />
20.9x<br />
18.9x<br />
16.9x<br />
14.9x<br />
12.9x<br />
FY Dec 2006A 2007A 2008A 2009F 2010F 2011F<br />
Profitability Ratios<br />
Sales Growth (%) 34.6 6.2 25.0 49.0 9.3 9.4<br />
Gross Margin (%) 42.3 40.1 39.2 43.5 40.0 40.0<br />
Operating Margin (%) 29.1 24.9 30.1 37.2 30.9 29.9<br />
Net Profit Margin (%) 19.5 17.0 17.8 25.7 21.7 21.4<br />
Financial Leverage (x) 1.9 2.2 2.5 2.1 2.0 2.0<br />
Tax Retention Rate (%) 66.0 68.4 61.1 69.9 70.7 72.0<br />
Sustainable Growth (%) 12.0 9.5 11.6 22.0 14.8 13.9<br />
ROAE (%) 23.2 18.7 22.4 37.4 27.0 25.3<br />
ROA (%) 11.2 8.6 8.9 15.8 12.7 12.2<br />
ROCE (%) 13.5 10.8 11.8 21.5 17.6 16.6<br />
Activity Ratios<br />
Debtors Turn (average days) N/A N/A N/A N/A N/A N/A<br />
Creditors Turn (average days) 42.5 56.3 61.2 57.3 61.9 63.6<br />
Inventory Turn (average days) 794.1 961.3 1,016.1 908.3 915.7 951.9<br />
Total Asset Turnover (x) 0.6 0.5 0.5 0.6 0.6 0.6<br />
Fixed Asset Turnover (x) 6.6 3.7 4.4 6.7 7.5 8.5<br />
Asset Replacement Ratio (x 6.8 2.6 1.1 0.3 0.3 0.2<br />
Source: Company, <strong>DBS</strong> <strong>Vickers</strong><br />
Page 15
Company Focus<br />
<strong>Supalai</strong><br />
Share price performance<br />
A strong out-performer YTD. SPALI’s share price has jumped<br />
185% YTD, significantly out-performing <strong>the</strong> SET Index’s<br />
51% gain and <strong>the</strong> SET Property Index’s 87% surge. This<br />
could be attributed to <strong>the</strong> company’s improving<br />
fundamentals, as well as <strong>the</strong> anticipated strong earnings<br />
growth for this year.<br />
Valuation<br />
Attractive valuation. Despite <strong>the</strong> share price rally, SPALI<br />
trading at only 4.4x 2010 PE, still cheap compared to its<br />
peers. It also offers generous 2010 dividend yield of 10.2%<br />
(payable semi-annually).<br />
PE Band<br />
(iii) SPALI is no longer a small cap. Its market capitalization is<br />
now US$280m compared to about US$100m at <strong>the</strong> end of<br />
last year, making it more appealing to larger funds.<br />
(iv) Liquidity has improved. Trading liquidity has also<br />
improved from about US$0.5m/day last year to about<br />
US$1.4m/day YTD.<br />
(v) No more warrants outstanding.<br />
Previous concerns about<br />
potential share dilution arising from SPALI’s warrants have<br />
eased as <strong>the</strong>re are no more warrants outstanding.<br />
Fair value of Bt7.65. We value SPALI at Bt7.65, based on <strong>the</strong><br />
estimated RNAV. The bulk of its valuation is mainly on (i) its<br />
inventory and land bank, and (ii) its office tower called SPALI<br />
Grand Tower on Rama III Road.<br />
PE (x)<br />
10<br />
9<br />
8<br />
7<br />
6<br />
5<br />
4<br />
3<br />
2<br />
1<br />
-<br />
(1) 02 03 04 05 06 07 08 09<br />
+2 sd<br />
+1 sd<br />
Mean<br />
-1 sd<br />
-2 sd<br />
RNAV Calculation<br />
Unit: Btm<br />
Cash 338<br />
A/R 1<br />
Inventory & Land Bank 18,575<br />
<strong>Supalai</strong> Grand Tower 1,700<br />
Total assets 20,614<br />
Total liabilities (7,479)<br />
Net asset value 13,135<br />
No. of shares (m) 1,717<br />
RNAV/share (Bt) 7.65<br />
Source: <strong>DBS</strong> <strong>Vickers</strong><br />
Source: <strong>DBS</strong> <strong>Vickers</strong><br />
The stock deserves re-rating<br />
rating. We believe SPALI should<br />
continue to re-rate for <strong>the</strong> following reasons:<br />
(i) Current valuation is still cheap. At only 4.4x 2010 PE,<br />
SPALI is offering much higher earnings growth of 102% and<br />
more generous 2010 dividend yield of 10.2%, at much<br />
lower earnings multiple compared to its peers.<br />
(ii) Strong jump in market share over <strong>the</strong> past 5 years.<br />
SPALI’s market share growth in <strong>the</strong> last five years was <strong>the</strong><br />
strongest in <strong>the</strong> industry. Based on <strong>the</strong> number of housing<br />
units transferred in Greater Bangkok area, SPALI’s market<br />
share expanded from only 1.5% in 2005 to 7.5% in 1H09.<br />
Page 16
Company Focus<br />
<strong>Supalai</strong><br />
Residential Property Comparison<br />
Mkt<br />
Price<br />
Target % PE<br />
PE<br />
PBV<br />
EV/EBITDA<br />
Div Yield<br />
ROE<br />
Bloomberg<br />
Company<br />
Cap<br />
(Bt)<br />
Price<br />
Upside<br />
(x)<br />
(x)<br />
(x)<br />
(x) (%) (x)<br />
Code<br />
(US$m)<br />
2 Nov (Bt)<br />
09F<br />
10F<br />
09F<br />
09F<br />
09F<br />
09F<br />
Mid/Large Cap<br />
LH TB Land & Houses 1,696 5.65 6.85 21% 14.3 15.3 2.1 12.6 5.6 15.0<br />
PS TB Preuksa Real Estate 1,028 15.60 16.77 8% 10.9 9.7 2.7 8.3 2.8 27.7<br />
AP TB Asian Property Dev. 391 5.60 8.00 43% 7.7 7.7 1.7 7.0 4.6 23.3<br />
QH TB Quality Houses 635 2.50 2.83 13% 13.0 11.6 1.7 13.1 3.4 13.6<br />
LPN TB L.P.N. Development 309 7.00 7.61 9% 7.4 8.3 2.0 5.6 6.7 28.9<br />
SPALI TB <strong>Supalai</strong> 280 5.45 7.65* 41% 4.1 4.4 1.2 3.8 10.1 37.4<br />
Small Cap<br />
SIRI TB Sansiri 178 4.04 4.29 6% 8.8 6.6 0.7 2.5 4.5 10.7<br />
PF TB Property Perfec 94 4.00 6.20 55% 7.8 4.5 0.5 10.0 4.5 6.1<br />
MK TB M.K. Real Estate Dev. 65 2.50 2.82 13% 4.4 4.9 0.5 3.5 7.2 10.9<br />
LALIN TB Lalin Property 53 2.16 1.94 -10% 8.4 7.5 0.5 7.3 4.7 6.0<br />
NOBLE TB Noble Development 52 3.84 4.85 26% 4.2 4.8 0.5 7.3 7.2 11.5<br />
PRIN TB Prinsiri 59 1.95 2.03 4% 4.8 4.9 0.7 8.1 2.1 15.3<br />
Average 8.0 7.5 1.2 7.4 5.3 17.2<br />
*Fair Value<br />
Source: Company, <strong>DBS</strong> <strong>Vickers</strong><br />
Page 17
Company Focus<br />
<strong>Supalai</strong><br />
Income Statement (Bt<br />
(<br />
m) Balance Sheet (Bt<br />
(<br />
m)<br />
FY Dec 2008A 2009F 2010F 2011F<br />
FY Dec 2008A 2009F 2010F 2011F<br />
Turnover 5,998 8,939 9,768 10,689 Net Fixed Assets 1,352 1,322 1,280 1,238<br />
Cost of Goods Sold (3,647) (5,051) (5,861) (6,414) Invts in Associates & JVs 0 0 0 0<br />
Gross Profit 2,350 3,889 3,907 4,276 Invt & Devt Properties N/A N/A N/A N/A<br />
O<strong>the</strong>r Opng (Exp)/Inc (546) (564) (890) (1,080) O<strong>the</strong>r LT Assets 12 12 12 12<br />
Operating Profit 1,804 3,325 3,017 3,196 Cash & ST Invts 101 112 189 280<br />
O<strong>the</strong>r Non Opg (Exp)/Inc 75 105 105 129 Dev Props held for sale 0 0 0 0<br />
Associates & JV Inc 0 0 0 0 Inventory 11,240 13,471 15,455 17,448<br />
Net Interest (Exp)/Inc (102) (101) (91) (102) Debtors 0 0 0 0<br />
Exceptional Gain/(Loss) 0 0 0 0 O<strong>the</strong>r Current Assets 592 593 593 594<br />
Pre-tax Profit 1,778 3,328 3,031 3,223 Total Assets 13,473 15,686 17,705 19,748<br />
Tax (691) (1,002) (887) (902)<br />
Minority Interest (18) (26) (27) (29) ST Debt 3,542 1,763 1,763 1,763<br />
Preference Dividend 0 0 0 0 O<strong>the</strong>r Current Liab 3,195 4,379 4,773 5,017<br />
Net Profit 1,069 2,300 2,116 2,292 LT Debt 1,441 2,000 2,500 3,000<br />
Net Profit before Except. 1,069 2,300 2,116 2,292 O<strong>the</strong>r LT Liabilities 5 5 5 5<br />
EBITDA 1,955 3,515 3,217 3,430 Shareholder’s Equity 5,031 7,278 8,403 9,703<br />
Minority Interests 260 260 260 260<br />
Sales Gth (%) 25.0 49.0 9.3 9.4 Total Cap. & Liab. 13,473 15,686 17,705 19,748<br />
EBITDA Gth (%) 43.9 79.7 (8.5) 6.6<br />
Opg Profit Gth (%) 51.2 84.2 (9.2) 5.9 Non-Cash Wkg. Capital 8,637 9,685 11,275 13,025<br />
Net Profit Gth (%) 30.9 115.2 (8.0) 8.3 Net Cash/(Debt) (4,882) (3,651) (4,075) (4,483)<br />
Effective Tax Rate (%) 38.9 30.1 29.3 28.0<br />
Cash Flow Statement (Bt<br />
(<br />
m) Rates & Ratio<br />
FY Dec 2008A 2009F 2010F 2011F<br />
FY Dec 2008A 2009F 2010F 2011F<br />
Pre-Tax Profit 1,778 3,328 3,031 3,223 Gross Margins (%) 39.2 43.5 40.0 40.0<br />
Dep. & Amort. 76 86 96 106 Opg Profit Margin (%) 30.1 37.2 30.9 29.9<br />
Tax Paid (691) (1,002) (887) (902) Net Profit Margin (%) 17.8 25.7 21.7 21.4<br />
Assoc. & JV Inc/(loss) 0 0 0 0 ROAE (%) 22.4 37.4 27.0 25.3<br />
Chg in Wkg.Cap. (1,502) (1,138) (1,691) (1,850) ROA (%) 8.9 15.8 12.7 12.2<br />
O<strong>the</strong>r Operating CF 89 18 27 17 ROCE (%) 11.8 21.5 17.6 16.6<br />
Net Operating CF (275) 1,292 575 592 Div Payout Ratio (%) 48.2 41.0 45.0 45.0<br />
Capital Exp.(net) (81) (24) (24) (24) Net Interest Cover (x) 17.8 32.9 33.2 31.2<br />
O<strong>the</strong>r Invts.(net) 1 0 0 0 Asset Turnover (x) 0.5 0.6 0.6 0.6<br />
Invts in Assoc. & JV 0 0 0 0 Debtors Turn (avg days) N/A N/A N/A N/A<br />
Div from Assoc & JV 0 0 0 0 Creditors Turn (avg days) 61.2 57.3 61.9 63.6<br />
O<strong>the</strong>r Investing CF 18 17 17 17 Current Ratio (x) 1.8 2.3 2.5 2.7<br />
Net Investing CF (61) (8) (8) (8) Quick Ratio (x) 0.0 0.0 0.0 0.0<br />
Div Paid (479) (687) (991) (992) Net Debt/Equity (X) 0.9 0.5 0.5 0.4<br />
Chg in Gross Debt 870 (1,219) 500 500 Net Debt/Equity ex MI (X) 1.0 0.5 0.5 0.5<br />
Capital Issues 174 0 0 0 Capex to Debt (%) 1.6 0.6 0.6 0.5<br />
O<strong>the</strong>r Financing CF (280) 634 0 0 Z-Score (X) 2.2 2.2 2.8 2.7<br />
Net Financing CF 285 (1,272) (491) (492) N. Cash/(Debt)PS (Bt) (2.8) (2.1) (2.4) (2.6)<br />
Net Cashflow (51) 12 76 93 Opg CFPS (Bt) 0.8 1.4 1.3 1.4<br />
Free CFPS (Bt) (0.2) 0.7 0.3 0.3<br />
Quarterly / Interim Income Statement (Bt<br />
m) Segmental Breakdown / Key Assumptions<br />
FY Dec<br />
3Q2008<br />
4Q2008<br />
1Q2009<br />
2Q2009<br />
2009 FY Dec 2008A 2009F 2010F 2011F<br />
Turnover 1,297 1,559 2,039 2,502 Revenues (Bt<br />
m)<br />
Cost of Goods Sold (797) (973) (1,134) (1,368) Condominium 3,059 5,560 6,050 6,600<br />
Gross Profit 500 587 904 1,134 Townhouses 900 1,035 1,138 1,252<br />
O<strong>the</strong>r Oper. (Exp)/Inc (130) (128) (124) (144) Detached Houses 2,039 2,345 2,580 2,838<br />
Operating Profit 370 459 780 990 Total 5,998 8,939 9,768 10,689<br />
O<strong>the</strong>r Non Opg (Exp)/Inc 32 35 26 32 Sales Breakdown<br />
Associates & JV Inc 0 0 0 0 Condominium 51% 62% 62% 62%<br />
Net Interest (Exp)/Inc (22) (26) (26) (25) Townhouses 15% 12% 12% 12%<br />
Exceptional Gain/(Loss) (50) 0 0 0 Detached Houses 34% 26% 26% 27%<br />
Pre-tax Profit 330 467 781 998 Total 100% 100% 100% 100%<br />
Tax (116) (262) (235) (300) Sales Growth<br />
Minority Interest (10) 10 (5) (11) Condominium 16% 82% 9% 9%<br />
Net Profit 204 215 541 686 Townhouses 134% 15% 10% 10%<br />
Net profit bef Except. 254 215 541 686 Detached Houses 15% 15% 10% 10%<br />
EBITDA 421 512 826 1,043 Total 25% 49% 9% 9%<br />
Sales Gth (%) (40.0) 20.2 30.7 22.7 Key Assumptions<br />
EBITDA Gth (%) (44.4) 21.6 61.3 26.2 Sales (Btm) 5,998 8,939 9,768 10,689<br />
Opg Profit Gth (%) (48.3) 24.0 70.0 27.0 Sales Growth 25% 49% 9% 9%<br />
Net Profit Gth (%) (57.1) 5.2 151.5 26.9 Gross Margin 39.2% 43.5% 40.0% 40.0%<br />
Gross Margins (%) 38.5 37.6 44.4 45.3 SGA/Sales 8.3% 6.2% 6.0% 5.8%<br />
Opg Profit Margins (%) 28.5 29.4 38.3 39.6 Spec. Tax & Transfer fees 0.8% 0.1% 3.1% 4.3%<br />
Net Profit Margins (%) 15.8 13.8 26.5 27.4 Tax Rate 38.9% 30.1% 29.3% 28.0%<br />
Div. Payout 45% 41% 45% 45%<br />
Source: Company, <strong>DBS</strong> <strong>Vickers</strong><br />
Page 18
Company Focus<br />
<strong>Supalai</strong><br />
<strong>DBS</strong>V recommendations are based an Absolute Total Return* Rating system, defined as follows:<br />
STRONG BUY (>20% total return over <strong>the</strong> next 3 months, with identifiable share price catalysts within this time frame)<br />
BUY (>15% total return over <strong>the</strong> next 12 months for small caps, >10% for large caps)<br />
HOLD (-10 to +15% total return over <strong>the</strong> next 12 months for small caps, -10% to +10% for large caps)<br />
FULLY VALUED (negative total return i.e. > -10% over <strong>the</strong> next 12 months)<br />
SELL (negative ( total return of > -20% over <strong>the</strong> next 3 months, with identifiable catalysts within this time frame)<br />
Share price appreciation + dividends<br />
<strong>DBS</strong> <strong>Vickers</strong> <strong>Research</strong> is available on <strong>the</strong> following electronic platforms: <strong>DBS</strong> <strong>Vickers</strong> (www.dbsvresearch.com); Thomson<br />
(www.thomson.com/financial); Factset (www.factset.com); Reuters (www.rbr.reuters.com); Capital IQ (www.capitaliq.com) and Bloomberg<br />
(<strong>DBS</strong>R GO). For access, please contact your <strong>DBS</strong>V salesperson.<br />
GENERAL DISCLOSURE/DISCLAIMER<br />
This document is published by <strong>DBS</strong> <strong>Vickers</strong> <strong>Securities</strong> (Thailand) Co., Ltd. (“<strong>DBS</strong>VT”), a direct wholly-owned subsidiary of <strong>DBS</strong> <strong>Vickers</strong><br />
<strong>Securities</strong> Holdings Pte Ltd ("<strong>DBS</strong>VH"). [This report is intended for clients of <strong>DBS</strong>V Group only and no part of this document may be (i)<br />
copied, photocopied or duplicated in any form by any means or (ii) redistributed without <strong>the</strong> prior written consent of <strong>DBS</strong>VT.]<br />
The research is based on information obtained from sources believed to be reliable, but we do not make any representation or warranty as<br />
to its accuracy, completeness or correctness. Opinions expressed are subject to change without notice. This document is prepared for<br />
general circulation. Any recommendation contained in this document does not have regard to <strong>the</strong> specific investment objectives, financial<br />
situation and <strong>the</strong> particular needs of any specific addressee. This document is for <strong>the</strong> information of addressees only and is not to be taken<br />
in substitution for <strong>the</strong> exercise of judgement by addressees, who should obtain separate legal or financial advice. <strong>DBS</strong>VT accepts no liability<br />
whatsoever for any direct or consequential loss arising from any use of this document or fur<strong>the</strong>r communication given in relation to this<br />
document. This document is not to be construed as an offer or a solicitation of an offer to buy or sell any securities. <strong>DBS</strong>VH is a whollyowned<br />
subsidiary of <strong>DBS</strong> Bank Ltd. <strong>DBS</strong> Bank Ltd. along with its affiliates and/or persons associated with any of <strong>the</strong>m may from time to<br />
time have interests in <strong>the</strong> securities mentioned in this document. <strong>DBS</strong> <strong>Vickers</strong> <strong>Research</strong> (Singapore) Pte Ltd (“<strong>DBS</strong>VR”), <strong>DBS</strong> <strong>Vickers</strong><br />
<strong>Securities</strong> (Singapore) Pte Ltd (“<strong>DBS</strong>VS”), <strong>DBS</strong> Bank Ltd and <strong>the</strong>ir associates, <strong>the</strong>ir directors, and/or employees may have positions in, and<br />
may effect transactions in securities mentioned herein and may also perform or seek to perform broking, investment banking and o<strong>the</strong>r<br />
banking services for <strong>the</strong>se companies.<br />
The assumptions for commodities in this report are for <strong>the</strong> purpose of forecasting earnings of <strong>the</strong> companies mentioned herein. They are<br />
not to be construed as recommendations to trade in <strong>the</strong> physical commodities or in futures contracts relating to <strong>the</strong> commodities<br />
mentioned in this report.<br />
<strong>DBS</strong> <strong>Vickers</strong> <strong>Securities</strong> (USA) Inc ("<strong>DBS</strong>VUSA”), a U.S.-registered broker-dealer, does not have its own investment banking or research<br />
department, nor has it participated in any investment banking transaction as a manager or co-manager in <strong>the</strong> past twelve months. Any US<br />
persons wishing to obtain fur<strong>the</strong>r information, including any clarification on disclosures in this disclaimer, or to effect a transaction in any<br />
security discussed in this document should contact <strong>DBS</strong>VUSA exclusively.<br />
ANALYST CERTIFICATION<br />
The research analyst primarily responsible for <strong>the</strong> content of this research report, in part or in whole, certifies that <strong>the</strong> views about <strong>the</strong><br />
companies and <strong>the</strong>ir securities expressed in this report accurately reflect his/her personal views. The analyst also certifies that no part of<br />
his/her compensation was, is, or will be, directly, or indirectly, related to specific recommendations or views expressed in this report. As of<br />
3 Nov 2009, <strong>the</strong> analyst and his / her spouse and/or relatives who are financially dependent on <strong>the</strong> analyst, do not hold interests in <strong>the</strong><br />
securities recommended in this report (“interest” includes direct or indirect ownership of securities, directorships and trustee positions).<br />
COMPANY-SPECIFIC / REGULATORY DISCLOSURES<br />
1. <strong>DBS</strong> <strong>Vickers</strong> <strong>Securities</strong> (Thailand) Co., Ltd. and its subsidiaries do not have a proprietary position in <strong>the</strong> mentioned<br />
company as of 2 Nov 2009<br />
2. <strong>DBS</strong>VT, <strong>DBS</strong>VR, <strong>DBS</strong>VS, <strong>DBS</strong> Bank Ltd and/or o<strong>the</strong>r affiliates of <strong>DBS</strong>VUSA, may beneficially own a total of 1% or more of<br />
any class of common equity securities of <strong>the</strong> mentioned company as of 3 Nov 2009.<br />
3. Compensation for investment banking services:<br />
i. <strong>DBS</strong>VT, <strong>DBS</strong>VR, <strong>DBS</strong>VS, <strong>DBS</strong> Bank Ltd and/or o<strong>the</strong>r affiliates of <strong>DBS</strong>VUSA may have received compensation, within<br />
<strong>the</strong> past 12 months, and within <strong>the</strong> next 3 months receive or intends to seek compensation for investment banking<br />
services from SPALI.<br />
ii. <strong>DBS</strong>VUSA does not have its own investment banking or research department, nor has it participated in any<br />
investment banking transaction as a manager or co-manager in <strong>the</strong> past twelve months. Any US persons wishing to<br />
obtain fur<strong>the</strong>r information, including any clarification on disclosures in this disclaimer, or to effect a transaction in<br />
any security discussed in this document should contact <strong>DBS</strong>VUSA exclusively.<br />
Page 19
Company Focus<br />
<strong>Supalai</strong><br />
RESTRICTIONS ON DISTRIBUTION<br />
General<br />
This report is not directed to, or intended for distribution to or use by, any person or entity who is a citizen or<br />
resident of or located in any locality, state, country or o<strong>the</strong>r jurisdiction where such distribution, publication,<br />
availability or use would be contrary to law or regulation.<br />
Australia<br />
Hong Kong<br />
Singapore<br />
United Kingdom<br />
Dubai/<br />
United Arab Emirates<br />
United States<br />
O<strong>the</strong>r jurisdictions<br />
This report is being distributed in Australia by <strong>DBS</strong>VR and <strong>DBS</strong>VS, which are exempted from <strong>the</strong> requirement to<br />
hold an Australian financial services licence under <strong>the</strong> Corporation Act 2001 [“CA] in respect of financial services<br />
provided to <strong>the</strong> recipients. <strong>DBS</strong>VR and <strong>DBS</strong>VS are regulated by <strong>the</strong> Monetary Authority of Singapore [“MAS”]<br />
under <strong>the</strong> laws of Singapore, which differ from Australian laws. Distribution of this report is intended only for<br />
“wholesale investors” within <strong>the</strong> meaning of <strong>the</strong> CA.<br />
This report is being distributed in Hong Kong by <strong>DBS</strong> <strong>Vickers</strong> (Hong Kong) Limited which is licensed and<br />
regulated by <strong>the</strong> Hong Kong <strong>Securities</strong> and Futures Commission.<br />
This report is being distributed in Singapore by <strong>DBS</strong>VR, which holds a Financial Adviser’s licence and is regulated<br />
by <strong>the</strong> MAS. This report may additionally be distributed in Singapore by <strong>DBS</strong>VS (Company Regn. No.<br />
198600294G), which is an Exempt Financial Adviser as defined under <strong>the</strong> Financial Advisers Act. Any research<br />
report produced by a foreign <strong>DBS</strong> <strong>Vickers</strong> entity, analyst or affiliate is distributed in Singapore only to<br />
“Institutional Investors”, “Expert Investors” or “Accredited Investors” as defined in <strong>the</strong> <strong>Securities</strong> and Futures<br />
Act, Chap. 289 of Singapore. Any distribution of research reports published by a foreign-related corporation of<br />
<strong>DBS</strong>VR/<strong>DBS</strong>VS to “Accredited Investors” is provided pursuant to <strong>the</strong> approval by MAS of research distribution<br />
arrangements under Paragraph 11 of <strong>the</strong> First Schedule to <strong>the</strong> FAA.<br />
This report is being distributed in <strong>the</strong> UK by <strong>DBS</strong> <strong>Vickers</strong> <strong>Securities</strong> (UK) Ltd, who is an authorised person in <strong>the</strong><br />
meaning of <strong>the</strong> Financial Services and Markets Act and is regulated by The Financial Services Authority. <strong>Research</strong><br />
distributed in <strong>the</strong> UK is intended only for institutional clients.<br />
This report is being distributed in Dubai/United Arab Emirates by <strong>DBS</strong> Bank Ltd, Dubai (PO Box 506538, 3 rd Floor,<br />
Building 3, Gate Precinct, DIFC, Dubai, United Arab Emirates) and is intended only for clients who meet <strong>the</strong><br />
DFSA regulatory criteria to be a Professional Client. It should not be relied upon by or distributed to Retail<br />
Clients. <strong>DBS</strong> Bank Ltd, Dubai is regulated by <strong>the</strong> Dubai Financial Services Authority.<br />
Nei<strong>the</strong>r this report nor any copy hereof may be taken or distributed into <strong>the</strong> United States or to any U.S. person<br />
except in compliance with any applicable U.S. laws and regulations.<br />
In any o<strong>the</strong>r jurisdictions, except if o<strong>the</strong>rwise restricted by laws or regulations, this report is intended only for<br />
qualified, professional, institutional or sophisticated investors as defined in <strong>the</strong> laws and regulations of such<br />
jurisdictions.<br />
<strong>DBS</strong> <strong>Vickers</strong> <strong>Securities</strong> (Thailand) Co., Ltd. – 989 Siam Tower, 9 th , 14 th -15 th Floor,<br />
Rama 1 Road, Pathumwan, Bangkok Thailand 10330<br />
Tel. 66 2 657 7831, Fax: 66 2 658 1269<br />
Page 20


