GEOTOUR & IRSE 2012.pdf - Fakulta BERG - TUKE
GEOTOUR & IRSE 2012.pdf - Fakulta BERG - TUKE
GEOTOUR & IRSE 2012.pdf - Fakulta BERG - TUKE

Create successful ePaper yourself
Turn your PDF publications into a flip-book with our unique Google optimized e-Paper software.
<strong>GEOTOUR</strong> & <strong>IRSE</strong> 2012<br />
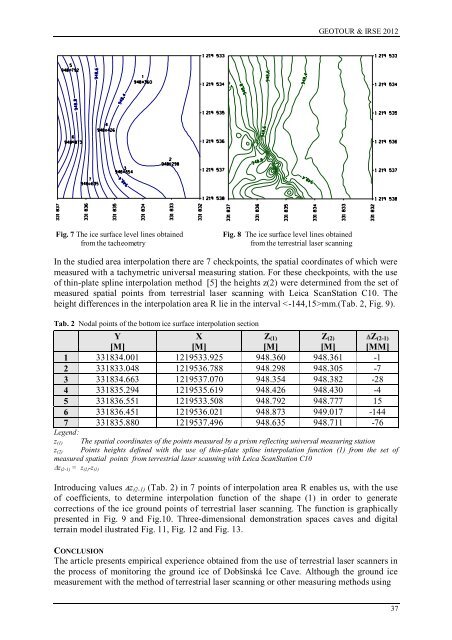
Fig. 7 The ice surface level lines obtained<br />
from the tacheometry<br />
Fig. 8 The ice surface level lines obtained<br />
from the terrestrial laser scanning<br />
In the studied area interpolation there are 7 checkpoints, the spatial coordinates of which were<br />
measured with a tachymetric universal measuring station. For these checkpoints, with the use<br />
of thin-plate spline interpolation method [5] the heights z(2) were determined from the set of<br />
measured spatial points from terrestrial laser scanning with Leica ScanStation C10. The<br />
height differences in the interpolation area R lie in the interval mm.(Tab. 2, Fig. 9).<br />
Tab. 2 Nodal points of the bottom ice surface interpolation section<br />
Y<br />
[M]<br />
X<br />
[M]<br />
Z (1)<br />
[M]<br />
Z (2)<br />
[M]<br />
Z (2-1)<br />
[MM]<br />
1 331834.001 1219533.925 948.360 948.361 -1<br />
2 331833.048 1219536.788 948.298 948.305 -7<br />
3 331834.663 1219537.070 948.354 948.382 -28<br />
4 331835.294 1219535.619 948.426 948.430 -4<br />
5 331836.551 1219533.508 948.792 948.777 15<br />
6 331836.451 1219536.021 948.873 949.017 -144<br />
7 331835.880 1219537.496 948.635 948.711 -76<br />
Legend:<br />
The spatial coordinates of the points measured by a prism reflecting universal measuring station<br />
z (1)<br />
z (2)<br />
Points heights defined with the use of thin-plate spline interpolation function (1) from the set of<br />
measured spatial points from terrestrial laser scanning with Leica ScanStation C10<br />
z (2-1) = z (2) -z (1)<br />
Introducing values z (2-1) (Tab. 2) in 7 points of interpolation area R enables us, with the use<br />
of coefficients, to determine interpolation function of the shape (1) in order to generate<br />
corrections of the ice ground points of terrestrial laser scanning. The function is graphically<br />
presented in Fig. 9 and Fig.10. Three-dimensional demonstration spaces caves and digital<br />
terrain model ilustrated Fig. 11, Fig. 12 and Fig. 13.<br />
CONCLUSION<br />
The article presents empirical experience obtained from the use of terrestrial laser scanners in<br />
the process of monitoring the ground ice of Dobńinská Ice Cave. Although the ground ice<br />
measurement with the method of terrestrial laser scanning or other measuring methods using<br />
37