yy," 1c1~n62 - Central Institute of Brackishwater Aquaculture
yy," 1c1~n62 - Central Institute of Brackishwater Aquaculture
yy," 1c1~n62 - Central Institute of Brackishwater Aquaculture

Create successful ePaper yourself
Turn your PDF publications into a flip-book with our unique Google optimized e-Paper software.
1996<br />
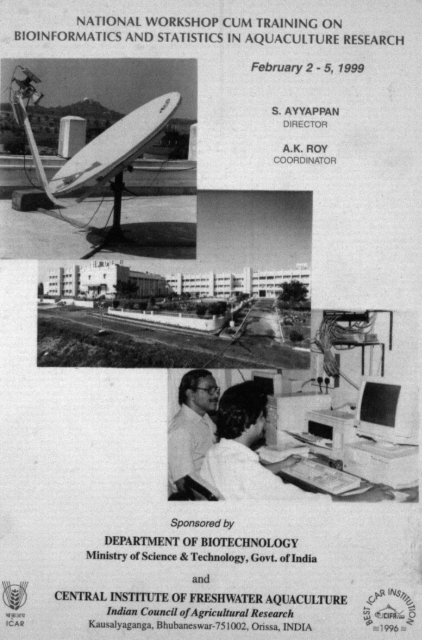
NATIONAL WORKSHOP CUM TRAINING ON<br />
BlOlNFORMATlCS AND STATISTICS IN AQUACULTURE RESEARCH<br />
February 2 - 5. 1<br />
S. AYYAPPAN<br />
DIRECTOR<br />
A.K. ROY<br />
COORDINATOR<br />
I<br />
Sponsored by<br />
DEPARTMENT OF RIOTECHNOLOGY<br />
Ministry <strong>of</strong> Science & Technology, Govt. <strong>of</strong> India<br />
and<br />
-<br />
<strong>yy</strong>,"<br />
I CENTRAL INSTITUTE OF FRESHWATER AQUACULTURE & J INS4 ~<br />
\Sf1 4 r,<br />
Indian Council <strong>of</strong> Agricultural Research<br />
s<br />
Ti 77 1c1~n<br />
!CAP Kauzalyapanga. Bhubanecwar-75 1002, Onsca, lND1A @-
NATIONAL WORKSHOP CUM TRAINING ON<br />
BIOINFORMATICS AND STATISTICS IN<br />
AQUACULTURE RESEARCH<br />
BIOINFOIUMATICS DIVISION<br />
DEPARTMENT OF BIOTECHNOLOGY<br />
Ministry <strong>of</strong>science & Technology<br />
Government <strong>of</strong> India<br />
New Delhi<br />
BIOINFORMATICS CENTRE ON AQUACULTURE<br />
CENTRAL ~NSTIWTE OF FRESHIYATER AQUACULTURE<br />
Indian Council ~~Agricullural Research<br />
Coordinator: A. K. ROY<br />
Director: S.AWAPPAN<br />
CENTRAL lNSTlTUTE OF FRESHWATEIt AQUACULTURE<br />
(Litdian Council <strong>of</strong> Agricultural Rrsearcl~)<br />
Kauulyngrngr, Bhubaatmrr-751002, Oriasa
FOREWORD<br />
Since the adkt <strong>of</strong>modirn science, attempu have been mad to impmve the<br />
speedandefincy <strong>of</strong>scientrfit communication Most <strong>of</strong> th schohrfj infonnatton<br />
howewr, fi<br />
cotltirlued to 6e puGfulied in print, it., in jounlali, 6006, cot$ermce<br />
proceedings etc. Ihc emergence <strong>of</strong> the Internet is radlua$ chattgi~tg the dentratiorr<br />
flow ojutllisation <strong>of</strong>injonnatwngIbbaQ.<br />
Wth the advent <strong>of</strong> information age, major initintives have been taheprc by the<br />
Indian CounciC$~gricuCturalQseanli (Iu@ to modntiee attd6nng information<br />
ntanagement cuCture in aa areas <strong>of</strong>&ncufturaC Qseatcli. '&epittg in view the<br />
06jectives <strong>of</strong>Iu$ CIFJ is aalro engagedin the ttas[<strong>of</strong>modintizing the hardware and<br />
s<strong>of</strong>tuare itutalTations in ordrr to cope with the (ntsst developed<br />
information<br />
technolbgics. Wth tie impkmentation <strong>of</strong>uy cottnectiw'ty, it L possi6l for the<br />
Scientists to share common rtsources f& 'VSJls, Laser Rinters, Statistical%c&ges<br />
andData6a.s~. ata66hrncnt <strong>of</strong>rSwinfomaticJ Centre on JquacuCture at CIFJ 6y<br />
QlotechnoJbBy Ir$onnatwn System (BIIS) <strong>of</strong> Department <strong>of</strong> Qiotechnobgy, Ministry<br />
<strong>of</strong>science andlcchnolbgy, Gwt. <strong>of</strong> India fa h[pedu~ immensely to stretrgtlien our<br />
system which wrlSsun(y boost th 8&D efJoort~ in thfielii <strong>of</strong>fislieries science iir<br />
genera[ and JquacuCture in particuhr. Jpart fmm <strong>of</strong>line Gibfiographic fiterature<br />
search thmllgh WM, the globalinfonnation onfinr highway [nown as internet<br />
can 6e ued6y aascientists with internet connectioru to see adeqlbre thowad <strong>of</strong><br />
cihtabases stored there.<br />
llir prarent worhhop is Lsigned to introduce the participants to the<br />
interesting wodf<strong>of</strong> &ta communication, data6ases, intenlet, muftirnediu, homepage<br />
rkvelbpment, statistical methodolbgics and packages and their application to<br />
aquacuftutz rueanh. lie epenetue aained from this workhop-cum-training<br />
programme, d enabb &nt$cation <strong>of</strong> spec* applications in dizerent<br />
mvironmenu. I tab this opportunity to thankthe participants, organizationr andan<br />
othn WKO haw contn6utcdto this worbhop for itJ success.<br />
S. AWAPPAN<br />
DIRECTOR
Bioirlforntatics Cetrtre, CIFJ expresses its sinceregratitude to Dr. 3. '1(, Jmra,<br />
Jdviser, Departntent <strong>of</strong> Biotechnobgy, Nittistry <strong>of</strong> Science arid kchnology,<br />
Goventmetit <strong>of</strong> I11diu for his coiutant advice andertcouragentent for devebpntent <strong>of</strong><br />
this Bioitlfonnatics Centre otr Pquacufture. Yfea~tful thanb are aGo due to Dr. 1:<br />
%fad7ianmohan, fi~'tic$al Scientijc Offirer, Wl for his continuous touch arid<br />
support for impruuement <strong>of</strong>tfiu centre.<br />
lfie Centre u indebtedto agth resource persou <strong>of</strong>various orgarrisatiorrs fik<br />
CIPW, WD/1, C W , STPI, MC, IGjIU, Cakutta Utriversity, ISI, Ut&d<br />
University, @criiampur Vrriversity, State (Tisheries (Omsa oZ WB), IG%o'L) art6<br />
ClFJ for cotrtriiution andpresentatiolr <strong>of</strong>papers andexchange <strong>of</strong>their vafwGlk tdeas<br />
with the participants to ma@ this "Won$iop-cum-Training programme" a grand<br />
success.<br />
Qioirlfomatics Division, Department <strong>of</strong> Qiotecfirrolbgy, Gover.rrnterrt <strong>of</strong> ltrdi~<br />
is gratefilto Dr. S. &yappan, Director, CIFJ forprmdirrg aa thefacifities to thu<br />
Qioinformatics Centre to qecu:ccutc aa its oi)ectives hid down by Biotechnoby<br />
Infonnatwn System (BIIS) <strong>of</strong>W1; Nw Deffii
Director<br />
Dr. S. A<strong>yy</strong>appan<br />
Coordinatoc<br />
Shri A. K. Roy<br />
Associates:<br />
Shri P. K. Satapathy<br />
Shri D. P. Rath<br />
Shri Ramesh Dash<br />
Cover photo : VSAT inslalled et ro<strong>of</strong> top <strong>of</strong> ClFA
CONTENTS<br />
1. Status <strong>of</strong> Bioinformatics Centre on <strong>Aquaculture</strong><br />
- A. K Roy & S. A<strong>yy</strong>appon<br />
2. Internet and the lntranet<br />
- Manas Patnaik<br />
3. The World Wide Web & Information Searching<br />
- Bikash Panda<br />
4. Internet and die Emerging Networked Society<br />
-A. K Roy<br />
5. Establislinient <strong>of</strong> Local Area Network and Internet under the<br />
ARISNET: A Case Study<br />
- G. R Marulhi Sankar<br />
6. Putting Education Online: A Case Study<br />
-A. R Tl~akur<br />
7. Web Site Design & Hosting<br />
- Bikash Panda<br />
8. Multimedia - a magic mantra<br />
- Jayaram Parida<br />
9. Multimedia - on the Web<br />
- Jayaram Parida<br />
10. World Wide Web, the lnformation Store House<br />
- B. K. Panda, A. K. Nayak, A. KRoy & P. K. Satapatly<br />
I I.<br />
Designing and Planning your Database<br />
- Swya Kumar Parranqvak<br />
12. Database on Fish Disease<br />
- B.B.Sahu. A.KRoy, P.KSaiapafhy, S,C, Mukherjee and S. A<strong>yy</strong>appan<br />
13. Quantitative and Qualitative Fish Production Database<br />
- B.B.Sahu, J.X. Jerta, A. X Roy, & S. A<strong>yy</strong>oppan<br />
14. Database <strong>of</strong> Induced Breeding Experiments on an Indian Major Carp<br />
hbeo rohira (Ham.)<br />
- S.D.Guprcr. A. K. Roy, S.C.hrl~. P. K.Saraporhy<br />
15. The Millennium Bug or the Y2K War<br />
-A. K Roy
STATISTICS<br />
Scopc <strong>of</strong> Applicnlion <strong>of</strong> Statistical Mcthodologies in <strong>Aquaculture</strong><br />
I\escarcl~<br />
A. # Roy<br />
Many Faccs <strong>of</strong> Slatistics<br />
- A!. Nour<br />
I:unda~uentals <strong>of</strong> Sa~npliny and its Application in Fishery Resource 96- 107<br />
Snnlplir~g Tccl~niques Applied in Assessi~lg Inland Fishery Resources I08 - 1 18<br />
and I'roduclion<br />
- H. A. Guplcr<br />
Corrclal~ons and llegressions<br />
-A I! Suryu Roo<br />
011 SOIIIC Slilt~st~cal I'rocedurcs for A~~alysis or Data from Field 128 - 135<br />
Expcrimc~its<br />
- G. R. A4arull1i Sartkar<br />
I:uridanler~tals <strong>of</strong> Design and Analysis <strong>of</strong> Field Experiments with a<br />
Note on l'ransfonnation <strong>of</strong> Data<br />
Rmri R. Sare~rand A. K. Roy<br />
Advo~iced Statistical Methods for Dab Analysis<br />
- R. N. S~~burliri<br />
AII Overvicw <strong>of</strong> Statisticnl Packages<br />
- Ravi It. Snre~to arrd A. K. Roy<br />
EXCEL for Smtistical Data Analysis<br />
- P. K Surnparl~y, A. K. Roy and R Dm11<br />
Ins~ructions for Operating Minitab Statistical Package<br />
- Srabashi Das~r
STATUS OF BIOINFORMATICS CENTRE ON AQUACULTURE<br />
A. K. Roy and S. A<strong>yy</strong>appan<br />
B~oinfonnatics Cenlre<br />
Cenlml lnsblute <strong>of</strong> Freshwaler <strong>Aquaculture</strong><br />
Kausalyaganga. Bhubaneswar<br />
BIOINFORMATICS, STATISTICS AND INFORMATION TECHNOLOGY<br />
The term 'Bioinformatics" refers to the area <strong>of</strong> interaction between the<br />
information technology (IT) and the Life-Sciences including biotechnology. Again IT is a<br />
convergence and integration <strong>of</strong> three main technolog~es taken together viz., Computer.<br />
telecommunication and microelectronics. Further to trace the connection between a<br />
statistics and information technology, ~t is necessary to go back to h~s royal society<br />
address delivered many years ago when famous statistician Maurice Kendall quoted<br />
"Statistics, is indeed, not confusion but fuslon, a sort <strong>of</strong> unified whole, the matr~x <strong>of</strong><br />
quantitative knowledge <strong>of</strong> nearly every kind, the pr~nclpal instrument yet devtsed by<br />
men for brtnging within his grasp the complex~ty <strong>of</strong> things". He elaborated that just as<br />
statistics per se was the totality <strong>of</strong> information, the technology <strong>of</strong> statistics was nothtng<br />
but the totality <strong>of</strong> technology <strong>of</strong> information or information technology. He further rtghtly<br />
pr<strong>of</strong>essed that the era <strong>of</strong> computers would only be heralded by future generattons <strong>of</strong><br />
statisticians. W~th the entire cosmos as one cybernet~c entity, the umly~ng disc~phne <strong>of</strong><br />
statistics and information technology now appears to be a reality Presently, it is<br />
emphasised the need to use the Markov Chain Monte Carlo simulat~on techn~que in<br />
order to improve the quality and reliability <strong>of</strong> computer s<strong>of</strong>tware.<br />
Bioinformatics gained a new dimension when 11 was understood that all the<br />
biological processes depend on genetic information stored as linear codes along<br />
gigantic chain molecules. It provided the structural and functional information on macromolecules<br />
and development <strong>of</strong> mathematical models that illustrate the dynamic<br />
interaction within and between cells. The advantages that will come from finding the<br />
right solutions to the questions posed by the interaction <strong>of</strong> biotechnology and IT are<br />
unlimited. Various activities <strong>of</strong> bioinformatics would be creation <strong>of</strong> databases either<br />
bibliographic or containing properlies and results; access and retrieval <strong>of</strong> information<br />
from databases either on line or <strong>of</strong>f line: analysis <strong>of</strong> information which may be either<br />
empirical model building based on various results <strong>of</strong> experiment or literature surveys<br />
and training. The need for bioinformatics started gett~ng attention due to gradual<br />
realisation <strong>of</strong> the fact that the basic and applied research in the areas <strong>of</strong> Life Sciences<br />
and Biolechnology is becoming increasingly dependent upon an understanding <strong>of</strong> the<br />
Biological processes at the molecular level Moreover it is felt the need for applying<br />
computer based analytical tools to the huge biological data accumulated over the past<br />
and sharing the data among workers and synthesizing information from isolated<br />
literature references. It is well known that a database provides information for surveys,
prevents duplication <strong>of</strong> works, cross veriiy experiments and predicts common<br />
characteristics, and helps writing <strong>of</strong> research papers, project proposals, etc. Due to its<br />
importance, Departrnent <strong>of</strong> Biotechnology started the Biotechnology Informatics<br />
Systems to provide an informatics based national infrastructure in the form <strong>of</strong> a<br />
distributed database and network organisation for harnessing the scientific knowledge<br />
in various interdisciplinary areas <strong>of</strong> biotechnology and its dissemination to scientists<br />
working in RBD organisation. BTlS has been established to serve as a distributed data<br />
base and network organlsation. It is comprised <strong>of</strong> nine specialized distributed<br />
information centre (DIGS) in six identified areas <strong>of</strong> Biotechnology (Genetic engineering.<br />
Animal cell culture and Virology, Plant tissue culture, Cell transformation, Nucleic acid<br />
and protein sequences, Immunology, and Enzyme engineering), nineteen Sub-DlCs for<br />
distribution <strong>of</strong> scientific information across the network. Another 15 Sub-DICs are in the<br />
process <strong>of</strong> establishment located at different national institutes and laboratories. The<br />
principal objectives <strong>of</strong> the DlCs is to function as an information base In each speciality,<br />
to provide a computer based information storage and retrieval system <strong>of</strong> databases, to<br />
provide retrieval service either online or <strong>of</strong>fline, to provide communication I~nk, to<br />
develop s<strong>of</strong>tware packages specific to user needs and to conduct training courses in<br />
the specialised areas for manpower development, to promote awareness about the<br />
computerised storage and retrieval facility among bio-scientists and information<br />
scientists.<br />
DEVELOPMENT AND MAJOR ACHIEVEMENTS OF BTlS ON AQUACULTURE<br />
The Bioinformatics Centre established at <strong>Central</strong> lnstilute <strong>of</strong> Freshwater<br />
<strong>Aquaculture</strong>. Kausalyaganga, Bhubaneswar is a Distributed Information Sub-centre<br />
(Sub-DIC) under Biotechnology Information System (BTIS) Network <strong>of</strong> the Departrnent<br />
<strong>of</strong> Biotechnology, Government <strong>of</strong> India during 1991-92. The centre specialises in the<br />
field <strong>of</strong> aquaculture and serves as an information source in the country.<br />
Infrastructure and physical facilities developed<br />
The BTlS being an informatics based infrastructure required special attention for<br />
right selection <strong>of</strong> computers and communication systems. Procured the following<br />
essential hardwares and s<strong>of</strong>twares and distributed to different Divisions <strong>of</strong> the lnstilute<br />
for use <strong>of</strong> the Scientists and Research workers using LAN connectivity with Server at<br />
BTlS room.<br />
Hardwares :<br />
486 Computers (9 nos.). Pentium (26), Macintosh SE (1). Multimedias (2). 3<br />
KVA UPS (I), Server (I), Dot Matrix Printers (lo), HP Deskjet (15), HP Laserjet (4),<br />
LCD Projection Panel (I), Colour Scanner (2), Fax machine (I), Modem (2) and VSAT<br />
(4).
Wldows 95. UNIX. MS-Office. Novel Netware 4.1, SPAR1. SAS, FOXPRO and<br />
QPRO.<br />
Creation and Procurement <strong>of</strong> Databases, Databank, <strong>Aquaculture</strong> Dlrectoriea, etc.<br />
Databases: Created the following databases related to aquacultural activities covering<br />
statistics, bioinformatics, resources, bibliography, nutrition, pathology,<br />
meteorology, biodata <strong>of</strong> Scientists and other activities related to aquaculture.<br />
a) Database on Freshwater Fishes (Textual)<br />
b) Database on Freshwater Aquatic Plants (Textual)<br />
c) Database on Fish Disease (Textual)<br />
d) Database on Fish Pathology (Bibliographic)<br />
e) Database on Fish Nutrition (-do-)<br />
f) Database on Aquatic Microbiology (-do)<br />
g) Database on Institutions and Companies working in the field <strong>of</strong> fishing<br />
technology and aquaculture (Textual database supplied by FAO)<br />
h) Database on Suppliers and manufacturers <strong>of</strong> fishing technology and aquaculture<br />
equipment (Textual database supplied by FAO)<br />
i) Individual experts in the fields <strong>of</strong> fishing technology and aquaculture (Textual<br />
database supplied by FAO)<br />
j) Personnel Information System (PIS) obtained from /CAR<br />
k) A databank has been created at the centre incorporating the factual figures on<br />
fish production statistics <strong>of</strong> all varieties, species, water area available, etc. for<br />
different states alongwith other 168 items on agricultural products i.e. rice,<br />
wheat, potato, cotton, maize, etc, and Animal Husbandry products i.e. egg.<br />
meat, milk. etc. This has facilitated the supply <strong>of</strong> information to users<br />
besides the information on fisheries.<br />
I) <strong>Aquaculture</strong> Directorlea : <strong>Aquaculture</strong> Directories have been prepared which<br />
cover detailed information on addresses <strong>of</strong> Educational and training<br />
<strong>Institute</strong>s in different countries along with courses, programmes, feed<br />
manufacturers, exporters, address <strong>of</strong> services, consultants on<br />
aquaculture, capture fisheries, fish processing and fisheries information<br />
services for literature on films, videos available in different countries. A<br />
directory covering all universities in India, ICAR, CSIR, Fisheries Directors<br />
and National Research Centres and Project Directors is also available at Ulis<br />
Centre.
m) Acquired CD-ROM on ASFA and CD-ROM on Fish Base for facilitating <strong>of</strong>fline<br />
bibliographic search by the Scientists and Technicians <strong>of</strong> the <strong>Institute</strong>s around<br />
Bhubaneswar and also other ICAR <strong>Institute</strong>s, Universities and Fisheries<br />
Colleges engaged in Research, Training and Teaching activities.<br />
S<strong>of</strong>tware development<br />
More than 35 programs In Fortran 77 and FOXPRO have been developed for<br />
statistical data analysis and information retrieval respectively. Some <strong>of</strong> these are<br />
ANOVA, Probil Analysis, Multivariate analysis, fish growth, length-weight analysis,<br />
Split Plot design, DMRT, Heterogeneity test along with no. <strong>of</strong> statistical test programs.<br />
Programs have also been developed for library management system, paybill, etc.<br />
Network Linkage<br />
The centre has acquired a VSAT for e-mail uploading and downloading.<br />
Micro Earth Station w~th C-200 controller has been installed at ClFA from Nov., 1995<br />
and E-mail facilities both national and international have been provided to the <strong>Institute</strong>.<br />
It has also a MODEM connected through telecom to NICNET to access databases<br />
developed by NIC i e. GIST, RENNIC. SLlPlPPP Connectivity for internet browsing has<br />
been acquired by the centre for online search <strong>of</strong> information.<br />
Library and Office Automation<br />
The library system is under computerisation. CDSIISIS package is used for the<br />
authonuisel titlewiseldiscipiinewise search for entire books available in the librav. This<br />
has facilitated to a great extent for the search on availability <strong>of</strong> library books at the<br />
centre.<br />
Manpower Development through WorkshopITrainingfreaching<br />
Studentship<br />
and <strong>of</strong>fering<br />
The following Workshops and Training programmes were conducted and<br />
studentships <strong>of</strong>fered by the BTlS centre on <strong>Aquaculture</strong> for extending information<br />
related to aquaculture and role <strong>of</strong> information technology (IT) on aquaculture<br />
development using modem tools.<br />
a) National Workshop on Perspectives in Bioinformatics and Its Application<br />
to <strong>Aquaculture</strong> was conducted during February 22-26, 1994.<br />
b) National Workshop on Networking and Biological Data Analysis was<br />
arranged during February 4-6, 1997.<br />
c) National Workshop on Information Technology in <strong>Aquaculture</strong> Research<br />
was arranged during February 10-13, 1998.
d) Students <strong>of</strong> Orissa University <strong>of</strong> Agricultural and Technology are being<br />
regularly trained on the use <strong>of</strong> Computer Application in <strong>Aquaculture</strong><br />
Research in their Master <strong>of</strong> Fisheries Science and Ph. D, courses apart<br />
from periodical training <strong>of</strong> the Scientists <strong>of</strong> CIFA. Teachers.<br />
Researchers <strong>of</strong> Utkal University, ICMR, RRL, Regional College <strong>of</strong><br />
Education as well as workers <strong>of</strong> other lnstitut~ons also avail this facility.<br />
e) Several training programmes were also conducted for staff<br />
members <strong>of</strong> CIFA. The centre has also conducted many training<br />
programmes for <strong>of</strong>ficials <strong>of</strong> State Fisheries, different colleges and<br />
universities <strong>of</strong> Orissa.<br />
f) Regularly students are trained in Bioinformatics <strong>of</strong>fercng studentship<br />
under BTlS project.<br />
lnternational Collaboration<br />
The centre is collaborating with lnternational Development Research<br />
lnformation system (IDRIS) <strong>of</strong> IDRC, Canada for obtaining information on fisheries<br />
activities located in or concerned with developing countries in diskettes which are<br />
updated by them every six months. This centre is selected by the Fishery Advlsory<br />
Services (INTI86/D12) <strong>of</strong> FAOIUNDP, Rome for dissemination <strong>of</strong> information on<br />
fisheries and its allied disciplines through the diskettes prepared by them The centre<br />
has also received CD-ROMs on Fish Base from ICLARM, Philippines, which provide<br />
databases on fisheries, particularly for fishery research workers. Maxims. Ecopath<br />
and Fish growth parameters packages have been collected and are being utilised.<br />
Future Programmes<br />
LAN service will be upgraded, KU Band VSAT is intended to be procured for<br />
best use <strong>of</strong> lnformation Technology in <strong>Aquaculture</strong>. This system will help in providing<br />
electronic bulletin and e-mail to the scientific and technical personnel independently<br />
by using existing VSAT as well as dlal-up MODEM A remote login system is<br />
proposed to be developed lo give an access to all Bioinformatics Centres, ICAR<br />
<strong>Institute</strong>s and other research organisations. This remote login system will help to<br />
share the information generated here amongst research organisations. Creation <strong>of</strong><br />
CD-ROM on databases developed at the centre will be distributed to other research<br />
organisations for <strong>of</strong>f-line search facilities. Attempts will be taken to prepare menudriven<br />
s<strong>of</strong>tware packages for carp culture, prawn culture, catfish culture, pearl<br />
culture, paddy-cum-fish culture, etc. which will guide the entrepreneurs for taking up<br />
the aquaculture independently. Physical, chemical and biological parameters <strong>of</strong> fish<br />
ponds will be monitored from the model to be developed during this period. CDNET<br />
facility will be developed in LAN system lor sharing <strong>of</strong> bibliographic search by<br />
researchers and Scientists <strong>of</strong> the <strong>Institute</strong>. Training course for training researchers in<br />
the field <strong>of</strong> Bioinformatics is being taken every year.
INTERNET AND THE INTRANET<br />
Manas Patnsik<br />
Director,<br />
STPI-Bhubaneswar<br />
So what is the difference between the lntemet and lntranet 7<br />
Mainly the location <strong>of</strong> the infomation and who has access to fi<br />
lnlemet IS public, global and wide open to anyone who has an lntemel connection. The<br />
Internel is a phenomenon, created by the physical connection between thousands <strong>of</strong> prlvate<br />
networks. Like the phone system. the Internet allows instant communication between any<br />
two points on a network, lnstead <strong>of</strong> connecting phones, however, it connects computers.<br />
Instead <strong>of</strong> voice and fax, you are exchanging digital information, including:<br />
Documents<br />
Data<br />
Multimedia (recorded video, audio)<br />
lnlranets are restricted to people who are connected to the private company network. Other<br />
than that, they work esseritlaily the same way. lntranets can help empower their employees<br />
thtouph more timely and less costly information flow This empowerment bolsters a<br />
company's competiliie advantage, through improvement <strong>of</strong> employee morale and asssting<br />
in gelling more timely information to customers and supplien.<br />
Wille 1995 was clearly ttre 'year <strong>of</strong> the Internet'. 1996 is being termed the 'year <strong>of</strong> the<br />
Intranel'.<br />
lritemet technologies llnplemenled internally wer dlentlse~er networks are called Intranets.<br />
lnlranets can operate behind firewalls in conjunction with lnlemet access, or be<br />
implemented exclusively as internal distributed networks over LANs and WANs.<br />
A key fact to undersland is thta the lnlranel can work on any local area network (LAN), but<br />
really provides its greatest power on wide area networks (WAN). All companies began their<br />
network activities using LANs, but the plummeting cost <strong>of</strong> network connections now makes it<br />
increasingly affordable to connect all the far-flung LANs into a single, integrated WAN. Most<br />
network computer applications are geared to the LAN, whereas internet applications were<br />
originally designed to be used wer a WAN. Because <strong>of</strong> this WAN capability, the intranet<br />
makes il possible to connect any user in the company's wide area network to any web site<br />
located on that network. So, for instance, if your company has internal web sites in London,<br />
Singapore, Seanle, and Information from any <strong>of</strong> those sites with equal ease.<br />
lntranets present a less challenging development environment, so that many organisations<br />
preler to lmpiemenl tntranets first, perhaps with a modest, network isolated Internet site.<br />
before a full blown, firewall protected lntemel sile Is contemplated.<br />
Some Key dlfferencss between the lntemet and lntranet are :.<br />
INTERNET<br />
Client toots divene<br />
Browser compliance an issue<br />
. Client connection speeds vafiable.<br />
Users have divene skills sets<br />
Animation. video reslrided.<br />
Mintmat implicalions for work-flow
Can standardize client tools<br />
Bmwser compliance generally not an issue.<br />
Network speed standardised<br />
Users can be trained<br />
Full multimedia <strong>of</strong>len possible<br />
8 Implications for work-flow end process re-englneenng<br />
How can inlranets save time in a corporale environments 7<br />
Wflh corporations under tremendous pressure to empower employees and lo better<br />
leverage internal information resources, inlranets are being seen as the solutions.<br />
A basic intranet can be set up in hours or days and can ultimately serve as an 'Information<br />
hub' for the entire company, its remote <strong>of</strong>fices, parlnen, suppliers and customen.<br />
Key differentiaton that distinguiosh lntranels as the future medium for corporale internal and<br />
external comunications.<br />
Freedom <strong>of</strong> choice<br />
Ease <strong>of</strong> Use<br />
Cost effed'weness<br />
Richness<br />
Powerful tool for sharlng infonnation across networks<br />
Merges documents, data and mult~media<br />
Universal access<br />
Universal interfaces to all file system<br />
Totally in-house. protected from publlc security (i.e IntemeVwww)<br />
How does one authenticale user lo make sure they are who they claim to be<br />
How can one perform authentication without send~ng user names and passwolds across the<br />
network in the clear<br />
How can single user log in services be provided to avo~d costly user name end account<br />
maintenance for all the servers (web. Proxy, directory, mail, news, and so on) across the<br />
enterprise<br />
How can one protect the privacy <strong>of</strong> communication, both lhose in real time (such as the data<br />
flowing between a web client and a web server) and those with store-and-folward<br />
applications such as e-mail<br />
How can one ensure the messages have not been tampered with between the sender and<br />
the recipient<br />
How can one . .eguard wnfidenttal documents to ensure that only authonsed indivlduais<br />
have to awe to them<br />
Today. the, is a single technology that provides the foundallon for soking aH these<br />
challenges: Ctyplography. These standards provide the foundation for a wide variety <strong>of</strong><br />
sewrfty services, including encryp(lon, message integrity veritlcation, authentication and<br />
digiial signatures.<br />
Encryption transforms data into some unreadable form to emre prtvacy. It Is the dlgnal<br />
equivalent <strong>of</strong> a sealed envelope.<br />
7
Decryption is the reverse <strong>of</strong> encryption, it transforms encrypted data back into the<br />
original, intelligible form<br />
Aulhenticat~on idenlines an entity such as an individual, a machine on the network, or an<br />
organlzatlon<br />
Digital signalures blnd a documenl to the possessor <strong>of</strong> a particular key and are the<br />
d~gital equivalent <strong>of</strong> paper signalures<br />
Signature verificalion is the inverse <strong>of</strong> a digital signature. A verifies that a particular<br />
signature is valid.<br />
INTRANET APPLICATIONS IN A CORPORATE ENVIRONMENT<br />
Some common appl~calions are :<br />
Sales and marketing applications<br />
1. Product specificallons, price lids and new collateral<br />
2. Sales Leads<br />
3 Competitive informallon<br />
4. Lists <strong>of</strong> key cuslorners wins, including winlloss analysis<br />
5 Online training rnalerials<br />
8. Sales presenlallons<br />
Product development appllcallons<br />
1 Product spec~ficaltons, destgns, schedule mtieslones, and charges<br />
2 Team member llst~ngs and cespons~bld~es<br />
3 Cuslomer Issues<br />
4 Features <strong>of</strong> key competlt~ve products<br />
Cuslomer service and support applications<br />
1. Share the latest reports on problems so that any team member can respond to<br />
customer calls<br />
2. Get the current information on the status <strong>of</strong> cuslomer's orders<br />
3. Be alerted lrnnlediately lo any important changes such as special <strong>of</strong>fers or issues<br />
4. Traln onllne to respond lo customer queries and complaints<br />
. Human resources appllcal~ons<br />
1. Company mission and goals<br />
2. The annual repod<br />
3. Searchable telephone directories<br />
4. Job poslings and internal job transfer forms<br />
5. Employee development<br />
0. Departmental and personal home pages<br />
7. Classified bulletin boards <strong>of</strong> items for sale, housing etc.<br />
8. Medical referrals<br />
9. Online employee enrollment in specific benefit plans<br />
10. Employee surveys<br />
11. Employee lookup <strong>of</strong> vacalion balances, oplions elc and<br />
12. Ollllrle submission <strong>of</strong> employee status change<br />
FINANCE APPLICATIONS<br />
Wdh inlranel a~~lications. finance de~arlments can disseminate information to key<br />
manages by &curely posting corpoite financial data or by providing simple form:based<br />
query capabilllies. The purchasing site <strong>of</strong> financial operations can also benefn from intranet
OTHER APPLICATIONS<br />
Numerous other corparate departments such as legal or MIS groups currently ustng paper<br />
based forms or polides can reap the benerns <strong>of</strong> making transaction a~Dlicalions available<br />
through intranets<br />
ELECTRONIC MAIL AS A PART OF INTRANET<br />
When a person takes an internet from the ISP (Internet Sewlce Providen) the e-mail<br />
address will be that <strong>of</strong> the ISP. It is like ustng a business center for an <strong>of</strong>fice Say ClFA has<br />
taken service from STPl Bhubaneswar, then their mail address w~ll be ~j~$c&!i..$~D~~c_l.<br />
The above do not present serious options to a corporate organisations.<br />
For its employees to use e-rnail, the corporate can gtve an address like IL!~IIW~~ITJI$S~~<br />
indicating the name <strong>of</strong> the organisation/corporate Cifa as a research organisation in Indta.<br />
SUMMARY<br />
The Internet has not only brought about a technology revolution, but it is also taunchtng a<br />
second revolution in corporate computing The internal use <strong>of</strong> lntemel s<strong>of</strong>tware has become<br />
known as the 'INTRANET. For India, Internet is a great opporlunily. Although currently we<br />
do not have more than 50.000 lntemet conneclion but it has already caught irnaglnatlon <strong>of</strong><br />
the people. The numben <strong>of</strong> usen are estlrnated to be more than 2 lakhs Undoubtedly<br />
Internet has emerged as the largest non-stop talent show lntemet business in India Is likely<br />
to fetch revenue <strong>of</strong> more than Rs 70 billion by theyear 2000 Wflh Its low entry barrier and<br />
high intellectual opportunity, the intrarlet is <strong>of</strong> stgnificance for organisatlons In Ind~a. A<br />
standard part <strong>of</strong> any business internet connection is the firewall, wh~ch keeps internet users<br />
from connecting into the company's private internal network If company has its own<br />
internal web sites on the internet, people on the internet will not be able lo see them without<br />
specla1 access authority.
THE WORLD WIDE WEB 8 INFORMATION SEARCHING<br />
Bikash Panda<br />
HIG-188, Kanan V~har, Bhubaneswar-751031<br />
World Wide Web<br />
The World W~de Web (WWW) is one <strong>of</strong> the most popular client-sewer based<br />
Internet services. In the late 1980's. CERN (the European Lab for Particle Physics)<br />
began experimenting with a service that would allow anyone to easily access and<br />
display documents that were stored on a server anywhere on the Internet. To do this,<br />
they developed a standard format for the documents that enabled them to be easily<br />
displayed by any type <strong>of</strong> display device, and allow links to other documents to be<br />
placed within documents.<br />
Although the WWW was developed for the CERN researches to use, after the<br />
service was made public it became tremendously popular. A number <strong>of</strong> different client<br />
applications (the ones that actually display the documents on-screen were developed to<br />
read WWW documents. There are graphical-based clients (one <strong>of</strong> the most popular <strong>of</strong><br />
these is Netscape), and term~nal-based clients such as Lynx. Most WWW clients also<br />
allow you to use the same interface to access other lnternet services such as FTP and<br />
Gopher.<br />
Accessing WWW<br />
To use WWW you just require lnternet connectivity & preferably a graphical<br />
browser. The most popular browsers are Netscape Navigator. Micros<strong>of</strong>t lnternet<br />
Explorer. If your computer is properly configured to access lnternet using TCPllP<br />
protocol, then you can start browsing the W using your browser application. You<br />
need to know the Web Site address which you desire to view. This Web Site address is<br />
known as URL which stands for Uniform Resource Locator 8 it has the following<br />
syntax.<br />
An example <strong>of</strong> URL is Error! Reference source not found. This means you want to view<br />
an HTML document called default.htm available at the Web Server Error! Reference<br />
source not fouud. using HTTP (Hyper Text Transport Protocol). The name <strong>of</strong> the sewer<br />
is called the Domain Name which is unique worldwide. The Top Level Domain ('in" in<br />
this case) decides what type <strong>of</strong> Server that is. IN means that particular Web Sewer is<br />
an Indian Domain. Every country worldwide had this type two letter country domain.<br />
International domains are three letter ones.
.COM is for Commercial Organisations<br />
.NET is for Networks or lSPs (Internet Service Providers)<br />
.ORG is for Non-commercial orgnisations<br />
.EDU is for Universities or Educational Institutions<br />
.INT is for International Ongaisations<br />
.MIL is for Military Organisations<br />
.GOV is for Government Site<br />
Out <strong>of</strong> these top level domains .edu, .~nt. .mil & gov are only for USA based<br />
organisations.<br />
World Wide Web Authorities<br />
No body owns Internet & hence there is least numbers <strong>of</strong> controll~ng bod~es Thls is<br />
what makes the W so popular & masslve, IANA (Internet Assigned Names<br />
Authority) is the USA based Organisat~on which assigns Umque IP address for Web<br />
InterNlC (Internet Network Information Centre) manages the Domain Name regstration<br />
<strong>of</strong> International domain names. More details can be found at Error! Ilelerence aource<br />
not found. An organisation World Wide Web Consort~um sets the standard <strong>of</strong> WWW 8<br />
HTML tags. Their details can be found at www.w3c.org<br />
Information Searching<br />
Nobody expects you to remember every possible s~te names & browse accordingly.<br />
One has to search the sites which might be hav~ng reference to the Keyword you are<br />
searching. For this purpose special Websites called Search Engines available The<br />
most popular one is www.yahoo.com<br />
The following is a 11st containing various URLs for variety <strong>of</strong> purposes<br />
Search Engines<br />
www.yahoo.com<br />
www.altavista.com<br />
w. hotbot.com<br />
www.infoseek.com<br />
www.khoj.com<br />
Free E-mail Service Providers<br />
www.hotmail.com<br />
www.rocketmail.com<br />
mail.yahoo.com<br />
www.mailcity.com<br />
www.excite.com<br />
www.usa.net<br />
www.lycos.com<br />
www.excite.com<br />
www.search.com<br />
w.webcrawler.com<br />
www.web-search.com<br />
Oniine News Sites<br />
w.times<strong>of</strong>~ndia.com<br />
www.expressindia com<br />
w.sarnachar.com<br />
www.asianage.com<br />
w.aajlak.com<br />
w.hinduonline.com
www.poeox.com<br />
www.letterbox.com<br />
www.juno.com<br />
People Finder Sites<br />
www.four1 l.com<br />
www.whowhere.com<br />
www.alumni.net<br />
w.batchmates.com<br />
Free Web Hosting<br />
www.geocities.com<br />
www.angelfire.com<br />
www.xoom.com<br />
www.forlunecily .corn<br />
www.tripod.com<br />
w.cnn.com<br />
w.hindustantimes.com<br />
w.economictimes.com<br />
Job Providers in Internet<br />
www.naukri.com<br />
w.winjobs.com<br />
w.dice.com<br />
www.careerpath.com<br />
www.bestjobsusa.com<br />
w.ciol.com
INTERNET AND THE EMERGING NETWORKED SOCIETY<br />
A. K. Roy<br />
B~ornforamabcs Centre<br />
<strong>Central</strong> <strong>Institute</strong> <strong>of</strong> Freshwater Aquacuffure<br />
Kausalyaganga, Bhubaneswar - 751002<br />
INTRODUCTION<br />
In the simplest form Internet is the network <strong>of</strong> networks. Internet (known<br />
as Net) is the world's largest computer network. A computer network is generally a<br />
bunch <strong>of</strong> computers hooked together somehow for exchanging ~nforrnalion freely. It<br />
is a new communicatton technology that is affecting our llves on a scale as slgnlficant<br />
as the telephone and television. It is a worldwide computer network connecting nearly<br />
5 million computers around the world. There is no censorship. Probably that is one <strong>of</strong><br />
the reasons <strong>of</strong> its popularity and exponential growth.<br />
COMPUTER NETWORK<br />
Computer networking refers to a method is which the computer systems are<br />
connected together is such a way that they can exchange informallon among<br />
themselves. They can be connected by wires, phone lines, satell~te llnks or any<br />
combination <strong>of</strong> these. Each computer network has a host computer, known as<br />
server, which controls the complete network. If networking is done in the same<br />
bullding or in small area, it is known as Local Area Network (LAN), if the computers<br />
are spread over the metropolltan Area then it IS known as Metropolltan Area<br />
Network (MAN). When the computers are spread over larger area, the network is<br />
called Wide Area Network (WAN). Networking IS done for sharing resources like<br />
printers, hard disc drive and s<strong>of</strong>tware<br />
SOME INDIAN NETWORKS<br />
NICNET, ERNET, INDONET, METNET, PRESS NETWORK, OILCOMNET. SIRNET,<br />
AIRLINE NETWORK, INFLIBNET.<br />
WHO USES INTERNET 7<br />
Once closely guarded by sc~entlsts and technocrats, today the lnlernet IS open<br />
to researchers, students, parents, poltce, buslnessrnen, world leaders, executives,<br />
sport fans, shoppers and terror~sts Internet is the largest and most complete<br />
learning tool for groups <strong>of</strong> people with varied educational backgrounds and<br />
interests.
SUBJECTS COVERED BY INTERNET<br />
lnternet covers almost all the subjects imaginable. Some <strong>of</strong> which are Arts<br />
and Culture, Books and literature, Business and Career, Computers and<br />
S<strong>of</strong>tware, Education and Teaching tools, Environment and Nature, Food and<br />
Cooking, Games and Sports, Government and Politics, Health and Nutrition,<br />
History, Household and Consumer finance, Humor, International affair, Language<br />
and Linguistics, Law, Movies and video tapes. Music, Religion and new age, Science<br />
and Technology, Space and Astronomy, Shopping. Sports, Recreation and Hobbies,<br />
Television, Travel and Geography and many more.<br />
LENGTH AND BREADTH OF INTERNET<br />
The information available on the internet has been indexed. If one reads<br />
only index pages at the rate <strong>of</strong> 100 pages daily, it will take 4 years to read the<br />
complete index only wh~ch is equivalent to 1,46,000 page. As per the latest report<br />
available, there are 2.2 million current users <strong>of</strong> internet and every month 1,50,000 new<br />
users are joining it. The internet has 40,000 host computers also known as web sites.<br />
It is estimated that by 2000, there will be 100 million users and 1 million hosts on the<br />
internet.<br />
NAVIGATIONAL TOOLS OF INTERNET<br />
The following are the navigational tools <strong>of</strong> internet:<br />
E-mail (electronic mail), File Transfer Protocol (FTP), Telnet Gopher, World<br />
Wide Web (Mosaic), Finger, Usenet, Mailing Lists (Listservers, Viewers, Archives,<br />
Encoding, Lynx, lnternet Relay Chat (IRC), Wais, Veronica, Bulletin Board System<br />
(BBS) and Free Nets.<br />
VARIOUS APPLICATIONS OF INTERNET<br />
lnternet has given access to an enormous amount <strong>of</strong> information. This<br />
information can be accessed and used from any comer <strong>of</strong> the world and knowledge <strong>of</strong><br />
access tools is necessary to make maximum use <strong>of</strong> interenl. In India and all over the<br />
world the lnternet is being used for wide variety <strong>of</strong> purposes, only few are mentioned<br />
below.<br />
ELECTRONIC PAPERSIJOURNALSINEWSLETTER<br />
Newspapen and magazines are available on the Internet. Recently many<br />
Indian News papers have been introduced on the Interent. Many International<br />
Scientific Journals are available in the Internet.
MATRIMONIAL ALLIANCES<br />
Matrimonial alliances are being done through lnternet for which some<br />
companies have started matrimonial service site.<br />
PATIENT CARE SUPPORT<br />
lnternet is a continuously updated database for providing patlent care<br />
support and serves as a d~stant learning facility for student physicians. On-line<br />
medical journals, through which the latest research and development in the field IS<br />
known.<br />
INTERNET PHONE<br />
One can now-a-days place calls over the lnternet to standard phones or PC's<br />
running Vocal Tee lnternet S<strong>of</strong>tware along with placing calls via the internet. It<br />
gives lnternet users a vocal two-way communication facility. This lnternet phoning<br />
is now as simple as E-mailing or traditional phoning. The rate is lower than STDllSD<br />
calls.<br />
NET VARSITY<br />
Another Interesting thing is that recently NllT has establ~shed an on-line<br />
learning fac~lity on the Internet by the name <strong>of</strong> 'Net Vars~ty' based on the<br />
conventional model <strong>of</strong> a university. According to NIIT, the NllT varsity has all the<br />
features <strong>of</strong> an institution <strong>of</strong> higher learning including registration procedure,<br />
testing and certification. Other features include a library where the vast<br />
resources <strong>of</strong> the internet have been summarised, a student querylng service to<br />
<strong>of</strong>fer tutor support to students, a student advisory service to provide counseling on<br />
learning opportunities and a placement assistance service The students will be<br />
eligible for certification for the education they get at the 'Net Vars~ty'.<br />
POSITIVE USE IN INDIA<br />
Government organizations l~ke CSIR, ICAR have set up Websile on the lnternet<br />
which gives information about their objectives, activ~ties and also about various<br />
labcratories. Department <strong>of</strong> Science and Technology Website informs about<br />
National Resources available for Science and Technology. NIC has a wealth <strong>of</strong><br />
information on its Website.
DARKER SIDE OF INTERNET<br />
Due to the scope <strong>of</strong> unhindered use on uncensored subjects, it is being<br />
mlsused also in areas like pornography, nefar~ous and subversive activities by<br />
unscrupulous criminals breaking the database <strong>of</strong> banks, confidential records <strong>of</strong><br />
defence establishments and secrets commercial rivals. Recently, there appeared<br />
news about the credit card fraud that hits the internet by school boy hackers. This<br />
computer scam fuels fears about shopping on the web. These are darker sides <strong>of</strong><br />
internet which can not be ignored.<br />
A NETWORKED SOCIETY (NS)<br />
Communication technology is based on computers is computer mediated<br />
communication (CMC) which encompasses e-mail, virtual reality and computer game<br />
etc, Internet is a new way <strong>of</strong> using space and time. CMC provides a space - the<br />
cyberspace, within which forms a new society known as Networked Society (NS) or<br />
Cyber Society.<br />
Impact <strong>of</strong> Networked Society (NS) on the culture <strong>of</strong> people all over the world :<br />
1. W~th network spanning all over the world the convert <strong>of</strong> borderless nations is<br />
likely to be a reality.<br />
2. In the NS, the houses are likely to be the activity centre, not the <strong>of</strong>fice<br />
3. Less travel society if not a travel-less society<br />
4. Physical location may become irrelevant for develop~ng and receiving services<br />
5. Radical change in workculture due to flexi hours <strong>of</strong> working coupled with<br />
innovative management <strong>of</strong> resources and manpower resulting in enhanced<br />
productivity.<br />
G. Home centred act~vities would lead lo better creativity, innovation and<br />
product~vity.<br />
7. Telecommunication culture w~t home curbed activities would ultimately lead to<br />
home centred economy.<br />
8. Present society is characterised by community formation based on work<br />
centres. In a home centred environement, the communities will comprise <strong>of</strong><br />
groups from among people pursuing different works and pr<strong>of</strong>essions in life. A<br />
true social community is likely to emerge.<br />
9. The concept <strong>of</strong> association may vanish because in a networked society , small<br />
community dwellings which are self contained would emerge.
10. A networked society (NS) can be characterised by (anyone, anytime,<br />
anywhere, any information and any format )<br />
11. A full-fledged NS implies that every human being on the earth has an access to<br />
network which is considered essential like elctricty and water.<br />
12. A poorest person from villages will have access to information resources in the<br />
richest in the cities.<br />
13. W~th round the clock operation <strong>of</strong> Newtwork infrastructions, tlme and holiday<br />
patterns may be irrelevant in the lifestyle <strong>of</strong> people.<br />
14. There communication technologies will play complementary roles There are<br />
optical fibres, sattelttes and short-wave radio which will provide bandwidth.<br />
qu~ck remote area connectivity and excellent last mile link respectively.<br />
15. Network computers and multimedia personal computers w~ll emerge.<br />
16. Virtual reallty is considered as the ultimate evaluation <strong>of</strong> a networked society<br />
17. An NS would emerge as the <strong>Central</strong> theme <strong>of</strong> llvlng wlth the societies trade<br />
economy, occupation, development, education culture and leisure all centred<br />
around networking.<br />
CONCLUSION<br />
Computer network~ng IS perhaps one <strong>of</strong> the most rmportant m~lestones In<br />
the rnnovat~ve creations using lnformat~on Technology (IT) and an even blgger<br />
phenomenon IS the lnternet lnternet has brought computer network~ng to an<br />
unprecedented frontler and can be described as the biggest IT event In computer<br />
and commun~cat~on technology In sclenllfic and research communlly, Internet IS an<br />
essent~al and ~nd~spensable tool Through Internet, sc~ent~sts can yaln Instant<br />
access to the world's most advanced research facilities and discuss the~research<br />
problems w~th others worklng In the same fleld They may be benefitted most through<br />
proper use <strong>of</strong> lnternet fac~llt~es after gainlng basic Ideas about the lnternet its<br />
navlgat~onal tools and servlces available as dfscussed above Never before such<br />
freedom <strong>of</strong> thought and expression have been posslble for ordlnary and not so<br />
ord~nary people allke At thls moment ~t IS very d~ff~cult to comprehend the<br />
consequences <strong>of</strong> the newly formed Cyber or Networked Soc~e~ty
ESTABLISHMENT OF LOCAL AREA NETWORK AND INTERNET UNDER<br />
THE ARISNET: A CASE STUDY<br />
G. R. Maruthl Sankar<br />
Contra! Research <strong>Institute</strong> lor Dryland Agricullura (ICAR)<br />
Sanloshnagar, Hydembad - 500 059<br />
1. Establishmant <strong>of</strong> NICNET at CRlDA<br />
During 1994-95, ICAR has made it compulsory for all ~nstitutes to establish<br />
Nal~onal Informatics Centre's Network (NICNET) for E-mail transmission through a<br />
MODEM and a dial-up telephone through Public Swltched Telephone Network (PSTN)<br />
connected to a Computer. Accordingly, CRlDA has established its NICNET services.<br />
Tlie services included transmission and downloading <strong>of</strong> E-mail messages through a<br />
low speed Multi-Tech MODEM and a PSTN through National :nformatics Centre (NIC),<br />
Hyderabad and further linkage to NIC, New Delhi through the Indian Satellite. The<br />
transmission <strong>of</strong> text was usually in the form <strong>of</strong> ASCII files through the PROCOMM<br />
s<strong>of</strong>tware used for communication after getting connected to the VAX system at NIC,<br />
New Delhi. The protocol that was provided by NIC for all ICAR institutes was that <strong>of</strong><br />
Simple Mail Transfer Protocol (SMTP) using which exchange <strong>of</strong> simple electronic mails<br />
can be exchanged. CRlDA has been provided with an E-mail address through X-400<br />
services <strong>of</strong> NIC, New Delhi as CRIDA@ X400. NICGW. NIC. IN for using the SMTP<br />
for exchange <strong>of</strong> information. Transmission <strong>of</strong> either non-ASCII text, graphics I images<br />
or use <strong>of</strong> any advanced s<strong>of</strong>tware (Windows based) including the data except binary<br />
attachment was not possible due to the limitations <strong>of</strong> the PROCOMM s<strong>of</strong>tware and also<br />
the protocol that was provided to the ICAR institutes. Further, the network was slow and<br />
problematic due lo the low speed <strong>of</strong> MODEM (1.2 Kilo bauds per second) being set by<br />
the NIC, New Delhi for all ICAR inst~tutes and the transmission errors in the satellite<br />
communication through the unreliable PSTN, apart from the problems In functioning <strong>of</strong><br />
a telephone linkage. In spite <strong>of</strong> the different problems, messages have been transmitted<br />
and received periodically.<br />
2. Establishment <strong>of</strong> ARISNET at CRlDA<br />
During 1995-96, ICAR has made it mandatory for establishment <strong>of</strong> Agricultural<br />
Research Information System Network (ARISNET) at all ICAR institutes and augment<br />
the services <strong>of</strong> NICNET for exchange <strong>of</strong> agricultural research information, data and<br />
reports and various other kinds <strong>of</strong> information through the network. ICAR has supplied<br />
different hardware and s<strong>of</strong>tware to all institutes for ARISNET establishment. Under<br />
ARIS.NET program, each institute was asked to establish a Local Area Network (LAN)<br />
through any <strong>of</strong> the three types <strong>of</strong> cabling viz., BNC, UTP or Fiber Optic cabling that<br />
suits the institute depending on the location, size and other requirements <strong>of</strong> the<br />
institute.
Accordingly. CRIDA has established its Local Area Network (LAN) under<br />
ARISNET during 1996-97. The network cabling for different rooms (54 nodal points)<br />
was done by the Electronics corporation <strong>of</strong> India Limited (ECIL), Hyderabad. The<br />
cabling has been done with the features <strong>of</strong> STAR Topology i.e., the Untwisted pair<br />
(UTP CAT-5) cables are connected from the ARISNET Server room to the different<br />
rooms through three 16-port HUBS (2 Bee-Line and 1 D-Link Hubs) which are located<br />
at three different places in the institute. CRIDA has been prov~ded with a SUN-<br />
SPARC UNlX Server (ICIM-Fujitsu make) and a Meteor LAN Server (HCL-HP make).<br />
While the UNlX server is a 8-node capacity Server, the LAN Setver is a 32-node<br />
capacity Server. While the UNlX Server was installed by ICIM-Fuj~tsu. Hyderabad the<br />
LAN Server and the three Workstations provided by ICAR have been itistalled by the<br />
HCL-HP, Secunderabad. The existtng NICNET has been merged w~th ARISNET. The<br />
NIC, Hyderabad has installed a htgh-speed Motorola MODEM (with a speed <strong>of</strong> 19.2<br />
Kilo bauds per second) for transmission and downloading <strong>of</strong> E-mail and other type <strong>of</strong><br />
files and has connected it to the ARlS Workstation-l through a telephone cable under<br />
PSTN. Apart from the three ARlS Workstations provided by ICAR, 9 computers<br />
(nodes) from different rooms have been connected to the LAN Server The equ~pment<br />
supplied by ICAR are thus being used for day-to-day work with different s<strong>of</strong>tware like<br />
Micros<strong>of</strong>t Office (WORD, EXCEL. POWERPOINT and ACCESS), Micros<strong>of</strong>t Visual C++<br />
and other licensed s<strong>of</strong>tware <strong>of</strong> the inst~tute.<br />
3. Establishment <strong>of</strong> VSATI Earth Station at CRIDA<br />
In view <strong>of</strong> advancements in computer hardware and s<strong>of</strong>tware, and<br />
improvements in the Satellite communication and a revolution in the Information<br />
Technology all over the world during the last two years, ICAR has procured the latest<br />
Ku-Band Very Small Aperture Terminal (VSAT) from NIC. New Delhi and prov~ded them<br />
to a few selected institutes. The VSATs procured by ICAR are Frequency Time Division<br />
Multiple Access (FTDMA) VSATs, which have a very high downioad~ng and<br />
transmission speeds viz., 32 Kilo bauds per second (for transmission) and 256 Ktlo<br />
bauds per second (for downloading). They are very small, compact, less problemalic,<br />
less costly and highly efficient, easy to handle and have high speeds in cornmunical~on.<br />
They have many advantages when compared to the existing C-Band and S-Band<br />
VSATS <strong>of</strong> NIC in all features for satellite communication. CRlDA has been provided<br />
with a Ku-Band FTDMA VSAT. The Earth Station <strong>of</strong> CRIDA was developed and the<br />
VSAT has been successfully installed. The VSAT Earth Station <strong>of</strong> the <strong>Institute</strong> in<br />
Hyderabad is linked to the Master Earth Station <strong>of</strong> NIC at New Delhi through the Indian<br />
Satellite and will be catching signals uninterruptedly w~thout any error and are ut~lised<br />
for further processing. The VSAT has two units viz., an Out-Door Unit (ODU) and an In-<br />
Door Unit (IDU). The NIC has connected the ARlS Workstation - I to the IDU through<br />
UTP CAT-5 Cable. The IDU in turn is connected to the ODU <strong>of</strong> the VSAT Earth Statlon<br />
Ulrough enor-free UTP cables. The NIC, New Delhi has provided two dedicated IPaddresses<br />
(164.100.255.13 and 164.100.255.14) to the institute viz., one to the VSAT
(164.100.255.13) and the other to the ARlS Workstation - 1 (164.100.255.14). This is a<br />
statutory requirement for provision <strong>of</strong> INTERNET to an user by linkage to the Indian<br />
Satellite through a VSAT for direct communication with mill~ons <strong>of</strong> users on the World<br />
Wide Web (WWW). The ARIS workstation - I has been configured with the<br />
Transmission Control Protocol I Internet Protocol (TCP I IP) and the INTERNET has<br />
been provided to CRIDA by NIC, New Delhi. This Workstation has WINDOWS-95 as<br />
the restding Operating System (0s) and Net Scape Navigator Gold (3.1 Version) for<br />
browslng different Web sites on the INTERNET. Thus CRIDA has been provided with<br />
INTERNET facility for accessmg and browsing the WWW and downloading all relevant<br />
rnformation for furiher advancement in dryland research. Ever since the FTDMA Ku-<br />
Band VSAT has been rnstalled and INTERNET being provided to CRIDA, Scientists at<br />
the institute are making an efficient use <strong>of</strong> the INTERNET facility for direct transmission<br />
and downloading <strong>of</strong> E-mails, text and data files, graphics and images, browsing the<br />
W and visiting different Web sites for obtaining relevant information The<br />
information is oblained by vlsiting different Hyper Text Transmission Protocol (HTTP)<br />
addresses and making use <strong>of</strong> powerful search engines like YAHOO, ACTA VISTA.<br />
WEB CRAWLER, NET SEARCH and others that are available in the INTERNET. Most<br />
<strong>of</strong> Web ales can also be reached and the relevant Information that 1s requlred can be<br />
downloaded directly through the Hyper Text Marker Language (HTML) and JAVA<br />
s<strong>of</strong>tware with proper protocols that are ava~lable in INTERNET. The NIC has provided a<br />
dedtcated INTERNET address viz.. CRIDA@AP. NIC IN to the institute for interaction<br />
with mtlllons <strong>of</strong> users on the INTERNET. The institute has been provided with a facillty<br />
for interacting with the Post Office Protocol (POP3) Sewer <strong>of</strong> NIC for exchange <strong>of</strong> mails<br />
through INTERNET drrectly. It is observed that the E-mails are transmitted and received<br />
with out any technical problem and in a quick lime through the INTERNET unlike the<br />
erstwhile PSTN through a Dial-up and a low speed MODEM. Apart from the Netscape<br />
Navigator Gold, Eudora Light and Alexa s<strong>of</strong>tware are also used for exchanging E-mall<br />
and other information through POP3 facility provided by NIC, New Delhi.<br />
4. Establishment <strong>of</strong> INTRANET and INTERNET through LAN<br />
The ICAR has provided Novell Netware Version 4.10 which does not have<br />
INTRANET and INTERNET facililies. Hence it is not possible to get INTERNET facility<br />
for all nodes in the LAN through the existing Novell Netware s<strong>of</strong>tware (Version 4.10)<br />
without dedicated IP-addresses. The ultimate requirement <strong>of</strong> establishment <strong>of</strong><br />
INTRANET and accession <strong>of</strong> INTERNET on different nodes <strong>of</strong> users in CRIDA has<br />
been established by installing a Windows-NT server as an INTERNET sewer for<br />
different users through LAN. The users are able to browse INTERNET through PROXY<br />
server s<strong>of</strong>tware and getting connected to the Windows-NT server. 25 Pentium systems<br />
localed In different rooms have been linked to the UNlX and Wrndows-NT servers for E-<br />
mail and INTERNET respectively. A dedicated Switch and 3 Hubs are used for<br />
connecting the users lo the servers. The UNlX and Windows-T servers are connected<br />
to the FTDMA Ku-Band VSAT for satellite communication and INTERNET browsing
The NIC has recently improved the bandwidth <strong>of</strong> VSAT and many users are able to<br />
access E-mail and INTERNET with out any difficulty. CRlDA has been making the best<br />
use <strong>of</strong> the INTERNET facility for research and development in different acttv~ttes, and<br />
thus making full use <strong>of</strong> the hardware and s<strong>of</strong>tware.<br />
5. Role <strong>of</strong> VSAT In satellite communication<br />
Reliance on traditional ways <strong>of</strong> doing buslness like personal meetings, signed<br />
papers, and communication through normal terrestrial (telephone) lines is fast<br />
being replaced by wireless technologies like the VSATs<br />
About 6000 VSATs have been tnstalled in the country from 1995 onwards<br />
VSAT is a dish antenna along with integrated untts ~nstalled between 2 or more<br />
user locations They relay communicat~on signals between 2 locations through a<br />
satellite. They are suitable and ideal alternative to terrestrial communication<br />
Ilnes. Like terrestrial Ilnes, VSATs also rely on pipes which are Invisible in the<br />
sky which allow information to flow back and forth<br />
VSATs allow establishment <strong>of</strong> dependable links to sites where conventional<br />
telecom infrastructure is poor or non-existent Thts is useful for organizat~ons<br />
whtch have operations In reniote areas. They can easily be setup even in<br />
remote areas owing to their compact size, ruggedness and ease <strong>of</strong> tnstallation<br />
VSATs <strong>of</strong>fer cheaper and cost effective means lo communicate as compared to<br />
land I~nes. The cost <strong>of</strong> a VSAT operation IS dlstance independent<br />
VSATs transmlt high volumes <strong>of</strong> voice, data and video any where In the country<br />
and also in the entire world. Corporate8 and different organizat~ons are trylng to<br />
march further by deploy~ng VSATs for commun~cation In India there are at least<br />
8 VSAT service providers competing in the market VSAT termtnal consists <strong>of</strong> 3<br />
elements A dish shaped antenna ranging In slze from 1.2 m - 3.8 m Outdoor<br />
unit mounted on the antenna for signal reception and transm1ssion7 Indoor un~t<br />
which connects to computer, telephone and customer equipment<br />
VSATs help companies in avoiding long delays involved In deployment <strong>of</strong><br />
conventional teased Lines provided by DOT<br />
VSAT terminal transmits a radio signal to satellite. Radio s~gnal carries data,<br />
voice or images The satellite has a transponder whtch recetves the signal,<br />
amplifies it and sends it back to the receiver<br />
VSAT terminal operates In conjunctton with a large aperture hub earth station.<br />
This hub is installed and operated by a VSAT service provtder The hub directs<br />
the signals to and fro between satellite & communicating VSATs besides<br />
managing data transmission between them Advantages <strong>of</strong> VSATs
Independent <strong>of</strong> terrestrial infrastructure : Leased line networks from DOT do not<br />
normally service locations other than major cities and also line availability issues<br />
necessitates a lead time <strong>of</strong> 6 to 8 months. VSATs are deployed irrespective <strong>of</strong><br />
these problems<br />
Distance independent costs: Cost <strong>of</strong> VSAT network and cost <strong>of</strong> data<br />
transmission are independent <strong>of</strong> distances and country specific tariff.<br />
Operational costs are lower as compared to leased lines<br />
High reliability : VSATs <strong>of</strong>fer 99.5 % uptime when compared to at best 95 %<br />
<strong>of</strong>fered by terrestrial lines due to very few or negligible polnt failures. They <strong>of</strong>fer<br />
cross border connecl~vily as well. They are also useful for business houses that<br />
operate globally<br />
Easy scalability : Wlth ava~lable network, new sites can be commissioned rapidly<br />
with relatcvely l~ttle effort. Increased requirements <strong>of</strong> voice, data or video<br />
transmission from existing sites can also be met comfortably, with out a delay,<br />
from a central management system<br />
VSATs <strong>of</strong>fer a ro<strong>of</strong>top to ro<strong>of</strong>top connectivity. Terrestrial back haul lines are not<br />
required. Thus there will no problems like in land lines<br />
Organizations that matched their network needs to right VSAT provider infer that<br />
VSAT services deliver connectivity that conventional network solutions cannot<br />
just match<br />
VSATs can be used across industries : VSATs provide cost effective solutions<br />
and meet all communication needs ranging from on line banking, ATMs,<br />
manufacluring, movement <strong>of</strong> relocation <strong>of</strong> orders to factories, online<br />
reservations on airlines, railways, hotels etc., These are also used in courier<br />
companies, RBD, financial institutions, publishing houses, television channels,<br />
stock broking, heavy engineering, consumer durables etc.,<br />
Many organizations like Pepsi, Compaq, Citibank, Hong Kong Bank, Unilevers,<br />
Mahindra Ford, Procter and Gamble, Kelloggs, Nicholas Piramal and others<br />
have reaped the benefits <strong>of</strong> installing VSATs in their respective industries.<br />
Benefits have ranged from shorter order processing items, fewer stock outs,<br />
more control to savings in their operational costs Will VSATs save money <br />
* Yes. Voice communication is 75 minutes per site per day. Each site sends on an<br />
average 30 A4 sized faxes per day. Data transfer is 2 MB per site per day.<br />
Working days per year =3D 300<br />
If a company goes for a 9.6 Kbps link, using DAMA technology with a cost <strong>of</strong><br />
11.5 lakhs per VSAT. The total capital investment <strong>of</strong> 46 lakhs is amortized over
5 years. The AMC is at least 10 % <strong>of</strong> capital cost and license fees to<br />
government are Rs.55.100 I- per VSAT<br />
' DOT charges Rs.43- per minute for voice, fax and data communicalion<br />
whereas VSAT service provider has <strong>of</strong>fered a rate <strong>of</strong> rate <strong>of</strong> Rs.201- per minute<br />
for dial-up connection (V-Dial. Dama service from Telstra V-Comm)<br />
Not taking depreciation into account, a company would save Rs.28.90,0001-<br />
(42%) every year <strong>of</strong> its annual communication bill. ARer providing deprecialion,<br />
pay back period for capital investment would be 2 to 3 years<br />
Invisible savings like guaranteed uptimes (99.5 %) and greater connectivity.<br />
Better voice quality, more reliable faxes and data transfers and options <strong>of</strong><br />
teleconferenc~ng, E-mails wh~ch reduce the need for repeated communication<br />
Better service & commercial terms <strong>of</strong>fered by service provider lower the unit<br />
cost for higher usage. Videoconferencing could easily reduce cost <strong>of</strong> travel for<br />
review meetings, training programmes and annual planning processes<br />
Faster flow <strong>of</strong> critical communication (stock outs, dispatches, production<br />
schedules) would ensure an increase in business<br />
* For organizations which operate multiple locations or have higher<br />
communication needs, savings in operating expenses will be incredibly higher.<br />
For locations which need only tlata communicstions, the TDMA VSAT<br />
technology would serve the process at only 40% <strong>of</strong> the cost <strong>of</strong> DAMA VSAT or<br />
less, thereby ensuring that break even point is reached even earlier. How lo<br />
decide on a service provider 7<br />
Look for a service and a solutions approach. Reject mere equipment vendors<br />
Be sensitive to transparency in billing systems and itemwise location-wise<br />
billing. Some service providers typically operate by quoting low prices. They<br />
would make their money in annual service charges all at customer's expnee<br />
Look for a one stop , shop. . A service provider who performs activities starting<br />
from consultancy to network design, equipment supply, network implementatio"<br />
and even network management. You are better focusing on your core strengths,<br />
not running after an area-that you may no1 have expertise<br />
Ask for performance guarantees & other customer-friendly features such as 24<br />
hour help lines, trained man power, previous records etc., Look for a service<br />
provider who is moving with technology, with world wide trends and who could<br />
be your long term partner. Price is not directly related to efficiency. Lowest<br />
bidder in price may be the lowest in service too
PUTTING EDUCATION ONLINE : A CASE STUDY<br />
A. R. Thakur<br />
Bioinformetics Centre<br />
Deparlmenf <strong>of</strong> Biophysics<br />
Molecular B~ology and Genetics and Computer Centre<br />
Calcutta University<br />
Information Technology is rapidly becoming the all encompassing engine <strong>of</strong><br />
development. This development is fuelled by an exponential growth in computing<br />
power, as f~rst observed by Intel co-founder Gordon Moore; microchips double in power<br />
and halve in price roughly every 18 months. Along with this, the second and equally<br />
important component which is pushing the information revolution is the rapid conceptual<br />
and technical development in the field <strong>of</strong> communication. A combined effect <strong>of</strong><br />
development in these two areas, which has in effect become the third component<br />
pushing the information revolution is the concept <strong>of</strong> distributed computing. The idea to<br />
enable computers to work with documents stored in other computers gradually<br />
culminated into what is called W or World Wide Web <strong>of</strong> the Internet.<br />
The number <strong>of</strong> computers serving as hosts on the lnternent has exponentially<br />
grown to about 50 million all over the world and the number is increasing everyday. The<br />
internet wave has reached our shore late and only during the last 3 years has it really<br />
caught on. Initially it has been pushed forward through the combined efforts <strong>of</strong> ERNET,<br />
VSNL, DOT and NIC. This distributed networked availability <strong>of</strong> information has<br />
progressed much beyond transfer <strong>of</strong> Electronic mail or browsing information <strong>of</strong> the web<br />
site-the web surfing.<br />
lnformation Technology, at the threshold <strong>of</strong> twenty first century, is the most<br />
important tool that will form the principal component <strong>of</strong> all our economic/social activities<br />
including education. It may no longer be a fashionable proposition to debate whether<br />
harnessing this component for development is desirable, we may have reached a stage<br />
wherein it is imperative that we do so. Questions may be asked whether it is affordable<br />
and the answer is a simple yes.<br />
A major impediment in this technological revolution has been a few deeply<br />
ingrained misconceptions. These are:<br />
One has to be a mathemafical wizard to use computers<br />
Actually. 95% <strong>of</strong> the computer users are people who hardly know anything<br />
about even programming. W~thln the last decade and a half, advent <strong>of</strong> user friendly<br />
s<strong>of</strong>tware for different types <strong>of</strong> works has made it possible to work with computers a<br />
simple task for any literate person. The technology to be handled is no more
complicated Ulan typing on keyboard or moving the cursor with the help <strong>of</strong> a 'mouse' to<br />
which one can easily become accustomed. It is no accident that Bill Gates is the richest<br />
person on Earth with an estimated income <strong>of</strong> $500 per second. The revolution that he<br />
initiated was to make the s<strong>of</strong>twares user friendly to the extent that it made people shed<br />
their inhibition and start accepting PCs as part <strong>of</strong> their daily life.<br />
This is needed only for those involved in Science and Technology<br />
Any information that may be needed in any area which is now part <strong>of</strong> this<br />
process is available. I shall briefly narrate an incident to illustrate this point. Recently we<br />
were in a training session on Internet with teachers <strong>of</strong> Kldderpore college, mainly from<br />
faculty <strong>of</strong> arts. There was one request for anthology <strong>of</strong> Urdu poetry, and a site could be<br />
found wilh poems given in Urdu script. The second request was for a list <strong>of</strong> works<br />
available on Bhartendu Harischandra at lndra Office Library. Yes, we had to struggle a<br />
bit to get these but ultimately the information could be retrieved<br />
This is not an affordable technology in developing economies like ours<br />
I would like to submit that once we start thinking <strong>of</strong> quality teachlng which might<br />
determine the rate <strong>of</strong> our economic growth, larger sections <strong>of</strong> the society can be<br />
reaches properly only on adoption <strong>of</strong> these technologies. Distance Learning Education<br />
has now taken a new dimension in that it no longer fulfills the necessity <strong>of</strong> reaching out<br />
to the underprivileged and underachievers; today Distance Learning Education is<br />
synonymous with extending educational opportunities to those who have already<br />
become pr<strong>of</strong>essional and would like to enture into new areas. Thus this should cover<br />
course curricula meant for reskilling people wilh a fair amounl <strong>of</strong> competency who have<br />
limitation <strong>of</strong> moving into a fixed educational environment for a specific stipulated period.<br />
It has been suggested that the education system in West Bengal has not kept<br />
pace with the more developed regions. One would like to contest the data since one<br />
does see a large number <strong>of</strong> students from West Bengal mannlng the various National<br />
<strong>Institute</strong>s in numbers in larger proportion than the relative population strength <strong>of</strong> the<br />
State. However that does not mean that one can afford to be complacent. In fact, that<br />
immediately suggests opening <strong>of</strong> new disciplines which is bound to attract the more<br />
adventurous students, who are not afraid to cross the boundary in order to gain<br />
knowledge.<br />
Java and other interactive technologies brlng new possibilities for developing<br />
content on the web. What does th~s capability mean for information dissemination and<br />
communication The capabilities <strong>of</strong> interactive technologies can now be used to<br />
effectively support communication amongst users. The significance and role <strong>of</strong><br />
interactive learning is to be used in providing an environment for indrvidual and<br />
collab~rative work both within the University Department and externally. As intranet can
provide seemless access to a variety <strong>of</strong> information resources, this may be used to<br />
broadcast an interactive structured course work on a particular subject over the network<br />
which we might call Tele teaching.<br />
This will involve:<br />
i) Multimedia cooperative content creation. Every teacher creates hidher own<br />
course based on modular collection <strong>of</strong> semi-independent units (e.g. textual<br />
explanations; problems pictures; applets; videoclips <strong>of</strong> demo's).<br />
ii)<br />
iii)<br />
Database lo store 8uch ramourca units<br />
Teachers' interface for different assembly <strong>of</strong> a course by 'drag and drop' which<br />
will involve - 1000 html pages; -800 pictures (stored as gif files) - 50 Java<br />
applets; - 300 homework problems; - 10 interactively corrected multiple choice<br />
practice tests with solutions; - 15 separate questions<br />
How Is thls going to work<br />
Students' computers to have Browser with frame capabilities:<br />
Top frame for navigation: navigation button<br />
Selection <strong>of</strong> chapters and Topic via pulldown menus<br />
Checking own current progress<br />
Send E-mail to teachers<br />
Enter dedicated Problem Queries section<br />
Learn about the System (System Tour guide)<br />
Homework engine to have:<br />
lndivldualized problems: same text different data for each student<br />
Immediate feedback - in many problems; hints to be tailored to incorrect<br />
answers.<br />
The entire set <strong>of</strong> homework problems can be createdlmodified by the instructor<br />
only through the use <strong>of</strong> browser.<br />
Instructor Tools:<br />
View Table <strong>of</strong> Contents (ToC) <strong>of</strong> the course<br />
Copy ToC from another class<br />
Edit ToC according to the teachers choicelsludents' level<br />
EdiVintroduce homework problem<br />
Course admlnistration: Register new studentddrop existing studentslchange<br />
due dates for homework/assi$n markdassign system's e-mail recipients.
Objective <strong>of</strong> the proposed project:<br />
Calcutta University has nearly 230 aff~liated undergraduate colleges. Recently a<br />
course on Environment has been introduced as a compulsory paper at the<br />
Undergraduate level. There is a strong need for an interactive course material to be<br />
made accessible to the teachers and students. A sophisticated computer network<br />
infrastructure involving optical fiber backbone connecl~ng the different bulldings in the<br />
Rashbehari Prangan connecting different Departments is in place. From Alipur we have<br />
established a dial in PSTN connection between the two Routers. The connectivity at 9.6<br />
kbps gives 200 ms connect time. whereas for the I-NET X.25 leased llne it is 400-600<br />
ms. The VSAT (641128 kbps) is being used for Internet browsing by about 100 nodes<br />
spread all over the four campuses. We are in a pos~tion to <strong>of</strong>fer the undergraduate<br />
Colleges connectivity. A kit consisting <strong>of</strong> a Router, a hub and a modem is now ready<br />
with which the connectivity can be tested from any collegeiinst~tut~on using PSTN line<br />
This project envisage development <strong>of</strong> on-ltne courses based on the Syllabus for I)<br />
Environmental Studies ii) Computer Science (both at Pass and Honours level) ill)<br />
Molecular Biology iv) Electronics Science etc, at the Undergraduate level<br />
Recent development<br />
lnd~a was one <strong>of</strong> the fist few countries that had taken glant step In 1986 and<br />
establ~shed a nat~onw~de B~olnformatlon System <strong>of</strong> lndla A D~stributed lnformat~on<br />
Network under the aelgies <strong>of</strong> Department <strong>of</strong> Biotechnology was establ~shed in varlous<br />
Un~versit~es and research lnstrtutes As a consequence <strong>of</strong> th~s ~nit~atlve computer<br />
llteracy and awareness amongst 910-sclentlsts grew Large number <strong>of</strong> publlc doma~n<br />
databases w~th regular updates, In the area <strong>of</strong> molecular b~ology and genetlc<br />
englneerlng became ava~lable to sc~ent~sts In lndta Computer hardware to carry out<br />
s~mple data analys~s and modell~ng has also become ava~lable and network~ng <strong>of</strong><br />
computers IS now provlded on a regular bass through NICNET and ERNET establ~shed<br />
V-SAT l~nkage Calcutta Umverslty has already establ~shed its own Network the need<br />
<strong>of</strong> the present 1s development <strong>of</strong> human resources and for thls network can be<br />
harnessed to teach more effect~vely In far flung Inst~tut~ons by mak~ng ava~lable to them<br />
course rnaterlal by teleteach~ng<br />
International Status<br />
It is now global\y felt that the fruits <strong>of</strong> the Informatton retrieval, processing and<br />
analysis should be put in a networked environment so that greater benefit can accrue to<br />
the society. Even a market driven economy <strong>of</strong> the western world understands the<br />
necessity <strong>of</strong> dissemination <strong>of</strong> knowledge over the Net so that browsing or surfing the<br />
Net is no longer for pleasure but necessary for gathering vital teaching matertal.<br />
Michigan State University has already set up a web site based Lecture Course on<br />
Physics.
Methodology to be adopted<br />
The campus at Ballygunge Circular Road has an extensive LAN maintained with<br />
UTP cabling. Similarly the <strong>Central</strong> Libray Complex at College Street campus also has<br />
an operative LAN. These are connected via the I-NET could using (X.25 and X.28<br />
PADS). The four-port Router at Rashbehari Prangan can provide Dial-in service via the<br />
I-NET could as well. Undergraduate Colleges could be tested as a node where<br />
teleteaching material as well as Offline database could be made available over the<br />
Intranet.<br />
Due lo ever-increasing importance <strong>of</strong> the Web as a distribution channel and<br />
communications vehicle, organizations are racing to meet the demand for media-rich<br />
content on the Internet and the~r intranets. Education and training on demand is just<br />
one example <strong>of</strong> the innovative use <strong>of</strong> media streaming. WebFORCE MediaBase<br />
streams audio and video to the desktop, bridging the gap between those learning and<br />
those teaching through a Web environment. Video lessons streamed to the desktop<br />
allow for education on demand, including both live and delayed access to a lesson.<br />
Real-t~me Webcast~ng allows students the flexibil~ty to see lectures live from an <strong>of</strong>f-site<br />
location, through the familiar-interface <strong>of</strong> a Web browser. Course on demand allow<br />
even greater flexibility by archiving and cataloging lessons or sieeches that can be<br />
searched lor an delivered as needed with a keyword or topic search.<br />
Medis delivery in for /he educational institutions like colleges or schools<br />
Computer based Training applicalions. In fhe educational sphere the media<br />
server can be used for:<br />
Interactive computer based training<br />
Multimedia centres established by universities to train students in new technologies<br />
Dtstance learning, live recording and broadcast <strong>of</strong> classroom lectures over campus or<br />
external networks and the storage and cataloguing <strong>of</strong> these lectures for future viewing.<br />
Archiving and cataloguing <strong>of</strong> the various media assets at different departments at the<br />
educational institutions.<br />
Repurposing media assets for on-line education.<br />
Work to identify the applfcation requirements must be made and for that certain key<br />
questions should be answered:<br />
What is client platform<br />
What is the underlying network (topology and protocol) for distribution <strong>of</strong> the media<br />
What are Ihe video quality, bandwidth and format requirements How many clients are<br />
being served concurrently is there a need for multicasting How much content will the<br />
customer be receiving<br />
Are media server, storage content and network management important
What is the media format used (MPEGI. MPEGZ, H.263)<br />
Is live encoding and broadcast required or desired<br />
Is 'server-up-time' a critical issue<br />
Before a media server solution is decided it is important to understand the type <strong>of</strong><br />
application that is being proposed. Some <strong>of</strong> the iniportant information one must have:<br />
Display device for the media; Windows 95; Windows NT. Irix, Solaris; AIX; Network<br />
Computers Transport protocol IP or ATM<br />
Network topology from the server to the cl~ent<br />
The video format that is bebng used currently WebFORCE MediaBase supports<br />
MPEGI, MPEG2 and H.263 formats V~deo can be streamed using natlve IP protocols<br />
(UDP) or AAL5 for pure ATM netowrk.<br />
Number <strong>of</strong> concurrent streams that IS being planned along with hours <strong>of</strong> video that need<br />
to be stored and streamed.<br />
Hardware or s<strong>of</strong>tware decode for the client side should be identified.<br />
WebFORCE configuration for 0200 with CPU (4R10K) with 256 ME RAM 60 hrs<br />
<strong>of</strong> Videocontent may be stored using 100 streams This would need additional disk <strong>of</strong><br />
56GB. The Price is - $20000.00.<br />
Once this is standardized, interactive coursewares developed to cover some <strong>of</strong><br />
the specialized subjects like Environment, Microbiology, Molecular Biology, Electronics,<br />
Computer Science could be kept for access by both students and the teachers <strong>of</strong> the<br />
Undergraduate Colleges. We believe the interactive progamme w~ll ensure that the<br />
teaches wouldn't feel theatened as in a top down approach<br />
How is the project to be integrated to the educational system<br />
The proposed West Bengal net <strong>of</strong> universities<br />
The idea <strong>of</strong> this network gets its birth from the immediate need to establish<br />
communication between the major educational institutes in West Bengal for data, email,<br />
and remote education program. Right now a lot <strong>of</strong> these institute e.g IIM. ISI, Calcutta<br />
University, S. N. Bose Inst~tute. etc, have lheir own LAN and access to the W on<br />
leased lines. All these centres <strong>of</strong> education are to be broughl under one platform using<br />
a resilient, upgradable, scaleabie h~gh bandwidth backbone network. At a later stage<br />
this nelwork can afso be used for private Voice traffic, which will help project<br />
investment. The various affiliate colleges under the various universities should be able<br />
to dial into the backbone for sharing <strong>of</strong> resources. This intranet should also be used for<br />
internet access from one or multiple gateways in the network in such a way that there is<br />
hgh avaiiability if internet access to all users in the network. The currenl network at
Calcutta University connecting the various campus can be model 8 used as building<br />
blocks in the design and construction <strong>of</strong> this wmplicaled intranet.<br />
The current cal university network<br />
The Calcutta University network can be the basis <strong>of</strong> our proposed network. In<br />
the light <strong>of</strong> the above we need to look into the design <strong>of</strong> this IBM switch 8 router based<br />
intranet. The campuses in this intranet are:<br />
Rajabazar Campus<br />
Bailygunge Campus<br />
Alipore Campus<br />
College Street Campus<br />
The various branches are connected via the INET X.25 network. Alipore has a<br />
d~al up connectivity to Ra]ebazar. For internet access right now the Rajabazar campus<br />
acts as the gatrway to ERNET @ 64 kbps, through VSAT.<br />
Concerns in the network:<br />
The network la not secured. It does not have a proper proxylfirewall which might<br />
lead to data hacklng and Intentional instrusion into this network.<br />
Bottlenecks In band with can be a cause <strong>of</strong> concern as the network grows with<br />
more colleges dlallng thls network. The backbone is presently only at 9.6 kbps at which<br />
only emaii transfer can happen, smoothly Mission critical application and multimedia<br />
applications e.g. remote teaching program will definitely needs much higher bandwith.<br />
Video conferenclng too requires much higher bandwidth.<br />
For internet access the network is dependent on ERNET. But again to cater to<br />
the high number <strong>of</strong> Internet users in this huge network a fat pipe to VSNL at 512 kbps<br />
or more is ideal.<br />
How can we design thls network<br />
The final network as we envisage is to encompass the following Educational<br />
<strong>Institute</strong>s<br />
Calcutta University - 4 locations<br />
Jadavpur University - 2 locations<br />
Vidyasegar Univenity - Midnapore<br />
Rabindra Bharati Univenity - Calcutta<br />
Viswa Bhanti Univenity - Santiniketan
North Benal University - Siliuri<br />
Burdwan University - Burdwan<br />
Kalyani University - Kalyani<br />
BE College - Howrah (Calcutta)<br />
IS1 Calcutta<br />
IIM Calcutta<br />
SN Bose <strong>Institute</strong> Clacutta<br />
Saha <strong>Institute</strong> Calcutta<br />
IACS Calcutta<br />
Bose <strong>Institute</strong><br />
All the affiliate colleges under the universities (> 400)<br />
Fisheries University - Calcutta<br />
IIT - Kharagpur<br />
With all these inst~tutlons brought w~thin the lim~ts <strong>of</strong> a single network they need<br />
adequate bandwidth for effective data commun~cation and also to protect investment,<br />
the network should be designed only after through brainstromlng & careful and<br />
meticulous study <strong>of</strong> requirementslapplications and the various options available in<br />
terms <strong>of</strong> the WAN media. The design is also somewhat dependent on the extent <strong>of</strong><br />
security and network monitoring required<br />
To start with we can break the network into phases and look tnto the varlous<br />
media available at this stage. The network des~gned today should be able to<br />
accommodate new technologies <strong>of</strong> tomorrow,<br />
The various media:<br />
To start with one can continue with INET but keeping in m~nd that this would<br />
include running critical applications l~ke remote teaching programme, library on the net,<br />
File download, mult~medi application as well as video conferencing and voice at a later<br />
stage a higher leased bandwidth is definitely required and this is what holds the key to<br />
the effectiveness 8 usabil~ty <strong>of</strong> the network.<br />
The various alternates for having high bandw~dth w~thin the intranet are:<br />
641128 K DOT Terrestrial leased lines<br />
641128 K VSAT Priority Assigned multiple Access links<br />
Demand Assigned Multiple access VSAT links<br />
ISDN Basic Reserved Interface links from DOT (2B+D)<br />
For access to internet a good option is to have onelmult~ple leased links to<br />
VSNL through multiple gateways within Ihe network These links can be establ~shed<br />
through DOT leased IinksllSDN.
A Tiered Network<br />
To ensure a properly planned network that can be administered with ease we need to<br />
tier the network as:<br />
The network can be constructed In line with the internet which has a backbone<br />
on OSPF and Access network and is a IP network in total~ty.<br />
A router based IP backbone connecting the nodal universities<br />
A strong, resilient 8 redundant backbone hold the key to the functionality &<br />
scalibility <strong>of</strong> the entire network. Within Calcutta 8 its suburbs we can have the<br />
backbone on ISDN dial up That can give us upto 128 kbps <strong>of</strong> bandwidth. Between<br />
Calcutta 8 distant locations it is ideal to have 641128 k bandwidth using VSATIDOT<br />
leased links. VSAT w~ll def~nitely be beler in terms <strong>of</strong> reliability over DOT leased<br />
circuits.<br />
Consultat~on w~th DOTNSNL necessary<br />
A remote access network<br />
To start w~th the various affiliate colleges can dial up into the nodal points<br />
through RAS (rernote access server) and can gel into the nelwork It is very important<br />
that colleges should get a committed high bandwidth on demand. Here the two options<br />
are PSTN d~al upllSDN dial upi9.6 k leased164 kbps leased. The networking<br />
equ~pnlents should however be able to support 64 kbps in future.<br />
Consultation with DOT essential<br />
Internet access<br />
This intranet should also be available to the WWW and the users <strong>of</strong> this<br />
University network should have unhindered access to the internet.<br />
To ensure this there should be preferably two 64k leased links to VSNL from<br />
two nodal centres.<br />
The reason for having 2 links instead <strong>of</strong> I is to distribute the internet traffic<br />
through 2 points and hence reduce bandwidth clogging at a single gateway.<br />
Consultation with VSNL necessary.
Network security and monitoring<br />
A network <strong>of</strong> this stretch and magnitude needs utmost security for seamless and<br />
smooth functioning. Hence 11 should have multiple Proxy servers <strong>of</strong> high processing<br />
power to<br />
1. Ensure that the network is hidden from the interne! and hence secured from<br />
being hacked by firewalling mechanisms.<br />
2. The overheads on the backbone are reduced and hence network becomes<br />
faster due to proxy caching.<br />
Again to prevent downt~me <strong>of</strong> the network by early identiflcat~on <strong>of</strong> faults in the<br />
network. The network needs to be managed uslng a central SNMP Management<br />
Station.<br />
Local LAN at each site<br />
Finally one very important part <strong>of</strong> the network is the LAN at each slte. In order to<br />
effectively use the backbone the LAN at each site should be state <strong>of</strong> the art. All the<br />
sites should preferably have structured cabllng with a switched environment and F~bre<br />
at the backbone and UTP at desktops. The campus LANs can well be bull1 around ATM<br />
switches.<br />
Servers<br />
In add~tion to the proxy servers there should be DNS servers, mall servers,<br />
terminal sewers, d~g~tal l~brary server and web servers at one or more nodal site 8<br />
replication if poss~ble at other sites<br />
This, thus forms the basis <strong>of</strong> the proposed intranet However detalled studles on.<br />
1. Load Calculation<br />
2. Degree <strong>of</strong> redundancy<br />
3. The type <strong>of</strong> routing protocol to be sued<br />
4. The extent <strong>of</strong> security<br />
5. The type <strong>of</strong> management<br />
6. IP planning etc.<br />
is required to finally arrlve to the ult~mate design.<br />
In this regard we are looking towards the deslgn <strong>of</strong> a network that is<br />
Technically flawless<br />
Commercially viable<br />
Scalable i% Upgradable<br />
Should be able to grow
How do we go about building it<br />
The Calcutta University Network needs to be augmented.<br />
We have been given one Cluster C-series <strong>of</strong> IP address (256). Current scheme<br />
has exhausted the list. We are to put in Proxy server. We have downloaded<br />
LlNUW~ndows NT based demo version. These are to be ported on the<br />
Compaq Windows NT servers for which we have already placed order.<br />
We need to put a Firewall for security. Price Rs. 2. lakhs<br />
The RAM <strong>of</strong> the PC Servers and the machines currently used for internet<br />
access have to be increased. For this order has already been placed.<br />
The 9.6 kbps X.25 leased line INET needs to be upgraded to 64 kbps.<br />
A CD-Juke box has to be put in conjunction with the CD-NET at College Street<br />
so that we can start the Off-line database service. Price DM 28,000.00 (NSM,<br />
Germany)<br />
Web Server Sun Ultra Sparcll Rs. 10 lakhs<br />
Digital Library server: Origin 2000lRAID Rs. 20 lakhs<br />
Dial-in Server: Capable <strong>of</strong> 5 telephone lines on a hunting mode; Rs. 50000.00<br />
Budget Proposal by March 1999<br />
CD Juke Box<br />
S<strong>of</strong>tware for CD-NET<br />
Upgrade 9.6 kbps to 64 kbps<br />
Upgrade RAM<br />
Dial-in-Server<br />
ProxylFirewall S<strong>of</strong>tware<br />
5-telephone lines<br />
Laptop Computer<br />
Libsys<br />
S<strong>of</strong>tware for On-line Teach<br />
workstation for On-line<br />
ERNET 2 Mbps upgradation<br />
Total:<br />
What would we be getting<br />
1. Connectivity upgraded to 64 Kbps<br />
2. Off-line database with 150 Cds.<br />
3. 5-6 Colleges out <strong>of</strong> 100 colleges within Calcutta Telephone gets connected.<br />
4. A kit comprising <strong>of</strong> (1 Router; 1 Hub: 1 Modem; 3-4 Patch cords: 1 Laptop<br />
Computer) is kept ready for checking the connectivity with colleges and<br />
universities.<br />
5. Preparation taken for On-line teaching <strong>of</strong> courses from emerging areas.
EXISTING NETWORK A T CALCUTTA UNIVERSITY<br />
I
WEB SITE DESIGN 8 HOSTING<br />
Bikash Panda<br />
HIG-188, Kanen V~har, Bhubeneswar-75103 1<br />
The Internet's World Wtde Web is like the W~ld West. Anarchic, disorganised.<br />
exciting and with minimal standards. By now there are approximately about 48.00,000<br />
web sewers maintaining about 45 crores <strong>of</strong> web pages. Every corporate house,<br />
educational & research institute, small business concerns even indivlduat users expect<br />
to have a presence in the Web and moreover, every web site expects to attract as<br />
much visitors to browse their information contents. People visit the sites which are well<br />
organised, informative, easy to navigate, interesting content, good to look at and<br />
nevertheless, useful. This imposes a challenge on the web designers to have an edge<br />
There are no standards to define what a good site is. However, a consensus has<br />
emerged for the same.<br />
The language <strong>of</strong> World Wtde Web is HTML wh~ch stands for Hyper Text Markup<br />
Language. The word 'Markup" indicates that HTML is a formatting language and not a<br />
programming language. This concept makes the language easy lo learn 8 easy lo<br />
implement. Web pages are basically HTML documents whlch are inlerpreled by Web<br />
Browsers ltke Micros<strong>of</strong>t Internet Explorer or Netscape Navigator. A HTML docuri)ent<br />
IS an ASCll text flte that contam HTML tags 8 these tags decide how the web page<br />
looks like when browsed. Being ASCll files, you do not require any spec~allsed<br />
Compiler or Interpreter or IDE to wrtte or use them One can use the most cornmon<br />
Notepad or Wordpad or even DOS's own edit com or Unix's vi editor to write them. The<br />
HTML files have an extension <strong>of</strong> HTM or .HTML.<br />
The following section describes few commonly used HTML tags and other web<br />
development concerns.<br />
The HTML tags are special keyword wrltlen between < and > slgns An example<br />
<strong>of</strong> an HTML tag is There is no hard 8 fast rule in wr~ting the tags in Uppercase<br />
but it is advisable to use Uppercase letters so as to differentiate it from the text <strong>of</strong> the<br />
page.<br />
A typical web page may have the following contents Let us name the page rnyf1le.htrn<br />
<br />
<br />
Welwrne to CIFA, Bhubaneswar<br />
4iTML><br />
<strong>Central</strong> <strong>Institute</strong> <strong>of</strong> Freshwater <strong>Aquaculture</strong> is situated in the outskirts <strong>of</strong> temple city <strong>of</strong><br />
Bhubaneswar in Orissa.<br />
<br />
<br />
This page when viewed in your preferred browser would display a heading in the<br />
top <strong>of</strong> the screen as Welcome to CIFA, Bhubaneswar and the body <strong>of</strong> the browser<br />
would display the text '<strong>Central</strong> lnstltute <strong>of</strong> Freshwater <strong>Aquaculture</strong> is situated in<br />
the outskirts <strong>of</strong> temple city <strong>of</strong> Bhubaneswar In Orissa.' Please note that when<br />
indicating the start 8 end <strong>of</strong> the tags, the end tag must have a I in them. You may find<br />
this used as 8 , 8 elc.<br />
In the browser window only the contents <strong>of</strong> - are shown. The<br />
tag contains information which are not shown in the browser but have other<br />
use like the Header information, author's name elc.<br />
The tag inside body displays the text as Headinl;.<br />
Example :<br />
lntroduction to CIFA would show 'lntroduction to CIFA" as lntroduction to<br />
CIFA<br />
Smaller Headings are possible with tags thru <br />
The following tags helps us in formatting the text.<br />
denotes the start <strong>of</strong> a new paragraph.<br />
tag puts a line break in the text<br />
For making the text Bold<br />
For making the text Italics<br />
XU> For making the text Underlined<br />
Adding Plctures to Web Pages:<br />
Pictures speak thousand words. Graphics makes a web site attractive.All<br />
pictures must be converted lo one <strong>of</strong> several digital formals, so you'll need a scanner<br />
and s<strong>of</strong>tware (such as Adobe Photoshop) to manipulate the picture into the form you<br />
wish to display it in: the pictures don't appear there magically1 To get your pictures to<br />
display on a Web page, you must use certain HTML tags to "point to" the picture Rles<br />
that, like your HTML files, have been uploaded to a server. Where and how you place<br />
the tags deems how the art will be viewed by a particular user.<br />
Pictures can be saved in a variety <strong>of</strong> styles; the GIF format is the most<br />
commonly recognized by various browsers, and is thus most commonly used. .ihe<br />
JPEG format is also fairly common; it creates better quality photos, especially with<br />
scans. A program called GIF Converter Is also helpful; it converts files saved in the
Maantosh PlCT format to either a GIF or a JPEG, and allows you to edit the files<br />
Here is the most common tag used to find and place a picture on a Web page:<br />
provided. Third, you will need a private account on a Web server-a computer<br />
permanently connected to the Internet-so you can upload your files to it, and other<br />
people can see them.<br />
You also must be able to transfer your files to the server. For IBM and<br />
compatibles, use any FTP (File Transfer Protocol) client (there's a basic one built in to<br />
Windows 95); one <strong>of</strong> the easiest to use is Cute FTP. From there, you have the choice<br />
<strong>of</strong> a few different options for getting your pages up on the Web.<br />
Depending on your circumstances at school or at work, you may have to pay a<br />
fee to keep your pages on the Web; the rates will vary from provider to provider.<br />
University servers will sometimes upload student or faculty pages to their server for free<br />
or a minor fee; if you work in a company that allows you to use their server, that's<br />
another option. If neither <strong>of</strong> these are possible, you'll need an independent ISP (Internet<br />
Service Provider), price !he options, then upload the information to the provider so they<br />
can put it up for you. You will be paying a fee (most likely on a month-to-month basis) in<br />
this case. Fees could be flat, but many times they depend on how many people are<br />
accessing your site (called "hits"). The more hits, the more taxing it is on the server,<br />
and potentially, the more you'll pay.<br />
HTML Editors<br />
As one can imagine writing HTML tags for longer documents can be very<br />
dtff~cult 8 confusing. As on now there are hundreds <strong>of</strong> HTML editors which work as<br />
WYSlWUG (What You See Is What You Get) style, which helps you write good Web<br />
pages conveniently. The most popular ones are Mic-x<strong>of</strong>l Frontpage, Hotmetal's<br />
HotDog, Dream weaver etc.<br />
Web Design Considerations<br />
Here are few web development guides for making a good web site<br />
Set Objectives for the Web Site:<br />
Define the target audience clearly (Whom do you want to influence)<br />
Esttmate audience technology pr<strong>of</strong>ile (eg bandwidth, type <strong>of</strong> browser etc)<br />
Perform audience needs analysis<br />
Be clear about your purpose (sales, service, education, research, entertainment)<br />
Define the scope <strong>of</strong> Content:<br />
* Do not Use unnecessary words<br />
Provide useful information on each page<br />
* Design for all browsers
Use Graphics Judiciously:<br />
Limit large images used for visual appeal only<br />
Keep the total size <strong>of</strong> graphics on a page less than 50K<br />
Limit the use <strong>of</strong> graphics bullets and lines<br />
Ensure good contrast between text 8 background colour or images<br />
Plan for easy Navigation:<br />
Give each page an appropriate title<br />
For long documents, provide return to Top or Hornepage links<br />
For large sites, provide a search engine or index pages<br />
Indicate the date <strong>of</strong> last update <strong>of</strong> the site<br />
Avoid use <strong>of</strong> frames<br />
Provide guided tours in appropriate situations<br />
Web design is more <strong>of</strong> an arl than programming. A good designed site can be the best<br />
medium one organisation can think <strong>of</strong> lo promote their objectives.<br />
About the author<br />
Bikash Panda is a BE(Electronics). MBA(Systems) and has Web development experience <strong>of</strong><br />
more than 3 years in India 8 Abroad<br />
He can be coniacted at HIG.188, Kanan Vihar, Bhubaneswar-751031, Te1.91674-440702,<br />
Email : bikash@ma~lcily.cwn
MULTIMEDIA - a maglc mantra<br />
Jayaram Parida<br />
(MCS. Multimedia 6 Web Developer)<br />
NAVAGUNJAR<br />
Multimedia end Web Technology Lab<br />
9, Sweet Housing Complex<br />
Ganganagar, Bhubaneswar - 751 006<br />
Multimedia is a much used, over-used and abused term. Since the early 1990s<br />
multimedia has been hyped as a major revolution in computer technology and is hailed<br />
as part <strong>of</strong> "the next big thing". As with any bandwagon, there are many people looking<br />
at multimedia from different points <strong>of</strong> view. As we are considering multimedia from a<br />
Media Product~on viewpoint we need to define multimedia in terms that allow us to<br />
compare and contrast multimedia with other media products.<br />
As multimedia is so new there are riot any clear conventions about what is and is not<br />
multimedia but as a starting point we will work with the following def~nition:<br />
Multimedia is a really an adjective not a noun1 You can't really talk about multimedia full<br />
stop. You have to talk about a "multimedia something" We are talking about multimedia<br />
producis. These are media products with the following characteristics:<br />
They are delivered digitally. This usually means that some kind <strong>of</strong> computer is<br />
required to use the product. This may not be a conventional looking desktop computer<br />
(although it can be). It could be a Sega or Nintendo games console. It could be a settop<br />
decoder box or a CD Player. it might be a hand-held personal organiser or a mobile<br />
phone. The key that distinguishes digital technologies from the rest (analogue) is that<br />
large amounts <strong>of</strong> information can be stored, searched, displayed and manipulated with<br />
ease, Digital technology also makes it easier to allow the consumer to enter their own<br />
information and make there own choices- inleractivity.<br />
They use a range <strong>of</strong> audio-visual forms. Traditionally, information delivered via a<br />
computer has been text-based with perhaps some basic graphics. Multimedia products<br />
are based on the assumption that it is best to use the form most appropriate to the<br />
content. As computer technology has improved, it has become possible to display high<br />
qual~ty still images, v~deo and animation in addition to text and graphics. Whilst using<br />
these visual mediums it is also posslble to play high quality sound- music, voice-overs,<br />
sound effects etc. This allows the product designer to provide a much richer<br />
environment for the consumer. It is argued that this enhances their experience.<br />
They are interactive. Many traditional media forms are passive. The consumer can't<br />
decide what stories appear in a newspaper. They can't directly influence the narrative <strong>of</strong>
a N drama. They can't respond immediately to r radio adverl. Interactivity allows the<br />
consumer to influence the material that is king presented to them - to interact with it.<br />
The nature and amount <strong>of</strong> interaction varies tremendously. For example, a Ninlendo<br />
games console is highly interactive the whole experience hinges on the user's<br />
manipulation <strong>of</strong> the controls. Home Shopping may be less frantically interactive but still<br />
allows the consumer to respond directly to the content that is being displayed.<br />
Introduction- Still Images<br />
In this first main practical topic you will look at how the most basic elements <strong>of</strong> any<br />
multimedia product are constructed. The term "Still Images" covers a wide range <strong>of</strong><br />
different parts <strong>of</strong> a multimedia production. It refers to any static graphics, photographs,<br />
design devices and even text sometimes. Sometimes you will start a screen from<br />
scratch on the computer but there is <strong>of</strong>ten a need to capture existing graph~c material<br />
such as a photograph or a logo into the computer so that you can work on it before<br />
including it in the flnal product.<br />
Capturing Still Images<br />
Capturing a still image means taking an existing Image and transferring it into the<br />
computer so that it can stored and used in digital form. The method you use depends<br />
on the form the existing image takes before you start. 01 course the image may not<br />
exist at all so you will need to do some photography first. If this the case then consider<br />
using a digital camera. This will cut out an intermediate stage. If you want high quality<br />
images from scratch then you can take conventional photographs and have them<br />
transferred on a Kodak Photo CD which can then be read by the computer. It is <strong>of</strong>ten<br />
the case however that you already have the image as a photograph or on a prrnted<br />
page. It this situation you use a flat-bed scanner d~rectly connected to a computer to<br />
capture the image.<br />
Scanning<br />
The flat bed scanner is used to capture existing still images that are in a form that will fit<br />
flat against the glass plate. This usually means paper but it doesn't have to be- you can<br />
scan fabrics, leaves, silver fotl etc. a3 a means <strong>of</strong> generating textures There Is a<br />
scanner in all the computer suites that you use. Using the scanner IS fairly straight<br />
fomard but like anything in multimedia it needs to be done carefully following these<br />
instructions exactly.<br />
Place your original artwork under the scanner cover, face down. Align the corner <strong>of</strong> the<br />
picture with the comer <strong>of</strong> the glass indicated by an arrow. This usually means putting<br />
the picture In upside down. Launch the application Adobe Photoshop. This program is<br />
probably in a folder called Applications but it could be anywhere on the d~sk. :f you can't<br />
find it use "Find File" from the Finder File menu The application icon is shown here.
PhotoShop is a popular, powerful program for creating and manipulating still images.<br />
You access the scanner by pulling down the File menu and holding the mouse down on<br />
Acquire. This displays a sub-menu that shows the name <strong>of</strong> the scanner s<strong>of</strong>tware. This<br />
will vary depending on the make <strong>of</strong> scanner but is usually obvious.<br />
The scanner may have settings for adjusting parameters such as brightness and<br />
contrast. As a general principle, leave all these settings at their defaults. Scan the<br />
image first and then do all the correction afterwards in PhotoShop. PhotoShop gives far<br />
greater control over the image and if things go wrong you can always revert to the<br />
original scan and try again. Click the preview button. The scanner will quickly scan the<br />
original at low resolution, showing you a thumbnail view <strong>of</strong> the whole image. You will<br />
<strong>of</strong>ten want to scan only part <strong>of</strong> the image so use the mouse to click and drag a<br />
rectangle over the area <strong>of</strong> the image you want to scan. Click the scan button. The<br />
scanner will scan the parl <strong>of</strong> the image you have selected and the open a Photoshop<br />
window containing the scanned image. You can then modify it andlor save it as you<br />
wish.<br />
Dlgital Camera<br />
Digital Cameras are useful when the image you want doesn't exist. You can go out and<br />
shoot Images and then transfer them directly to the Computer without going through the<br />
traditional route <strong>of</strong> developing, printing and then scanning. The disadvantage <strong>of</strong> using a<br />
di~ltal camera (or at least a cheap digital camera) is the image quality. The quality is<br />
much lower than conventional photography.<br />
Comparison <strong>of</strong> techniques<br />
All three <strong>of</strong> the ways <strong>of</strong> capturing images discussed above have their advantages and<br />
disadvantages. In deciding which to use you should be aware <strong>of</strong> these:<br />
Scanning gives reasonable quality and is fairly quick provided the image exists in a<br />
form that can be put under a flatbed scanner.<br />
Digital cameras are quick and easy to use when you need to originate the image but<br />
the quality is only average and they are expensive.<br />
PhotoCD gives excellent quality and you don't have to bother with scanning but you<br />
have to wait for it to be processed and it can be expensive.<br />
Thia shows that there is no right or wrong way to capture images- you have to choose<br />
the best tool for the job.
Capturing Sound<br />
In the same way that you <strong>of</strong>ten start screens with a scanned image you will <strong>of</strong>ten need<br />
to start a soundtrack by capturing and storing some existing music or sound eifects on<br />
disk so that you can incorporate them in your production at the authoring stage.<br />
Existing sound recordings can exist a number <strong>of</strong> forms. The way you capture these into<br />
the computer varies according to the form the track takes. The easiest audio to capture<br />
is from conventional audio CDs. However, if your track is on audio cassette tape then<br />
you can still capture it quite easily. This will usually be the case if you have recorded<br />
your own track with volceoverslcommentary etc. Occasionally It may be necessary to<br />
capture the audio track <strong>of</strong> a video tape. This uses the same technique as required for<br />
audio tape so it is not covered in detail here. Once the audio track has been captured it<br />
can be edited to meet the requirements <strong>of</strong> your multimedia package. The resulting track<br />
can then be superimposed onto the visual material at the authoring stage<br />
Capturing from Audio CD<br />
If you need to capture a track from an audio CD then here's the procedure'<br />
1. Load the CD Into the CD drive <strong>of</strong> the computer. An icon represenltng the CD w~ll<br />
appear on the desktop. Don't bother double-clicking it- that isn't the way in1<br />
2. Locate and launch the application SoundEdit 16. This Is a general purpose<br />
sound capture and editing program. It is to sound what Photoshop is to images.<br />
Capturing Video<br />
Capturing Video is somehow a bit tedious process on the desktop computer. The video<br />
capture card is bit costly than a sound card. And also to capture a long duration video<br />
file takes more space. For example If we want to store 10 minute video data , then it<br />
requires 100-200MB <strong>of</strong> disk space to store the data on to the disk.<br />
Some good video capture cards are Miro DC-30, Bravadoo-2000, Truevision Targa pro<br />
and some low end capture cards are Video Blaster, etc.<br />
To Edit and capture video to the computer on a full frame full motion we require more<br />
video ram and also more RAM at least 32-84 MB(SD0 RAM). Adobe, Premier 5 is a<br />
best s<strong>of</strong>tware for non-linear editing and ~pecial Effects. There are also so many<br />
s<strong>of</strong>tware and editing system8 are available for broadcast quality production. They are<br />
SGI, AVID systems.
Fine I it's a separate topic that which require so many think to the spare, we should now<br />
move to combine all the Text, Picture. Sound, Video and to produce a complete<br />
CDROM .<br />
PREPARING SCREENS FOR INTERACTIVITY<br />
Introduction to Creating a Screen<br />
Once you have acquired all the images that you need you can then build them into a<br />
screen which can be then combined with other screens in an authoring package to<br />
produce the finished product. You will always use Adobe Photoshop to do this job.<br />
Photoshop is an extensive package that can be used for many other tasks as well.<br />
Rather than give you a general introduction to Photoshop this section allows you to<br />
work through the construction <strong>of</strong> an example screen. This is the quickest way to get<br />
results but you should take time to explore Photoshop and find out what else it can do.<br />
Having prepared our Text, Image, Audio, video we are now ready to import them into<br />
Macromedia Director in order to make our piece <strong>of</strong> interactive multimedia.<br />
Macromedla Director<br />
Director is an application which uses the metaphor <strong>of</strong> a film studio: There is a STAGE<br />
on which all the action comes together, a CAST, a SCORE which allows you lo<br />
orchestrate objects through time and a CONTROL PANEL which controls the action.<br />
There are also more computer-like tools for creating text, images, and other objects on<br />
the stage. Each feature is represented by a Window and each window can be open at<br />
the same time so you can work easily (provided you have a big enough screen)<br />
between the features.<br />
As the director <strong>of</strong> your own Movie (as the finished file format is called) you can<br />
orchestrale a number <strong>of</strong> already created objects (cast members) around the Stage.<br />
These objects could be Photoshop files, QuickTime movies, sound files or text files.<br />
You can layer these objects up in the Score so that they can play one in front <strong>of</strong> the<br />
other on the Stage.<br />
It Is the interacllv~ly ill Director that makes it really powerful -- you can programme the<br />
Score and indiv~dual Cast members and so control their behav~our by using Scripts<br />
written in Director's own programming language Lingo. Transparent interactive areas<br />
(buttons).
Multimedia Authoring Contents<br />
Importing the Cast<br />
The first stage is to import the prepared Pict screens. Select Import from the File menu.<br />
The dialogue box allows you select mom than one file at a time. You can choose to<br />
import the bitmap at its original colour depth or at the stage colour depth. You also have<br />
the choice <strong>of</strong> importing the Text, Audio, Video to the Director.<br />
The files will all appear in the Cast window. Now your Director movie should be<br />
interactive.<br />
Creating the Score<br />
The score is the most complicated part <strong>of</strong> Director. It consist8 <strong>of</strong> an ever expanding<br />
window that shows you channels horizontally and frames vertically.<br />
At the top left <strong>of</strong> the score there are control channels that let you adjust timing, create<br />
Colour changes; insert transition effects; and add sounds. You access these features<br />
by double-clicking in any frame in that channel.<br />
The best way <strong>of</strong> placing the cast members on to the score is to select them in the Cast<br />
window (by Shifl-clicking or choosing Select All from the Edit Menu).<br />
Adding lnteractivlty<br />
The next stage is to add buttons to the screens by putting an invisible box around each<br />
<strong>of</strong> the buttons we created on the Menu screen in Frame 1. For this we need to select<br />
the Tool palette from the Window Menu. Choose the empty rectangle and ensure that<br />
the no line option is clicked.<br />
They also appear as new cast members in the Cast window (as do the scripts). Double<br />
click on the button in the frame and the Cast Member Propert Window will appear.<br />
Click on scrip1 an type: go to frame 10 . Do the same for the other buttons<br />
The next stage is to put tnvisble redangles over the return to menu buttons In each <strong>of</strong><br />
the other screens and write the script "go to frame 1".<br />
Now your Oiredor mo& should ba interactive.
Multimedia Authoring Content8<br />
Making a Projector<br />
At the moment the movie can only be played using Director. It is possible however to<br />
turn it into a Projector - a self-contained program which can be played without Director<br />
even king on the computer.<br />
NAVAGUNJAR<br />
Multimedia and Web Technology Lab,<br />
9, Sweet Housing Complex,<br />
Ganganagar,<br />
Bhubaneswar - 751 006<br />
Tel : 91-674-425310,427514<br />
Email : jayaramp@yahoo.com
MULTIMEDIA -on the Web<br />
Jayaram Parlda<br />
( MCS, Mulfimed~s 6 Web Developer )<br />
NA VACUNJAR<br />
Mullimed~and Web Technology Lab<br />
9, Sweet Housing Complex<br />
Gangsnagar, Bhubaneswar - 751 006<br />
Multimedia is a technology which is have everywhere uses for making the<br />
thinks more attractive and more Interactive. Web Technology was dry without<br />
multimedia on 90s. When technology updated by putting graphics on the WebPages<br />
and later come to the animation. And finally now the revolution <strong>of</strong> real Audio and Real<br />
Video which plays a great role on the web and yet to be advanced for more realistic for<br />
the standard system and real application. Here is an detail overview <strong>of</strong> pulting<br />
Animation, Streaming Aud~o and Streaming video on the web for your web Page<br />
design.<br />
Getting lnto Motion -a Guide for Adding Animation lo Your Web Pages<br />
As a frequent Web traveler, you've probably encountered a number <strong>of</strong> pages<br />
that contain various animated objects--from bouncing logos to ads for speeding cars<br />
and bubbling a<strong>of</strong>l drinks. It used to be that a striking background image or a fancy rule<br />
line was all that differentiated the average Web page from one that was really cool.<br />
That, however, has all changed with the advent <strong>of</strong> animated GIFs, Java applets, and<br />
Web browsers that make it easy to host these new elements. If you're thinklng that<br />
you'll have to learn a new programming language, you can breathe a sigh <strong>of</strong> relief.<br />
Although we'll explore animation techniques that rely on Java, there are several ways<br />
you can spice up your pages without having to perform any programming.<br />
GIF Conrtructlon Set<br />
On the PC, the most popular program for creating animated GlFs is Errorl<br />
Bookmark not defined, from Alchemy M~ndworks. This easy-to-use, inexpensive<br />
shareware package supports image looping, interlaced GIF images, and transparency.<br />
It also features an Animation Wizard that will guide you through the process <strong>of</strong> selecting<br />
and preparing an animation sequence.<br />
Two other notable features in Construction Set are the "banner" and "transition"<br />
tools. The banner tool allows you to type in a text message, which is then turned lnto a<br />
scrolling GIF image. The transition tool lets you select an image and then apply one <strong>of</strong><br />
several special effects to create one that's animated. The release I tested supported<br />
four types <strong>of</strong> wipes, several splits, tiling, and an interlaced effect.
GifBuilder for Macintosh<br />
Macintosh users will find an equally powerful tool in Yves Piguet's freeware<br />
application Errorl Bookmark not defined.. This program even surpasses some <strong>of</strong> the<br />
capabilities found in Construction Set by supporting a built-in scripting language lhat<br />
<strong>of</strong>fers you total control over the creation and sequencing <strong>of</strong> images.lf you want lo see<br />
some examples <strong>of</strong> work done by other people and technical information on the GIF89a<br />
format, visit Errorl Bookmark not defined. and then follow the link to the GIF<br />
Animation Gallery.<br />
Java Gyrations<br />
Since Java is a programming language, you can have enormous control over<br />
the way animation sequences are performed--provided you do the programming.<br />
Applets, which are Java programs meant to be run from inside a Java-enabled browser<br />
(such as Netscape or Internet Explorer), allow you to do virtually anything with images.<br />
Java also includes built-in classes for manipulating GIF and JPEG images. But writing<br />
code to do really cool things is difficult--in any language. So why not use some pre-built,<br />
<strong>of</strong>f-the-shelf Java classes for animation<br />
Which Way do we go<br />
The question <strong>of</strong> whether to use GIF images or Java applets for your animatton<br />
depends on what you want to do. If you want to use both GiF and JPEG images, tie in<br />
sound, support navigational control, and can rely on your users to have a Java-enabled<br />
browser (which will be practically everyone very soon), then Java is a great way to go.<br />
Applets like Animator and CltckBoard <strong>of</strong>fer ready-to-use solutions lhat don't require any<br />
programming. All you do is create the artwork, store some Java class files on your Web<br />
server, and add an tag in your HTML file.<br />
The downside lo using Java applets, compared to GIF89a images, is the<br />
additional download time. The two Java applets we've described are each<br />
approximately 20 KB in size. Plus, they both use separate image files for each frame, If<br />
you had an animation sequence that required 10 images, that would mean 10 separate<br />
GETS your Java applet would be performing back to a Web server. Animated GIF<br />
images, on the other hand, are completely self-contained, with no extra code to<br />
download.<br />
What makes Enhanced CU-SeeMe great for Webmasters is that you can add a<br />
few lines <strong>of</strong> HTML to your page and point people to reflector s<strong>of</strong>tware residing on your<br />
server, so that lhey only have to click on a link to start up their own CU-SeeMe s<strong>of</strong>tware<br />
and join your conference automatically. The White Pine Reflector s<strong>of</strong>tware, needed to<br />
run conferences with more than two people, is currently available on 11 Unix platforms.<br />
as well as lor Windows 95 and Windows NT.
For simple animations intended for Netscape 2.0 or later and Internet Explorer<br />
3.0, consider going the GIF route. Both GIF Construction Set and Gifeuilder are<br />
capable tools. For enimation purposes, ActiveX components are. for now, a relative<br />
unknown. They have the potential to do almost anything a Java applet can do, but<br />
faster. Some <strong>of</strong> the early ActiveX animation controls, such as Future Wave's<br />
Futuresplash, are very impressive. Expect your choices in this arena to mushroom. The<br />
hardest part is preparing artwork that strikes a balance between appearance and<br />
compactness. On the Web, the name oi the game, besides looking good, is loading<br />
fast.<br />
Produce Streaming Audio that Satisfies<br />
After a somewhat slow start, Web sites that are capable <strong>of</strong> delivering relatively<br />
tow-bandwidth audio content are appearing with greater frequency, most llkely in<br />
response to the increasing number <strong>of</strong> multimedia-capable PCs hooking into the<br />
Internet. The current <strong>of</strong>ferings from some <strong>of</strong> the major suppliers <strong>of</strong> Internet audio<br />
s<strong>of</strong>tware now include the ability to stream live audio across the Net, typically through<br />
14.4 Kbps and 28.8 Kbps modems, which in turn has fueled the growth <strong>of</strong> Web "radio"<br />
programming and other real-t~me content.<br />
There are a number <strong>of</strong> different approaches taken for Internet-based audio<br />
delivery. Sewer-based audio solutions are currently the only way to stream live audio<br />
on the Internet. Most people will find the installation <strong>of</strong> a sewer to be the least<br />
complicated component <strong>of</strong> delivering audio. The server install is somewhat similar to<br />
setting up a httpd server, using a stand-alone daemon and a configuration file that is<br />
read on initialization, which specifies the root location <strong>of</strong> the encoded audio files. In this<br />
column, we are going to focus on the process <strong>of</strong> encoding audio and delivering it from<br />
your Web site, using the Rea!Audio 2.0 server and audio tools as an example, which I<br />
recently tested for use on the W Q Web Connection.<br />
Preprocess Before Encoding<br />
When uslng pre-exlsllng source ~t IS not uncommon to flnd d~gltal aud~o f~les<br />
that are hundreds <strong>of</strong> megabytes or more In slte Be sure that you have sufficient hard<br />
dlsk capacity for both the source and final encoded aud~o content Gwen the relatively<br />
low cost <strong>of</strong> hard dr~ves, ~t IS wlse to conslder a mlnfrnum <strong>of</strong> a gtgabyle capac~ly to<br />
process your content w~th, lf you are entertalnlng thoughts <strong>of</strong> hour-long aud~o files If<br />
you are plannlng to archwe your source mater~al a tape backup IS essential<br />
Encoding Audio<br />
Once you have finished preprocessing, the encoding process itself is eesy.<br />
When using the RealAudio encoder, select the target bandwidth encodlng that the
source should be processed with. RealAudio servers have the ability to negotiate<br />
content delivery based on the RealAudio Player's setting, and deliver either a 14.4 Kbps<br />
or 28.8 Kbps bandwidth selection. Accordingly, this also means that you have to<br />
encode each source twice if you plan to <strong>of</strong>fer users the choice <strong>of</strong> negotiated content<br />
delivery. There are still quite a few users that surf the Web using 14.4 modems, but the<br />
audio quality <strong>of</strong> 28.8 is noticeably better and should be <strong>of</strong>fered if at all possible.<br />
Producing usable audio can be a trying experience, particularly when you<br />
realize that the audio quality at best will be on par with a mono FM signal. That being<br />
said, properly-prepared audio can add a high degree <strong>of</strong> quality to the experience<br />
someone has visiting your site. It takes time and patience to produce good audio<br />
content.<br />
Puttlng Vldeo on Your Web Slte:<br />
The Baslcr<br />
Video is a medium that is as direct as print and catches more attention. If your<br />
company has something to say with video, that video should be on your Web site. This<br />
year, exciting new plug-ins and helper apps for Netscape Navigator make it possible to<br />
inlegrale video into your Web page, making it more like a CD-ROM. Other helper apps<br />
make it possible to "stream" video. Streaming video is attractive to many, because even<br />
though It Is much lower quality, there is hardly any wait for download.<br />
Although il's time-consuming, the process <strong>of</strong> digitizing, editing, and uploading<br />
your video files is not an extremely complicated process. The only thing that should<br />
scare you about the process is the bandwidth that you will be using (and the legal<br />
problems <strong>of</strong> posting clips that may not belong to you). Before you get serious about<br />
doing thls, you should ask yourself: What is the value the video adds to the Web site<br />
Does it justify the effort spent digitizing the video and making it ready for the Web W~ll<br />
people who come lo the Web site actually spend their time downloading it At 28.8<br />
Kbps, a 1 MB file representing a few seconds <strong>of</strong> video will take about 10 minutes to<br />
download. Spend a day or two surfing the Web looking for video files, and download as<br />
many as possible to get a good picture <strong>of</strong> how and why other people are using video on<br />
the Web.<br />
There are three main video file types that you will encounler on the Web:<br />
QuickTime, AVI, and MPEG. MPEG and QuickTime are most commonly found, with<br />
QuickTime probably being the most popular; many large entertainment sites (such as<br />
Errorl Bookmark not defined., Errorl Bookmark not defined., and Errorl Bookmark<br />
not defined.) use QuickTime exclusively.
AVI is a Windows-oriented video format that is not used as much as QuickTime<br />
or MPEG because <strong>of</strong> problems with syncing up audio and video. For this reason, AVI is<br />
the least popular <strong>of</strong> the three main file formats on the Web. Easy conversion from the<br />
other formats to AVI is available. Since QuickTime is readlly available for Wlndows as<br />
well as the Macintosh, the need for AVI is rapidly vanishing from the Web.<br />
MPEG's (Ermrl Bookmark not defined.), main advantage over QuickTime is<br />
the extremely high output quality. MPEG was developed as an international standard<br />
for use in CD-ROMs, video games, and other media that require quality digital video.<br />
For the trade<strong>of</strong>f <strong>of</strong> using slightly larger files, you get much higher-qualtty video, with up<br />
to 30 frames per second (the same as standard American N).<br />
Process Your Video<br />
The first step in the process is finding video to process. The higher the source<br />
quality, the higher the results after you digitize it. So try to get source thal is htgher<br />
quality than VHS, possibly Hi8 or even Betacam. Hi8 is probably su~table for most Web<br />
projects. If you work in the entertainment industry, you no doubt have access to higherquality<br />
equipment than Hi8.<br />
If you want to work in QuickTime, digitizing is not a problem Many Macintosh<br />
systems come with built-in AN equipment that makes digitizing video as easy as<br />
plugging in a video source and having enough disk space. Error1 Bookmark not<br />
defined, makes the extremely popular Videovision board, which is a hardware solution<br />
for video capture.<br />
When capturing wdeo for use only on the Web, cons~der the size <strong>of</strong> your movie.<br />
Unlike CD-ROM, you probably are not shooting for full-screen vtdeo wtth the best<br />
resolution possible from QuickTime. Instead you are trying to get a small, light image<br />
that looks good with compression. Using the plug-in to embed QuickTime in your Web<br />
page makes a great impact, but you have to plan ahead <strong>of</strong> time as to how large or<br />
small you want the movie to be. Choose standard sizes to capture video; for the Web<br />
the standard is a small 160x120 pixels.<br />
Sound Advice<br />
Sound is a very important element in video that has been sadly neglected by<br />
many people. Your best bet for achieving quality sound is to get an audio-editing<br />
s<strong>of</strong>tware package, and treat the sound in your video as a separate element that needs<br />
special attention. Separate the audio from your video (in QuickTime the easiest way to<br />
do this is with MoviePiayer 2.1 and exporting the audio to AIFF). Listening to the audio<br />
separately with headphones (preferred) or decent speakers gives you a better Idea <strong>of</strong><br />
what people will hear. W'tether or not people who download the video actually pay
special attention lo the audio separately is not the issue; poor audio quality will affect<br />
their overall impression <strong>of</strong> the video quality.<br />
Tools like SoundEdit 16 from Errorl Bookmark not defined. allow you to<br />
remove the sound from QuickTime files and edit it like regular audio, adding filters and<br />
equalization that will be necessary to get powerful sound out <strong>of</strong> your video. Another<br />
important feature in the latest release <strong>of</strong> SoundEdit 16 is built-in IMA sound<br />
compression for QuickTime, which allows 4:l compression <strong>of</strong> the audio track in movie<br />
files.<br />
The final process <strong>of</strong> getting your video digitized and ready for the Web is<br />
compression. For QuickTime there are several applications that just handle<br />
compression. The most popular compression is Errorl Bookmark not defined., a<br />
cross-platform compressionldecompression s<strong>of</strong>tware package that has been used by<br />
many companies (including Errorl Bookmark not defined., makers <strong>of</strong> PC audio and<br />
video equipment). Cinepak is the best compression method for most video needs,<br />
although using it can be time-consuming, and balancing image quality and compression<br />
can be tricky. On the audio side. the previously mentioned IMA supports 4:l audio<br />
compression at 16 bits <strong>of</strong> resolution. This allows your audto to sound great while not<br />
becoming a burden in terms <strong>of</strong> bandwidth.<br />
Upload Itl<br />
Once you have produced your video, getting it on the Web is an easy process. If<br />
you use an Internet Service Provider, find out how much dlsk space you are allowed to<br />
use. if you have several large video flles to upload, you may be exceeding your disk<br />
quota. Most lSPs have a quota on bandwidth as well, and if your videos are popular,<br />
you may break this quota. A typical quota is transferring 200 to 300 MB a day. If you<br />
have a 2 MB movie file, it will take only 100 downloads a day to exceed your quota.<br />
After uploading the file, you'll have to create a link to it on your Web page.<br />
Pages with video commonly will have a JPEG screen shot <strong>of</strong> the video at the actual<br />
size (sometimes people will enlarge the image, but this fools people into thinking the<br />
video size is larger than it is). Next to the screen shot, tell the viewer what format Ihe<br />
video Is in, ~(s length in minutes, and how much disk space it takes up. Leaving out this<br />
information will hurl your chances <strong>of</strong> people actually viewing the clips, as people don't<br />
want to download sotnelillng they are not sure about. As a final check, download the<br />
file yourself, using several different viewing programs, to make sure it works with all <strong>of</strong><br />
them from the Web.
Streaming AudloNideo<br />
"Streaming" audio and video over the Web has received lots <strong>of</strong> attention this<br />
past year. It started with Errorl Bookmark not defined., which allowed streaming<br />
audio. The quality was AM or worse, but it allowed near-instant playback without waiting<br />
for a full download, and this caught a lot <strong>of</strong> people's ears Shortly after RealAudio<br />
became popular. Xing Technology released Errorl Bookmark not defined.. which<br />
claims to deliver streaming video over even 14.4-Kbps modems. Over a faster<br />
connection, like a TI line, I was able to get a large color image that was very out <strong>of</strong><br />
sync with the audio, with audio qual~ty that was about the same qualily <strong>of</strong> RealAudio.<br />
This level <strong>of</strong> video quality would not be acceptable with conlent like sporting events and<br />
actlon films, but for a live event such as a press conference it is very suitable.<br />
The concept beyond these stream~ng technologies is that complicated<br />
compression s<strong>of</strong>tware is Installed on the server side that encodes the video so that it is<br />
able to be sent to the client for real-time presentations in spite <strong>of</strong> severe bandwidth<br />
I~mitations. The client IS expected to download helper apps that can read the<br />
compression type that the server s<strong>of</strong>tware is sending The helper apps are usually<br />
given away free to encourage a large user base. The server s<strong>of</strong>tware is given out for<br />
trial per~ods and is usually pretty expensive for full ve~.sions
WORLD WlDE WEB, THE INFORMATION STORE HOUSE<br />
Bijaya Kumar Panda', Ashwinl Kumar Nayak*,<br />
A. K. Roy" and P. K. Satapathy*'<br />
MCA Third Year Students <strong>of</strong> IGNOU (Utkal Univenily Sludy Centre)<br />
"Computer Section<br />
<strong>Central</strong> institute <strong>of</strong> Freshwater <strong>Aquaculture</strong><br />
Kausslyagsnga, Bhubaneswar 757002<br />
INTRODUCTION<br />
Traditionally, lnternet had four application as follows:<br />
E-mall:The ability to compose, send, and receive electronic mail has been around<br />
since early days <strong>of</strong> ARPANET and is enormously popular.<br />
News: News groups are specialised forums in which users with same interest can<br />
exchange messages. Thousands <strong>of</strong> news groups exist, on technical and<br />
nontechnical topics.<br />
Remote Login: Using telnet, Rlogin or other programs, users anywhere in the lnternet<br />
can log into any other machine on which they have an account.<br />
File transfer: Using FTP programs, it is possible to copy files from one machine on the<br />
internet to other machine.<br />
Until 1990's the lnternet was largely used by academic, Government and<br />
industrial researchers. One new application called World Wide Web(WWW) brought<br />
revolution in lnternet and brought millions <strong>of</strong> new non-academic users to the net.<br />
WHAT IS WORLD WlDE WEB (WWW)<br />
The WWW is an architectural framework for accessing linked documents spread<br />
out over thousands <strong>of</strong> machines all over the Internet. It is a huge collection <strong>of</strong><br />
interconnected hypertext documents. A hypertext document is a document that contain<br />
hot links to other documents. Hypertext links are usually visible as highlightedlunderline<br />
words in text, but they can also be graphics.<br />
BIRTH OF WORLD WlDE WEB<br />
The web began in 1989 at CERN, the European center for nuclear research.<br />
The initial proposal for web <strong>of</strong> linked documents came from CERN physicist Tim<br />
Berners-Lee in march 1989. The first prototype was operational eighteen months later.<br />
In December 1991 a public demonstration was given at the Hypertext '91 conference in<br />
San Antonio, Texas. The first graphical interface, MOSAIC, was released in February<br />
1993.
WHAT IS WEB PAGE<br />
As mentioned earlier the web consists <strong>of</strong> a vast world wide collection <strong>of</strong><br />
documents. These documents are called Web pages or simply Pages. Each page may<br />
contain links to other related pages anywhere in the world.<br />
In addltion to having ordinary text and hypertext, web pages also contain icons,<br />
line drawings, maps and photographs Each <strong>of</strong> these can be linked to another page.<br />
Clicking on one <strong>of</strong> those elements causes the browser(Programs which enable us to<br />
view pages) lo fetch the linked page and display it. The steps lhal occur between the<br />
user's click and page being displayed are as follows.<br />
The browser determ~nes the URL(Uniform Resource Locator ) by seeing whal<br />
was selected.<br />
The browser asks the DNS for IP address <strong>of</strong> the concerned server<br />
DNS replies with the IP address.<br />
The browser makes a TCP connection to port 80 <strong>of</strong> the concerned sewer.<br />
It then sends a GET file command.<br />
The concerned server sends the required Itla.<br />
The TCP connection is released.<br />
The browser displays all the text In the {lie.<br />
The browser fetches and displays all images in the f~le<br />
WHAT IS HOME PAGE<br />
For a user the home page IS the starting pant for exploring a single site on the<br />
whole WWW. It can be thought <strong>of</strong> as a kind <strong>of</strong> "Main Menu". A homepage outline your<br />
options- at least moving along the hnks from this site to other po~nts <strong>of</strong> i~:!erest, as<br />
imagined by the publisher <strong>of</strong> this site. To whomever publishes 11, the homepage is a<br />
part <strong>of</strong> advertisement, part <strong>of</strong> directory and a part <strong>of</strong> part <strong>of</strong> "reference librarian".<br />
Just to clarify lhings a bit, a website may be a s~ngle page or a collect~on <strong>of</strong><br />
pages. The main page among a number <strong>of</strong> pages is the homepage A web server is<br />
the machine and s<strong>of</strong>tware lhat house lhe web site. In feebly a home page is e<br />
hypedext document Ihet has links to <strong>of</strong>her points on Ihe web.<br />
The web is based on two standard. The HlTP protocol and HTML language.<br />
HTTP stands for Hypertext Transfer Protocol and it describes the way that hypertext<br />
documents are fetched over Internet. The HTTP protocol consists <strong>of</strong> two fairly distinct<br />
items: the set <strong>of</strong> requests from the browser to servers and a set <strong>of</strong> response going<br />
back the other way. All newer versions <strong>of</strong> HTTP supports two kinds <strong>of</strong> requests: simple
equest and full request. A simple request is just a single GET line naming the desired<br />
page, without the protocol verslone. The response is the raw page without any headers,<br />
no MIME and no encoding. The H'ITP was designed with an eye to future object<br />
oriented applications. HTML is the abbreviation for Hyper Text Markup Language and<br />
it specifies the layout and linking command present in the hypertext documents<br />
themselves.<br />
HOW TO WRITE A WEB PAGE IN HTML<br />
In HTML a user can produce web pages that include text, graphics and pointers<br />
to the other web pages. Web pages require mechanisms for naming and locating<br />
pages. Each page is assigned a URL that effect~vely serves as the world name.<br />
Ex:<br />
http'-:&Qlabouvhlslorv.html<br />
1 1 1 1<br />
protocol sewer address port no<br />
directory and file name<br />
A proper web page consists <strong>of</strong> a head and body enclosed by<br />
HTML> ....... tags. The commands inside the tags are called directives. HTML<br />
tags have following format.<br />
to mark the beginning and marks the end <strong>of</strong> it.<br />
Some popular tags are given below:<br />
TAGS -<br />
Declares the web page to be written in HTML.<br />
Delimits the pages head<br />
Defines the title<br />
Delimits the page's body<br />
Deltm~ts a level I header. 1=1..6.<br />
Set ... in bold face<br />
Sel..in italics<br />
Bracket an unordered list<br />
Bracket a numbered list<br />
Bracket a menu <strong>of</strong> <br />
Start a list <strong>of</strong> item<br />
Force a break
Form <br />
-<br />
Horizontal<br />
......*RE><br />
Do<br />
<br />
Load<br />
-=A HREF=' ....' >..,
Include thumb nails for large downloaded images<br />
Remember that people will access your page using different browsers and different<br />
platforms<br />
Keep file names short: make them consistent<br />
Tell people the size <strong>of</strong> downloadable 61es if you include them<br />
Findout if you need permission to use text or images created by someone else<br />
Establish who is going to webmaster and make link on your page leading<br />
webmaster<br />
Build prototype and test thoroughly<br />
Announce and publicize your page where possible
Designing and planning Your Database<br />
In designing a database you plan what tables you require and what data they wiit contain.<br />
You also delemine how the tables are related.<br />
You must determine what things you want to store information about (eech one is an entily)<br />
and how these things are related (by a relationship) A useful technique In designing your<br />
database is to draw a pidura <strong>of</strong> your tables. This graphical display <strong>of</strong> a database is called<br />
an Entlty-Relationship (€4) diagram. Usually, each box in an E-R diagram ccrmsponds to a<br />
table in a relational database, and each line from the diagram mrresponds to a forelgn key.<br />
Entity<br />
Each table in the database describes an entity; it Is the database equlvatenl ol a noun.<br />
Employees, order Items, departments and produds are all examples <strong>of</strong> entities represented<br />
by a table in a database The entilies that you build into your database arise from the<br />
adivities for which you will be uslng the database, whether that be lracklng $ales calls.<br />
malntainlng employee infomation, or some other adhky.<br />
Relationship<br />
A relationship between entities is the database equivalent <strong>of</strong> a verb. An employee Is<br />
associated with a department, or an <strong>of</strong>ftce is located In a city Relationships in a database<br />
may appear as foreign key relationships between tables, or may appear as separate tables<br />
themselves. The relationsh~ps in the database are an encoding <strong>of</strong> rules or praclicas<br />
gweming the data in the table. If each department has one department head. then a sinple<br />
column can be buin into the depslrhent table to hold the name <strong>of</strong> the department head.<br />
When these rules am built Into the drudure <strong>of</strong> the database, there Is no pmlsion lor<br />
exceptions: there is nowhere to put a semnd department head, and duplicating the<br />
department entry would involve duplicating the deparlmenl ID. wh~ch is the prlmary key.<br />
Relationships between tables<br />
There are three kinds <strong>of</strong> relalionship between tables:<br />
One-Imny relationship<br />
Onelo-one relationships<br />
. Many-to-many relawnshlps<br />
Them am five major d ep in We dwn process.<br />
Step 1: identify entiUes and relationships<br />
Step 2: identify the required dsts<br />
dep 3. nomlize the data<br />
Step 4: resolve the Wonships<br />
SIep 5: verify the d&jn
ldenttfy entities md relationships<br />
To idun\Hy the entities in your design and their relatbnshlp to each other:<br />
1 .Define high-lewl actlviU.s. ldenbfy !he general erne you will ma thk3 dalebase for.<br />
For exarnfle, you may want to keep trad <strong>of</strong> infomation about employees.<br />
2.ldentify entities. For lhe Hsl <strong>of</strong> aduities, Identify the wbjed areas you need to maintain<br />
information abouL These will become taMes. For example. hire employees, essign to a<br />
department, and determine a sWU level.<br />
3.ldentify relattonrhips. Look at the adiiities and determine what the rela(ionships will be<br />
between the tables. For example, there is a relationship between departments and<br />
employees. We glve this relationship a name.<br />
4.Bre.k down the activities. You started out with htghlwel adivies. Now examine these<br />
acllviiies more arcfully lo see If some <strong>of</strong> them can be broken down Into lower-level<br />
act~iiles. For example, a Iilgh-level activity sub as maintaln employee information can be<br />
broken down inlo:<br />
1 .Add now employees<br />
2.Chanpe existing employee information<br />
3,Delele terminated employees<br />
To identify the required data:<br />
1 .Identify supporting dala.<br />
2.Llst all tlie dala you will need to keep track <strong>of</strong>. The data that describes the table (subject)<br />
answer8 the questions who, what, where, when, and why.<br />
3.Set up data for each table.<br />
4.Llst the evailable data for each table as il seems appropriate righl now.<br />
5.Sei up dais for each relationshlp.<br />
0.List the data that applies lo each relationship (if any).<br />
Nonnallze th* data<br />
Normallzatior~ Is a series <strong>of</strong> tests you use to eliminate redundancy In the data and make<br />
sure the data is associated wtth the coned table or relatlonshlp.<br />
To normalize the dala:<br />
1 .List tha data:<br />
2.ldenllfy at least one key lor each table. Each table must have a primary key.<br />
3.ldmtlfy keys for relatlonshlps. The keys for a relaUonshlp am the keys lrwn the two tables<br />
it joins.<br />
4.Check for calculated dala in your supporting dala IW. Calculsted data is noi normally<br />
stored in the datab.se.<br />
S.Pul data In nnl nonna) Ion:<br />
6.Remwe repeatlng dala fmm tables and relationships.<br />
.Create one or more tables end relalionships with the data you remwe.<br />
0.Put data In second normal lorm:<br />
9.idenlWy tables and relationships with mom than one key.<br />
10.Remwe data that depends on only one par! <strong>of</strong> the key.<br />
11 .Create one or more tables and relaUonshlps wiM the data you rumwe.<br />
12.Put data In third normal form:<br />
13,Remove dala that depends on other deta In the table or relationshlp end not on the key.<br />
14.Create one or more tables and relaUoruhips with the data you rumwe.<br />
~ut~ng dam in first n o m ronn ~<br />
Remove repeatlng groups.<br />
To test for lint normal form, remwe repeating groups snd putthem into a table <strong>of</strong> their own.
Putting data in second ml fwm<br />
Remove data that does not depend on the W le key.<br />
Look only at tables end relationships Vlsl have mom than one key. To tesi for second<br />
normal fonn, remwe any dala that does not depend on the whale key (all the cdumns thal<br />
make up the key).<br />
Putting data in thkd noml<br />
form<br />
Remove dab that doesn't depend diredly on the key.<br />
To test for thild normal form, remove any dala that depends on other date rather than<br />
diredly on the key<br />
resolve the relationships<br />
When you finish the normalization process, your design is almost cwnplele. AH you need lo<br />
do is resolve the relationships.<br />
5<br />
Resolving relationships that carry data<br />
Some <strong>of</strong> yo esolving relationships thal carry date<br />
Some <strong>of</strong> your relationships may csny dala. This snuation oRen ocwrs in many-to-many<br />
relationships. ,<br />
-- I.<br />
-. I"<br />
When this is the case, change the relaUonship to a lable. Thq key to tho new table mains<br />
the same as It was for the miationship.<br />
Rarolvfng rol#Uonrhlprr Ih8t do not cmy data<br />
In order to Implement relationships thal do not cony data, you need to daRns forelgn keys. A<br />
fonlgn key Is a column or set <strong>of</strong> columns thal wnlalnr prlnury key values from another<br />
table. The fmlgn key allows you to aces, data frwn more than one table al one Ume.<br />
There are some baelc rules that help you dedde where to put the keys:<br />
One to many In a one-to-many relalionship, the primary key In the one Is canled In the<br />
many. In this example, the fomign key goes into the Employee table.
One to one in a one-to-one relationship. the Iombn key can go into enher table. If I is<br />
mandatory on one Me, but not on the other. I( shouM go on the mandatory side. In this<br />
example. the forelgn key (Head ID) is in the Department table bemuse # is mandatory<br />
there.<br />
-..I-<br />
Many to many In a many-temany relalionship, a new table is created with two foreign keys.<br />
The existing tables are now related to each other through lhls new table.<br />
Choosing primary and foreign keys<br />
The primary key is the column or columns that uniquely identify the rows in the table. If your<br />
tables are properly normalized, a primary key should be defined as part <strong>of</strong> the database<br />
deslgn.<br />
A forelgn key is a column or sel <strong>of</strong> columns that contains primary key values from another<br />
table. Foreign key relationships build one-to-one and one-to-many relationships into your<br />
database. it your des~gn is properly normalized. foreign keys should be deftfled as part <strong>of</strong><br />
your database design.<br />
verify the design<br />
Belore you implement your design, you need to make sure it suppons your needs. Examine<br />
the activities you Mentifled at the stail <strong>of</strong> the design procsscr end make sure you can access<br />
all the data the adhrities quire:<br />
Can you find e path to get all the inlomalion you need<br />
Does the design meet your needs<br />
Is ell the mquired data wadable<br />
If you can ansner yes to el the questions above, you am ready to implement your design
DATABASE ON FISH DISEASES<br />
6. B. Sahu ,A. K. Roy, P. K. Satapathy, S. C. Mukhrrjee and S. A<strong>yy</strong>appan<br />
Centre1 Instilute <strong>of</strong> Freshwater Apueculture<br />
Keusalyeganga. Bhubaneswar - 751002<br />
INTRODUCTION<br />
Fish health related information is <strong>of</strong> vital importance in modern aquaculture. A<br />
system for rewrd keeping and health monitoring Is essential for successful aquaculture<br />
production. The basic methodology to develop animal health and disease information<br />
system for farm animals has been described by Hall (1978). This present system is<br />
designed to record diagnosis and diseases in a simple way by transferring data into<br />
separate files. Limitations <strong>of</strong> detail information on fish diseases, definitions<br />
(nomenclature) etc. have been considered and due care have been taken during<br />
development <strong>of</strong> the database information system. Database system to record<br />
exclusively fish disease events have not been reported.<br />
OBJECTIVES<br />
The system can fulfil the following objectives<br />
1. Effective surveillance and monitoring <strong>of</strong> health and disease status in fish<br />
maintained in a farm1 aquaculture pockets.<br />
2. Precise recording and processing <strong>of</strong> regularly gathered morbidity and morality<br />
data to produce comparable indtces <strong>of</strong> diseases.<br />
3. Rapid retrieval <strong>of</strong> disease information and identification <strong>of</strong> variations in disease<br />
events <strong>of</strong> individuals and in fish stock.<br />
4. Standardized storage <strong>of</strong> epidemiological data for retrospective studies.<br />
5. Assessment <strong>of</strong> impact and economic measures adopted to prevent, control,<br />
eradicate and treat diseases and improve aquaculture productivity.<br />
6. Forecasting <strong>of</strong> fish diseases and tips for aquaculture farm operations.<br />
MINIMUM SYSTEM REQUIREMENT<br />
The fish disease data and information system for organized aquacutture sectors<br />
needs the following minimum computer equipment (Hardware) and programmes.<br />
1. IBM PC with a minimum <strong>of</strong> 640 KB memory and 2 x 5.25 360 KB DSDD Floppy<br />
drive.<br />
2. Matrix I Line printer.
The dalabase formal, post-mortem report forms, dala didionary for data entry<br />
have been developed by Fish pathology Division, CIFA, Kausalyaganga, Bhubaneswar.<br />
The system includes the following scientific aspects (s<strong>of</strong>tware):<br />
a) Standardize definilton <strong>of</strong> disease events and diagnosis.<br />
b) Systematic classification <strong>of</strong> diseases.<br />
c) Forms for recording data on clinical, post-mortem, fish stock (pond)<br />
environment and Laboratory examination.<br />
d) Use <strong>of</strong> standard disease indices.<br />
e) Formats for reporting informations regularly<br />
I) Computer programs (s<strong>of</strong>tware) for processing disease data<br />
The disease data will be processed in MS-Excel, from which statistical data<br />
analys~s can be done and finally the output can obtained in graphical form. The<br />
RDBMS packages like ORACLUFOXPRO can be used for data entry and for<br />
sequential querry processing to retrieve information, E-mail can be used extensively to<br />
collect disease informallon at a cheaper and faster way wherever the facility is<br />
available. Mailing list <strong>of</strong> farmers can be maintained to provide Information <strong>of</strong> disease<br />
incidence and precautionary measures to be taken.<br />
CONTENT OF THE SYSTEM<br />
1. Standardize definitions <strong>of</strong> disease events and diagnosis.<br />
2. Systematic classification <strong>of</strong> disease.<br />
3. Forms for recording data at clinical, post-mortem, Laboratory examinations.<br />
4. Use <strong>of</strong> standard disease indices.<br />
5. Formats for reporting information regularly.<br />
6. S<strong>of</strong>tware for processing disease data.<br />
USES OF FISH HEALTH AND POND ENVIRONMENT DATA<br />
A source <strong>of</strong> information for monitoring health status <strong>of</strong> cultured fish stock.<br />
A reminder for prophylactic measures to be undertaken in a aquaculture farm<br />
To monitor optimal productivity <strong>of</strong> the fish farms.<br />
A source <strong>of</strong> information about previous Illness and therapy.<br />
A source <strong>of</strong> information for epidemiological research.<br />
A source <strong>of</strong> clinical and laboratory information.<br />
A source <strong>of</strong> information for planning fish health.<br />
A source <strong>of</strong> information for calculating cost <strong>of</strong> disease and disease control.
INFORMATION GENERATION<br />
Information are generated through the following records<br />
1. Fish stock data register<br />
a) <strong>Aquaculture</strong> farm/sector report<br />
b) Monthly weight gain report<br />
c) Fish stock strength report<br />
d) Monthly Morbiditylmortality report<br />
2. Listing <strong>of</strong> all d~seas events<br />
3. Comparative pattern <strong>of</strong> disease encountered clinically or at post-mortem.<br />
4. Specific morbidity mortality rates <strong>of</strong> different species, class, sex, season.<br />
environment, locality etc., or combinations as desired.<br />
Fish disease information gathering suffer from deficiencies at ail levels in India.<br />
The information available at presenl 1s not effective for surveillance and monitoring <strong>of</strong><br />
fish diseases. An aquaculture information system for the Indian situation has to be<br />
developed at three organizational tlers i.e. 1. National 2. State or Regional and 3.<br />
Farm level.<br />
The uniform data generation, recording and retrieval helps in monitoring <strong>of</strong> fish<br />
health. However, the organizational necessities to provide routine health care,<br />
laboratory diagnosis, drug inventory, schedules <strong>of</strong> vaccination, deworming, d~pping etc.<br />
can not be over ruled. The fish disease information system at the national and regional<br />
levels will be similar, except possibly for the quantum <strong>of</strong> data processed.<br />
SYSTEM IMPLEMENTATION<br />
1. Fish disease information management :<br />
a) Organized farm level :<br />
The information system at organized farm levels has to be different as It will<br />
record and process primary data. The data base maintained at the farm level will be<br />
used for purpose <strong>of</strong> monitoring disease status and production efficiencies (Maw el a/.<br />
1990) . Recording <strong>of</strong> disease event at the farm level will be for the cultured fish in farm<br />
ponds. This system has been designed to record disease related data at organized<br />
farms engaged in aquaculture research. These farms may also be the sentinel farms<br />
for a national disease information system.
) Fanner parlicgalory rapid appmisal (PRA) :<br />
PRA approach and methods have been tried to help the aquaculture farmers to<br />
do their own analysis on fish disease epidemiology, surveillance and monitoring and<br />
make their own needs and priorities known to scientists. It has been found out that<br />
PRA satisfies the acute decision making needs <strong>of</strong> fish disease epidemiology,<br />
aurveiilance and monitoring. Participatory methods <strong>of</strong> 'visualisation', such as<br />
mapping, modeling, matrices, linkages and casual diagramming are powerful, valid<br />
and reliable when well facilitated and performed. PRA is a low cost diagnostic method.<br />
which can be very well applied to fish health surveillance and monitoring. PRA tool has<br />
already been evaluated under 'Institution Village Linkage Programe (IVLP). ClFA<br />
Centre, Kausalyaganga and reported (Sahu el al., 1998) (Please see Annexure ).<br />
CONCLUSION<br />
It has been felt that disease has been and will continue to be a major constraint<br />
to the development <strong>of</strong> aquaculture. Further it has been witnessed high loss <strong>of</strong> revenue<br />
due to d~sease and health related problems. So the importance <strong>of</strong><br />
epidemiologylepizootiology in providing solulioi to aquaculture health problems can not<br />
be overlooked. Fish health diaanost~cians, - researchers and extension scientists should<br />
be familiar w~th on-fan-conditions, diagnostics and therapy. So that the informed<br />
decisions on control and treatment can be made. Further research on epidemiology<br />
and epkootiology <strong>of</strong> aquatic animal diseases will help to develop a comprehensive list<br />
and database on notifiable fieh diseases.<br />
1 The database is expected to provide a feed back to researchers, diagnosticians<br />
for making improvement8 in technology and disease surveillance.<br />
2. Thrust areas <strong>of</strong> need at regionallnational level.<br />
3, Identification <strong>of</strong> appropriate research need and refinement <strong>of</strong> methods to<br />
conduct flsh health research programme.<br />
4. Ranking <strong>of</strong> diseases and syndromes causing key production constraints in<br />
aquaculture.<br />
5. Medium range fish disease forecast can be made from time series data on<br />
organized farms and fish production pockets and fish farmers can be alerted<br />
before farm operations .<br />
REFERENCES<br />
Inglis. V . Roberts, R.J., and Bromage, N.R. (1993) Bacterial Diseases <strong>of</strong> Fish, Oxford Blackwell<br />
Scienlifi Publrcalion. London.<br />
Maru, A. Srivastava, R.S.; P. S. Lonkar, S.C. Dubey and A.L.Choudhury (1990). Sheep<br />
research Database, CSWRl Pubkalion, CSWRI, (ICARJ Avikanagar 304501, Rejasthan.<br />
India.<br />
Sahu. 0. B., Radheyshyam., Uuldeep Kurnar.. Mukherjw; S. C. and S. A<strong>yy</strong>appan (1998).<br />
Farmer participatory flsh disease su~elllrnce and monitoring using PRA tooh, Trop&al<br />
AgdcuHural Resoetch end Extension, l(2) : 1 - 14 pp.
Visualisatio~i <strong>of</strong> Fish disease related infor~l~atior~ tllrougl~ PIM diagnosis<br />
SEASONALITY OF FISH DISEASE<br />
I.".,"<br />
I.*."*.<br />
Il..7.r(.*.<br />
I..."",*.*.<br />
I...*.,",.<br />
.,I..*.<br />
I".<br />
&5-+-/J<br />
I I I . . .<br />
* . .<br />
UOIIVUI W PWCIDENCE 1 J.n 0.d<br />
4 . 1 , 1 ,<br />
FISH DISEASE CALENDAR<br />
1tMI<br />
E U S INCIDENCE It4 VtLLAOES AflOUNO ClFA fMM
SPAWN MORTALITY<br />
FRY MORTALITY<br />
!US<br />
rn<br />
FlNOERLlNO MORTALITY<br />
Lulrovhlc~lion<br />
18%<br />
JUVENILE MORTALITY<br />
FACTORS RESPONSIBLE FOR POND FISH LOSSES
QUANTITATIVE AND QUALITATIVE FISH PRODUCTION DATABASE<br />
9. B Sahu, J. K. Jena, A.K. Roy and S. A<strong>yy</strong>appan<br />
<strong>Central</strong> lnsl~lule <strong>of</strong> Freshwater <strong>Aquaculture</strong>.<br />
Kausalyaganga, Bhubaneswar-751002, Orisse<br />
INTRODUCTION<br />
Fish growth and production related information is <strong>of</strong> vital importance in modem<br />
aquaculture. A system <strong>of</strong> record keeping is essential for the success <strong>of</strong> the production<br />
programmes. The <strong>Central</strong> <strong>Institute</strong> <strong>of</strong> Freshwate <strong>Aquaculture</strong> is worklng to develop a<br />
Computer based system to record and proces quantitative and qualilative fish growth<br />
and production related events in different production systems.<br />
IMPORTANCE OF AQUACULTUE PRODUCTION DATABASE<br />
As aquaculture IS multid~mens~onal ordinary quantltatlve analysis 16 too<br />
Inadequate for arrivlng at any valld consclusion Phys~cal and chemlcal characterist~cs<br />
<strong>of</strong> the water body seed quality, denslty, season, culture system, feeding and<br />
harvesting pattern are the Important factors and proper management <strong>of</strong> all these<br />
factors are essentral for successful operation <strong>of</strong> pcsc~culture act~v~t~es Generally few<br />
major factors are consldered at a tlme, whlle keeping other minor factors at a known<br />
level Even then su~table varlance function are presently not available to compare<br />
product~on parameters from dtfferent water bodles to observe and compare the<br />
treatment effects (Royce, 1996)<br />
USE OF PRODUCTION RELATED DATABASE<br />
Among the many factor, and their interaction influencing the growlh <strong>of</strong> fish are :<br />
genetic make up, species, behaviour, population dynamics, endocrinology and feed etc.<br />
Any single factor should not be consldered in isolation even though overall opt~mising<br />
the various factrors is difficult. Definitive information on optimal growth is lacking for<br />
many culturable species. Growth rates, and qualitative and quanlitative production<br />
parameters under different culture condition can be recorded in a database and<br />
optimum condition for growth can be modelled which would serve as a guide to<br />
researchers and producers (Wathne. 1995).<br />
CONTENTS OF DATABASE<br />
Knowledge <strong>of</strong> production efficiencies and determination <strong>of</strong> growth potentials<br />
which coincide with desired carcass attributes have provided impetus for improvement<br />
in genetic selection and management <strong>of</strong> aquatic animals. The role <strong>of</strong> quantitative end<br />
qualitative carcass data in aquaculture research programmer e~pscialty, genetics and
eeding, production management, feeding and nutrition for evolving suitable<br />
breedistrain for quantity and quality fish production can not be over emphasized. For<br />
this to be accomplished, accurate, standard and uniform methods for carcass<br />
evaluation are critically important. The present database is prepared keeping in mind<br />
the information related to : (a) Physical and chemical characteristics <strong>of</strong> water bodies<br />
(b) seed qual~ty (c) feeding (g) quantitaive production data (growth) and qualitative<br />
(carcass evaluation) production technology informations. Due care has been given for<br />
meterological parameters also.<br />
DATA FILES<br />
The date can be mantained in following data files.<br />
I. Pond environmental records sub database<br />
2. FeedlFertilizer sub database<br />
3. Monthlylfish body weight sub database<br />
4. Meterological record sub database<br />
5. Fishlcarcass quality sub database<br />
6. FishlFlesh quality sub database<br />
1. Pond envlronmental record Sub data bare<br />
1. Sector Code :<br />
2. Pond accession No :<br />
3. Pond size (ha) :<br />
4. Water deplh (m)<br />
5. Stocking density (noslha) :<br />
6. Soil texture (sandylclayielloamy) :<br />
7. Soil available Nitrogen (mg1100g)<br />
8. Soil available Phosphorus (mg1100g)<br />
9. Soil organic Carbon (%)<br />
10. Dale <strong>of</strong> entry :<br />
11. Water transparency (cm)<br />
12. Water temperature ('C) :<br />
13. pH:<br />
14. Dissolved oxygen (mgfl) :<br />
15. Free Cerbon dioxide (md)<br />
16. Total Alkalinity (mg CaCO JI) :<br />
17. Total Hardness (mg CaCOJn ) :<br />
18. Ammonia nitrogen (NH, -N) (md) :<br />
19. Nitrite nitrogen (NO2 - N (mg/L) :<br />
20. Nitrate nitrogen (NO, - N) (mgfl) :<br />
21. Phosphate phosphorous (P205P) (mg~l) :
22. Plankton Count (NoA) :<br />
23. Any others :<br />
2. Feed I Fertilizer management Sub database<br />
1. Sector Code<br />
2. Pond accession No:<br />
3. Pond size (ha):<br />
4. Water depth (m) :<br />
5. Date <strong>of</strong> entry :<br />
6. Stocking density (noslha).<br />
7. Lime (kglha) :<br />
8. Urea (kgha) :<br />
9. Single Super phosphate (kglha) :<br />
10. Micronutient (kglha) :<br />
11. Manure( Cowdung/others) (kgha) :<br />
12. Feed (kgldaylarea) :<br />
13. Any others :<br />
3. Monthly1 Periodic fish body weight Sub data base<br />
Sector Code :<br />
Pond accession No.<br />
Pond size<br />
Water depth<br />
Stocking density<br />
Date <strong>of</strong> Weighing :<br />
Age (days) :<br />
1. Species Code ............................ wt (Gms)<br />
2. Species Code ........................... wt (gms)<br />
3. Species Code ............................ wt (gms)<br />
4. Species Code ............................ wt (Qms)<br />
5. Species Code ............................ wt (8ms)<br />
6. Species Code ............................ wt (gms)<br />
7. Others ........................................ wt(gms)<br />
4. Meterological record Sub database<br />
1. Air temperature ("C):<br />
2. Relative humidity (%) :<br />
3. Rain fall (rnmlday) :<br />
4. Sunshine hours (hrslday) :<br />
5. Wind velocity (spm)<br />
6. Any other :
5. Flshl Carcass quallty Sub data base<br />
Annexure - i<br />
6. FlshlFlesh quality Sub data base with indices<br />
Annexure -11<br />
REFERENCES<br />
Dunham, R.A (1995). International Conference on sustainable contribution <strong>of</strong> fisheries lo food<br />
secuirlty, Kyolo, Japan, 4 - 9 Dac. 1995, 15 - 16 pp.<br />
Royce, W. F. (1996), Introduction to the practices <strong>of</strong> fishery sdance, Acedemic Press. 1NC.<br />
Wathne, E. (1995). Stralegies for direct~ng slaughter quality <strong>of</strong> farmed Atlantic salmon (Salmo<br />
solar) with emphasis on diet composition and fat deposition, Dr Thesis, Agricultural<br />
Univenily <strong>of</strong> Noway, N-1432. Aes, Noway.
DATABASE OF INDUCTED BREEDING EXPERIMENTS ON<br />
AN INDIAN MAJOR CARP Labeo mhita (Ham.)<br />
S. D. Gupta, A. K. Roy, S. C. Rath and P. K. Satapathy<br />
<strong>Central</strong> lnstrtute oiFreshwater Aquaculfun,<br />
Kausalyaganga, Bhubaneswar - 751 002<br />
INTRODUCTION<br />
Over the past years huge data have been accumulated on the breeding<br />
experiment <strong>of</strong> Labeo rohita (Ham.) conducted at CIFA. An attempt IS being made to<br />
form a database <strong>of</strong> breeding experiments using standard techniques applicable for<br />
computerized relational database management system followed by multivariate<br />
analysis which is likely to address a variety <strong>of</strong> research questions which have not yet<br />
been attempted in our country so far. Summary <strong>of</strong> parameters studied and preliminary<br />
results are presented below.<br />
Labeo rohrta (Ham ) IS the most consumer preferred culturable lndlan major<br />
carp belongs to famlly Cypnnldae As llke other lndlan major carp Labeo rohrfa (Ham )<br />
do not breed spontaneously In the confined water <strong>of</strong> culture pond, but breeds In nature<br />
In flooded river durlng monsoon Its non-spontaneous breedtng In captive water may<br />
be due to Inadequate secretion <strong>of</strong> gonadotropln, a hormone <strong>of</strong> ~ts own pltultary Thus<br />
an exogenous lnductron <strong>of</strong> hormone for breedlng In capllve water known as Induced<br />
breedlng The prlnclple <strong>of</strong> Induced breed~ng IS to manipulate the gonadotropln pr<strong>of</strong>lle <strong>of</strong><br />
the ~ndtv~dual to the deslred level by adrnln~strat~on <strong>of</strong> pttultary extract <strong>of</strong> other specles<br />
or Isolated concerned hormones<br />
lnduced breeding <strong>of</strong> Labeo rohrta(Ham.) ever since 1957, the initlal success <strong>of</strong><br />
induced breeding <strong>of</strong> Indian major carps by Choudhuri and Altkunht, has began a new<br />
era in Indian carp culture. Induced breedlng by administrat~on <strong>of</strong> pitullary extract's<br />
popularly known as induced breeding by hypophysation. To standardize the<br />
technology <strong>of</strong> induced breeding and to produce adequate quantity <strong>of</strong> seed <strong>of</strong> Labeo<br />
rohita (Ham.) several breeding experiments have been conducted, but no database is<br />
available on the subject. The present communication is an attempt to create some<br />
database on induced breeding <strong>of</strong> Labeo rohita (Ham.). The study pertains to 462<br />
experiments, from July, 1970 to August, 1982 with carp pituitary extract (CPE),<br />
noncarp piluitary extract (NPE) and gonadal concerned hormone (GCH) as inducing<br />
agents. Again the inducing agents have been adminislered in different combination<br />
and in different protocols. Experiments have been conducted within the temperature<br />
range <strong>of</strong> 27.5 to 35°C. Brood body wt. ranges from 0.3 - 2.7 kg (Male) and 0.4 - 3.5<br />
kg (Female). Spawning fecundity varies from 0.03 lakh eggslkg to 4.18 lakhslkg body<br />
wt. <strong>of</strong> the female. Fertilization rate ranges from 0 to 95 percent and spawn recovery<br />
ranges from 0 to 2.83 lakhdkg body wt <strong>of</strong> female.
INDUCING AGENTS AND SPAWNING RESPONSES<br />
Twenty seven types <strong>of</strong> inducing agents have been used in 462 breeding<br />
experiments. These inducing agents are broadly classified as carps pituitary extract.<br />
noncarp pitu~tary extract and marine fish pituitary extracts. Pituitary extracts with<br />
~solated hormone, in combination with salmon pituitary powder etc. Again carp pituitary<br />
extract in aqueous medium for immediate use and in glycerine medium for instant use.<br />
Glycer~ne medium extracts have been tried after 0 year. 1 year, and 2 years, 3 years,<br />
4 years and 5 years intervals.<br />
Table 1. Spawnlng response In Labeo rohita (Ham.) with different lnduclng<br />
hormones<br />
CPE<br />
GCH<br />
Spawnlng<br />
Percentage<br />
Inducing Agents (+)Tive (-)Tive Remarks On Negative(-)<br />
Spawnlng<br />
Acetone preserved 79.7 20.3 Inadequate diet and improper<br />
carp pituitary in queous<br />
gonadal maturation<br />
extract (ACPAE)<br />
Carp pituitary aqueous 88.9 11.9 High temp., unripe gonads,<br />
extract (CPAE)<br />
incorrect doses<br />
Carp pituitary glycerin 57.2 42.8 High temp., unripe gonads. and<br />
extract (CPGE)<br />
some other unknown factors.<br />
Pituitary extracts and 52.4 47.6 Loss <strong>of</strong> potency in more than<br />
other hormone<br />
two years, adverse weather<br />
combination (PEOMC)<br />
condition, and improper gonadal<br />
maturation<br />
NPE Noncarp pituitary 39.6 60.4 Pituitary extract other than<br />
extract (NPE)<br />
freshwater catfishes, carps and<br />
salmon and single dose <strong>of</strong><br />
salmon pituitary powder.<br />
TEMPERATURE AND BREEDING RESPONSE<br />
Water temperature plays a vital role in carp breeding. In the present study <strong>of</strong><br />
Labeo mhifa breeding 73.5% <strong>of</strong> breeding failure is attributed to the water temp r 32%.<br />
Only 26.5% <strong>of</strong> the non responded instances found in the temperature s 31.5'C.<br />
FERTILIZATION EFFICIENCY<br />
Spawn production depends upon the rate <strong>of</strong> fertilization <strong>of</strong> the ovulated eggs.<br />
Fertilization efficacy i 50% is considered as poor fertilization Instances (PFI).
SPAWN RECOVERY<br />
In the present study the fertilized eggs are incubated in both out door hapa<br />
system (OHS) and in Indoor hapa system (IHS). If spawn recovery r 70% out
THE MILLENNIUM BUG OR THE Y2K WAR<br />
A. K. Roy<br />
Eiohfmatics Centre<br />
Cenfml lnslilule <strong>of</strong> Freshweter Aquaculfure<br />
Kausalyaganga, Bhubaneswar 751002<br />
INTRODUCTION<br />
Y2K is an abbreviation which stands for 'year two thousand' (K is representative<br />
<strong>of</strong> a K~lo which is equivalent lo a thousand). The Y2K problem is also known as<br />
MILLENNIUM BUG. The year 2000 (Y2K) problem may be defined as the inability <strong>of</strong><br />
computer program to correctly interpret the century from a date which represents an<br />
year as a two d~g~t value. The war - 'THE Y2K WAR' deals with simple problem that<br />
involves just two d~gits. A wide variety <strong>of</strong> computer programs that display, manipulate<br />
or store dates have adopted the shorthand convention <strong>of</strong> using only the last two digits<br />
<strong>of</strong> the year Many <strong>of</strong> these programs will fail when using dates beyond 1999,<br />
parlrcularly if they compare those dates with earlier dates. It is estimated that the effort<br />
required to identify and fix the problem in all systems may take several years and<br />
thousands <strong>of</strong> programmer's hours to complete. This paper describes types <strong>of</strong> problems,<br />
misconceptions, apprehensions, remedies and opportunities associated with the Y2K<br />
problem.<br />
BACKGROUND OF Y2K PROBLEM<br />
The majority <strong>of</strong> computer applications is use today were developed years ago<br />
when the year 2000 seemed to far in the future to worry about. These programs<br />
historically represented the year portion <strong>of</strong> a date using only two digits. Dates are<br />
critical to computers. Most dates programmed in computers are based on a two-digit<br />
year field for instantce '99" rather than '1999". There are two main reasons why a twodigit<br />
field has been the norm among programmes over the last 50 years, firstly, the high<br />
cost <strong>of</strong> storage in the early days <strong>of</strong> computing and secondly as systems and<br />
applications were constantly being developed and replaced, it was never realised lhat<br />
they would last till the advent <strong>of</strong> new millennium. Some believe lhat this problem is<br />
partly due to farsightedness and partly due to lack <strong>of</strong> resources. The problem exists<br />
for mainframe, mid-range and PC computers alike. The two-digit year field can be<br />
found in microcode, operating systems, s<strong>of</strong>tware compilers, application queries,<br />
production screens and data bases. The problem was not thought <strong>of</strong> earlier, but it was<br />
realised when some sobare which deals with future dates i.e. renewal dale, License<br />
expiry date etc. started giving problems.<br />
As believed, the year 2000 problem comes from, but not limited to, the use <strong>of</strong> a<br />
2-digit year (<strong>yy</strong>) format, instead <strong>of</strong> a 4diiit (<strong>yy</strong><strong>yy</strong>) format for year representation within
programs, databases, files and procomes. As for an example. the year 1997 is<br />
repm~nted as '97'. The year 1998 as '98, and so on. Likewise February 29, 2000 is<br />
represented as 02/29/00 (using MMDDW format) which might bs interpreted as<br />
February 29.1900. Consequently, programs those perform arithmetic operations,<br />
comparisons or sorting <strong>of</strong> date klds to yield correct results when manipulating dates in<br />
the year 2000 and beyond may be affected.<br />
Some <strong>of</strong> the misconceptions about the year 2000 challenge with clar~ficalion are<br />
as follows.<br />
i) That the problem occurs only when or after the century rolls over<br />
ii)<br />
iii)<br />
That it is a hardware clock problem whrch should be solved by computer<br />
vendors.<br />
That this is a problem that occurs only in mainframe systems and or core<br />
application<br />
i) In forecasting applications thal deal with fulure dates will face problems In<br />
advance <strong>of</strong> the year 2000. Cases that deal with expiration dates that go beyond<br />
the 2000 are already at risk.<br />
ii)<br />
iii)<br />
iv)<br />
Contrary to the bel~ef that it is a hardware problem, in realty the problem comes<br />
mostly from application programs.<br />
Any program or system can be affected if it uses only two digits for<br />
representation <strong>of</strong> year in any file, database, logs wilh 2-digit year fields and any<br />
data entry, update and output processing that employs 2-digit year fields.<br />
Y2K problem will have impact at all levels in Hardware level, operation system<br />
level and application s<strong>of</strong>tware level.<br />
THE NATURE AND STRATIFICATION OF THE PROBLEM<br />
The year 2000 problem (phenomenon) has broad impact and can be visible in<br />
various ways. This phenomenon has both a information processing systemwide and an<br />
institutionwide impact on computing environment. Within system, this phenomenon can<br />
originate from or affect many key components like hardware, s<strong>of</strong>tware, people, data<br />
and procedures. Instlutionally this can act as the contaminated data files to other<br />
computing systems inside or outside the organizations. This is a complicated problem<br />
wilh far reaching consequences but it is not beyond solution. This problem may also<br />
affect microcoded hardware like VCR and digital clocks. The year 2000 syndrome is
compounded by many varialions used to ex- year and date notatio~ in data, the<br />
mathematical calculations performed on thoae data notations and in many places<br />
where date data may occur. These variations are stratiii as follows:<br />
w: Likely problems may be encountered when the 1st two digits in a<br />
year are assumed to be 19 and ignored during data entry, manipulation or hard<br />
coded on output.<br />
P u r e d Sometimes special values <strong>of</strong> the last two digits in a<br />
year might be used for a special purpose, for example 99, 365199 or 12.31.99<br />
might be used to indicate 'no expiration date' or 00 to indicate an 'unknown<br />
year'.<br />
incorrect Many programs determine the date format (MM<br />
DD YY or DD MM YY or YY MM DD) by testing an appropriate part <strong>of</strong> the dale<br />
field. A value <strong>of</strong> zero might be considered as lack <strong>of</strong> any date at all.<br />
Arilhmrllc: Many arithmetic calculations that operate on dates with 2-digit<br />
year representation might have potential danger. A person with a birth year <strong>of</strong><br />
1951 will be considered to be 51 years old rather than 49 years old in 2000 if<br />
the year 1951 and 2000 are represented by 51 and 00 respectively.<br />
SPdlng; When two digits are used to represent a year, programs that collate year data<br />
will sort that data out <strong>of</strong> sequence if there are dates both before and afler the<br />
year 2000 transition.<br />
Archival: Data arch~ves like magnetic tapes <strong>of</strong> data bases containing students<br />
records or research data or financial records may have fixed 2digit year data<br />
should not be modified. Instead special program may be written to read and<br />
convert archival data particularly if the data are to be used in union with data<br />
from beyond 1999.<br />
D s t a a x c h n n g a ; When data are to be exchanged between systems, there occurs a<br />
special case <strong>of</strong> the year 2000 mitigation. There must be close co-ordination<br />
between systems updates on both sides <strong>of</strong> exchanges otherwise the receiving<br />
systems may fail.<br />
Sometimes date information is used by the system as<br />
part <strong>of</strong> their algorithm to generate a unique key or serial number. If a 2 digit<br />
year is used, thls may cause confusion in some cases. This type <strong>of</strong> problem is<br />
likely to be an issue only with datasets covering more than 100 years.
Lrar,: This is not a 2digit problem rather a problem in the year 2000,<br />
2400 etc. The year laOO is not a teap year because it is not a multiple <strong>of</strong> 400<br />
but 2000 is a leap year. Date conversion routines may not have been<br />
programmed to take into account this anomaly since it occurs only once in 400<br />
years.<br />
Some <strong>of</strong> the problems caused by the identification <strong>of</strong> the 2000 as a non-leap<br />
year that would manifest in dates after February 28 are as follows.<br />
i) Dav - - calculations (the year 2000 has 366 days not 365)<br />
ii) -<strong>of</strong>-<br />
the - N&<br />
iii)<br />
calculations (March 1, 2000 is a Wednesday, not a Tuesday<br />
which is February 29,2000.<br />
Week calculation:<br />
The 1 lth week <strong>of</strong> the year 2000 is 5 through 1 I March. not 6 through 12 March.<br />
APPREHENSIONS AND REMEDIES OF Y2K CRISIS<br />
The impact will be tremendous not only for the business community but for the<br />
community at large. All the areas like banking, budgeting, accounting, stock market<br />
licensing, reservations, inventory, credit card transaclions, forward planning will be<br />
affected due to Y2K crises.<br />
The dimensions <strong>of</strong> this challenge are enormous Gwen the societies reliance on<br />
computers, the failure <strong>of</strong> systems to operate properly can mean anything from minor<br />
inconvenience to major problems. Licenses and permits not issued. Payroll medical<br />
and academic records malfunctioning. Errors in banking and finance. The bug affects<br />
computations which calculate age, sort by date, compare dates or perform other<br />
specialised tasks.<br />
Some s<strong>of</strong>tware vendom have developed modern tools as a remedy in the<br />
process. But these are not guarantee to solve all problems but will likely identify where<br />
problems exist and recommend solutions, speeding the process .<br />
STRATEGlES FOR ELIMINATION OF Y2K PROBLEM<br />
For running application s<strong>of</strong>twares in 21st Century a strategy should be decided<br />
for making the systems Y2K compliant. An inventory <strong>of</strong> all such s<strong>of</strong>twares has to be<br />
made and classified keeping in view the following points.<br />
i) Whether the s<strong>of</strong>tware will run beyond year 2000<br />
ii)<br />
Whether the s<strong>of</strong>twares involve computations on same future dates.
iii)<br />
iv)<br />
Whether, the existing s<strong>of</strong>twares can be replaced by the other versions apart<br />
from being Y2K compliant.<br />
Whether all such sohares which are yet to be developed in such a way that<br />
they are Y2K compliant.<br />
It is clear that not everything has to be converted. Communicating tools and<br />
hardwares also has to be Y2K compliant became these involve date and time. There<br />
are some s<strong>of</strong>twares which are very critical. These are the real time systems like flight<br />
monitoring, the computers <strong>of</strong> aircraft, spacecraft and radar system etc.<br />
Business Opportunity<br />
According to the experts, solutions to the Y2K crisis may yield huge commercial<br />
opportunity. Conservative estimate put the global opportunities in this area at $ 60 -<br />
100 billion, lnd~a may caplure a business worth 2 - 5 billion. Therefore, It is a bright<br />
challenge <strong>of</strong> the Indian I T pr<strong>of</strong>essional.
SCOPE OF APPLICATION OF STATISTICAL METHODOLOGIES<br />
IN AQUACULTURE RESEARCH<br />
A. K. Roy<br />
Biornlwmetics Centre<br />
<strong>Central</strong> Insbtute <strong>of</strong> FreShWter Aquecullun,<br />
Keusalyegenge. Bhubaneswar 751 002<br />
INTRODUCTION<br />
Like many other disciplines <strong>of</strong> science, statistics also plays an important role<br />
in Aquacultural Research. Some <strong>of</strong> the areas where statistical methodologies can<br />
be applied are described below. These are based on the experience <strong>of</strong> the author.<br />
There may be some more areas which are not included in this article.<br />
SYSTEMATIC STUDIES AND IDENTIFICATION<br />
In systematic studies it is always necessary to establish the relationship<br />
between two or more morphometrical quantitative measurements, like relationship<br />
between head length and total lenglh or breadth <strong>of</strong> carp, total lenglh and carapace<br />
length <strong>of</strong> a prawn etc.<br />
Taxonomic hypothesis formulated in terms <strong>of</strong> quantitative characteristics may<br />
be tested by means <strong>of</strong> chi-square test, student's 1-test, analys~s <strong>of</strong> variance, mult~ple<br />
range and non-parametric tests. Multivariate analysis may be useful when it is<br />
necessary to combine information on several characters (morphometridmeristic) to<br />
obtain best possible racial discrimination.<br />
COLLECTION, ESTlMATlON AND TRANSPORTATION OF FISH AND PRAWN<br />
Till today freshwater aquaculture in India is partially dependent on natural<br />
production <strong>of</strong> carp seed. Therefore, a lot <strong>of</strong> work is there for standardisation <strong>of</strong><br />
collection, estimation and transportation <strong>of</strong> fish end prawn seed. Availability <strong>of</strong> seed at<br />
different locations may be dependent on current velocity, turbidity, dissolved oxygen.<br />
food availability and numerous other factors. To identify the factors responsible for<br />
the availability <strong>of</strong> seed and to select suitable place for collection, stratified random<br />
sampling technique. Chi-square test, analysis <strong>of</strong> variance and multivariate analysis<br />
can be applied. Factorial experiments can be planned for optimisation <strong>of</strong> space,<br />
time, temperature etc. for mortality free transportation <strong>of</strong> fish seed to different area<br />
where simultaneous effect <strong>of</strong> various factors can be studied precisely taking into<br />
account environmental condition and bioassay techniques can be applied to assess<br />
the impad <strong>of</strong> affluents on fish larvae. SuRable sampling techniques for<br />
estimation <strong>of</strong> fish seed may be employed.
NURSERY REARING AND CULTURE EXPERIMENTS<br />
<strong>Aquaculture</strong> experiments are quite different from those <strong>of</strong> agricultural<br />
experiments because in the former case experimental animals can not be seen and<br />
periodical mortality cannot be observed. Moreover, requirement <strong>of</strong> minimum<br />
experimental units can never been met due to the shortage <strong>of</strong> ponds. However under<br />
varied level <strong>of</strong> fertilisation, stocking density, species combination and ratio,<br />
supplementary feed during different stages <strong>of</strong> nursery and culture experiments.<br />
simplest designs like completely randomised block design, randomised block<br />
design, latin square design, factorial design, incomplete block design etc. depending<br />
on the objective <strong>of</strong> the study can be laid out. System approach and simulation<br />
sludies may also be adopted for studying overall impact <strong>of</strong> stocking size and<br />
density, feeding quality, quantity, periodicity, species composition in polyculture<br />
and pond management to increase carrying capacity <strong>of</strong> water bodies. Manipulations <strong>of</strong><br />
nonmonltory inputs may enhance pr<strong>of</strong>itability.<br />
OPTIMUM UTlLlSATlON OF BROODER<br />
Size <strong>of</strong> brooder, dose <strong>of</strong> pituitary gland and physiochemical parameters <strong>of</strong> pond<br />
plays a great role during breeding. Therefore this is one <strong>of</strong> the area where through<br />
utilisation <strong>of</strong> suitable design <strong>of</strong> experiments, optimum exploitation <strong>of</strong> brooders can be<br />
done.<br />
ESTIMATION OF FISH POPULATION<br />
For rational management <strong>of</strong> culture fishery, monitoring <strong>of</strong> numerical changes<br />
which occur in a population through the course <strong>of</strong> time is essential for basic<br />
understanding <strong>of</strong> population number and production. For precise estimation <strong>of</strong><br />
fish population number from pond at any point <strong>of</strong> time the following methods may be<br />
applied on which a lot <strong>of</strong> research work has been carried out at this <strong>Institute</strong>.<br />
1) Method <strong>of</strong> two successive hauling<br />
2) Mark-Recapture method<br />
i) Method <strong>of</strong> two ruccessive hauling<br />
This method is very simple. The whole thing is to be done is that drag a net<br />
once in a pond then keep the capture fish in a container and let the catch be N,<br />
numbers then drag the net again in the same waterbody and let the catch be N2<br />
numben. Then the estimate the total number <strong>of</strong> fish present in the pond is given by
This method being convenient in operation involving minimum cost<br />
recommended for operation with caution (Roy et el.. 1995).<br />
ii) Mark-Recapture Method<br />
The rationale underlying mark-recapture experiments to estimate population<br />
number is that the proportion <strong>of</strong> marked fish appearing in a random sample<br />
provides an estimate <strong>of</strong> the proportion <strong>of</strong> marked fish in the population. If 'm' is<br />
the known total number <strong>of</strong> marked fish in the population from which the sample was<br />
drawn, then division <strong>of</strong> 'm' by the estimate <strong>of</strong> proportion marked given an estimate<br />
<strong>of</strong> total number <strong>of</strong> individual in the population. Mathematical expression <strong>of</strong> the<br />
estimation formula becomes (known as Petersen Method).<br />
where N = total number <strong>of</strong> fish in the population (unknown)<br />
m = total number <strong>of</strong> marked fish in the population (known)<br />
c = No. <strong>of</strong> fish in the sample<br />
r = No. <strong>of</strong> marked fish recaptured in the sample<br />
N = estimate <strong>of</strong> N.<br />
A A (N-m)(N-c)<br />
Standard Error (SE)(N) = N T----<br />
n~c(N - 1)<br />
If the, assumption that marked fish are representative <strong>of</strong> the reminder <strong>of</strong> the<br />
population is correct then the only error <strong>of</strong> estimation are the random errors<br />
associated with sampling. Experiment conducted at Wastewater <strong>Aquaculture</strong> Division<br />
<strong>of</strong> ClFA demonstrated that Petersen estimator modified by Bailey is efficient for<br />
estimation <strong>of</strong> carp population from pond because it demonstrated lower standard<br />
error, highest precesion coupled with lowest deviation <strong>of</strong> the estimated population<br />
from the free population (Roy et. al. 1989). It is funher observed that marking <strong>of</strong><br />
carps by finclipping which can be identified after one year <strong>of</strong> clipping is suitable for<br />
batch marking required for estimation <strong>of</strong> fish population from pond (Roy el el., 1991).
ESTIMATION OF PRODUCTION<br />
Freshwater aquaculture being subjected to wide range <strong>of</strong> environmental<br />
fluctuation passes through various stress condition leading to ,variation in survival,<br />
growth and production at different point <strong>of</strong> time. Therefore estimation <strong>of</strong> fish<br />
population and production is very important for understanding the process <strong>of</strong><br />
paoduction. In fishery science we are acquainted with the terms like biomass.<br />
production and yield. Generally no distinction is made between yield and production.<br />
In case <strong>of</strong> agricultural crops this may be true. But it is not so, in general, in fishery<br />
science Biomass is the amount <strong>of</strong> substance In a population expressed in material<br />
units, such as live or wet or dry weight etc. It is also termed as standing stock or<br />
crop. Here we may consider like a wet weight <strong>of</strong> fish as biomass. Suppose at the<br />
time <strong>of</strong> our observalion the estimated number <strong>of</strong> fish be N with average weight W.<br />
Then the estimated biomass at the time <strong>of</strong> our observation is: Biomass (0) = N W.<br />
Then to express biomass at different periods it is required to introduce time element<br />
in the above expression as<br />
Bt = Biomass at time '1'<br />
N- = No. at lime '1'<br />
W = Av, weight at time '1'<br />
S~rnilarly, biomass at lime t1 and t2 can be expressed as<br />
Produclion in a given time interval is defined (Ivlev) as the total elaboration <strong>of</strong><br />
anlmal tissue during the tlme interval including what is formed by individuals that do not<br />
survlve lill the end <strong>of</strong> that lime interval.<br />
What is produced is production and what is harvested is yield. In fisheries<br />
the quantity harvested, in other words the final biomass, may be termed as gross<br />
yield. Net yield is the difference belween final biomass and initial biomass what we<br />
generally express as production that in reality is yield. That means we never take<br />
into consideration those fishes who died between initial and final period <strong>of</strong> growth<br />
inspite <strong>of</strong> the fact that Itiose produced flesh during intermediate period. Yield and<br />
production will be same when there is no mortality during growth period.<br />
AGE AND GROWTH STUDIES<br />
The ability to determine the age <strong>of</strong> a fish is an important tool in fishery biology.<br />
Simplest and widely used method for age determination is the analysis <strong>of</strong> size<br />
frequency distribution. It can be used only to the youngest ege group <strong>of</strong> a fish
population. During their development fishes pass through several stages each <strong>of</strong><br />
which may have its own length weight relationship due to sex maturity, season, place<br />
and even time <strong>of</strong> a day. Hence fitting <strong>of</strong> regmssion line by least square method in<br />
each situation is required. For allometically growing fishes, condition fador can be<br />
worked out to compare individual condition <strong>of</strong> the fish under varied condition. Since<br />
growth is a complex procass a complete expression is not feasible, but formation <strong>of</strong><br />
growth models which are basically realistic could be important. For purpose <strong>of</strong><br />
description a number <strong>of</strong> straight line function, logistic curve, exponential curves have<br />
been fitted statistically for purpose <strong>of</strong> evaluation <strong>of</strong> different curves. The best growth<br />
model which can be fitted in fisheries production studies is that <strong>of</strong> Von<br />
Bertalanffy. This particular growth curve can be used in growth studies <strong>of</strong> freshwater<br />
fishes.<br />
GENETICAL STUDIES<br />
The foundation <strong>of</strong> modern theory <strong>of</strong> breeding are based on genelrcs and<br />
statistics which together constitute the scientific disc~pline statistical genetics founded<br />
by Fisher, Wright and Haldane. Therefore there is wide scope <strong>of</strong> application <strong>of</strong><br />
statistics in fish genetical studies like estimation <strong>of</strong> genetical correlation, correlated<br />
response to selection, simultaneous selection <strong>of</strong> several characters and calculation<br />
<strong>of</strong> co-efficients <strong>of</strong> in breeding and water relationship <strong>of</strong> various production .<br />
MODELING OF GROWTH OF FISHES AND POND DYNAMICS<br />
In aquaculture research, statistical methods used (or establishing <strong>of</strong><br />
empirical relationships are mostly univariate or bi-variate In nature e g I-test.<br />
correlations, linear regression etc. In many cases one IS to deal w~th several variables.<br />
as for an example environmental variables as predictor and fish growth as response<br />
variable; such situation is known as multivariate situation which require treatment<br />
and analysis <strong>of</strong> data using multiple regression analysis, path analys~s and<br />
cannonical correlation analysis. Although manual calculation is very tedious,<br />
availability <strong>of</strong> computer and s<strong>of</strong>tware programs has made these analysis within one's<br />
reach.<br />
In a pond environment mullilude <strong>of</strong> factors interact dynamically and influence<br />
fish growth and production. Some environmental factors are uncontrollable which<br />
requires thorough study. Interaction <strong>of</strong> various factors and their resulting effect on fish<br />
growth are seldom understood. In order to make the behaviour <strong>of</strong> these systems more<br />
predictable on which themselves undergo internal changes over the culture cycle,<br />
mathematical models capable <strong>of</strong> describing the fish pond ecosystem practically Is<br />
necessary.
SAMPLE SURVEYS FOR ESTIMATION OF FISH PRODUCTION FROM INLAND<br />
SOURCES<br />
In view <strong>of</strong> large coastline, multitude <strong>of</strong> inlad fisheries resources, the diversity <strong>of</strong><br />
fishing practices and scattered distribution <strong>of</strong> exploiting units it is very difficult to have<br />
reliable production estimate. Inspite <strong>of</strong> these, various organisations like IS], NSSO,<br />
IASRI, CMFRI, CIFRI, etc. during the past decades have conducted pilot surveys to<br />
standardise the sampling methodologies for estimation <strong>of</strong> resources and production.<br />
Presently ClCFRl is running a <strong>Central</strong> Sector Project entitled Development <strong>of</strong> Inland<br />
Fisheries Statistics in India covering various states to develop efficient methodologies<br />
for accurate estimation <strong>of</strong> resources or production. This is a potential area <strong>of</strong> research<br />
on application <strong>of</strong> sample survey. Socio economic and technoeconomic surveys to<br />
assess the impact <strong>of</strong> aquaculture technology on the society as a whole can be<br />
studied using suitable sampling methodology.<br />
REFERENCES<br />
Roy. A. K., Apurba Ghose and 0.K.Saha (1989) Estimation <strong>of</strong> some species <strong>of</strong> fish populations<br />
from pond by fin clipp~ng and comparative emcacies <strong>of</strong> three estimators. Envtronmenl &<br />
ECO~OQY 7(2) : 398 - 403.<br />
Roy. A. K.. A K. Datta. P R Sen and 8. K.Saha (1891). Preliminary studies on the effect <strong>of</strong><br />
pecloral fiin cl~pp~ng in carps on growth, suw~val and regeneration rate. J. Aqua.Trop.<br />
e(i991) : 89 - 98<br />
Roy. A. K, and A. K. Dalta (1995). Two melhods <strong>of</strong> est~mating Carp Population from closed waler<br />
bodtes. J. Inland. Fish.Soc. India, 27(1) . 70 - 77.
MANY FACES Of STATISTICS<br />
INTRODUCTION<br />
StstktiabavuUy~ldencswithmkn~my<strong>of</strong>nwtodrand<br />
technigW8. It plryr a vlW rok in Mi maouch, In industry and -,<br />
and In<br />
f<strong>of</strong>mukning nrUwJ pdld# and prognmw. SWIUo wrrbks tha Id.nthtr lo have<br />
a full plry for @her mativs palsnthiitbs - to dkcovsr new phenomena wlVIout<br />
allowing thorn to run rld ad waste in ldvnndng nw concspts. A povrmment an<br />
pmvkle best bonefib to the poop40 If it takes policy dedsions on the his <strong>of</strong> a tound<br />
stathUcd study <strong>of</strong> problamr.<br />
How do then laws M theories get establkhd 7 RMm k a lckntlRc method.<br />
Fimt, a lev is formuleted 8s a prwhlonal hypotherls to explain &ah observed<br />
evento. S d , tha conseqwms <strong>of</strong> the hypoVnrk m worked out by mkr <strong>of</strong><br />
Muctlw rsuonlng and vdiW by furthor obuwrtions cdkchd Ulrough unfully<br />
derigned exFwimOntc.<br />
If the data contradid the hypothsrls, it h dhclrded, and a fresh one In<br />
formulsted. Othwwiw, it is pmvirionolly accepted and is given the rtrtus <strong>of</strong> law - with<br />
specifled limitation Pnd rcop <strong>of</strong> applicstions.<br />
The rcidfic mahcd <strong>of</strong> investigation krvdving the logical cycle, Hypothesit -<br />
Data - HypcAhdn, can be achemrticPlly reprersnld as follows :
STATISTICS IN SEARCH OF TRUTH<br />
A few examples are given to show the inadequacy <strong>of</strong> measures <strong>of</strong> location such<br />
as the average, median and the mode in describing a given population and the pitfalls<br />
in ~nferences based on them. This is because the individuals in a population usually<br />
differ substantially from one another and this might make a difference. In such cases,<br />
we may compute a measure <strong>of</strong> dispersion (differenms between individuals) to<br />
supplement the measure <strong>of</strong> location. Suppose x,. ...., x, are measurements <strong>of</strong> n<br />
individuals arranged in increasing order <strong>of</strong> magnitude. One measure <strong>of</strong> dispersion is the<br />
range R=&-XI (the biggest minus the smallest). Another measure is the standard<br />
deviation S which depends on all the values, where s'=z(&' - x)' + n which is the<br />
average <strong>of</strong> the squared deviations <strong>of</strong> the individuals values from the average x =<br />
(x,+ ....+ x,)ln. Thus we have two quantities x and s, to describe a population. The<br />
former measures the general magnitude <strong>of</strong> values and the latter the spread <strong>of</strong> values.<br />
A small value <strong>of</strong> s indicates more homogenity <strong>of</strong> the individuals with respect to the<br />
character under study.<br />
A single characteristic in a population can be studied easily. Often it is<br />
necessary to consider two or more characteristics and examine their interrelationships.<br />
As an example, the average IQ <strong>of</strong> sons Increases with increase in the IQ <strong>of</strong> the father.<br />
This establishes some kind <strong>of</strong> relationship, though not <strong>of</strong> a one-to-one type. When the<br />
values <strong>of</strong> father) and y(son) ere plotted in their standard deviation units, the slope <strong>of</strong><br />
the regression line as measured by the tangent <strong>of</strong> the angle i.e. when the slope is zero,<br />
there is obviously no relationship. The strength <strong>of</strong> the relationship may be measured by<br />
the slope <strong>of</strong> the regression line, which is called the correlation between x 8 y and is<br />
denoted by r. This can be directly computed from the observed pairs (xl,yl) ....( x,y,) by<br />
the formula.<br />
. Relationships between variables are frequently used for predicting one variable<br />
given the others or controllinp one variable by causing others to take suitably<br />
determined values.<br />
The correlation between two variables may be induced entirely by a third<br />
variable, in which case the observed relationship is spurious and cannot be used for<br />
prediction. The task <strong>of</strong> making the necessary computations and updating the<br />
discriminant function by using fresh evidence provided by concurrent cases and by<br />
adding newly discovered diagnostic tests is indeed very complex. For this pupme<br />
modem high speed computers are pressed into se~ce. Computer diagnosis using<br />
hundreds <strong>of</strong> measurements is now commonly used in complicated heart diseases.
Mign Of experiments <strong>of</strong>fera a firm basis for dming condmions4rom data.<br />
Much <strong>of</strong> the experimental data generated by sdentists go wale or lead to wrong<br />
condusiona because <strong>of</strong> lack <strong>of</strong> adequate antmls and Mas in assignment <strong>of</strong> Ireatments.<br />
Most <strong>of</strong> the quantities involved in fishery research cannot be observed w<br />
measured throughout the whole population. A section or sample <strong>of</strong> the whob<br />
population is therefore examined for attributes concerned (average size or average<br />
weight) Wch is known as samples.<br />
In multistage sampling, one does not draw a sample <strong>of</strong> the desired units directly;<br />
one reaches such a sample in stages through samples <strong>of</strong> intermediate units. The<br />
method can be illustrated in mathematical terms : the population can be split into K<br />
primary units, each <strong>of</strong> N individuals, and K primary units are sampled, a subsample <strong>of</strong> n<br />
individual being taken from each.<br />
If m, the mean for the im prlmary unit then the estimate <strong>of</strong> the mean <strong>of</strong> any<br />
sample primary unit<br />
where xy is the value <strong>of</strong> the jth individual in the ith unit and the estimate <strong>of</strong> the<br />
population mean is<br />
STATISTICS IN AQUACULTURE RESEARCH<br />
Dedsion making in aquawlture research presupposes a deep knowledge <strong>of</strong> the<br />
aquaculture system and planning the Mure programmes lhrough a well established<br />
data recording syslem. This is one <strong>of</strong> the essentials <strong>of</strong> the farm management and<br />
deasion must be made as to which parameters, when and how much <strong>of</strong> them are to be<br />
monitored.<br />
Modelling and optimization <strong>of</strong> growth <strong>of</strong> fish in aquaculture is very important<br />
factor <strong>of</strong> study for the success <strong>of</strong> the operation <strong>of</strong> Ule aquauclture projects.<br />
Management <strong>of</strong> ponds is based largely on monitoring complex processes <strong>of</strong> pond<br />
dynemica and sansWty to environmental and operational factors. Physiological and<br />
biological parameten over a long period <strong>of</strong> time makes certain demand6 for a large<br />
storage capacity <strong>of</strong> computer for developing data acquisnion system.
For povldlnO etmbgk data for pEwJnp md rubHquwd Ink <strong>of</strong> handling<br />
Uwough Hltomrtkn, cmpttn-ddd design, computer-rldsd imbmmbtkn and data<br />
trwmlukn,#dogicd~lnrbvnrnbtknr(c.urran<strong>of</strong>th.-<br />
~krwhlch~eopsrrtrdtoq~murdrthrwghth.t#lp<strong>of</strong>micro<br />
comwn.<br />
Theurr<strong>of</strong>computsrmoddrh~msydrmpl.yrur~portmtmkt0<br />
obtskrbetteruds~<strong>of</strong>thepcdeco8yrtsmmdckwkpm~~<br />
t ~ o p t k n k s ~ ~ ~ . I t h n g O t ~ i r n p o d f w ~ a i t i c<br />
parameter8 that haw hbhef docfa on pond's pro- and hence Lh produdkn.<br />
Multivarktr adyeb for devdoplnp modrk In the bmnch <strong>of</strong> rt.thtko cormrrted with<br />
analyshg muklpk rn+rurcmnntr thlt have boon msde on wen1 samples <strong>of</strong><br />
Individuals. VarkUer ue dependent among themadver so that m an not split <strong>of</strong>f one<br />
or more from others. CompuMional malysis lncorponthrg a large number <strong>of</strong> variables<br />
h the only 8oluUon to arrhre at the conduelon IdonWykrg the ulticrl parameten.<br />
In order to cbvdop effldsnt and ownomicll feed fonnutn for aquaculture, the<br />
basic information b nqulred on nutfbnt mquhwb <strong>of</strong> the species cuttlvatd, the<br />
chemical comporltlon md oqMokptlc propsrtier <strong>of</strong> feed hgredhnb in relotton to their<br />
acteptabU#y Md &lHy <strong>of</strong> fhh to dmt and utiW nubienh from va&us sources.<br />
Linear programming k a mrttwtnaUcrl technlqw bawd on matrix algebra and best<br />
suned to a computer. Thh <strong>of</strong>fem mnrldenbk pdmtlal h the development <strong>of</strong> 'Least<br />
colt IW tonnul;llkn <strong>of</strong> flrh dkts'.<br />
Recad keeping dated to brood stock management wwM be better performed<br />
on a microcomputer. Gomtkte would like to incorporate new record rarity into a<br />
contlnuoru dotabom wMch am doveloped gently In drt.bns management<br />
pacJwge8 Hk dBm IV, Foxbus, R&X md Foxpro ate. The support ohfed by the<br />
modem computer wfWm techndoOy h th fkld <strong>of</strong> gcwtkr, Wng from<br />
chmmosomo wlyrh to genu nupplng or DNA 8epmchg math to hasten the<br />
pmgmss In gene technoiogy. Qana t.chndoly suppwted by th computer Whnology<br />
has a much more gmter rda to play in quadtum mwarch.<br />
The growing sdem <strong>of</strong> aquatic mlaobidogy wkh reference to aquatic<br />
producttvky, organic decornporltion, tbktkation, MoRnention and other biotic<br />
approaches to improw prodvdMty ha8 been bm&ting lnwwnnly from the<br />
Molnfomutia bawd on computer epplldon.<br />
Work on dewbpmonl <strong>of</strong> m(w qudlty mod.ls, -1 modoh, phyrlal<br />
modeh, economic modela etc. am 8una <strong>of</strong> tho mrthmrticd mpmmWbm whlch can<br />
be derived empidcalty or macluniaticaffy. The m o m , ldsnURcrtion <strong>of</strong> c~ntrd<br />
procesrer md facMas pmvick r map opportunity Md m exciting ch.lhge for<br />
sgu-.
lnvesm requirement for aquaculture, pmfdr, ntcr <strong>of</strong> mkm, growth nte, W<br />
requirement, mortality, dwng density, incidence <strong>of</strong> diiase in culture operations etc.<br />
are analysed through computers by a krga set <strong>of</strong> built-in mathematical and statistiul<br />
functions developed in programming languages.<br />
CONCLUSION<br />
Statistics proves a necessity when researchen contemplate advanced study<br />
with the objects <strong>of</strong> doing research. Statistical principles are involved in the effident and<br />
economic design <strong>of</strong> experiments as well as in the interpretation <strong>of</strong> the results.<br />
Appli~tion <strong>of</strong> statistics is modem mode <strong>of</strong> interpretation <strong>of</strong> scisnttfic data and drawing a<br />
right conclusions eliminating probabilitiie and posribilit'is.
FUNDAMENTALS OF SAMPLING AND ITS APPUCATION IN<br />
FISHERIES RESOURCE ESTIMATION<br />
S. Chakraborty<br />
Deputy D~rector ol Fisheries<br />
God. <strong>of</strong> West Bengel<br />
Some basic sampling concepts and basic sampling techniques<br />
Population : It is defined as the collection or an aggregate <strong>of</strong> all possible values <strong>of</strong> a<br />
particular characteristics for a specified group <strong>of</strong> individual.<br />
Example: i) populat~on <strong>of</strong> f~sh weights <strong>of</strong> all fishes In a pond.<br />
~i) population <strong>of</strong> income <strong>of</strong> f~shermen fam~l~es in a State.<br />
iii) population <strong>of</strong> fish length in a sea.<br />
A population can be finite or infinite. It is said to be finite if it contains finite no.<br />
<strong>of</strong> ind~viduals or un~ts. Example (i) and (ii) given above refer to finite population. A<br />
population <strong>of</strong> unl~m~ted or very large measurable no <strong>of</strong> individuals is called infinite<br />
populat~on. Example (ii~) above refers to infinite population. The no. <strong>of</strong> individuals or<br />
observation is called populal~on slze and usually denoted by 'N'.<br />
Sample : A group <strong>of</strong> individuals or units that is chosen from a population is called a<br />
sample. The no. <strong>of</strong> ind~viduals or observations in a sample is called sample size and is<br />
generally denoted by 'n'.<br />
Sompllng frame : It is a list, map or other specification <strong>of</strong> units which constitute<br />
available information regarding population. It forms the basis for drawing <strong>of</strong> sample.<br />
Random sampling : A random sampling is a method <strong>of</strong> sampling in which each<br />
individual in a population has a preassigned chance <strong>of</strong> being included in the sample.<br />
Generally units are drawn one by one from the population. If the chance <strong>of</strong><br />
selecting any unit at any drawal is the same then the sampling is called the simple<br />
random sampling. S~mpte random sampling can be obtained either by using 'Lottery'<br />
melhod or by the use <strong>of</strong> 'Random Number Tables'.<br />
L<strong>of</strong>fery method In this method, first number the individual <strong>of</strong> the population. Then<br />
write these numbers on identical chits and fold them so that the nos. are not visible.<br />
Then place lhese chits in a box. Shake the box thoroughly and draw chits one by one<br />
t~ll the no. <strong>of</strong> chits drawn equals to the sample size. Note down the nos. <strong>of</strong> those chits.<br />
The individuals with these nos. form a sample.
Use <strong>of</strong>nndom numlran : Prepared tables <strong>of</strong> random nos. are nvaiiabba lor drawirig a<br />
rbnple random sample. These tables consist <strong>of</strong> series <strong>of</strong> digits fmm 1 lo 9 which<br />
appear Indewndent <strong>of</strong> each other and appear approximately aqua no, <strong>of</strong> times.<br />
As a first step, units Of the population are numbered from say 1 to N. From<br />
random no. tables, select a no. between 1 to N and include the unit bearing this no. in<br />
the sample. Continue this process till the no. <strong>of</strong> units included in the sample equals to<br />
the sample size. In this procedure nos. larger than N are not considered. To avoid<br />
rejection <strong>of</strong> such nos. 'Reminder approach' methods a n adopted which is described<br />
below.<br />
if N is a 'd' digit& no. determine first the highest 'd digited multiple <strong>of</strong> N. Let<br />
this be 'N'. Then a random no. 'r' is selected from 1 to N. Divide this selected 'r' by N<br />
and find out the reminder. A unit with serial no. equal to this reminder is se\ected. If<br />
the reminder is zero, the last unit (N) is selected.<br />
Example:- If N = 20, the highest 2 digited multiple <strong>of</strong> 20 is 80. Then select a random<br />
no. from 1 to 80. Let this no. be 72. Division <strong>of</strong> this no. by 20 glves a reminder <strong>of</strong> 12 .<br />
Hence, the unit with serial no.12 is included in the sample. Select another no. from 1 to<br />
80 and repeat the procedure till the no. <strong>of</strong> units selected equals the sample size.<br />
A sample survey is a vehicle for inductive reasoning. It provides for the<br />
transformation <strong>of</strong> observations <strong>of</strong> a part into conclusion regarding the whole. Taking<br />
samples is a procedure used in nearly all fisheries investigations and from the sample<br />
taken we intend to generalise about populat~on under investigations. For example,<br />
taking a sample <strong>of</strong> catch from a vessel operated in a water body. We want to say<br />
something about the total catch <strong>of</strong> fish from it.<br />
The basic sampling techniques are<br />
i) Simple Random sampling<br />
ii) Stratified sampling<br />
iii) Cluster sampling<br />
iv) Systematic sampling<br />
v) Two stage sampling<br />
In this mmpling all unib have equal probability <strong>of</strong> being seleded in the sample<br />
and wsry possibk sample <strong>of</strong> required size has the same chance <strong>of</strong> selection. The<br />
mmpk is drawn sither by lottery method or by random number table.
In stratifmd random sampling, the population b divided into m over lapping<br />
sub-populations called strata. A sample is then drawn from each stratum. The prime<br />
reasons for stratification are - (i) It ensure adequate representation to various sub<br />
division <strong>of</strong> the population. (ii) It may be convenient to break up the populetion into<br />
strata for better organization end supervision <strong>of</strong> field work (iii) A considerable<br />
precession may k gained by dividing a heterogeneous population to homogenous<br />
strata.<br />
In cluster sampling the population is divided into groups or dusters <strong>of</strong> units.<br />
Several <strong>of</strong> the cluster8 a n chosen at random and all units in each selected cluster<br />
become part <strong>of</strong> the sample. The choice <strong>of</strong> cluster sampling in fish catch surveys is <strong>of</strong><br />
immense use.<br />
In thin rampling fmt we relea clusters, called 1st stage units and then chosen<br />
units called 2nd stage units from the dusters. For example, in estimating the yield <strong>of</strong><br />
fish In 8 distrid, village may be considsrd as let stage unit and the ponds within<br />
vlllage as 2nd stage unit.<br />
In systematic sampling. the first unit is selected at random, the rest being<br />
selected according to a predetermined interval. In estimating marine landings or<br />
rlverine landing, the systematic sampling technique is normally used.<br />
Reliable and sound data base is a prerequisite for proper planning and<br />
management <strong>of</strong> inland fisheries. At present, the available data base on inland fishery<br />
resources and their exploitation is inadequate and a10 suffers from various drawbacks<br />
due to coverage, classification and methodology <strong>of</strong> collection <strong>of</strong> fishery data and its<br />
estimation procedure. The statistical methodology which may be applied in various<br />
Inland fishery resources as described below may provide reliable estimates on<br />
resources as well as production. Inland fisheries ere broadly classifred into capture and<br />
culture fisheries, the format being expioitive <strong>of</strong> natural population and the catch king<br />
intensive intervention <strong>of</strong> human by stock control and management practices. The<br />
culture fishery resources are pondskanks (impwnded water bodies), Ox-bow<br />
lakes/Beel and Baon, Brackish water fisheries, Reservoirs and Rivers, Estuaries and<br />
Lagoons are the capture fishery resources.
Presently. area approach is being followed for estimation <strong>of</strong> inland fish catch by<br />
using 'Acreage' and 'Yield rate' data as available through sample sutvey. The area<br />
under different culture, inland fishery resources may be developed in the following<br />
manner.<br />
Type <strong>of</strong> resources<br />
Source <strong>of</strong> area data<br />
1. Pondflanks ( impounded 1. CuHurable water area may be developed on the<br />
water bodies)<br />
basis <strong>of</strong> complete enumeration or through<br />
sample survey based on sampling<br />
methodology.<br />
2. Ox-bow IakesBeel and Baors 2. Through settlement records<br />
3. Reservoir fisheries 3. Through 1 8 W Department <strong>of</strong> respective State<br />
4. Brackish water fisheries 4. Through complete enumeration and also<br />
through implementation <strong>of</strong> Fish producers<br />
licens~ng order.<br />
ESTIMATION OF PRODUCTlVlTYlCATCH FROM IMPOUNDED WATER<br />
RESOURCES<br />
Impounded water bodies viz.. ponds and tanks contribute appreciable to the<br />
total inland fish production and the assessment <strong>of</strong> its contributions are being prepared<br />
on the basis <strong>of</strong> sound sampl~ng technique. The sampling technique and the estimation<br />
procedure described below provide precise and reliable estimate <strong>of</strong> productivity and It8<br />
fish production.<br />
For estimating the fish catch from these resources, a stale may be divided into<br />
three Agro-climatic zones. The criteria for classification adopted here is on the basis <strong>of</strong><br />
high, moderate and low ra~nfall, temperature and soil type etc.<br />
From the high rainfall region, a set <strong>of</strong> three districts are selected at random for<br />
catch estimation where two districts are selected from moderate rainfall area and one<br />
district from low rainfall area in order to provide larger sample for high concenlration <strong>of</strong><br />
units and smaller sample for low concentration <strong>of</strong> water units. Here, it is assumed that<br />
these sample districts represent the districts from which they are selected.<br />
The sampling design for estimating the productivitylproduction under these<br />
resources are stratified three stage cluster sampling. A district ie divided into three<br />
strata approximately <strong>of</strong> equal sue in respect <strong>of</strong> water arednumber <strong>of</strong> villages. A<br />
sample <strong>of</strong> six dusten, <strong>of</strong> five villages each are ~lected from each stratum. Cluster <strong>of</strong><br />
villages constitute lhe first stage unit and the ponds within cluster as the second slag.
unit. Selected villages are ourveyed completely and all the water unb in the village are<br />
enumerated.<br />
The selection <strong>of</strong> samples are prepared by adopting the following procedure.<br />
List all the villages in a district. Now the district is divided in 3 strata such that the<br />
number <strong>of</strong> villager in each Stratum are approximately equal. From each stratum, six<br />
villages are selected called the key village at random from the list <strong>of</strong> villages. Then<br />
l~sting <strong>of</strong> ell the villages surrounding each <strong>of</strong> the key village are prepared. From this list<br />
4 villages corresponding to each <strong>of</strong> the key village are selected randomly. In this way a<br />
sample <strong>of</strong> six clusters <strong>of</strong> five villages each in a stratum are selected for resource<br />
estimation.<br />
For estimating the total catch <strong>of</strong> fish, five pondsltanks are selected from each<br />
cluster at random from the total number <strong>of</strong> ponds in the cluster. In case the number <strong>of</strong><br />
ponds in a cluster is less than 5, all are taken in the sample for observation <strong>of</strong> catch.<br />
Thus, from each district a total <strong>of</strong> 90 villages are selected for est~maling the water area<br />
under ponds and tanks and 00 ponds for estimating the catchlproductivity <strong>of</strong> fish.<br />
Further, sampling In time are adopted so that each water unit is visited at least once in<br />
e month by an investigator for record~ng the catch from each pond more accurately and<br />
for prov~ding the est~mates <strong>of</strong> monthly catches also.<br />
Estimation Procrdurr<br />
Nh = Total number <strong>of</strong> clusters in h-th stratum<br />
n, = Number <strong>of</strong> sample clusters in h-th stratum<br />
MW = NO. <strong>of</strong> ponds in the J-th village <strong>of</strong> i-th cluster in h-th stratum.<br />
my, = No. <strong>of</strong> ponds selection from i-th cluster in j-th stratum<br />
Xyl = Total area under water unit In the j-th village <strong>of</strong> i-th cluster in the h-th stratum<br />
xkh = Area <strong>of</strong> the k-th selected pond in the i-th cluster <strong>of</strong> h-th stratum.<br />
Ykh = Yield <strong>of</strong> k-th selected pond In the i-th cluster <strong>of</strong> h-th stratum.<br />
= Average yield per cluster in h-th stratum<br />
)'* = Average yield per hectare per year in h-th stratum<br />
Yh<br />
Estimators <strong>of</strong> area and Number <strong>of</strong> ponds<br />
Average number <strong>of</strong> ponds per cluster in h-th stratum<br />
Total no. <strong>of</strong> ponds in the district is given by M = N, M*
1<br />
Average area per cluster In h-th stratum s -: = - ,Y,,,vherrX., =<br />
!Ik<br />
,Y#<br />
A',<br />
Total area in the district is X = N,<br />
x;<br />
E~tirnatora <strong>of</strong> yield<br />
Average yield per cluster in h-th stratum<br />
- 1<br />
Where qh = - 1 Y*<br />
m,<br />
Total y~eld in the d~strict ( Y )<br />
Average yield per hectare in the d~strict<br />
ESTIMATION OF FISH CATCH FROM CAPTURE FISHERY RESOURCES<br />
Under this resource Rivers, Streams, Estuaries etc constitute one <strong>of</strong> the<br />
important inland fishery resource in the State spreadin0 over thousands <strong>of</strong> kilometers<br />
and passing through mountains, valleys, pla~ns and other areas An appreciable<br />
quantity <strong>of</strong> fish are being landed from these resources. The estimates <strong>of</strong> its<br />
contribution are being prepared based on sound statistical technique and the procedure<br />
described below provide reliable est~mate <strong>of</strong> fish production<br />
Sampling Design, methods <strong>of</strong> data collection and estimation procodure<br />
Capture fishery resources under rivers, streams etc, sustain mult~gear and<br />
multispecies fishery exploited by art~sonal f~shermen operating on the area <strong>of</strong> the<br />
system. Most <strong>of</strong> the rivers have well established landing centres where fishermen land<br />
their calch. From the landing centres data on fish catch etc, are collected by the held<br />
i ;vestigators.
The sampling design adopted h a two atage stratfkd sampli involving<br />
stratification in space and lime viz., landing wntrea and days reqedvely.<br />
The entks stretch is divided into homogenous zone <strong>of</strong> landing mntre each zone<br />
having more or less same type <strong>of</strong> gear and craft, flshing practices and species landed.<br />
From each zone D few landinp (20%) centres are randomty selected. A month is<br />
divided into three sets <strong>of</strong> ten co~eartive days. From the first set, two consecutive<br />
days aw randomly selected whom olmvatlons are taken from the se\ected centre.<br />
From the ~ ~ and nthird set d <strong>of</strong> ten days each dusters <strong>of</strong> two days are taken with a<br />
sample interval <strong>of</strong> ten days.<br />
On the selected first day <strong>of</strong> observation in a landing centre, data are collected<br />
during 12.00 to 18.00 hm. and on the second day during 6.00 to 12.00 hrs. Data on<br />
night landing if any in between thew consecutive days are collected by enquiry on the<br />
second day. Thus in two day duster 24 houn observation is taken. This forms a<br />
landing centre day the fimt stage sampling unit. On the selected day <strong>of</strong> observation, if<br />
number <strong>of</strong> units landed is 10 or less, then all the units am observed for gear wise<br />
catcher. When it exceeds ten a sample <strong>of</strong> units not less than ten is selected in a<br />
syrtematic way depending on the total number <strong>of</strong> units landed during the period <strong>of</strong><br />
observation. Units landed form the second stage sampling unit from which data on<br />
specisswise catch, type <strong>of</strong> crafl and gear operated are collected.<br />
Estimation Procadun<br />
Let n sample centres are selected from a population <strong>of</strong> N and let d no. <strong>of</strong><br />
sampling days.<br />
D, = number <strong>of</strong> Fishing days at i-th centre in a month<br />
Y1 = Catch <strong>of</strong> I-th landing centre on j-th selected day.<br />
1<br />
71 = ~ ean yield <strong>of</strong> the i-th centre = -x~<br />
d<br />
N -<br />
Then Y = Estimate <strong>of</strong> total yleld from all the centre = TZ D, y,
The data given below relate lo three dusters <strong>of</strong> stratum-l in ths district <strong>of</strong><br />
Minapore, West Bengai for estimating the total area under ponds and tank. Tha tobl<br />
no, <strong>of</strong> dusten in the stratum in 349. The sampling methodology ir 8tratMed duster<br />
rampling.<br />
Cluster SI. No. <strong>of</strong> Village No. <strong>of</strong> Ponds , Total Area<br />
Compilation Procedure:<br />
Total catch for 20 ponds in cluster - 1 = XY,,,<br />
Average catch/Pond in Cluster - 1 =<br />
11= 2 m I<br />
= 1867.5120 = 03.47<br />
Average cetch/pond in cluster - 2 = 1189.5113 = 91.50<br />
Average catcNpond in cluster - 3 = 1729 0112 = 144.48
A 1<br />
Average catch per cluster = - = - (2617.3 + 2836.6 + 3313.9)<br />
Y, 3<br />
The following data relate to the estimate <strong>of</strong> area and variance in four strata <strong>of</strong><br />
Midnapore district In the state <strong>of</strong> West Bengal for estimating the total area under ponds<br />
and tanks.<br />
- -<br />
Stratum Nh nh A A<br />
Ah<br />
MA<br />
(no. <strong>of</strong> pond<br />
in village)<br />
IV 634 3 0.1261 0.00134388 98.67<br />
Compilation Procedure:<br />
Total No. <strong>of</strong> Ponds = M = XSN, A<br />
M,
Average area per pmd = = N.<br />
A<br />
Total area = number ponds x average area per pond<br />
= 491581 x . 1722<br />
= 84650.25 (ha)<br />
The data given below are from one stratum <strong>of</strong> the district <strong>of</strong> Midnapore in West<br />
Bengal for estimating the catch. The total no. <strong>of</strong> clusters in the stratum is 349. The<br />
sampling procedure is two stage stratified cluster sampling.<br />
Stratum C, 1
Compilation Promdun :<br />
We prepare (he following table<br />
Stratum Clulter SI. No. <strong>of</strong> Village Av, area per pond<br />
1 1 1 0.1200<br />
2 0.2987<br />
3 0.6180<br />
4 0.3740<br />
5 0.2750<br />
.-.-<br />
I I: ,<br />
A, N, A,, A,,<br />
is average area <strong>of</strong> pond in i-th duster<br />
Estimated varlance <strong>of</strong> A. , ; (2)<br />
A, A,<br />
= (---<br />
A<br />
Tatel catch kt stratum - 1 = Y = Nf -i;;<br />
A A <br />
A, A,<br />
Flmt the yiekVhectan for each pond la calculated
Average ykM per hectare for duster - $<br />
Average yieM for duster -2<br />
Average yieM for duster - 3<br />
Average yieldlhectare in stratum-l
Sa~npling Techniques Applied in Assessing Inland Fishery Resources<br />
and Production<br />
R A. Gupta<br />
Cc~ttrnl lttln~td Capture Fisheries Racnrcl~ <strong>Institute</strong><br />
llnrrackpore 743 101, West Bengal<br />
India is er~dowed wit11 very rich and polenlial inland fishery resources<br />
Tltcse resources t~eed to be judiciously exploited and managed in order to get sustainable<br />
yields OI long tenn basis The decision makers need reliable data not only to assess tlie<br />
levels <strong>of</strong> exploitation <strong>of</strong> these resources but also sucll data are needed for planning and<br />
for~nulation <strong>of</strong>our future strategied for balanced development <strong>of</strong> inland fislieries This<br />
is in this respect tliat we need sampling niell~odologies which may l~elp to assess these<br />
resources in ternls <strong>of</strong> area <strong>of</strong> coverage and productio~i <strong>of</strong> fish from them Tlie nature,<br />
nu~nber aid tyl)e <strong>of</strong> inland water bodies yielding fislt are so luge and diverse \hat it<br />
seelils ~ ~~~eco~~o~~iical<br />
to adopt nny type <strong>of</strong>nielliods e~nployitig total enu~neration and<br />
l~e~~ce justifies adoption <strong>of</strong> saniplirig rr~etl~odologies for their assessnlent The present<br />
lecture deals witli the san~pling neth hods nlost appropriate for assessment <strong>of</strong> inland<br />
fisliery resources and production.<br />
Before I embark upon the discussior~ on the sanipling tecliniques used for<br />
fisheries assessment 1 feel it necessary to enlist the types <strong>of</strong> resources used for inland<br />
fisl~erics and ndopt soti~c acceptable c~iterion for tlieir classification depending on the<br />
modes a~id nature <strong>of</strong>exploitation <strong>of</strong> different classes<br />
Clnssificntiott <strong>of</strong> i~ilil~td Iislleries resource<br />
A 111ajor bottleneck encountered ir~<br />
data collection refers to anibiguity in the use<br />
or concepts and tcrtninologies in definition, nomenclature and classification <strong>of</strong> the<br />
diverse Iialure <strong>of</strong> resource in dinerent states and union territories To overcome this<br />
deficie~lcy a complete framework <strong>of</strong>concepts have been formulated on the basis <strong>of</strong> pilot<br />
studies conducted ill various agro-cliniatic regions <strong>of</strong> [lie country in order to bring ill<br />
unifor~irity nt tlie national level Inland fishery resources can be described in tlie<br />
following Ir1anner.<br />
A, Frcslt ~vntc resources sucl~ ns :
I. <strong>Aquaculture</strong> ponds and tanks 3 Playas<br />
2. large irrigation tanks 4. Waterlogged<br />
5. Rivers and canals 9. Quarries<br />
6. Ox-bow lakdcut-<strong>of</strong>f meanders 10. Ash ponds<br />
7. Reservoirs I I. Excavations<br />
8. Swamps<br />
B. Saline water<br />
1. Lagoons<br />
2. Estuaries<br />
3. Creeks<br />
4. Mangroves<br />
5 Salt pans<br />
6 Marshes<br />
7 Other impoundments ( Bherries etc )<br />
Many <strong>of</strong> the water bodies mentioned above contribute very marginally to the<br />
total fish production and hence may not be <strong>of</strong> much in~portarice in formulating s~rategies<br />
the purpose <strong>of</strong> production assessment Hencc all those potential clnss <strong>of</strong> water bodies<br />
need coverage under catch assessment prograriirnes are being classified below for the<br />
execution <strong>of</strong> the metliodology in order to provide firni, reliable and statistically sound<br />
data base on inland fislieries.<br />
Group -1 : (Water bodies up to 10 ha water spread area at full rank level)<br />
I. <strong>Aquaculture</strong> ponds and tanks<br />
2. Brackish water impoundments<br />
3. Waterlogged areas<br />
Group U :<br />
I. Large Irrigation Tanks<br />
2. Reservoirs and check dams<br />
3. Lakes and Ox-bow lakes<br />
Group 111<br />
1. Rivers<br />
2. Canals<br />
3. Estuaries<br />
4. Lagoons<br />
5. Back waters
Separate sampling methods have bem devised fw estimation <strong>of</strong> resource area,<br />
fi~h production md other parameters <strong>of</strong> imponmw.<br />
Sampling Procedure lor Croup 1 water bodiu:<br />
Ponds and Tanks : Stratified three stages sampling design (Cochran, 1962,<br />
Sukhatme CI al, 1984 and Gupta et al. 1997) is adopted for assessment <strong>of</strong> water spread<br />
area and fish production. The entire state is divided into three nearly homogenous<br />
groups called strata keeping in view certain characteristic such as rainfall or soil<br />
conditions. Strata should be formed in such a way that geographical contiguity <strong>of</strong><br />
districts within the strata is maintained. Districts from each stratum forms first stage unit<br />
<strong>of</strong> selection, clusters <strong>of</strong> five pond bearing villages form second stage unit <strong>of</strong> selection<br />
and ponds within clusters as the tlird stage unit <strong>of</strong> selection. The ultimate unit is selected<br />
in the following manner.<br />
A sample <strong>of</strong> 2W <strong>of</strong> the districts are to be selected from each stratum subject to<br />
a minimum <strong>of</strong> two districts are included in the sample within each stratum. A list <strong>of</strong><br />
villages bearing ponds and tanks is then prepared and clusters <strong>of</strong> five villages are formed<br />
for further selection. A sample <strong>of</strong> 10% <strong>of</strong> the clusters ( 2nd stage) is selected from each<br />
sample district for estimation <strong>of</strong> pond area statistics. At the third stage <strong>of</strong> sampling five<br />
ponds within each selected cluster is taken by simple random sampling for estimation <strong>of</strong><br />
catch. However, locations, where units are widely scattered and formation <strong>of</strong> cluster is<br />
not beneficial, may adopt simple random sampling.<br />
Notations:<br />
Let<br />
N, - Nuniber <strong>of</strong> districts in h-111 stratum<br />
4 = Number <strong>of</strong> districts selected in h-th stratum<br />
M, - Number <strong>of</strong> clusters in i-th district<br />
m, = Nuinber <strong>of</strong> clusters selected in i-th district<br />
N,<br />
M~=C Mh,<br />
L.1<br />
=Total clusters in h-th stratum<br />
Bu - Total number <strong>of</strong> ponds in j-th cluster <strong>of</strong> i-th district<br />
Blyi Number <strong>of</strong> ponds harvested in j-111 cluster <strong>of</strong> i-th district<br />
bw Number <strong>of</strong> ponds selected in j-th cluster <strong>of</strong> i-th district<br />
%= Area <strong>of</strong> k-th pond in j-th cluster <strong>of</strong> i-th district<br />
& = Area <strong>of</strong> all waterbodies ill j-th cluster <strong>of</strong> i-th district
Ny = Area <strong>of</strong> dl waterbodies harvested in j-th cluster <strong>of</strong> i-th district<br />
(a) Estimation <strong>of</strong> total area ( Two stage sampling)<br />
fitimale <strong>of</strong> average area per C ~USK~<br />
"h<br />
EM,, 4,<br />
; where ii,,,=-x A,,<br />
= - 1.1 I m*<br />
"" ,#& mhrl-1 . ... . ,, ., (1)<br />
fitimate <strong>of</strong> average area harvested per cluster<br />
"h<br />
x M*,<br />
z;,<br />
I ""<br />
; where
,vh, b,<br />
I U Bh4wb=- Mk<br />
Bh ll*,., mk/'l M,<br />
c =-C I '<br />
- ; where -<br />
b,=-C<br />
rsrrmate <strong>of</strong> average ptrdr hamsred per clus~er<br />
I=-c w, Fir' ; where 6;-c B;~<br />
c I "b -, 1 "'<br />
Bh 1lhl., "'~1'1<br />
Estinrate ojtoral p~rdc it1 h-th strarunl<br />
b<br />
" d<br />
nh = B~*M,, ; ~vlrrrr Mh, = 1 Mh,<br />
1.1<br />
firintate o/ toralpttdr lrarvesred itr 11-11, stratum<br />
1 I<br />
13: = B-,'*Mh, ............ (8)<br />
3. Estimation <strong>of</strong> fisl~ yield (Three stage sampling) :<br />
Let<br />
yw = Yield <strong>of</strong> k-th ponds in j-th cluster <strong>of</strong> i-th district in h th straum<br />
xw a Area <strong>of</strong> k-th pond in j-th cluster <strong>of</strong> i-th district in h-th stratum<br />
brinrate oj yield per prrd irr j -th cluster IS<br />
....<br />
hlirtra!e oj yield per clt~srer F i-rh d~srrict is<br />
Fh, = Lz B;&,<br />
hr<br />
&rin~a/r oj yield per clrrster F h-tlr srratr~nr is<br />
A_<br />
" I<br />
......<br />
Y*=-C lVk Yh, ........<br />
'I4<br />
.(lo)<br />
..(I I)
Similarly esrimarejor area bused on seleoedpoirds IS,<br />
Esrimaie <strong>of</strong> area per cluster is<br />
The above estimates assume that MI'S and Bb's for the populatiori are known<br />
heldper hectare (Ratio brimare)<br />
A_ A-<br />
i=( Yh)4 Xh)<br />
Esiinrare <strong>of</strong> rotalyieWjronr h-rh srraruni based or1 (he ratio rslinrate is<br />
*<br />
(F,)=i A; or (y,)=i ,iL<br />
here ~L=rocal area harvested ulrder yotrh atrd io!iks i/r rlre sira~itnr<br />
This nray be replaced by A:<br />
The above esrmiare is rjlicieiir bur biased. 7he bra.$ tvill he rit~gligrhle<br />
Sampling Procedure for Group II wnter bodies:<br />
Raervoirs, Irks, beelr and large irrigatio~~ tat~ks: There is a great variability<br />
with respect to size and productivity <strong>of</strong> various reservoirs in India Hence, there is a<br />
strong case <strong>of</strong> sub classify them into various subgroups on the basis <strong>of</strong> area in order 10<br />
make reliable and accurate assessment <strong>of</strong> fish production. The following subclassfication<br />
seems appropriate<br />
Small reservoirs (I0 to 500 ha <strong>of</strong> water area at FKL)
Medium reservoirs (500 to I000 ha. <strong>of</strong> water area at FRL)<br />
Large reservoirs (1000 ha. and above)<br />
As far as area statistics is concerned. a Iota1 inventory <strong>of</strong> resources under each<br />
stratum is made and then the following selection procedure is adopted for estimation <strong>of</strong><br />
fish production.<br />
The water bodies under each stratum are classified into the above three groups<br />
and a random sample <strong>of</strong> 20% <strong>of</strong> the water bodies from each group may be taken for<br />
survey for physical observations. Further classification on the basis <strong>of</strong> information<br />
available on the type <strong>of</strong>their exploitationd may also be made. For making strategies for<br />
collection <strong>of</strong> catch da~a on harvesting days this type <strong>of</strong> classification would be<br />
advantageous. Therefore, it may be suggested that they may be sub-grouped into the<br />
following two categories.<br />
1. Waterbodies which are harvested during a short interval extending from a<br />
fortnight to about a ~nontll. These water bodies are mostly small reservoirs and lakes<br />
which fall under the perview <strong>of</strong> state departments and exploitatin is affected either by<br />
auctioning them to private contractors under certain terms and conditions or exploited<br />
depart~nentally by engaging contract labour Hence, the bulk <strong>of</strong> harvest is a one time<br />
operation which continues for a fortnight to about a month Data on catch <strong>of</strong> 20% <strong>of</strong><br />
such water bodies selected by simple random sampling should be observed by the survey<br />
staff through pl~ysical observation to cross check the authenticity <strong>of</strong> the catch records<br />
maintained by the agency.<br />
2. Water bodies which are exploited round the year by fishermen cooperatives <strong>of</strong><br />
individual fishermen on the basis <strong>of</strong> licenses, free fishing, royalty or any other such<br />
mode. Selection <strong>of</strong> 20% <strong>of</strong> water bodies in each stratunl is made by simple random<br />
sampling procedure. Assessrilent <strong>of</strong> catch is undertaken for selected water bodies in each<br />
stroluln by adopting sa~npling villages as the second stage unit <strong>of</strong> selection. Each<br />
sampled village is then observed as per the scheme suggested for group 111 for recording<br />
the data on catch.<br />
Notntiot~s<br />
Let<br />
N, = Total Number <strong>of</strong>water bodies <strong>of</strong> the 1-th sub-group in h-th stratum<br />
N,' = Number <strong>of</strong> water bodies harvested in h-th stratum<br />
n, = Number <strong>of</strong> water bodies selected from N,<br />
n,' = Number <strong>of</strong> selected water bodies which have been harvested among n,<br />
q,,,= Area <strong>of</strong>j-111 water body <strong>of</strong>the I-tti sub-group in 11-111 stratum<br />
yhu = yield <strong>of</strong> 1-th water body <strong>of</strong>a group in 11-111 stratum
(Value <strong>of</strong> yw is obtained by recording total fish catch in cases where water body is<br />
harvested during a short interval <strong>of</strong> the year However, water bodies which are harvested<br />
during the entire yea as discussed in the sampling procedure, y,,,, is estimated by fbrther<br />
sampling as under)<br />
(1) U total fish catch is recorded at a centre on each sanlpling day :<br />
Average caich ar k-ill cerrtre per dzy<br />
1 1<br />
Yh,,k=qC Mh#,k, .G,kl wht,re h#l = -C) hfl,#,<br />
ht,k ' "lhlill<br />
b/rmaie oj average carclr at k-th crrrrrr cltrrr~~g rhc nrot~rlil~~ar<br />
brtma/e <strong>of</strong><br />
'hyk<br />
roral caich J - lh water bodp<br />
(1 5)<br />
(16)<br />
where<br />
y,,,, = yield <strong>of</strong> I-th day <strong>of</strong> k-111 centre at j-111 water body <strong>of</strong> I-111 sub-group<br />
DM, = Total fishing days in the k-th centre <strong>of</strong>j-th water body during the montNyear<br />
d,,,, = sample days selected out <strong>of</strong> D, during the mont Wyear<br />
(MontMyear will depend on whelher estimates are prepared n~onthly or yearly)<br />
Mkuk, = Total nets operated on I-th day <strong>of</strong> k-th centre at j-th water body <strong>of</strong> I-th subgroup<br />
~s, = Total nets sampled on I-th day <strong>of</strong>k-th centre at j-th water body <strong>of</strong> I-th sub-group<br />
(2) Iffish catch is recorded by observing further sampling <strong>of</strong> few gears out <strong>of</strong> the total<br />
gears used on the sampling day<br />
Average yieldper srlec/ed waler bdy ojl-ih srrb-bwrrp 111 h-111 slrclrrmt<br />
Similarly, average area jwr Haler<br />
is
fitinrate oj yieldper hoctare (Ratio estimate)<br />
Estimate <strong>of</strong> total yield is (on the basis <strong>of</strong> total l~arvested nrea)<br />
L/~IIIu/~ r,//o/aljis/r pdrrctio~l for /Ire slale rr~rdcr GI orcp-lJ is give11 by<br />
San~plilig Procedure for Group - 111 water bodies:<br />
Stratifed two stage sampling is adopted for this group A list <strong>of</strong> fishing villages<br />
is prepared before hand and then a simple random sample <strong>of</strong> 20% <strong>of</strong> the villages froni<br />
each group is selected for observation <strong>of</strong> catcli by the following procedure.<br />
Each selected centrdfishing village is physically observed on two consecutive<br />
days in each <strong>of</strong> the first and second fortnight during the month. On a selected day <strong>of</strong><br />
miipling at a centre, data is collected during l2OO to 1800 hrs. and on second day from<br />
0600 to 1200 hrs. Data on night landings, if any, in between the consecutive days are<br />
collected by inquiry on the second day. The information should be collected from the<br />
fisllernlen by both enquiry and physical obsetvation. On the second day <strong>of</strong> observation<br />
the investigator should collect inforniation on the total number <strong>of</strong> fishing units operated<br />
on that day, fishing tunits sampled out <strong>of</strong> the total, the total catcli landed from the<br />
observed units and species composition. He should also ascetiain the number d<strong>of</strong> fishing<br />
holidays by esch type <strong>of</strong> fishing units since the last sarrlpling day However, the san~plir~g<br />
days in a nronth may be increased depending on tlre available resources and the units<br />
potential ill fish landings.<br />
N, Nurnber <strong>of</strong> landing centredfishing villages in 11-111 stratum (h=1,2,3)<br />
n, = Number <strong>of</strong> landing centredfishing villages selected in 11-th stratuni<br />
G, =Types <strong>of</strong> nctdgears used in i-th village<br />
D = Number <strong>of</strong> lishing days during the month <strong>of</strong>j-111 type
stratum @I,2 ....... G, ; i=1.2, ........ N,)<br />
dGj = Number <strong>of</strong> sample days during the month <strong>of</strong>j-th type net in i-th village <strong>of</strong> ti-th<br />
stratum (j=1,2 ....... G, ; i=1,2, ........ n,)<br />
Mw = Number <strong>of</strong>j-th type net operated on k-th day in i-th village <strong>of</strong> h-th stratum<br />
= Number <strong>of</strong>j-th type net observed on k-th day in i-th village <strong>of</strong> h-th stratum<br />
Yw - Fishing yield <strong>of</strong>each unit <strong>of</strong>j-th type net on k-th day in i-th village <strong>of</strong> h-th stratum<br />
Average caichper wrrl ('~eU~rei-irde)<br />
firrmare <strong>of</strong> average corch oJ/-lh rjpe rrei pBr duy<br />
dhv<br />
j<br />
h,, hl,k<br />
filinrale <strong>of</strong> average caiclr per cerrire<br />
Total motrlhly ca~ch ill h-ih sirarunr i.r
Reference<br />
I .Cochran,W C..1962.Sampling Techniques. Willey Eastern Limited, New Delhi &<br />
Bangalore.<br />
2.Sukhatme.P.V. Sukhrtme,B.V.. Sukhatme.S and As0k.C. 1984.Sampling Theory<br />
<strong>of</strong> Surveys with applications. lowa State University Press, Ames. lowa<br />
(USA) and Indian Society <strong>of</strong> Agricultural Statistics, New Delhi.<br />
3.Gupta. R.A.. Manda1.S.K. and Maumdar,S., 1997.Methods <strong>of</strong> Collection <strong>of</strong> Inland<br />
Fisheries Statistics in 1ndia.<strong>Central</strong> Inland Capture Fisheries Researcl~<br />
<strong>Institute</strong>, Barrackpore. Bull.No.77.
CORRELATIONS ANL) REGRESSIONS<br />
A.V. Surly* Rao<br />
Cenrrd Rice Research lmtrruta<br />
Cnrtack<br />
CORRELATION<br />
When information on two or more variables are processed. ~t is natural to think<br />
whether any functional relations exist among these variables. If any functional<br />
relationship exists among variables, then a question comes to our mind that how closely<br />
are the variables associated In other words, we seek the degree <strong>of</strong> association among<br />
the variables.<br />
The techniques, developed to measure the degree <strong>of</strong> association among<br />
variables, are known as correlelion methods and when an analysis is performed to<br />
determine the amount <strong>of</strong> correlation with its level <strong>of</strong> significance, it is known as<br />
coneletion analysis. The resulting measures <strong>of</strong> correlat~on are known es correlation<br />
coefficients end it is denoted as r (for simple lineer c<strong>of</strong>relelion between two veriebles).<br />
When more than two variables occur, the correlation coefficlent is denoted as R and is<br />
known as multiple correlation coefficient<br />
Formula for computation <strong>of</strong> simple hear correlation coefficlent r between two<br />
variables, say, X and Y is given by:<br />
r = Cov(X,Y)/ Sqri {(Var X) (Var Y)) I e r = Z xy / d{ (~x')(~y'))<br />
X W n and i' = XYln<br />
The value <strong>of</strong> correlation coefficient lies between -1 to +I and it has no unit.<br />
When the value <strong>of</strong> the correlation coefficient is equal to 0, we say that there is no linear<br />
association between the variables. On the other hand, if the correlation coeffic~ent is<br />
equal to -1, we say that the two variables are negatively associated which means that,<br />
when a positive change in one variable is associated with a negative change In the<br />
other, and when the value <strong>of</strong> the conelatim coeRctent is +I, it is positively associated<br />
indicating there by that, both the variables changes in the same direction.<br />
Even though the value <strong>of</strong> correlation coefficient is zero, it does not indicate the<br />
absence <strong>of</strong> any relationship between two variables It is possible for the two variables to<br />
have a non- linear relationship. This is the reason why it is preferred lo use the word<br />
linear in simple comlation coefficient, instead <strong>of</strong> correlation coefficient.
Test <strong>of</strong> significance <strong>of</strong> the simple linear correlation coefficient by comparing the<br />
computed r value with the tabular r value at n-2 degrees <strong>of</strong> freedom, where n stands for<br />
the number <strong>of</strong> observations with which !he computation is performed. The simple linear<br />
correlation coefficient r is declared to be significant at (say) a level <strong>of</strong> significance if the<br />
absolute value <strong>of</strong> the computed r value is greater than the tabular r value at the a level<br />
<strong>of</strong> significance at n-2 degrees <strong>of</strong> freedom. The term significance is generally to know<br />
whether \he linear correlation coefficient r is different from zero.<br />
In case <strong>of</strong> more than two variables, the linear correlation coefficient is known as<br />
multiple correlation coefficient and is designated as R. The significance <strong>of</strong> R is<br />
assessed by F-test with n-p-I degrees <strong>of</strong> freedom, where p is the number <strong>of</strong><br />
independent variables under study.<br />
Closely related to multiple correlation is that <strong>of</strong> partial correlation. By partial<br />
correlation we mean that the correlation between two variables in a multivariable<br />
problem with a restriction that any common association with the remaining variables has<br />
been eliminated. For example, a first order partial correlation coefficient is one which<br />
measures the degree <strong>of</strong> linear association between two variables after taking into<br />
account thelr common association with a third variable.<br />
If there are three variables say 1, 2 and 3, we can have three simple linear<br />
correlation coefficients i.e. r12, r, and r,. The partial correlation coefficient between two<br />
variables, sey 1 and 2 when the third variable 3 is held constant, i.e. taking into account<br />
the common association with the variable 3. Symbolically, we write this as:<br />
The partial correlation between two variables when the third is held constant, is<br />
also known as first order partial correlation coefficient . Similarly the second order partial<br />
correlation coefficient can be, symbolically , written as<br />
which measures the association ship between variables 1 and 2 independent <strong>of</strong> the<br />
variables 3 and 4<br />
REGRESSION<br />
When two or more variables are related to each other, we not only seek a<br />
mathematical function which tells us how the variables are associated, but also we seek
to know how precisely the value <strong>of</strong> one variable can be predicted if we know the<br />
value(s) <strong>of</strong> the assoclated variable(s). The techniq~s us4 to eccompllsh these<br />
objectives are known as regression methods. Regresston methods are used to<br />
determine the best functional relation among the variables.<br />
Regression procedures can be classified according as per number <strong>of</strong> variables<br />
involved and the form <strong>of</strong> functional relationship between the dependent and<br />
independent variables. The procedure is termed simple if only two variables (one<br />
independent and one dependent variable) are involved. In case <strong>of</strong> more than two<br />
variables the procedure is called as multiple. If the relationship is hear then it is termed<br />
as linear, otherwise nonlinear. Thus the regression analys~s can be classified into four<br />
types as follows.<br />
Simple linear regression<br />
Multiple linear regression<br />
* Simple nonlinear regression and<br />
Multiple nonlinear regression<br />
LINEAR REGRESSION<br />
For simple linear regression analysls to be applicable, the followtng conditions<br />
must hold:<br />
There is only one independent variable, (denoted as X) affecting the dependent<br />
variable ( denoted as Y)<br />
The relationship between Y and Xis known, or can be assumed, to be Itnear.<br />
To compute the regression equation, it is required to estimate the regression<br />
coefficient b and the intercept (constant) a for which it is required to assume one<br />
variable as dependent and the other as an independent As a general practice, the<br />
variable designated as X is an independent and the variable designated as Y is a<br />
dependent on X are assumed. Regression coeffic~enl b is then estimated as:<br />
Estimation b, the regression coefficient and Ihe intercept a may be computed as<br />
follows:
z XY<br />
b = - and a = P - b 2 where the notations have their usual meanings.<br />
For testing the significance <strong>of</strong> b, t-test is employed. The test <strong>of</strong> significance <strong>of</strong> b<br />
ie done to examine whether or not the coefficient b is different from zero. Since !-test is<br />
based on the normal distribution; it is necessary that the variable X must be normally<br />
distributed observed samples. Generalized I-test is given by:<br />
difference<br />
t = ----------------<br />
standard error <strong>of</strong> their difference<br />
The standard error (denoted as 5,)<br />
b is given by:<br />
For testing whether or not the intercept a is different from zero (the regression<br />
line passing through the origin), the formula is given by:<br />
Although the assumption <strong>of</strong> a ltnear relationship between any two variables in<br />
biological materiels seldom holds, it is usually adequate within a relatively small range<br />
in the values <strong>of</strong> independent variable. For example, the growth rate (as measured by<br />
weight or size) <strong>of</strong> living indtviduais is rapid at younger age and remain static or declines<br />
considerably as the individuals become older.<br />
The relationship between any two variables is linear if the change is constant<br />
throughout the entire range under study. Math~matically, the equation to a straight line<br />
is given as:<br />
Y = a + bX where,<br />
Y is a dependent variable; a is an intercept (a constant);<br />
b is a slop (regression coefficient) and<br />
X is an independent variable<br />
The graphical representation <strong>of</strong> a linear relationship is a straight line, that is the<br />
shortest distance between any two points, looks as:
(Graphical representation <strong>of</strong> a straight line)<br />
The value <strong>of</strong> dependent variable (Y) can be determined by using the above<br />
mathematical representation, corresponding to a given value <strong>of</strong> the independent<br />
variable X (within the range <strong>of</strong> X values).<br />
When there are more than one independent variable, say p independent<br />
variables (XI, Xz, ... X), the simple linear function form <strong>of</strong> mathematical representation<br />
i.e. equation is as follows:<br />
Where, a is the intercept (constant and the value <strong>of</strong> Y when all X's are zero) and<br />
bl 's are partial regression coefficients associated with the independent variables XI<br />
This represents the amount <strong>of</strong> change in Y for each unit changes in Xl,s.<br />
When the values <strong>of</strong> b, 's are not zero, it indicates the dependence <strong>of</strong> Y on Xis.<br />
Hence test <strong>of</strong> significance <strong>of</strong> b,'s are necessary to determine whether or not b = 0 is an<br />
essential for the regression analysis. Sometimes we may also seek to test the<br />
significance <strong>of</strong> the intercept to know whether or not a = a, where a, is any value<br />
specified by us. For example, if we wish to determine whether Y = 0 when Xlbs in the<br />
equation is zero. This is nothing but to check whether the line passes through the origin.<br />
For this, we must test whether or not a = 0.<br />
Homogeneity <strong>of</strong> Regression Coefficienl:<br />
When several linear regressions are estimated (due to different<br />
environments), it is usually important to determine whether various regression<br />
coefficients (slopes) <strong>of</strong> regression lines differ from each other. This is what is known as<br />
testing the homogeneity <strong>of</strong> regression coefficients.<br />
Of course, the concept homogeneity <strong>of</strong> regression coefficient is closely related to<br />
the interaction effecls among different factors in Analysis <strong>of</strong> Variance. Regression lines<br />
having equal slopes (non s$nificance <strong>of</strong> b's) are parallel to each other indicating that<br />
there is no interaction effect among the factors. It is to be noted that homogeneity <strong>of</strong>
egression does not imply equivalence <strong>of</strong> regression lines. For two or more regression<br />
lines to be coincide, the intercepts and slopes must be homogeneous.<br />
MULTIPLE LINEAR REGRESSION<br />
Regression analysis, involving more than one independent variable, is called<br />
mulliple regression analysis. When all independent variables are assumed to affect the<br />
dependent variable in a linear fashion and independently <strong>of</strong> each other, the procedure is<br />
called multiple linear regression analysis.<br />
The multiple regression analysis involves eslimalion and test <strong>of</strong> significance <strong>of</strong><br />
p+l parameters (a, b,, b, ,... b,) by means <strong>of</strong> F=-test employing Analysis <strong>of</strong> Variance<br />
(ANOVA). The slructure <strong>of</strong> ANOVA for regression analysis is as follows:<br />
SOURCE D.F SS MSS F<br />
Due lo Regression p 1 (b,)(~(x,Y)<br />
-+ RSS RSS/p + A NB<br />
Dev.from Regression n-p-1 Z (Y' - RSS) -+ ESS ESSln-p-1-4 6<br />
Total n-1 Z Y'<br />
hl<br />
Coeffic~ent <strong>of</strong> determlnatlon R' IS computed as R'IRSS whlch measures the<br />
contr~but~on <strong>of</strong> the llnear funct~on <strong>of</strong> p Independent varlables to the dependent varlable Y<br />
and ~ts square root that IS R IS mult~ple correlation coefficlent The coefficlent <strong>of</strong><br />
determlnatlon IS generally expressed In percentage whlch Infers the total varlatlon In the<br />
dependent varlable contributed by the Independent varlables<br />
The computed F value is compared to the tabular F value <strong>of</strong> variance ratio table<br />
<strong>of</strong> Fisher & Yales with (n-p-1) degrees <strong>of</strong> freedom. If the computed value <strong>of</strong> F is greater<br />
than the tabular F value, we say that the estimated linear multiple regression is<br />
signlflcant at a specified level <strong>of</strong> significance. Generally, 5% (P=0.05) and 1% (P=0.01)<br />
level <strong>of</strong> significance are specified for agricultural experiments.<br />
The significance <strong>of</strong> linear regression indicates that some portion <strong>of</strong> the variability<br />
in dependent variable Y is explained by the linear function <strong>of</strong> independent variables Xi<br />
Coefficient <strong>of</strong> determination, denoted as RZ (square <strong>of</strong> the multiple correlation) provides<br />
the lnforrnation on the size <strong>of</strong> that portion. Hence, if the value <strong>of</strong> R2 is high then the<br />
regression equation explains better. On the other hand, it the value <strong>of</strong> RZ is low, even if<br />
the F test is significant, the regression equation may not be <strong>of</strong> any meaning to the<br />
experimenter. It is also true that the value <strong>of</strong> ~'Increasee with the increase in number <strong>of</strong><br />
independent variables. Care should be taken to discard the variables which are highly<br />
correlated among themselves. The analysis becomes cumbersome when independent<br />
variables increase considerably.
Two important points are to be kept in mind while going for linear regression<br />
analysis.<br />
P The effect <strong>of</strong> each and every independent variables on the dependent variable<br />
should be linear. That is the amount <strong>of</strong> change in Y per unit change in XI is constant<br />
through out the range <strong>of</strong> XI values under study.<br />
P The effect <strong>of</strong> each XI on Y should be independent <strong>of</strong> other X<br />
Violation <strong>of</strong> any one or both the above mentioned points leads to what is known as<br />
non-linear relationship.<br />
SIMPLE NONLINEAR REGRESSION<br />
Functional relat~onship between two variables is said to be nonl~near if the rate <strong>of</strong><br />
change in dependent variable Y per unit change in independent var~able X is not<br />
constant. It is quite common to have such nonlinear relationship in biological organism.<br />
When the relationship among variables is not linear, the regression analysis is<br />
inadequate and therefore one must go for nonlinear regression analysis.<br />
A few mathematical models which are frequently encountered in applied<br />
research are given below:<br />
i) 'f=abx<br />
ii) Y = a + blX<br />
iii) Y = a + bX + cx2<br />
These nonlinear relationship can be made linear by simply transforming either<br />
one or more variables and then the procedure <strong>of</strong> linear regression technique can be<br />
applied.<br />
Equation (i) can be made linear by taking logarithm both sides. Similarly<br />
equation (ii) can be made linear by taking 1IX as X'. In case <strong>of</strong> (iii), an additional term<br />
cx2 is added in to the equation to a straight line. Here the additional term was created to<br />
make the model linear.<br />
MULTIPLE NONLINEAR REGRESSION<br />
When the relationship between the dependent variable Y and a set <strong>of</strong><br />
independent variables Xi 's is not linear, it is said to be multiple nonlinear relationship.<br />
Following are the reasons for the existence <strong>of</strong> nonlinear relationship.
i) At least one <strong>of</strong> the independent variables exhibits a nonlinear relationship with<br />
the dependent variable.<br />
ii)<br />
If any two independent variables interact with each other.<br />
The analytical procedure for nonlinear relationship becomes cumbersome when<br />
the independent variables Increase.<br />
HOW TO FIND THE BEST FUNCTIONAL RELATIONSHIP<br />
in order to search for best functional relationship, several techniques are<br />
available. The most commonly used techniques for identifying best relationship among<br />
variables are (i) scatter d~agram technique, (ii) lest <strong>of</strong> significance technique and (iii)<br />
step wise regression technique.<br />
(i) Scatter diagram technique:<br />
It 1s most simplest and commonly used technique in determining the relationship<br />
between two var~ables. In this technique, all the pair <strong>of</strong> values <strong>of</strong> X and Y variables are<br />
plolted(as dots) in X-Y plane to get a scattered diagram. This diagram can be<br />
examined to ensure the pattern <strong>of</strong> the functional relationship.<br />
(~i) Test <strong>of</strong> significance lechn~que :<br />
This technique is used to eliminate unnecessary variables in the regression<br />
equat~on. Based on this technique, regression coefficients which are non-significant can<br />
be dropped while obtaining the functional relationship.<br />
(iii) Step-wise regression lechnique:<br />
This lechnique Is almost similar lo the test <strong>of</strong> significance technique where in all<br />
significant variables are included in regression. This objective can also be achieved by<br />
employing step-wise regression technique in adding variables, one at time. Here it is<br />
kept in mind that some variables may be dropped while determining the functional<br />
relationship even if they are perfectly associated.<br />
SOME MISUSES AND MISINTERPRETATIONS OF CORRELATION AND<br />
REGRESSION ANALYSIS<br />
Correlation and regression analysis is one <strong>of</strong> the most powerful tool in agriculture. It<br />
leads to incorrect interpretation <strong>of</strong> the result if the analysis is misused. One <strong>of</strong> the most<br />
commonly misuse associated with correlation and regression is to generalize the<br />
functional relationship beyond the data range, that is by extrapolating the result out
sMe !he range <strong>of</strong> the data in lndepandent variable. The generalization <strong>of</strong> regresslon<br />
beyond the original date is risky and should be attempted with proper knowledge in<br />
biological phenomenon.<br />
Another area <strong>of</strong> misuse the functional relationship is the application <strong>of</strong><br />
generalized results for substitution. As far as practicable, the method <strong>of</strong> substitution be<br />
avoided. Only in some limited cases where there is wide range <strong>of</strong> variation exist, the<br />
substitution can be employed.<br />
Some times data from individual replications are employed to find the functional<br />
relationship. Care should be taken to employ the mean data over all replications for<br />
determining the functional relationship. If in the ANOVA, significant difference is<br />
detected among replications, then data from individual replications can be considered if<br />
determining the functional relationship.<br />
In simple correlation analysis, if r turns out to be significant implies the presence<br />
<strong>of</strong> causal reiationship between two variables. Even though correlation analysis<br />
quantifies the degree <strong>of</strong> association, it cannot provide the reason for such association.<br />
A non-significant r value cannot be taken to imply the absence <strong>of</strong> any functional<br />
relationship between two variables. Two variables may have nonlinear relationship<br />
even if r value is non-significant.
ON SOME STATISTICAL PROCEDURES FOR ANALYSIS OF<br />
DATA FROM FIELD EXPERIMENTS<br />
G. R. Maruthi Sankar<br />
Cenfrsl Research lnsl~fufe for Dryland Agricullure, ICAR,<br />
Santoshnagar, Hydembad- 500 059<br />
Correlation and regression techniques are used for assessing the relationships<br />
and predictions <strong>of</strong> variables. The d~fferent procedures <strong>of</strong> correlation like simple, partial,<br />
multiple. Rank, intra-class and correlation ratio are useful for different situations for<br />
assessing the relationships <strong>of</strong> variables. The simple and multiple regressions will be<br />
useful for making prediction <strong>of</strong> a dependent variable through a set <strong>of</strong> independent<br />
variables in different situations. The estimates <strong>of</strong> correlation and regression coefficients<br />
are tested using different stalistical tests <strong>of</strong> significance for valid inferences. The criteria<br />
for assessing model selection, comparison <strong>of</strong> models, sensitivity <strong>of</strong> regression are<br />
discussed. Some <strong>of</strong> the problems like multicollinearity and extreme observations In the<br />
data analysis are also discussed.<br />
MEASURES OF CORRELATION<br />
I. Slrnple Correlation : It measures relationship between two variables 'X' and 'Y'.<br />
It ranges from -1 tc +l.<br />
Z XY - (Z X) (I: Y) 1 n<br />
r = ----------------------------------<br />
\/IT~' - IT~)' /n) (u'- (TX)' in)<br />
2. Partlal Correlation (first order) : It measures the partial relationship between<br />
two variables 'Y' end 'XI' keeping the effect <strong>of</strong> a third variable 'X2' as constant.<br />
It ranges between -1 and +l.<br />
3. Partial Correlation (second order) : II measures partial relationship between<br />
two variables 'Y' and 'XI' keeping the effects <strong>of</strong> two other variables 'X2' and 'X3'<br />
as constant. It ranges between -1 and +l.
4. Multiple Correlation : It measures the correlation <strong>of</strong> a dependent variable 'Y'<br />
with a set <strong>of</strong> 2 or more independent variables 'X' together. It ranges between 0<br />
and 1.<br />
5. Rank Correlation : It measures correlation between ranks <strong>of</strong> two variables<br />
instead <strong>of</strong> the actual observations <strong>of</strong> variables. It ranges between 0 to 1<br />
where d I is the difference in ranks.<br />
6. Correlation Ratio : Correlation ratio 'q' is the appropriate measure <strong>of</strong> curvilinear<br />
relationship when the relationship between two variables is not linear. If<br />
relation is linear then q = r, otherwise q > r. It ranges between -1 to +I.<br />
7. Intra-class correlation : Intra-class correlation means within class-correlation.<br />
Here both the variables measure same characteristics. It Is Ihs correlation wilhin<br />
a variable with respect to some common characteristic. For example, we may<br />
work out intra-class correlation between yields <strong>of</strong> plots. Suppose there are A,,<br />
A2, ..... A, families with kt, k2, .....k. members, and let x , (i = 1,2 ,... n ; j<br />
=1,2, ..... k ,) denote the measurement on the jth member in the i th family, then<br />
intra-class correlation can be given as<br />
If k ,= k (i.e., if all families have equal members), then<br />
r = (1 I (k-I)] [(k a: 1 a 2, - 11<br />
where 0 "enotes the variance <strong>of</strong> X and 02 denotes the variance <strong>of</strong> means <strong>of</strong><br />
families. The intra-class correlation ranges between - Ill (k-1)] and 1.
MEASURES OF REGRESSION<br />
1. Slmple Regression : It measures the functional relationship between a dependent<br />
variable 'Y' and an independent variable 'X' with estimates <strong>of</strong> an intercept (a)<br />
and a slope (I)). The estimates <strong>of</strong> a and P can be negative, zero or positive. The<br />
linear regression is given as<br />
2. Multlple Regresalon : If the dependent variable 'Y' is a function <strong>of</strong> a set <strong>of</strong><br />
independent variables 'X', then the estimates <strong>of</strong> regression coefficients <strong>of</strong><br />
different variables (p) along with the intercept (a) are estimated using the matrix<br />
algebra. The multiple regression <strong>of</strong> 'Y' through different independent variables<br />
can be given as<br />
@<br />
= (x'x)" X'y<br />
The regression coefficients can be negative, zero or positive and would<br />
measure the rates <strong>of</strong> change in 'Y' for an unit change in the Independent variables<br />
3. Polynomlsl Regrrsslon : If the dependent variable 'Y' is a function <strong>of</strong> linear and<br />
other higher order effects <strong>of</strong> an independent variable 'X', then the polynomial regression<br />
is fitted to quantify the effects <strong>of</strong> a variable and its significance at different orders for<br />
prediction <strong>of</strong> 'Y'. The nth order polynomial regression <strong>of</strong> 'Y' can be given as<br />
Y .: a + pl x1 + ~1 xI2 + kxl3 + b4 xI4 + ------------<br />
= (X'X).' X'y<br />
P<br />
+ Pn Xln<br />
The polynomial regression coefficients can be negative, zero or positive and<br />
would measure the rates <strong>of</strong> change in 'Y' for an unit change in the independent<br />
variable.<br />
TESTS OF SIGNIFICANCE<br />
1. Testlng slgnlflcance In data <strong>of</strong> large samples: If X is distributed as Normal with<br />
mean p and variance U, then Z = (X-p )lo is distributed as Normal with mean 0<br />
and variance 1. If 121 > 1.96, then the sample mean is inferred to be significantly<br />
different from population mean at 5 % level <strong>of</strong> significance. If JZI > 2.58, then the<br />
sample mean is significantly different from population mean at 1 % level <strong>of</strong><br />
significance.
2. Testing single proportion : If P is proportion <strong>of</strong> success and Q=1-P is proportion <strong>of</strong><br />
failure. If mean = n P and variance = n P Q, then Z = [X - n P] I (n P Q) is<br />
distributed as Normal with mean 0 and variance 1. Same conclusions as above.<br />
3. Testing difference <strong>of</strong> proportions : Let pl = X1 I nl and p2 = X2 I n2. Mean (pl)<br />
= P1 & Mean (p2) = P2. Variance (pl) = PI Q1 I nl & V (p2) = P2 Q2 I n2<br />
Z is distributed as Normal with mean 0 and variance 1. Same conclusions as above<br />
4. Testing a mean in small samples : if X is distributed as Normal with mean p and<br />
variance o, then 2 = [ (x-p) I (a1 sqrt (n)) ] is distributed as Normal with mean 0<br />
and varianca 1. Same conciusions as above.<br />
5. Testing differences <strong>of</strong> two means : If 3 1 andT2 are means and o,' and 02'<br />
are variances based on two samples w~th nl and n2 observations, then<br />
-<br />
x1 -X2<br />
z = -----------------------<br />
(oI2 I nl) + (a: I n2)<br />
is distributed as Normal with mean 0 and variance 1. Same conclusions as above.<br />
6. Testing differences <strong>of</strong> standard deviatlons : If $1 and s2 are standard deviations<br />
<strong>of</strong> two samples with nl and n2 observations from Normal distribution with<br />
variances o12 and oz2, then<br />
sl - s2<br />
is distributed as Normal with mean 0 and variance 1. Same conclusions as above<br />
7. Testing the dlfference between sample correlation ( r ) and population<br />
correlation ( p) by making 2-transformation can be given as<br />
A<br />
z- z<br />
-<br />
z = log J G l<br />
z= 1,.JiGzTl
8. Testing the difference between two conelatlon coefficlanb 'rl' and 'rZ' by<br />
making 2-transformation can be given as<br />
ZI = log .d [(I + rl)<br />
- rl)l<br />
9. Testing the observed correlation 'r' between two variables against 'zero' can be<br />
given as<br />
r<br />
10. Testing the partial correlation 'r' between two variables keeping the effects <strong>of</strong><br />
a third variable as constant can be given as<br />
11. Testing the regression coefficlent (slope) 'p' <strong>of</strong> an independent variable 'X' can<br />
be given as<br />
P<br />
1 = -----------------------<br />
12. Testltlg the regrossion coefficient (intercept) 'a' can be given as<br />
a - a'<br />
t = --* --------------------<br />
13. Testing tile liomogeneity <strong>of</strong> regression coefficients (slopes) <strong>of</strong> 'k' sets <strong>of</strong> data<br />
(or over different seasons) can be given as
This is distributed as F with (k-1. Z n - 2k) degrees <strong>of</strong> freedom<br />
G=D-E~IC<br />
B = sum <strong>of</strong> 'residual sum <strong>of</strong> squares' <strong>of</strong> k sets<br />
C = sum <strong>of</strong> 'corrected sum <strong>of</strong> squares' <strong>of</strong> X <strong>of</strong> k sets<br />
D = sum <strong>of</strong> 'corrected sum <strong>of</strong> squares' <strong>of</strong> Y <strong>of</strong> k sets<br />
E = sum <strong>of</strong> 'corrected sum <strong>of</strong> squares' <strong>of</strong> products <strong>of</strong> X and Y <strong>of</strong> k sets<br />
14. Testing the predictability value (R') <strong>of</strong> a regression model with 'k'<br />
independent regressor variables can be given as<br />
SSR ~,EX1y+(+~X2Y+ +Pkzxky<br />
R2 = = -----------------------<br />
*........................ *-----<br />
Z Y'<br />
Y'<br />
where SSR is sum <strong>of</strong> squares due to regression<br />
15. Testing the R' adequacy <strong>of</strong> a model with 'p' regressors compared to a model<br />
with 'q' regressors where p < q<br />
where F is wlth (q, n - q - 1) degrees <strong>of</strong> freedom<br />
where ~~a = 1 - ( l-~~~)(l+ d)<br />
16. Testing the sufficiency <strong>of</strong> a model with Residual Mean Square Ratio (RMSR)<br />
criterion : This is used for testing the sufficiency <strong>of</strong> a regression model with 'p'<br />
regressors compared to a model with 'q' regressors based on F-test and can be<br />
given as<br />
where RSS is residual sum <strong>of</strong> squares ; RMSS is residual mean sum <strong>of</strong> squares.<br />
This is distributed as F with (q - p . n - q - 1) degrees <strong>of</strong> freedom
17. Percentage Rnlative EMckncy (PRE) <strong>of</strong> a ngnsrlon model 'A' comparud to a<br />
regression model '0' can be given as<br />
aZB(n+q+1)/n<br />
PRE (A) - X 100<br />
02,(n+p+ 1)ln<br />
where and a' are Realdual mean sum <strong>of</strong> squares <strong>of</strong> models 'A' and '8' models<br />
PROBLEMS OF REGRESSION<br />
1. Multlcolllnearlty: High and significant correlations between different variables<br />
compared to the over all multiple correlation and predictability <strong>of</strong> a model. This<br />
will result in linear dependence <strong>of</strong> a variable on another variable and insensitive<br />
regression coefficients for prediction. The multicollinearity can be assessed by<br />
computing an estimate <strong>of</strong> X2 and can be given as<br />
x2 = - n - I - (116) (2k + 5) log , (D)<br />
where D = value <strong>of</strong> standardised determinant<br />
n = number <strong>of</strong> observations<br />
k = number <strong>of</strong> independent variables<br />
2. Examine the resldualr for Identifying 'Outilers, High leverage and Influential'<br />
observations, testing and deletion, and improving the predictability <strong>of</strong> models.<br />
The residuals can be examined in different forms as normalised , standardised,<br />
internally studentised and externally studentised residuals.<br />
Normalised : e I = f (el , eve) = el I \j e'e<br />
Standardised : b = f (el , o ) = el l a<br />
where o = \I-<br />
Internally studentised : r~ = f (e \ , a (1- p N) = e \/ o (I- p ,)<br />
Externally studentised : r , ' = f (e 1, o I (1 - p = e I I o 1(1 - p R)<br />
where at2 = o ,, (1 - p #)
, Effectm <strong>of</strong> variables on a model : Examine the effects <strong>of</strong> independent variables on<br />
the dependent variable for their sensitivity and significances, linear dependence<br />
and muiticollineaity, lack <strong>of</strong> homogeneity <strong>of</strong> variances, randomness <strong>of</strong><br />
independent variables, autocorrelation <strong>of</strong> variables, extreme nature <strong>of</strong> variable in<br />
its relationships with other variables, violation <strong>of</strong> the assumption <strong>of</strong> normality and<br />
other aspects.<br />
4. Normal Distribution : The normal distribution can be given as<br />
(a) The curve is bell shaped and symmetrical about the line x = p<br />
(b) Mean, Median and Mode would coincide<br />
(c) As x increases numerically, f (x) decreases rapidly, the maximum probability<br />
occurring at the point x = p<br />
(d) pl = 0 (Skewness) and P, = 3 (Kurtosis)<br />
(e) Linear combination <strong>of</strong> independent normal variales is also a norrnal variate<br />
(f) Area property : P (p - o c X c (p + o) = 0.6826<br />
P (p -2 o c X c (p + 2 a) = 0.9544<br />
P (p -3 o c X < (p + 3 o) = 0.9973<br />
(g) x-axis is an asymptote to the normal curve<br />
(h) The points <strong>of</strong> inflexion <strong>of</strong> the curve are given by x = f (X) = 111 2 ] e +In1<br />
(i) Mean deviation about mean i s p CJ = (4 15) o<br />
(j) Quartile deviation = (Q3 - Ql) 12 = (2 13) 0<br />
(k)p2r+l=O(r=0,1.2.........)<br />
p2r "1.3.5 ........(2r-l)02r(r=0,1,2.........)<br />
This implies p 1 = 0 p 3 = 0 15 = 0 .......... (odd moments)<br />
pZ=I p4=3 ..........(even moments)
FUNDAMENTALS OF DESIGN AND ANALYSIS OF FIELD EXPERIMENTS<br />
WITH A NOTE ON TRANSFORMATION OF DATA<br />
Ravi R. Saxena and A. K. Roy*<br />
lndira Gendhl Agricultural Universiw<br />
Reipur-492012 M P.<br />
Bioinformalics Centre<br />
CIFA, Kausalyagangs, Bhubaneswar-751002, Orissa<br />
INTRODUCTION<br />
Experience has shown that proper consideration <strong>of</strong> statistical analysis before<br />
Ihe experiment is conducted, forces the experimenter to plan move carefully the design<br />
<strong>of</strong> experiment. The observations obtained from a carefully planned and welldesigned<br />
experiment In advance give entirely valid inferences. The subject-matter <strong>of</strong> the design<br />
<strong>of</strong> experiment includes.<br />
- planning <strong>of</strong> the experiment<br />
- oblaining the relevant information from it regarding the slatistical hypothesis<br />
under study<br />
- making statistical analysis <strong>of</strong> the data<br />
Somo Important definitions<br />
m n t<br />
: An experinienl is a device or a means <strong>of</strong> getting an answer to the problem<br />
under consideration e.g. comparison <strong>of</strong> different doses <strong>of</strong> feed or different<br />
species <strong>of</strong> fish etc.<br />
:The smallest division <strong>of</strong> the experimental material to which we apply<br />
the trealmenls and on which we make the observation on the variable under<br />
study e.g. in field experiments the plot <strong>of</strong> land is the experimental unit or pond<br />
may be experimental unit.<br />
&&n,ent: Various object <strong>of</strong> comparison in a experiment is called as treatments e.g.<br />
different species <strong>of</strong> fish or methods <strong>of</strong> cultivation are the treatments.<br />
w: Plot to plot variation under identical condition, which is due to<br />
random or chance factors beyond human control is known as experimental<br />
error.<br />
There are three important principles<br />
inherent in all experimental design.<br />
m: Replication means that a treatment is repeated two or more times, Its<br />
function is to provide an estimate <strong>of</strong> experimental error.<br />
m: Randomization is a process <strong>of</strong> assigning the treatments to various<br />
experimental unit in a purely chance manner. Its function is to assure unbiased<br />
estimates <strong>of</strong> treatment means and experimental error.<br />
<strong>of</strong> an F w :
Lacal : The process <strong>of</strong> reducing the experimental error by dividing the relatively<br />
heterogeneous experimental area into homogeneous experimental area into<br />
homogeneous groups is known as {ocal control. By reducing the experimenlal<br />
error, we can increase the efficiency <strong>of</strong> the design.<br />
Now, we shall discuss the layout and the analysis <strong>of</strong> the important designs <strong>of</strong><br />
experiments<br />
Completely Randomlsed Designs (C.R.D.)<br />
- Simplest <strong>of</strong> all the designs, based on the principles <strong>of</strong> randomization and<br />
replication<br />
- treatments are assigned completely at random to each experimental unit.<br />
Hence, the CRD is only appropriate for experiments with homogeneous<br />
experirnental units, such as laboratory experiments, where environmental effects are<br />
relatively easy to control.<br />
Randomization and Layout<br />
For a experiment with four treatments TI, T2, T3 and T4 each repeated five<br />
times, the step-by-step procedures for randomization and layout <strong>of</strong> a CRD are as<br />
follows:<br />
Step 1. Determine the total number <strong>of</strong> experimental plot(n) by simply multiplying the<br />
number <strong>of</strong> treatment(t) and number <strong>of</strong> repetitions(r) i.e. n=(r)(t). For our<br />
example n=5x4=20.<br />
Step 2. Assign a plot number to each experimental plot is from 1 to n. For our<br />
example, the plot numbers 1.........20 are assigned to the 20 experimental plots<br />
as shown in following figure.<br />
Plot No.<br />
Treatment<br />
Step 3. Assign the treatments to the experimental plots by using any randomization<br />
schemes such as random number table or by drawing cards or by drawing lots,<br />
as given in figure.
Analyrla <strong>of</strong> variance<br />
- There are two sources <strong>of</strong> variation. One is the trealrnent variation, the other is<br />
experimental error.<br />
- A major advantage <strong>of</strong> the CRD is the simplicity in the computation <strong>of</strong> its analysis<br />
<strong>of</strong> variance, espedally when the number <strong>of</strong> replication is not uniform for all<br />
treatments.<br />
CUD for equal replication<br />
The steps involved in the analysis <strong>of</strong> variance <strong>of</strong> data from a CRD experiment<br />
with equal number <strong>of</strong> replication are given below. We use the data from an experiment<br />
in the laboratory using CRD with four pots and five varieties.<br />
Step 1. Arrange the data by treatments and calculate treatment total (T) and grand<br />
total (G)<br />
Step 2. Construct an outllne <strong>of</strong> the analyrir <strong>of</strong> varlrnce as followr<br />
Source <strong>of</strong> Degree <strong>of</strong> Sum <strong>of</strong> Mean Computed Tabular<br />
variation freedom sauares sauare F F<br />
Treatment<br />
Experlrnenlal<br />
error<br />
Total<br />
Step 3. Determine the degree <strong>of</strong> freedom (d.f.) for each source <strong>of</strong> variation, if t<br />
represent the number <strong>of</strong> treatments and r, the number <strong>of</strong> replications<br />
Total d.f. = (r)(t)-1 = (4)x(5)-1 = 19<br />
Treatment d.f. = t - 1 = 5 - 1 = 4<br />
error d.f. = t (r - 1 ) = 5(4-1) = 15<br />
error d.f, can be obtained through subtraction as<br />
Error d.f. = Total d.f. - treatment d.f.<br />
= 1Q -4 =I5<br />
Table 1. Experimental data obtained from an experiment<br />
Treatment Yield Treatment Treatment<br />
R 1 R2 R3 R4 Total Mean<br />
TI 25 21 21 18 85 21.2<br />
T2 25 28 24 25 102 25.5<br />
T3 24 24 16 21 85 21.2<br />
T4 20 17 16 19 72 18.0<br />
T5 14 15 13 11 53 13.2<br />
Grand total 397<br />
Grad mean 19.8
Step4: Calculate the correction factor and various sums <strong>of</strong> squares (SS)<br />
Correction factor (C.F.) =<br />
Treatment SS<br />
c TI<br />
- 1.1<br />
r<br />
C. F.<br />
= 331.30<br />
Error SS =.Total SS - Treatment SS<br />
Step 5: Calculate the mean square (MS) for each sources <strong>of</strong> variation by dividing<br />
each SS by its corresponding d.f.<br />
Treatment SS<br />
Treatment MS =<br />
I-1<br />
Error SS<br />
Error MS = -<br />
I(r- I)
Step 6: Calculate the F value for testing the significance <strong>of</strong> the treatment difference as<br />
I:=<br />
'Treatment MS<br />
Error MS<br />
Step 7: Obtain the tabular F-values<br />
fl = treatment d.f. = (t-1) = 4<br />
f2 = error d.f. = I(r-I) = 15<br />
For our example, the tabular F-values w~th fl=4 and f2 = 15 d.f. is 2.131 at 5%<br />
level <strong>of</strong> significance.<br />
Step 8: Enter all the computed values in the ANOVA table<br />
Source <strong>of</strong> Degree <strong>of</strong> Sum <strong>of</strong> Mean Computed Tabular F<br />
variation freedom squares squares F 5%<br />
Treatment 4 331.30 82.825 13.043. 2.131<br />
Experimental 15 95.25 6.35<br />
error<br />
Total 19 426.55<br />
' Significant at 5% level<br />
Step 9: Compare the computed F value with the Tabular F value and decide on the<br />
significance on the d~fference among treatments. For our example it is<br />
significant at 5% level <strong>of</strong> significance.<br />
Step 10: Compute the grand mean and the coefficient <strong>of</strong> variation (CV) as follows:<br />
Grand mean = Gln<br />
J~rror MS xiOO<br />
CC' = Grvld mean
For our example<br />
397<br />
Grand mean = - = 19.8<br />
20<br />
The CV indicates the degree <strong>of</strong> precision with which the treatments are<br />
compared and is a good index <strong>of</strong> the reliability <strong>of</strong> the treatment. It is generally placed<br />
below the analysis <strong>of</strong> variance table.<br />
CRD for unequal replication<br />
The CRD is commonly used for studies where the experimental material makes<br />
it difficult to use an equal number <strong>of</strong> replication for all treatments. Some examples <strong>of</strong><br />
these cases are:<br />
- Feeding experiments where the number <strong>of</strong> fish for each breed is not the same<br />
- Experiments for comparing body weight and length <strong>of</strong> d~fferent species<br />
- Experiments that are originally set up wlth an equal number <strong>of</strong> replications but<br />
some experimental unit are likely to be lost or destroyed during experimentation.<br />
The analysis <strong>of</strong> variance for data from a CRD experiment with an unequal<br />
number <strong>of</strong> replications are given below.<br />
C.F. = ~ 'ln<br />
Total SS =<br />
1-1<br />
X: - C.F.<br />
' 1;=<br />
Treatment SS = x- - CF..<br />
1-1 r,<br />
Error SS = Total SS - Treatment SS<br />
Follow the same procedure as given previously and complete the analysis <strong>of</strong><br />
variance table.<br />
RANDOMISED COMPLETE BLOCK DESIGN (RCBD)<br />
Features :<br />
- Most widely used experimental designs in agricullural research.<br />
- Especially suited for experiments where the number <strong>of</strong> treatment is not large.
- Important feature <strong>of</strong> the RCB design Is the presence <strong>of</strong> blocks <strong>of</strong> equal size,<br />
each <strong>of</strong> which contains all the treatments.<br />
Randomization & layout :<br />
- Randomization process is applied separately and independently to each <strong>of</strong> the<br />
blocks.<br />
If there are six treatments TI, T2, T3 T4, T5 and T6 and three replications, we<br />
illustrate the procedure in the following steps.<br />
Step 1. Divide the experimental area into r equal blocks, where r is the number <strong>of</strong><br />
replications. For our example, the experimental area is divide into three blocks.<br />
Ulock I. Block 2. Block 3.<br />
Step 2.Sub divide the block into t experimental plots where t is the number <strong>of</strong><br />
treatments.<br />
Step 3. Assign t treatments at random to the t-plots applying any <strong>of</strong> the randomization<br />
schemes. For our example six treatments are assigned at random to the six<br />
plot using random number table.<br />
Step 4. Repeat the above steps for each <strong>of</strong> the remaining blocks<br />
Analysis <strong>of</strong> Variance<br />
-<br />
There are three sources <strong>of</strong> variability in RCB design; treatment, replication (or<br />
block) and experimental error.<br />
To illustrate the steps involved in the analysis <strong>of</strong> variance for data from a RCB<br />
design We use the data from an experiment that compared five varieties <strong>of</strong> fish given<br />
below in Table.
Step 1. Group the data hy treatments and replications and calculate treatment total(T).<br />
replication total (R) arid grand total (G)<br />
Step 2. Out line <strong>of</strong> the analysis <strong>of</strong> variance as foilom<br />
Source <strong>of</strong> Degree <strong>of</strong> Sum <strong>of</strong> Mean Computed Tabular<br />
variation freedom squares square F F<br />
5% 1%<br />
Replication<br />
Treatment<br />
Error<br />
Total<br />
Table 2 yield <strong>of</strong> different varieties<br />
Variety Replication Total Mean<br />
I I I 111 IV<br />
V1 22.9 25.9 39.1 33.9 121.8 30.4<br />
V2 29.5 30.4 35.3 29.6 124.8 31.2<br />
V3 28.8 24.4 32.1 28.8 113.9 28.5<br />
V4 47.0 40.9 42.8 32.1 162.8 40.7<br />
V5 28.9 20.4 21.1 31.8 102.2 25.6<br />
Replication 157.1 142.0 170.4 156.0<br />
total(R)<br />
Grand total (G) 625.5<br />
Grand mean 31.30<br />
Step 3. Determine the degree <strong>of</strong> freedom for each sources <strong>of</strong> varlatlon. If r, represent<br />
number <strong>of</strong> replication and 1, the number <strong>of</strong> treatments, then<br />
Total d.f. = rt - 1 = 20 - 1 = 19<br />
Replication d.f. = r - 1 = 4 - 1 = 3<br />
Treatment d.f. = t - 1 = 5 - 1 = 4<br />
Error d.f. = (r - 1) (t - 1) = (3).(4) = 12<br />
The error d.f. can also be computed by subtraction 6s follows<br />
Error d,f. = Total d.f. - Replication d.f. - treatment d.f.<br />
= 19-3-4= 12<br />
Step 4. Compute the correction factor and various sums <strong>of</strong> squares (SS) as follows
i; R:<br />
Replication SS k!-- - C. F.<br />
1<br />
,<br />
1 7;'<br />
Trealment SS = LLr<br />
- C.F.<br />
Error SS = Total SS - Replication SS -Treatment SS<br />
= 351.10<br />
Step 5. Compute the mean square for each source <strong>of</strong> variation by dividing each sum <strong>of</strong><br />
squares by its corresponding degree <strong>of</strong> freedom.<br />
Replication MS =<br />
Replication SS<br />
r-l<br />
Treatment SS<br />
Treatment MS =<br />
1-1<br />
Error MS =<br />
Error SS<br />
(r - l)(f - I)
Step 6. Compute the F value for testing the treatment difference as<br />
Treatment MS<br />
F, =<br />
Error MS<br />
Replication MS<br />
F, =<br />
Error MS<br />
Step 7. Compare the computed F1 value with the tabular F - values with f, = treatment<br />
d.f. and f2 = error d.f. and make conclusions.<br />
For our examole tabular F value with f, = 4 and f2 = 12 degrees <strong>of</strong> freedom is<br />
3.26 at the 5% level <strong>of</strong> significance. Because, the computed Fl value 4.448 is greater<br />
than the tabular F value at 5% level <strong>of</strong> significance, hence it is significant, we reject the<br />
null hypothesis. F2 is not significant at 5% level <strong>of</strong> significance<br />
Step 8. If result is significant compute critical difference and compare the treatment<br />
means for our example<br />
CD = t (at error d.f.) x is<br />
r<br />
From the bar chart it can be concluded that variety V, produces significantly<br />
higher yield than all other varieties. The remaining varieties are all on par<br />
Step 9. Compute the coefficient <strong>of</strong> variation as<br />
cv = GMS<br />
xlOO<br />
Grand Mean
Step 10. Enter all values compuled is above steps in the analysis <strong>of</strong> variance outline.<br />
The Final result <strong>of</strong> our example is shown below.<br />
Source <strong>of</strong> Degree <strong>of</strong> Sum <strong>of</strong> Mean Computed Tabular<br />
variation freedom squares square F F<br />
Replication 3 80 80 26.93 < 1<br />
Variety 4 520.53 130 13 4.448'<br />
Error 15 351.10 29 25<br />
Total 19 952.43<br />
There are number <strong>of</strong> experimental deslgns viz. L.S D., split plot design, strip plot<br />
design etc, are avaitabie in the field <strong>of</strong> agricultural statistics, which can be used and<br />
analysed by using various available statistical packages.<br />
What to do when data break the rules<br />
Research workers who are content to learn the 'recipes" for carrying out an<br />
analysis <strong>of</strong> variance without attempting to learn and understand the underlying<br />
principles, may be headed for serious trouble. Whether they realize it or not, they are<br />
making certain assumptions about the data when they perform an analysis <strong>of</strong> variance.<br />
If the data do not conform to these assumptions, such an analysis may cause workers<br />
lo reach conclusion that are not justified. They may also overlook important conclusions<br />
that would be reached if the data were properly analysed.<br />
The assumptions underlying the analysis <strong>of</strong> variance are reasonably satisfied<br />
for most <strong>of</strong> the experimenlal data in agricultural research, but there are certain types <strong>of</strong><br />
experiments that are notorious for frequent violations <strong>of</strong> these assumptions.<br />
Assumptions <strong>of</strong> Analysls <strong>of</strong> Variance (ANOVA)<br />
1. The error terms are randomly, independently and normally distributed.<br />
2. The variances <strong>of</strong> different samples are homogeneous.<br />
3. Variances and means <strong>of</strong> different samples are not correlated.<br />
4. The main effects are additive.<br />
The most common symptom <strong>of</strong> experimental data that violate one or more <strong>of</strong><br />
the assumptions <strong>of</strong> the analysis <strong>of</strong> variance is variance heterogeneity.
Procedure for detecting the presence and type <strong>of</strong> variance heterogeneity<br />
- Compute the variance and the mean across replications for each treatment (the<br />
range can be used in place <strong>of</strong> the variance)<br />
- Plot a scatter diagram between the mean value and the variance<br />
- Examine, v~sually the scatter d~agrarn to identlfy the pattern <strong>of</strong> relalionship<br />
between mean and variance<br />
The following figure shows the three posstble outcomes <strong>of</strong> such an examinat~on<br />
Variance Variance Variance<br />
mean mean mean<br />
Fig.1 Fig.2 Fig.3<br />
Fia 1. Homoaeneous Variance<br />
~ i2. g ~eteri~eneous variance when the variance is functionally related to mean<br />
Fig 3. Heterogeneous variance when there is no functional relationship between the<br />
variance and the mean<br />
Transformation <strong>of</strong> data<br />
Data transformation is the most appropriate remedial measure for variance<br />
heterogeneity. In this techniques, the original data are converted into a new scale<br />
resulting in a new data set that is expected to satisfy the condition <strong>of</strong> homogeneity <strong>of</strong><br />
variance. Because a common transformation scale is applied to all ~ bse~ati~n~, the<br />
comparative values between treatments are not altered and comparisons between<br />
them remain valid.<br />
The most commonly used transformations for data in agricultural research are:<br />
Logarithmic transformation<br />
Most appropriate for data where the standard deviation is proportional to the<br />
mean.<br />
Data that are whole numbers and cover a wide range <strong>of</strong> values e.g. number <strong>of</strong><br />
insects per plot or the number <strong>of</strong> egg masses in per unit area etc.<br />
Take the logarithm <strong>of</strong> each and every component <strong>of</strong> data set.
lllurtration<br />
If the data set involves small values (e.g. less than lo), log ( x+ 1) should be<br />
used instead <strong>of</strong> log x, where x is the original data.<br />
An example for log transformation is given in the table below.<br />
Table 3. Observed and thelr log transformed values<br />
Original Valuer<br />
log valuer<br />
Treatment Replication Replication<br />
I I1 111 I I1 111<br />
Appropriate for data consisting <strong>of</strong> small whole numbers.<br />
For percentage data where the range is between 0 and 30% or between 70 and<br />
100%<br />
if most <strong>of</strong> the values in the data set are small (0.9. less than lo), especially with<br />
zeroes present, (xt0.5)'" should be used instead <strong>of</strong> xlR, where x is the original<br />
data, e.g. data obtained in counting rare events.<br />
lllurtration<br />
For illustration we use the following set <strong>of</strong> data on percentage <strong>of</strong> diseased tiller<br />
from a paddy variety trial <strong>of</strong> 6 varieties. The range <strong>of</strong> data is from 0 lo 21.99%.<br />
Because many <strong>of</strong> the values are less than 10, data are transformed in (x+0.5)"* as<br />
shown below.<br />
Table 4. Original and their square-root transformed valuer<br />
Original Values<br />
Transformed values<br />
Variety Replication Replication
Arc Sine Transformation<br />
- Appropriate for data on proportions, data obtained from a count, and data<br />
expressed as decimal fractions or percentage<br />
- It is not applicable to percantage data which are not derived from count data<br />
such as percentage <strong>of</strong> protein in rice, percentage <strong>of</strong> carbohydrates, infection<br />
index etc.<br />
- The value <strong>of</strong> 0% should be substituted by (114n) and the value <strong>of</strong> 100% by (100-<br />
114n) where n is the number <strong>of</strong> units upon which the percentage data was<br />
based.<br />
Certain rules for proper transforrnatlon scale for percentage data derived from<br />
count data<br />
Rule 1.For percentage data lying within the range <strong>of</strong> 30 to 70%, no transformation is<br />
needed.<br />
Rule 2.For percentage data lying within the range <strong>of</strong> either 0 to 30% or 70 to 100% but<br />
not both, the square-root transformation should be used.<br />
Rule 3. For percentage data that do not follow the ranges specified in either rule 1 or<br />
rule 2, the arc sine transformation should be used.<br />
Illustration<br />
We illustrate the application <strong>of</strong> arc sine transformation with data on percentage<br />
<strong>of</strong> fish survival trial with five size classes. For each variety 75 fishes were caught and<br />
the number <strong>of</strong> surviving fishes determined.<br />
Table 5. Percentage survival and their arc sine transformed valuer<br />
Survlval %<br />
Variety Original Values Arc Sine Scale<br />
Rl R2 R3 R1 R2 R3<br />
Based on rule 3, the arc Sine transformation should be used because the<br />
percentage data ranged from 0 to 100%. Before transformation all zero values are<br />
replaced by [1/4(75)] and all 100 values by [ 100 - {1/4(75))1.
ADVANCED STATISTICAL METHODS FOR DATA ANALYSIS<br />
R. N. Subudhl<br />
Berllampur Universfly, Bertrampur<br />
Onssa<br />
I. NON-PARAMETRIC TESTS<br />
While studying testing <strong>of</strong> hypothesis, we have used some tests (like large<br />
sample, t & F-tests) which estimated prameters <strong>of</strong> populations. Those are called<br />
parametric tests. In some cases we need not worry about the population parameters.<br />
Our test and result, both are about the sample observationlfunction (which is called a<br />
'statistic'), Such tests, as discussed below, are termed as non-parametric tests.<br />
Non-parametric tests are <strong>of</strong> course used for hypothesis testing. But it has also<br />
other extensive uses. And since it does not depend on the distr~bution <strong>of</strong> the parameter<br />
(<strong>of</strong> the population), there is no reference or comparison <strong>of</strong> tabulated value (like 1-table<br />
or F-table). It checks the pattern <strong>of</strong> occurrence <strong>of</strong> items in the sample. It assumes<br />
randomness or uniformity <strong>of</strong> the items. It checks whether the distribution <strong>of</strong> items (or<br />
whether the fit <strong>of</strong> the distribution is good or not, using chi-square).<br />
There are several non-parametric tests. Most <strong>of</strong> those tests check whether the<br />
items (or data) <strong>of</strong> the same series are appearing randomly ormnot. That is, whether<br />
successive items are changing (higher or lower than previous item) randomly or not.<br />
Here we discuss only two tests as given under, viz. SIGN TEST and RANK TEST.<br />
Sign test : In this test, average <strong>of</strong> the items <strong>of</strong> the given series is found first (say, M).<br />
Then each itemlvalue is deducted from this average or mean. Sign <strong>of</strong> such differences<br />
(XI - M) is noted. Suppose we get 'r' plus signs and 's' minus signs. If there are 'n'<br />
items in the series, then r + s s n. In this case our null hypothesis is that the chance <strong>of</strong><br />
any item or value exceeding M is 112. That is, P {X>M)=P=112. Alternative hypothesis,<br />
HI : P > 112 (one tailed test) OR HI : P ;c 112 (two tailed test).<br />
In case there are zero - differences (when X = M) we have to ignore those<br />
cases. So, sample size will reduce to (rts). Statistic for comparison is :<br />
Wilcoxin has suggested further improvement to this simple sign test, as<br />
discussed below. The suggested test is popularly known as
Wilcoxin signed : Rank Test : Here, afler finding the differences <strong>of</strong> individual items<br />
from mean, we have to find ranks combinedly for all the differences, by taking absolute<br />
values <strong>of</strong> negative differences. Let T and T' be the sum <strong>of</strong> ranks <strong>of</strong> positive and<br />
negative differences respectively.<br />
SO that, f + T = 1 + 2 ..... t n = n (n+1)/2<br />
For test we can check any <strong>of</strong> the values T' or T or (T' - T) or (T* + T)<br />
While checking T', for large samples. N- (0,l) is assumed and the test statistic is<br />
given by the formula :<br />
(Here too, zero difference cases are ignored.)<br />
Run test (due to Wald - Wolfowitz) : A run IS a sequence <strong>of</strong> den tical letters (or sign)<br />
or by no letter at all Ex. + : ++ ~1<br />
In the above case there 4 runs In total, 2 <strong>of</strong> + and 2 <strong>of</strong> - signs<br />
false.<br />
If Ho is true then the number <strong>of</strong> runs (say r) wtll be large. If r is small, then Ho is<br />
We can convert any given series to a series <strong>of</strong> + - + etc by the following<br />
principle:<br />
If the succeeding item is higher than the previous term a + sign is written, if it is<br />
less, then a - sign is written. Tie cases are to be ignored. Let there are 'm' + signs 'n'-<br />
signs and furlher that r is even (= 2d, say). We should expect 'd' runs <strong>of</strong> + and another<br />
'd' runs <strong>of</strong> - signs In the series. For large sample cases,<br />
II.<br />
CLUSTER ANALYSIS<br />
Data collected by researcher has to be classified according to the need <strong>of</strong> the<br />
research design for analysis. Cluster analysis is a science <strong>of</strong> classification known<br />
previously as typology or taxonomy. Eventhough the science <strong>of</strong> classification
originated in ancient period, in modern times it was developed by a German<br />
anthropologist in 1914. But it was R. Tryon's book 'Cluster Analysis" in 1939, a<br />
psychologist, which established the analysis as an important tool for classification <strong>of</strong><br />
entities.<br />
Cluster Analysis is a technique to group variables, individuals or entities.<br />
Geometrically it is defined as a 'continuous regibns <strong>of</strong> space containing a relatively high<br />
density <strong>of</strong> points separated by such other regions by regions containing a relatively low<br />
density <strong>of</strong> points. (B. Everilt, Cluster Analysis, 1980)<br />
The variables or entities can be grouped according to their similarity measures<br />
or according to their differences or distance measures. So far Karl Pearson's<br />
correlation coefficient is taken as a good similarity measure. lnspite <strong>of</strong> its importance it<br />
is not a good measure <strong>of</strong> similarity. Some <strong>of</strong> the important drawbacks are (a) It is<br />
sensitive to shape (b) Insensitive to the magnitude <strong>of</strong> variables (c) It is calculated on<br />
linear basis in which some entities remain unexplained.<br />
Similarltvcoan[clents : Similarity coefficients can be calculated for qualitative data or<br />
for quantitative data. For qualitative data similarity coefficients are calculated on a<br />
binary scale and presented In matrix form for clustering. There are so many formulas<br />
but Jaccad similarity coefficient is very popular among the cluster analysts which J =<br />
al(a + b + c) for quantitative data the formula is Ssk =1- (Xlk - Xjk)lRk, in which R is the<br />
range <strong>of</strong> the variables and Kk and Xlk entities.<br />
Dlatence : In this method the entities are clustered on the basis <strong>of</strong> their<br />
distances or differences which are called dissimilarity measure. One difference<br />
between the sim~larity and dissimilarity measure is that the former's value remains<br />
within 0 and 1 while the laler can take any positive value. One dimculty in distance<br />
measure is that it is scale dependent. But when raw data can be standardised lo<br />
calculate distance measures. For the calculation <strong>of</strong> distance measures Euclidean<br />
Metric measures formula Is used.<br />
A distance function can be transformed into a similarity function and vice versa.<br />
Technlnues : There are different types <strong>of</strong> clustering techniques <strong>of</strong> which<br />
hierarchical technique is most popular among the analysts since it is the simplest one.<br />
There are again two methods : agglomarative and divisive method. A dendrogram can<br />
be drawn to know the clusters either by single or complete linkage method. In divisive<br />
technique there are two methods (1) Monotonic and (2) Polithetic. The first method is<br />
the easiest. For this method the entities are divided into two subsets in any <strong>of</strong> the 2 n-
2 - I ways. The two groups are termed as main group and slinter group. Gradually<br />
one after another column is separated from the main group until it satisfies a certain<br />
condition. Then these two groups are further separated in the same procedure until no<br />
separation would be possible further.<br />
Ill.<br />
FORECASTING TECHNIQUES I AUTO CORRELATION<br />
By using past records or data, we can fit some mathematical models (or<br />
equations) through which we can estimate or forecast future values. There are several<br />
methods to do this, e.g.<br />
1) Fitting linear equations (or curves) by the method <strong>of</strong> least squares, (Normal<br />
equations computed from given data);<br />
2) Regression equationslmodels (including multiple regression models);<br />
3) Autocorrelation Analysis (In case <strong>of</strong> single time series data); and<br />
4) Time series models<br />
We here discuss the concepts <strong>of</strong> auto correlation briefly. It is very much useful<br />
for snalysing time-series data.<br />
Autocorrelation<br />
Autocorrelation is the correlation between time series componentslitems at<br />
different points <strong>of</strong> time. We can group each item with the successive ilem (or item at a<br />
fixed interval) to find the correlation. If time-lag is one (values at time t and t+l are<br />
paired), it is called first-ordered auto-correlation.<br />
'Prices <strong>of</strong> a company's equity share traded on daily basis", is an example <strong>of</strong> a<br />
time series. We can grouplpair the price <strong>of</strong> each day with that <strong>of</strong> next weeks price (time<br />
lag = 7 days). We can also make time lag as one day, as per the need. (In that case<br />
prices are paired with successive items).<br />
After the pairing (grouping <strong>of</strong> data), auto-correlation coefficient can be obtained<br />
by the formula similar to that <strong>of</strong> simple correlation coefficient (r).<br />
To know the significance <strong>of</strong> auto-correlation we can use<br />
Durbin-Watson d-statistic lies between 0 and 4. If d is very close (or equal) to 2,<br />
then it is un-correlated case. If dc2, there is positive autocorrelation (strongly positive if<br />
d=O) and if d72, it is negative auto correlation, (with strong negative auto~orrelation at<br />
d=4).
IV.<br />
MULTI-DIMENSIONAL SCALING (M.D.S.)<br />
4.1 Introduction<br />
In any problem <strong>of</strong> decision making (like buying a refrigerator or choosing a<br />
strategy) we find many alternatives. Several dimensions emerge when these<br />
alternatives are evaluated. Refrigerators can be described in terms <strong>of</strong> price, capacity,<br />
hours <strong>of</strong> trouble free operations, reputation <strong>of</strong> the manufacturer etc. Similarly in the<br />
case <strong>of</strong> employment decisions, choice involves salary, working conditions, opportunity<br />
for growlh and advancement, satisfaction etc. The search for an analytical approach to<br />
tackle such 'attribute-choice" problems has led to the techniques <strong>of</strong> multi-dimensional<br />
scaling.<br />
The development <strong>of</strong> various models and techniques <strong>of</strong> multi-dimesnional scailng<br />
is <strong>of</strong> recent origin, Initially it started with applications in Psychology.<br />
Subsequently these methods were used in marketing, Econom~cs, Operations<br />
research, Applied Statistics, Mathematical Psychology and Psychometrics.<br />
In multi-dimensional scaling, it is assumed that any object or brand (usually<br />
known as stimulus) can be described by levels on a set <strong>of</strong> attributes, characteristics or<br />
properties. The relevant attributes <strong>of</strong> the problem are determined by the decision<br />
maker. For example, in the purchase <strong>of</strong> a car, the attributes can be structural like<br />
strong body <strong>of</strong> a car, its colour, and speed. There may be functional attributes like the<br />
usability for long trips hauling. There may be psychological attributes like agreement <strong>of</strong><br />
the characteristics <strong>of</strong> the car with the self concept. They may be social attibutes like<br />
people's perception <strong>of</strong> the type (<strong>of</strong> car) and <strong>of</strong> those who drive it. They may be<br />
economic attributes like initial cost, anticipated resale value and cost <strong>of</strong> maintenance.<br />
The stimulus may be presented to a respondent through :<br />
(i)<br />
(ii)<br />
(iii)<br />
(iv)<br />
(v)<br />
physical objects themselves<br />
pictorial representations<br />
verbalised pr<strong>of</strong>ile descriptions<br />
name <strong>of</strong> objects<br />
any combination <strong>of</strong> the above<br />
Multi-dimensional scaling deals with Dsvcholoalcal among stimuli and<br />
expresses them through<br />
among points in a multi-dlrnensional<br />
sDace.<br />
The psychological relations are obtained through similarities and preferences.
Thus multidimensional scaling is the problem <strong>of</strong> representing n objects<br />
geometrically by n points. The interpoint distances correspond in some sense to<br />
experimental dissmilarities between objects.<br />
4.2. Multidimensional Scaling Models<br />
Multi-dimensional scaling models are classified into metric and non-metric models.<br />
In metric models, the input data may be assumed to be ratio scaled or interval<br />
scaled. In both the cases, the scaled distances found by the model are assumed to be<br />
metrically related. Given a set <strong>of</strong> interpoint distances these models find dimensionality<br />
and configuration <strong>of</strong> points whose distances most clearly match the input values with<br />
the smallest number <strong>of</strong> possible dimensions.<br />
ii)<br />
In many practical situations metric input data may not be available. People<br />
cannot ordinarily provide accurate and reliable data about equality relationships among<br />
objects such as competing brands or about brand characteristics.<br />
In non-metric models, only the ordinal or the rank order properties <strong>of</strong> the input<br />
data are considered. The objective <strong>of</strong> non-metric MDS methods is: ' Given rank order<br />
data, to find a configuration whose rank order <strong>of</strong> distances best reproduces, in a<br />
specified dimensionality the original rank order <strong>of</strong> the input data.<br />
4.3 Technique <strong>of</strong> Multi-dlrnesnional Scaling<br />
Multi-dimensional scaling is a technique <strong>of</strong> statistical fitting. The dissmilarities<br />
between flo pain <strong>of</strong> stimuli are given and we wish to find the configuration <strong>of</strong> n<br />
stimuli in a certain number <strong>of</strong> dimensions such that the distances between the stimuli fit<br />
the dissimilarities best. A criterion for the best fitting is given in terms <strong>of</strong> monotone<br />
relationship between the observed dissimilarities and the distances obtained from the<br />
fitted configuration. Symbolically if and SN: are two observed dissimilarities, and if dij<br />
and dil; denote the corresponding distances in the configuration then Sy < 6. implies that<br />
dl < d*.<br />
if we can find a configuration that is monotonically related to the observed<br />
dissimilarities, we say we have a perfect fit. However this may not be achieved<br />
especially in lower dimensions. We therefore need to have e criterion to evaluate the<br />
goodness <strong>of</strong> fit or badness. One standard criterion proposed by Kruskal is 'strees".
This 'stress' value can b computed for any configuration intended to represent the<br />
original set <strong>of</strong> dissimilarities. The lower the stress value, the better is the fit.<br />
The method <strong>of</strong> MDS is to start with some configuration in a given number <strong>of</strong><br />
dimensions and iterate by finding new configurations with lower and lower stress value<br />
until a desired stress value is obtained. The final configuration is taken to be the best<br />
fit. Thus the procedure <strong>of</strong> MBS can be summarised in the following steps.<br />
i) For a given dimensionality, select some initial configuration X (This can be<br />
random configuration or provided by the experimenter)<br />
ii)<br />
iii)<br />
iv)<br />
Compute the distances dli between the stimuli pairs and evaluate it by<br />
computing the stress value S.<br />
If S> pre-specified cut <strong>of</strong>f find a new configuration X whose ranks <strong>of</strong> dij are close<br />
to the ranks <strong>of</strong> the obse~edissimilarities.<br />
Repeat steps (ii) and (iii) until successive configurations converge<br />
v) Repeat (i) to (iv) in the next lower dimensionality and so on.<br />
vi)<br />
Choose the lowest dimensionality for which S is satisfactorily small<br />
4.4. Applications <strong>of</strong> MDS<br />
i) Market Segnientation<br />
A very promising area for application <strong>of</strong> non-metric scaling methods is market<br />
segmentation. A product class and its buyers could be represented as points in a<br />
space whose d~mensions are perceived product characteristics. Each brand could be<br />
represented as a stimulus point and each buyer as an ideal point. A market segment<br />
might be viewed as a sub-space <strong>of</strong> this superspace in which all members<br />
(a)<br />
(b)<br />
perceive the stimuli similarly<br />
possess the same ideal point position.<br />
Identification <strong>of</strong> such sub-space in which consumers exhibit commonality <strong>of</strong><br />
perception and preference may reveal empty regions with a high concentration <strong>of</strong> ideal<br />
points and no close brands. Such an analysis would reveal the perception <strong>of</strong> different<br />
market segments about the competrtive position <strong>of</strong> the firm's brand and other brands.<br />
ii)<br />
Vendor Ev~luatlon<br />
An industrial purchasing agent may have to C ~ Q Oamong S ~ alternative vendors.<br />
One vendor may be low in price, fair on maintaining delivery promises, poor in technical<br />
service, and low in technical innovation. Another vendor may be high in prices but<br />
excellent in delivery promises. Each vendor can be represented as a point in multidimension<br />
space, the dimensions being the various criteria on which vendors are
selected. We are interested in the relative importance <strong>of</strong> each <strong>of</strong> the criteria, and how<br />
these weights vary over time.<br />
i) Advertising Evaluation<br />
MDS methods could be pr<strong>of</strong>itably used in an ad pre-testing in answering the<br />
following questions.<br />
(a) Are good ads more similar to each other than good ads are to bad ads 7<br />
(b)<br />
Do advertising personnel exhibit inter-person reliability in making similarity<br />
judgment 7<br />
(c) What are the dimensions along which ads are judged 7<br />
MDS method could also be extended to the problem <strong>of</strong> advertisement and<br />
vehicle matching. For example, what ads seam to go with what magazines 7<br />
iv)<br />
Brand Switching Research<br />
It might be <strong>of</strong> interest to couple studies <strong>of</strong> brand switching with those <strong>of</strong><br />
similarities or preference analysis. Do brand switchers perceive products differently<br />
from brand loyal customers 7 What are the characteristics <strong>of</strong> preference structures for<br />
both brand switching and brand loyal types 7
AN OVERVIEW OF STATISTICAL PACKAGES<br />
Ravi R. Saxenr and A. K. Roy<br />
lndim Gandhi Agricuduml Unhrsrsity, Reipur -49201 2<br />
Bioinfomatkis Centre, CIFA, Bhubeneswar-751002<br />
Due to the attention given in the computational and algorithmic sciences during<br />
the part decade a lot <strong>of</strong> innovations has taken made in this field. Computations which<br />
was not possible manually has come to the reach <strong>of</strong> researches owing to the<br />
development <strong>of</strong> various statistical s<strong>of</strong>twares available in the market .Almost all the<br />
popular s<strong>of</strong>tware packages has one component exclusively dealing with basis statistical<br />
calculations like Excel <strong>of</strong> Ms<strong>of</strong>fice. Basfcally computations are done on Spread sheets<br />
creating data file. One thing may be kept in mind that even with fundamental knowledge<br />
<strong>of</strong> statistics, one has to spent a lot <strong>of</strong> time to explore the packages for all practical<br />
purposes. This chapter will be dealing with some s<strong>of</strong>twares available in the market for<br />
performing statistical analysis <strong>of</strong> data. However the list is not exhaustive, there may be<br />
many more packages besides these mentioned below.<br />
1. SPAR1 (Statistical Package for Agricultural Research)<br />
This package has been developed for the statistical anaiysis <strong>of</strong> experimental<br />
data In plant breeding and Genetics. The present package includes the following<br />
program modules :<br />
- input data file<br />
- Diallel analysis<br />
Multivariate analysis<br />
Multiple, linear regression analysis<br />
- Cluster analysis<br />
Line X Tester analysis<br />
Path analysis<br />
Discriminant analysis<br />
Stability analysis<br />
Partial Diallel analysis<br />
Triple test cross anaiysis<br />
Combining Ability<br />
- Generation Means analysis, Scaling test, Joint Scaling test.<br />
- Print Result File.<br />
- Rundos commands.<br />
System requirements:<br />
\BM Compatible PC-XT, AT and SX-386 with 640 KB RAM and with Math Co-<br />
Processor.
S<strong>of</strong>tware availability:<br />
Indian Agricultural Statistics Research <strong>Institute</strong>, New Delhi.<br />
2. SPSS ( Statistical package for Soclal Sclencer)<br />
The SPSS package includes the follow program modules (Base, pr<strong>of</strong>essional<br />
Stat., Adv.Stat., Trends Categories and LISREL). It is a comprehensive integrated<br />
system for statistical data analysis.<br />
-<br />
Scatterplot, Histogram. Box plot. Error bar, Auto Correlation plots. Time series,<br />
Inter polation and regression line<br />
- Frequencies, plots, Descriptive, Cross-tabulation, Tables, Correlation's, Case<br />
listings<br />
T-test, ANOVA, MANOVA, Non-parametric test<br />
Multiple regression, Non-linear regression, Log-linear, regression, CHAlD<br />
- Cluster Analysis, Factor analysis, conjoint analysis Discriminant Analysis,<br />
Logistic regression.<br />
- Exponential smoothing, ARIMA, XI1 ARIMA, Auto regression, Seasonality,<br />
Spectral analysis.<br />
- COX regression, logistic Manova, loglinear, ~urvival>robit etc.<br />
System requirements:<br />
Micros<strong>of</strong>t windows 3.1. windows 95, 386 based personal computer (486 or<br />
higher recommended); 8 MB RAM minimum (8 MB recommended; with I% MB <strong>of</strong> Hard<br />
disk storage space.<br />
S<strong>of</strong>tware availability:<br />
Wipro - S<strong>of</strong>tware products Division' Binary Semantics limited<br />
4011 A, Lavelle Road A-6, C-Block Community Centre<br />
3rd Floor, Basappa Complex (or) Nasraina Vihar<br />
Bangalore - 56000<br />
New Delhi-110028<br />
3. SYSTAT: The SYSTAT provlder the following statistleal snalysls<br />
Basic statistics, t-tests, correlation, regression and crosstable<br />
ANOVAIMANOVA<br />
- Bootstrapping, canonical and set correlations<br />
- Classification and regression trees<br />
- Cluster analysis, conjoint analysis, correspondence anatysis<br />
- Design <strong>of</strong> experiments (7 methods)<br />
- Factor analysis and principle components<br />
- Logistic regression and probit<br />
- Loglinear model<br />
- Multidimensional scaling and perceptual mapping<br />
- Non parametric tests
- Partially ordered scale analysis<br />
- Path analysis<br />
- Repeated measures<br />
- Signal detection<br />
- Survival analysis (7 distributions)<br />
- Time series (ARIMA)<br />
1-tests<br />
Two stage least squares<br />
- 13 probability dens~lies and random number generators<br />
System requirements:<br />
Micros<strong>of</strong>t windows 3.1, windows 95, 386 based personal computer (486 or<br />
higher recommended); 8 MB RAM minimum (8 MB recommended with I% ME <strong>of</strong> Hard<br />
disk storage space, SVGS monitor.<br />
S<strong>of</strong>tware availability:<br />
BINARY SYMANTICS LIMITED<br />
A-6. C-Block Community Centre,<br />
Naraina Vihar,<br />
New Delhi -1 10028<br />
4. SPBD (Statistical Package for Block Designs)<br />
There are three main modules <strong>of</strong> this package<br />
- Catalogue <strong>of</strong> BIB designs<br />
- Generation <strong>of</strong> the design and randomized layout<br />
- Analysis <strong>of</strong> the dala generated from a BIB design<br />
System requirement:<br />
IBM compatible PC-XT, at and SX-386 with 640 KB RAM<br />
S<strong>of</strong>t ware availability:<br />
Indian Agricultural Statistics Research <strong>Institute</strong> Library Avenue, New Delhi -<br />
110012<br />
6. Deslgn - Ease 8 Design - Expert<br />
The features <strong>of</strong> the s<strong>of</strong>tware are :<br />
- Scatter plots to visualize raw data<br />
- One variable, multi-level design<br />
- Optimal resolution fractional factorial<br />
- Replicate, delete, re-block designs<br />
- handles missing or botched data<br />
- Response transformations
- View ANOVA for precise information<br />
Drag-able 2-0 contours<br />
Slim contour plots<br />
Edit colors, text & more to procure snappy reports<br />
Desirability graphs - histograms or ramp<br />
- Augment any design<br />
System requirements:<br />
Minimum 486, 6MB windows 3.11951NT 3.51<br />
S<strong>of</strong>tware availability:<br />
BINARY SYMANTICS LIMITED<br />
A-6, C-Block Community Centre,<br />
Naraina Vihar.<br />
New Delhi -1 10028<br />
6. Slgma stat<br />
Sigma stat is the only advisory Statistical s<strong>of</strong>tware unique Advisor Wizard which<br />
analysis data, recommends the test to run, and runs it. Sigma stat handles missing and<br />
unbalanced data, automatically checks that data fits the underlying assumptions <strong>of</strong><br />
statistical model. It there is a violation, sigma stat automatically warns and calculates a<br />
more appropriate report <strong>of</strong> all test results complete with its own analysis its features are<br />
- 'Mess" data handling<br />
Graph editor Customization<br />
- Detailed reports with explanation <strong>of</strong> results<br />
- Statistics - Descriptive Statistics. 1-test and analysis <strong>of</strong> variance (ANOVA)<br />
- Graphing -Scatterplot<br />
System requirements (32 -bit):<br />
WIN 95 or Windows NT 4.0, 468 or higher, 33 MHz, ME and 11 to 16<br />
MB hard disk space<br />
S<strong>of</strong>t ware availability:<br />
BINARY SYMANTICS LIMITED<br />
A-6, C-Block Community Centre,<br />
Naraina Vihar,<br />
New Delhi -1 10028
7. STATISTICA<br />
The s<strong>of</strong>tware provides the following feature<br />
- non parametrics<br />
- distribution fitting multiple regression<br />
- general non-linear estimation<br />
- general ANCOVNMANCOVA<br />
- Stepwise discriminant analysis<br />
- log-linear analysis<br />
- Confirmatory /exploratory factor analysis<br />
Canonical correlation<br />
Survival analysis<br />
a large selection <strong>of</strong> time series modeling I forecasting techniques<br />
- structural equation modeling with Monte Carlo simulations and much more<br />
System requirements:<br />
Window 3.1 /WIN 85 8 MB RAM, 10-12 MB hand disk space<br />
S<strong>of</strong>t ware availability:<br />
Stat S<strong>of</strong>t,<br />
70, Janpath<br />
New Delhi-110001<br />
8. LINDO & LINGO<br />
The s<strong>of</strong>tware solve inventory, transportation, project, management, forecasting<br />
problems with operation research on PC.<br />
- Fast linear, integer 8 quadratic optimizer for variety <strong>of</strong> problem capacities<br />
- Data input, editing, optimization, display, logical data enquiry, file handling and<br />
sensitivity analysis<br />
System requirements:<br />
Minimum 486, 2 MB, Windows 3.11951NT 3.5<br />
S<strong>of</strong>tware availability:<br />
BINARY SYMANTICS LIMITED<br />
A-6, C-Block Community Centre,<br />
Naraina Vihar,<br />
New Delhi -1 10028
lndostat provides the statistics you need in a program you can use most easily.<br />
You get comprehensive data editing data management and extensive statistical<br />
capabilities. lndostat s<strong>of</strong>twares are available for various disci~linesuch as :<br />
- Applied statistics (Curve fitting, stepdownlstepwise regression, experimental<br />
designs)<br />
Clustering pack<br />
- Econometrics 8 Psychology pack<br />
- Advanced econometric models<br />
- Operation research pack<br />
Multivariate pack<br />
Time series pack<br />
ARlMA modeling<br />
Geology pack<br />
- Graphics pack<br />
- Advanced Econometic Models<br />
- Acceptance sampling<br />
Plant-Breeding 8 Genetics pack<br />
Entomology pack<br />
Animal Science pack<br />
- Poultry pack, etc.<br />
System requirements:<br />
IBM compatible PC-AT13861486 IPentium machine with minimum memory<br />
requirement is 640 KB.<br />
S<strong>of</strong>tware availability:<br />
lndostat Services<br />
18, Rohini Apartments<br />
7-1 -3UA Arneerpet<br />
Hyderabad -500 018<br />
Other s<strong>of</strong>twares like sample power, peakfit, Table curve sigma plot, Delta graph,<br />
math cad etc. are also available.<br />
10. SAS (Statistical Analysir Systems <strong>Institute</strong>) USA<br />
The SAS System is an integrated system <strong>of</strong> s<strong>of</strong>tware products. The SAS<br />
System enables you to perform<br />
- data entry, retrieval, and management<br />
- report writing and graphics<br />
- statistical and mathematical analysis<br />
- business forecasting and decision support
- operations research and project management<br />
- applications development<br />
The core <strong>of</strong> the SAS System is base SAS s<strong>of</strong>tware. It consists <strong>of</strong> the SAS<br />
language, a programming language that you use to manage your data procedures that<br />
are s<strong>of</strong>tware tools for data analysis and reporting a macro facility a windwoing<br />
environment called the SAS Display Manager System.<br />
There are other s<strong>of</strong>tware packages which require more are less same system<br />
requirements there are<br />
MINITAB, MICROSTAT, MSTAT-C, SHAZAM, TSP, LlNDO<br />
SCARP is a statistical package dealing with analysis <strong>of</strong> sample survey data techniques<br />
developed by IASRI(ICAR), New Delhi.<br />
Most popular graphic packages are the following:<br />
HARVARD GRAPHICS, SIGMA PLOT, DELTA GRAPH
EXCEL FOR STATISTICAL DATA ANALYSIS<br />
P. K. Satapathy, A. K. Roy and R. Dash<br />
Computer Seclion<br />
<strong>Central</strong> lnstitule olFnrshwaler Aquacullunr<br />
Kausalpgenga. Bhubaneswar 751002<br />
INTRODUCTION<br />
Evolution <strong>of</strong> electronic spreadsheets is the most significant factor in starting up a<br />
trend towards business microcomputinglstatistical data analysis electronically by users<br />
even if who are having littlelno programming knowledge. Amongst various spreadsheet<br />
packages which appeared in Information Technology market (like LOTUS 1-2-3,<br />
VISICALC, SUPERCALC, QPRO. EXCEL) LOTUS 1-2-3 was most popular t~ll Micros<strong>of</strong>l<br />
Office came into picture, where the MS-EXCEL was available.<br />
CAPABILITIES OF EXCEL<br />
EXCEL has several capabilities which include opening <strong>of</strong> a workbook; entering<br />
and editing data; building formulas to calculate values; managing l~st <strong>of</strong> data; formatting<br />
data; creating a chart, saving a workbook; opening and saving files from other<br />
spreadsheets; linking documents from other spreadsheets, etc. Besides these it has<br />
super capability for data analysis.<br />
STATISTICAL ANALYSIS OF DATA<br />
Micros<strong>of</strong>l Excel provides a set <strong>of</strong> special analysis tools called Analysis ToolPak.<br />
These tools include statistical analyses which one can apply to many types <strong>of</strong> data as<br />
well as analyses which are Anova : Single Factor; Anova : Two Factor with Replication;<br />
Anova : Two Factor without Replication; Covariance; Correlation; Descriptive Statistics;<br />
Exponential Smoothing; F-test : Two Sample for Variances; Histogram; Moving Average;<br />
Random Number Generation; Rank and Percentile; Regression; t-Test; Paired Two-<br />
Sample for means; t-Test : Two Sample Assuming unequal means, elc. Before using an<br />
analysis tool, it is required to enter and organise that required to be analyzed into<br />
columns or rows on worksheet, which is called as input range. Text labels in the first cell<br />
<strong>of</strong> a row or column may be included to identify the variables latter. When an analysis tool<br />
is used to analyze data in an input range. Micros<strong>of</strong>t Excel creates an output table <strong>of</strong> the<br />
results. To use an analysis tool, choose Data Analysis from the Tools Menu. In the<br />
Analysis Tools, box, select the name <strong>of</strong> the tool required. Then specrfy the input and<br />
output ranges and any other options required.<br />
DESCRIPTIVE STATISTICS<br />
The Descriptive Statistics tool generates a report <strong>of</strong> univariate statistics for data<br />
in the input range. The output values generated by the Descriptive Statistics tool are :<br />
Standard deviation <strong>of</strong> sample (sample variance), kurtosis, and skewness. These outputs<br />
are demed using the same algorithms used by the built-in functions STDEV, VAR,<br />
KURT, and SKEW, rrrpedively.
Arithmetic mean : It Is also referred as average and calculated by simply adding<br />
the numbers and divkling by how many numbers there are.<br />
up all<br />
Medlan : The median is the value !hat exactly separates the upper half <strong>of</strong> the<br />
distribution from the lower half.<br />
Med = L+ (05~ - cumf<br />
NED 1<br />
Population mean : To avoid confusion Greek letter p, pronounced 'mew', is the symbol<br />
for the population mean.<br />
Standard devlatlon : It la most widely used measure <strong>of</strong> variability which uses the<br />
deviation <strong>of</strong> each score from the mean, but the calculation, instead <strong>of</strong> taking the<br />
abaolute value <strong>of</strong> each deviation, square6 each deviation to obtain values that are all<br />
potltive in tign.<br />
Deviation formula :<br />
Mean formula :<br />
z score : The z score is simply a way <strong>of</strong> telling how far a score is from the mean in<br />
standard deviation units.<br />
z score - sample :<br />
z score - populatlon :
The Confidenca Interval Approach for Estimating r : In this approach, instead <strong>of</strong><br />
talking about possible values that p may take, given sample X, it is better <strong>of</strong>f to set up a<br />
confidence interval in which the true mean probably lies.<br />
95% confidence interval for p urlng population a : Xi 1.96af<br />
99% confidence Interval for p urlng population a : X 1 25SOj<br />
COVARIANCE<br />
The Covariance tool returns the average <strong>of</strong> the product <strong>of</strong> deviations <strong>of</strong> data<br />
points from their respective means. Covariance is a measure <strong>of</strong> the relationship between<br />
two ranges <strong>of</strong> data.<br />
The use <strong>of</strong> Covariance tool is to determine whether two ranges <strong>of</strong> data move<br />
together; that is, whether large values <strong>of</strong> one set are associated with large values <strong>of</strong> the<br />
other (positive covariance), whether small values <strong>of</strong> one set are associated with large<br />
values <strong>of</strong> the other (negative covariance), or whether the values in the two sets are<br />
unrelated.<br />
ANOVA<br />
Analysis <strong>of</strong> variance, or anova, is a statistical procedure used to determine<br />
whether the means from two or more samples are drawn from populations with the<br />
same mean. This technique expands on the tests for two means, such as the t-test.<br />
Anova : single factor tool performs a simple analysis <strong>of</strong> variance, which test the<br />
hypothesis that means from several samples are equal. Anova : two-Factor with<br />
replication performs an extension <strong>of</strong> the single-factor anova that includes more than one<br />
sample for each group <strong>of</strong> data. Anova : two-Factor without replication performs tw<strong>of</strong>actor<br />
anova that does not include more than one sampling per group.<br />
CORRELATION<br />
The Correlation tool measures the relationship between two data sets that are<br />
scaled to be independent <strong>of</strong> the unit <strong>of</strong> measure. The population correlation calculation<br />
returns the covariance <strong>of</strong> two data sets divided by the product <strong>of</strong> their standard<br />
deviations.
und<br />
One can use the Correlation tool to determine whether two data sets move<br />
togelher; that is, whether large values <strong>of</strong> one set are associated with large values <strong>of</strong> the<br />
other (positive correlation), whether small values <strong>of</strong> one set are associated with large<br />
values <strong>of</strong> the other (negative correlation), or whether the values in the two sets are<br />
unrelated (zero correlation - the correlation tends toward zero). Unlike covariance,<br />
correlation is independent <strong>of</strong> the units <strong>of</strong> measurement.<br />
REGRESSION<br />
The Regression tool performs linear regression analysis. Regression fits a line<br />
through a set <strong>of</strong> observations using the least square methods.<br />
USING CHARTS TO ANALYZE DATA<br />
The ease <strong>of</strong> plotting graphs comes as a handy tool in EXCEL for ovserving the<br />
trends, the impact <strong>of</strong> one or more variables on other etc. The graphs help in illustrat~ng<br />
the behaviour <strong>of</strong> the data. For example. the dependence <strong>of</strong> two variables on each other,<br />
i e., how one changes with a change in other; how different variables bahave over a<br />
period <strong>of</strong> time, etc. With the help <strong>of</strong> graphs, these bahaviours are brought out more<br />
clearly.<br />
Crealing a Trendline : The first step in creating a trendline is to select the data series in<br />
which the trendline is associated with. Then choose the Trendline command from the<br />
Insert Menu. On the Type tab, select the type <strong>of</strong> trendline needed. On the options tab,<br />
one can give the trendline a name and specify other option. The regression trendlines<br />
are linearllogarithmidpolynomiallpowerlexponential The options like displaying the R-<br />
squared value, setting the Y-intercept, moving average, formatting a trendline, etc. are<br />
available. The Linear option creates the trendline using linear equation y = mx + b. The<br />
logarithmic option creates the trendline using the logarithmic equation y = clnx + b. The<br />
polynomial equation y = b + ccx+qx2+ ...+ c6. The power option creates the trendline<br />
using power equation y=~~b. The exponential option creates the trendline using the<br />
exponential equation y=cebx.<br />
FORECASTING<br />
Exponential Smoothing tool predicts a value based on the forecast for the prior period,<br />
adjusted for the error in that prior forecast, which uses a smoothing constant, a, the
magnlude <strong>of</strong> which determines how strongly forscasts respond to errors in the prior<br />
forecast.<br />
Moving Average tool projects values in the forecast period, based on the average value<br />
<strong>of</strong> the variable over a specific number <strong>of</strong> preceding periods. Each forecast value is<br />
based on the following formula :<br />
where N is the number <strong>of</strong> prior periods to include in the moving average. A, is the actual<br />
values at time j, and F, is the forecasted values at time j. You can use this procedure to<br />
forecast sales, inventory, or other trends. A moving average provides trend information<br />
that a simple average <strong>of</strong> all historic data masks.<br />
The supplementation <strong>of</strong> projections with several other calculations are possible<br />
for example, the standard error measure the relative accuracy <strong>of</strong> projected values.<br />
Another method, the weighted moving average forecast, includes a large interval<br />
and allows to assign vanous nonnegative weights to observations over time.<br />
In the above equation, W,, W, ,..., WN are nonnegative weights that sum to 1. W,<br />
is the weight at interval I; A, is the actual value at lime j, and F, is the forecasted value at<br />
time 1. Here,SUMPRODUCT funclion can be used to calculate a weighted average.<br />
T-Test : Paired Two-Sample for Means : The paired two-sample for means 1-Test tool<br />
performs a paired two-sample student's 1-test. This form <strong>of</strong> the 1-test tests whether a<br />
sample's means are distinct. It does not assume that the variances <strong>of</strong> both populations<br />
from which the data sets are drawn are equal. A paired test is appropriate whenever<br />
there is a natural pairing <strong>of</strong> observations in the samples, such as when a sample group<br />
is tested twice, before and after an experiment. In this case as this is a paired test, the<br />
two input ranges <strong>of</strong> data must contain the same number <strong>of</strong> data points.<br />
This analysis tool is Pearson Correlation derived by using the formula
where cH h the degree <strong>of</strong> freedom. Another output values generated by this analysis tool<br />
is Pooled Variance, which is derived using formula<br />
where S' is pooled variance.<br />
T-Test : Two-Sample Assumlng Equal Variance : The two-sample assuming equal<br />
variances t-Test tool performs a two-sample student's 1-test. This form <strong>of</strong> the t-test<br />
assumes that the means <strong>of</strong> both data sets are equal and is referred to as a<br />
homoscedastic I-test. The t-Test is used to determine whether the two samples' means<br />
are equal.<br />
T-Test : Two-Sample Assuming Unequal Variances : The two-sample assuming<br />
unequal variance 1-Test tool performs a two-sample student's t-test. This form <strong>of</strong> the test<br />
assumes that the variances <strong>of</strong> both ranges <strong>of</strong> data are unequal and is referred to as a<br />
heteroscedastic t-teat. This t-test is used to determine whether two sample means are<br />
equal. This test is used when the groups under study are distinct. Use <strong>of</strong> a paired test is<br />
done when there is one group before and after a treatment. The formula used lo<br />
determine the test statistics value t is<br />
The formulae below is used to approximate the degrees <strong>of</strong> feeedom. The result<br />
<strong>of</strong> the calculation is usually not an integer. The nearest integer is used to obtain a critical<br />
value for the t table.<br />
df =<br />
(s; /my (s; 1.y +<br />
m-1 n-l<br />
F-Test : Two-Sample for Variances : The two-sample for variances F-Test tool<br />
performs a two-sample F-test. An F-test is a method for comparing two population<br />
variances.<br />
Z-Test : TwoSample for Means : The two-sample for means z-Test tool performs a<br />
two-sample z-test for means with known variance. This procedure Is commonly used to<br />
test hypotheses about the difference between two population means.
INSTRUCTIONS FOR OPERATING MINITAB STATISTICAL PACKAGE<br />
Snbashi Basu<br />
Indian Stetisticel <strong>Institute</strong><br />
203 8. T. Road, Cek~tte - 700035<br />
lntroductlon to Mhitab<br />
Minitab is used interactively but may be used in batch mode also. We will<br />
concentrate on running Minitab in the interactive mode.<br />
Running Minitab<br />
Start Minitab by double clicking on the Minitab icon in Windows. Miniteb will<br />
respond by opening a window and showing (MTB >) prompt.<br />
Input and Output <strong>of</strong> Data<br />
Small amount <strong>of</strong> data may be read into variables C1, C2 etc d~rectly by the<br />
command<br />
MTB > READ Cl C2 C3<br />
Here each line <strong>of</strong> input consists <strong>of</strong> one set <strong>of</strong> values corresponding to variable<br />
C1, C2 and C3, e.g. 1 .O, 3.0. 0.0. Next line will consist <strong>of</strong> another set <strong>of</strong> values <strong>of</strong> Cl.<br />
C2 and C3, and so on. {END) command denotes end <strong>of</strong> data input.<br />
Alternatively you may give all the values <strong>of</strong> C1 together by the command<br />
MTB > SET C1<br />
DATA> 1.0 1.5 2.0<br />
DATA> 2.5 3.0<br />
DATA, END<br />
When data are read from a file use the commands<br />
MTB > WRITE 'inputfile' C1, C2, C3<br />
where inputfile is where your data are stored. Data read from two files may be<br />
combined in Minitab either side-by-side or one top <strong>of</strong> the other, e.g.<br />
MTB > READ 'inputl' Cl-ClO<br />
MTB > READ 'input2 Cll-CZO
MTB > M ITE 'widefile' C1-C20<br />
MTB * WRITE 'tallfile' Cl-C10<br />
To select subsets <strong>of</strong> data<br />
MTB > COPY C1 INTO C2 USE 1,3:5<br />
This will copy the contents <strong>of</strong> C1 using rows 1, 3, 4 and 5 Into C2.<br />
MTB > COPY C1 INTO C2 USE C5 = 64,30:50<br />
This will copy the contents <strong>of</strong> Cl into C2 only if C5 is 64 or 30 to 50.<br />
MTB > SORT C1 C2 will store the sorted version <strong>of</strong> C1 into C2.<br />
In Minitab the constants are stored into K1, K2 etc. To save the entire session <strong>of</strong><br />
Minitab, use the command MTB > SAVE 'filename'<br />
This will put the entire worksheet into a file This will contain all columns, stored<br />
constants and column names. Information may be retrieved from it by using the<br />
command MTB > RETRIEVE 'filename'<br />
Many commands in Minitab have a number <strong>of</strong> subcommands. To indicate that a<br />
subcommand is in order a semi--colon(;) is put at the end <strong>of</strong> the command line. After all<br />
subcommands are specified a period(.) indicates the end, e.g.<br />
MTB > PLOT C1 C2;<br />
SUBC,<br />
TITLE 'CHERRY TREE DATA';<br />
SUBC> YLABEL'DIAMETER';<br />
SUBCz XLABEL 'VOLUME'.<br />
For plotting Minitab does not open a new window.<br />
Mathematical and Statistical Operations<br />
Some examples <strong>of</strong> arithmetic and algebraic expressions are<br />
MTB > LET C1= (C2 + C30) ' 10 - 60<br />
MTB > LET C1= C1- MEAN(C1)<br />
MTB > LET K1 = MEAN(Cl)ISTDEV(Cl)
MTB > LET C3 = C1+ C2-2<br />
Individual elements <strong>of</strong> a column may also be address e.g.<br />
MTB > LET C3 = C2(3) C1<br />
Usual mathematical functions like {ABSOLUTE), (SQRT), {LOGE), {LOGTEN),<br />
{SIN). {ROUND) etc, are also available. Commands for basic statistics include<br />
{DESCRIBE), {ZINTERVAL), (ZTEST), (TINTERVAL), (TTEST), {TWOSAMPLE) etc.<br />
Simple Linear Regression<br />
The basic command for regression C1 on (say) 3 predictors C2. C3 and C4 is<br />
MTB > REGRESS C1 3 C2 C3 C4<br />
The command (BRIEF K) controls the amount <strong>of</strong> the output. K can be any<br />
integer from 1 to 3, and the larger the value <strong>of</strong> K the more output. Default value <strong>of</strong> K<br />
is 2.<br />
The subcommands for regression include (NOCONSTANT), (MSE),<br />
{COEFFICIENTS), {HI), {RESIDUALS), (PREDICT). {VIF) etc.<br />
Minitab can also perform stepw~se regression, e.g<br />
MTB > STEPWISE C1 C2--C7;<br />
MTB > STEPS = 3.<br />
{STEPS) controls the number <strong>of</strong> steps shown per page. At the end <strong>of</strong> each<br />
group Minitab asks whether to show more <strong>of</strong> the steps or to end the output.<br />
Analysis <strong>of</strong> Variance<br />
The basic command for one--way analysis <strong>of</strong> variance is<br />
MTB > AOVONEWAY C1-C3<br />
Here each column contains Ihe observations for one cell. There must be more<br />
than two cells, otherwise the analysis is equivalent to (TWOSAMPLE) command with<br />
(POOLED)(standard deviation) subcommand. (AOVONEWAY) does not require an<br />
equal number <strong>of</strong> observation in each Cell.<br />
When all data are stored in one column and a second column gives the levels.<br />
then use the command<br />
MTB > ONEWAY C1 C2 C3 C4
C3 and C4 are optional. If C3 is specified the residuals are stored in it. If C4 are<br />
specified the fined values are stored In it. (TWOWAY) performs a two-way analysis <strong>of</strong><br />
variance for balanced dala.<br />
The command (ANOVA model) does analysis <strong>of</strong> variance for multiway balanced<br />
designs. Factors may be crossed or nested, fixed or random. (ANOVA) calculates all<br />
exact F-tests, prints expected mean squares and estimates variance components. You<br />
may specify your own tests, store residuals and fitted values and print call and marginal<br />
means. You analyze up to 50 response variables on one (ANOVA) command. To enter<br />
data you need one column for each response variable and one column for each factor.<br />
This means there is one row <strong>of</strong> the worksheet for each obse~ation. This row contains<br />
the value <strong>of</strong> each response variable and level <strong>of</strong> each factor.<br />
Because models can be quite long and tedious to type, a vertical bar indicates<br />
crossed factors and a minus sign removes terms, e.g.,<br />
(ANOVA Y = A I B ( C) is equivalent to the three-factor model with all the three<br />
two--way and the three--factor interaction terms.<br />
ANOVA Y A ) B ) C ) D - A'B'C -- A'B'C'D<br />
is equivalent to the model<br />
Y = A B C D A'B A'C A'D B'C B'D C'D A'B'D A'C'D<br />
B'C'D<br />
If a factor is nested you must indicate that when using the bar,<br />
e.g.<br />
ANOVA Y = A I B(A) 1 C<br />
is equivalent to<br />
Y =A B(A) C A'C B'C(A)<br />
Useful subcommands to be used with (ANOVA) are (RANDOM), (FITS),<br />
{RESIDUALS), (MEANS), {TEST) etc. The command (GLM) is used to do analysis <strong>of</strong><br />
variance with balanced and unbalanced design, analysis <strong>of</strong> covariance and regression<br />
analysis.<br />
Multivariate Analysis<br />
The command (PCA) does principal components analysis. Components can be<br />
calculated from the correlation matrix (default option) and output consists <strong>of</strong> the<br />
eigenvalues, the proportion and cumulative proportion <strong>of</strong> the total variance explained by<br />
each principal component and the coefficient for each principal component. Useful<br />
subcommands are (COVARIANCE), (COEF), (SCORES) etc.
The command (DISCRIMINANT) does linear and quadratic discriminant analysis<br />
for dassifying observations into two or mom groups based on the specified predictors.<br />
Output indudes the classification matrix, the squared distance between group centers,<br />
the linear discriminant function, means, standard deviations end covariance matrices<br />
and a summary <strong>of</strong> how each observation was classified. Useful subcommands are<br />
(QUADRATIC), (FITS), (XVAL), (PREDICT) etc.<br />
Plots and Graphics<br />
The basic command for scatterplot <strong>of</strong> C1 versus C2 is<br />
MTB > PLOT C1 C2<br />
To add titles, footnotes and axis labels to th~s plot you may use the<br />
subcommands (TITLE), (FOOTNOTE). (XLABEL), (YLABEL). To change the plotting<br />
symbol you may use the subcommand (SYMBOL}. The command (MPLOT) puts<br />
several plots on the same axes and (LPLOT) plots data using letters for plotting symbol.<br />
(TSPLOT) does a time--series plot. (HISTOGRAM) and (DOTPLOn produces<br />
histograms, The commands (GPLOT), (GMPLOT), (GLPLOT) etc are useful to produce<br />
high resolution graphics. (GPLOT) may also be used to plot a function. You may also<br />
control the line styles and colors for your graphs.<br />
References<br />
MINITAB Reference Manual : Release 7