2011 Salary Recommendation - Arizona Human Resources
2011 Salary Recommendation - Arizona Human Resources
2011 Salary Recommendation - Arizona Human Resources

Create successful ePaper yourself
Turn your PDF publications into a flip-book with our unique Google optimized e-Paper software.
Janice K. Brewer<br />
Governor<br />
September <strong>2011</strong><br />
ARIZONA DEPARTMENT OF ADMINISTRATION<br />
OFFICE OF THE DIRECTOR<br />
100 NORTH FIFTEENTH AVENUE • SUITE 401<br />
PHOENIX, ARIZONA 85007<br />
(602) 542-1500<br />
Scott A. Smith<br />
Director<br />
The Honorable Janice K. Brewer<br />
Governor, State of <strong>Arizona</strong><br />
The Honorable Russell Pearce<br />
President, <strong>Arizona</strong> State Senate<br />
The Honorable Andy Tobin<br />
Speaker, <strong>Arizona</strong> House of Representatives<br />
1700 West Washington<br />
Phoenix, <strong>Arizona</strong> 85007<br />
Dear Governor Brewer, President Pearce and Speaker Tobin:<br />
Pursuant to <strong>Arizona</strong> Revised Statutes section 41-763.01, the <strong>2011</strong> Advisory <strong>Recommendation</strong> is<br />
intended to provide information concerning the compensation of state employees and an<br />
objective assessment of the job market.<br />
The average state employee’s salary had previously been almost 22% behind the market; a<br />
discrepancy that was significantly affecting the ability to attract and retain quality talent. After<br />
increases in 2006 and 2007, that gap closed to almost 7%, and the state had nearly achieved<br />
the previously established goal to be within 5% of the market.<br />
Unfortunately, the economy at both the national and local levels suffered severe setbacks. In<br />
2008 a hiring freeze was implemented and agency budgets were reduced along with other<br />
measures necessary to balance the state’s budget. These conditions precluded providing salary<br />
increases in 2008, 2009, and 2010. Subsequently the state lost ground to the prevailing job<br />
market and salaries are now estimated to be 13.6% behind the market. The elimination of the<br />
required furlough days helped alleviate the fiscal impact to the average employee; however it is<br />
expected that state salaries may lose further ground compared with the market.<br />
Given the realities of the state’s current budget situation and considering the uncertain health of<br />
the economy at the state and national levels, the Department recommends deferring any salary<br />
increases until budget conditions improve.<br />
We hope that this Advisory <strong>Recommendation</strong> will provide the information you need when<br />
making decisions regarding <strong>Arizona</strong> state government and its employees’ compensation.<br />
Sincerely,<br />
Scott A. Smith<br />
Director
<strong>2011</strong> Advisory <strong>Recommendation</strong> on State Employee Salaries<br />
Every September, the <strong>Arizona</strong> Department of Administration (ADOA) provides an Advisory<br />
<strong>Recommendation</strong> to the Governor and the Legislature pursuant to A.R.S. §41-763.01. This<br />
document provides an analysis of the state’s current compensation levels compared to other<br />
public and private sector employers, and a review of the critical factors that must be considered<br />
when reviewing compensation strategies. These factors include turnover rates, retirement<br />
projections, economic forecasts, and projected market movement. The report concludes with a<br />
recommendation to the salary plan for employees in state service.<br />
This report reflects the current status of <strong>Arizona</strong> state employee compensation as<br />
it relates to market conditions at the end of Fiscal Year <strong>2011</strong>. The guidelines<br />
contained herein are provided as a resource to guide statewide budget<br />
considerations during the preparation of the Fiscal Year 2013 budget.<br />
HISTORY OF COMPENSATION<br />
Over the past several years, the state has implemented a number of different strategies to<br />
adjust employee salaries. These strategies included general salary adjustments, merit<br />
adjustments, special market adjustments, and other miscellaneous adjustments specifically<br />
targeted by the Legislature. However, there have also been years where no salary adjustments<br />
were funded.<br />
In 2005, the Department of Administration recommended a 5-year plan to bring employee<br />
salaries to within 5% of the prevailing job market. The plan developed in 2005 was used to<br />
guide the development of the FY 2007 budget, a budget that included an appropriation of a flat<br />
dollar amount ($1,650) to increase employee’s base salary, and the introduction of a pay<br />
practice for <strong>Arizona</strong> state government employees called “performance pay”. Performance pay<br />
was available to state employees if the governmental unit met or exceeded prescribed<br />
performance measures. If the measures were not met, the employees in that unit were not<br />
entitled to receive performance pay.<br />
In 2006 the Department of Administration recommended continuation of the original 5-year plan.<br />
The FY 2008 budget included an appropriation that provided for a 3.0% increase to base<br />
salaries, and an increase in the funding authorized for performance pay, bringing the total<br />
amount of performance pay available up to 2.75%.<br />
In 2007 the state was experiencing the beginning of a budget crisis. The Department of<br />
Administration did not recommend a specific amount for salary increases due to the uncertainty<br />
of the budget situation in September 2007. The FY 2009 budget did not provide for any salary<br />
increases.<br />
In 2008 and 2009 the state was deep in the throes of the worst budget crisis in recent history.<br />
The Department of Administration did not recommend salary increases due to the uncertainty of<br />
the budget situation in September 2008 and 2009. The FY 2010 budget did not provide for any<br />
salary increases, and the FY <strong>2011</strong> budget included the elimination of the performance pay<br />
program (2.75%) and the introduction of six furlough days each of the next two fiscal years.<br />
In 2010 the state was still addressing fundamental budget challenges although the first signs of<br />
economic recovery were beginning to appear. Nevertheless, economists were uncertain if the<br />
state and the nation would experience a recovery or if a double-dip recession was in the future.<br />
2
As a result of the economic uncertainty, the Department of Administration did not recommend<br />
salary increases in September 2010, although there was recognition that state salaries would<br />
likely be falling further behind the market. The FY 2012 budget did not provide for any salary<br />
increases, however the requirement for employees to observe six mandatory furlough days was<br />
eliminated.<br />
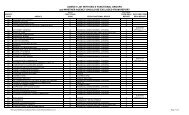
<strong>Recommendation</strong><br />
Year<br />
(Calendar Year)<br />
Figure 1<br />
History of the State’s Compensation Adjustments<br />
Budget<br />
Year<br />
(Fiscal Year)<br />
Average<br />
Covered<br />
<strong>Salary</strong><br />
General <strong>Salary</strong><br />
Adjustments<br />
Merit or<br />
Performance<br />
Allocations for<br />
Selected Classes<br />
1996 1998 $26,874 2.5% 2.5% Merit Yes<br />
1997 1999 $28,249 -0- 2.5% Merit Yes<br />
1998 2000 $29,208 -0- 2% Merit Yes<br />
1999 2001 $29,725 -0- 2% Merit Yes<br />
2000 2002 $30,331 $1,450<br />
2001 2003 $31,824 -0-<br />
2002 2004 $31,859 -0-<br />
2003 2005 $32,059 $1,000 Yes<br />
2004 2006 $32,897 1.7% Yes<br />
2005 2007 $36,195 $1,650 2.5% Perf Pay Yes<br />
2006 2008 $38,023 3.0% 0.25% Perf Pay Yes<br />
2007 2009 $38,097 -0-<br />
2008 2010 $38,478 -0-<br />
2009 <strong>2011</strong> $37,684 -0-<br />
2.75% Perf Pay<br />
Eliminated<br />
2010 2012 $37,535 -0-<br />
Source: Joint Legislative Budget Committee FY 2012 Appropriations Report. Merit Adjustment figures represent the percentage allocated<br />
to an agency's personnel services base. Allocations for Selected Classes are provided to address specific job classes or specific agency<br />
needs addressed by legislation. Average Covered <strong>Salary</strong> data are based on regular covered employees in agencies within the ADOA<br />
Personnel System calculated as of the end of July; figures for FY 2007, 2008, 2009, and 2010 have been adjusted to account for<br />
performance pay. Average salary for FY <strong>2011</strong> and FY 2012 does not include performance pay.<br />
3
CURRENT STATE OF COMPENSATION<br />
The job market is a constantly moving target, and state salaries must continually be analyzed to<br />
assess the competitive position of the state with respect to the market. The most recent analysis<br />
of market competitiveness suggests the market exceeds state salaries by an estimated 13.6%.<br />
Figure 2 below illustrates the relative difference between state salaries and the market.<br />
0%<br />
Figure 2 – Percent Needed to Get to Market<br />
-5%<br />
2005 Goal = within 5% of market<br />
-7.1%<br />
-10%<br />
-15%<br />
-17.5%<br />
- 11.5 %<br />
-13.2%<br />
-14.0%<br />
-16.4% -16.3%<br />
-14.9%<br />
-9.5% -9.5%<br />
-12.3%<br />
-13.6%<br />
-20%<br />
-22.5%<br />
-20.4%<br />
-21.7%<br />
-25% -25.7%<br />
-30%<br />
1997 1998 1999 2000 2001 2002 2003 2004 2005 2006 2007 2008 2009 2010 <strong>2011</strong> 2012<br />
Source: Percent Needed to Get to Market is based on a suite of compensation surveys, including the<br />
<strong>Arizona</strong> Compensation Survey (previously referred to as the Joint Governmental <strong>Salary</strong> Survey). Average<br />
State Employee Salaries are based on employees in the ADOA Personnel System calculated as of the<br />
beginning of the fiscal year (July 1). Figures for <strong>2011</strong> were corrected due to the public sector lagging<br />
behind the private sector more than projected.<br />
FUTURE CONSIDERATIONS<br />
There are a number of factors that must be considered in developing a strategy to ensure state<br />
salaries become competitive, including predictions of future market movement.<br />
Market Movement<br />
When reviewing information from compensation consulting firms, employers are asked to<br />
predict or project the increases that will occur in the future. Several surveys were analyzed to<br />
estimate market movement in the coming year (Figure 3). It is worth noting that in 2007 and<br />
2008, salary increases were typically in the range of 3-4%. <strong>Salary</strong> increases in 2009 were closer<br />
to 2%. While organizations nationally and regionally estimate increases averaging 2.5% in<br />
2010, of particular importance to this report, the estimated increase for public sector<br />
organizations in 2010 in <strong>Arizona</strong> is 0%.<br />
Figure 3 – Actual and Projected <strong>Salary</strong> Increases<br />
Reference<br />
2010 <strong>2011</strong> 2012<br />
Actual Actual Projected<br />
National - Hay 2.6% 3.0% 3.0%<br />
National - WorldatWork 2.5% 2.8% 2.9%<br />
Local (Phoenix) - WorldatWork 2.5% 2.8% 3.0%<br />
Local (Public & Private)<br />
AZ Compensation Survey<br />
1.5% 1.9% 2.3%<br />
Local (Public Sector Only)<br />
AZ Compensation Survey<br />
0.0% 0.6% 1.0%<br />
State of <strong>Arizona</strong> 0% 0% TBD<br />
Source: National data from Hay and WorldatWork websites; <strong>Arizona</strong> data from <strong>2011</strong> <strong>Arizona</strong> Compensation Survey.<br />
4
Turnover<br />
The separation rate of covered employees decreased to the lowest level since 2002 (Figure 4),<br />
and continues the general downward trend over the past six years.<br />
Figure 4 – Separation Rates of Covered Employees<br />
22%<br />
21.2%<br />
AZ Turnover<br />
21%<br />
State & Local<br />
All Govt<br />
20%<br />
19%<br />
18%<br />
17%<br />
17.9%<br />
17.3%<br />
16%<br />
15%<br />
15.4%<br />
14.9%<br />
14.8%<br />
15.6% 15.5%<br />
13.9%<br />
14%<br />
13%<br />
12.7%<br />
12%<br />
2002 2003 2004 2005 2006 2007 2008 2009 2010 <strong>2011</strong><br />
Source: <strong>2011</strong> State of <strong>Arizona</strong> Workforce Report. Separations are defined as covered employees leaving<br />
state service during the fiscal year (July 1 to June 30). Comparative data from the national Bureau of<br />
Labor Statistics, U.S. Department of Labor, seasonally adjusted turnover rates. State and local includes<br />
State and local government entities in the 50 States and the District of Columbia. All Government includes<br />
Federal, State, and local government entities in the 50 States and the District of Columbia.<br />
While there is no longer any debate that the economic recession has formally ended, the<br />
strength of the recovery is still very much in question. In fact, continuing analysis by economists<br />
has revealed an economy harder hit by the recession than previously thought, and a recovery<br />
that has stalled out, spurring more debate about the possibility of the dreaded double dip<br />
recession 1 . The impact of economic conditions directly affects the mobility of the workforce. The<br />
relationship between unemployment rates and voluntary turnover suggests that turnover will<br />
increase once the economy recovers. This will force corporate leaders to face a new challenge;<br />
replacing lost employees as the economy recovers and talent is once again a scarce<br />
commodity 2 . A recent study 3 reports that 37% of employees reported feeling they are not fairly<br />
compensated for assuming a greater workload during the recession. The same study goes on to<br />
reveal that 4 out of 10 professionals polled said they are more inclined to look for new<br />
opportunities outside their firms as a result of the recession.<br />
Many employers are anticipating an increased need to attract and retain talent in the near<br />
future. Despite efforts to engage employees during the past year, organizations have growing<br />
concerns about whether their valued employees will stay once the economy recovers. Nearly<br />
two-thirds of companies believe that voluntary turnover will increase as the economy and job<br />
market continue to improve. 4<br />
1 “The Glow is Gone from Growth.” Lee McPheters. Knowledge@W.P.Carey School of Business. ASU. August 4,<br />
<strong>2011</strong>.<br />
2 “Where Did Our Employees Go Examining the rise in voluntary turnover during economic recoveries.” Deloitte<br />
Review. January <strong>2011</strong>.<br />
3 Workplace Redefined – Shifting Generational Attitudes During Economic Change. Robert Half. 2010<br />
4 Global Attraction and Retention Survey, Mercer, 2010<br />
5
Size of the Workforce<br />
The size of the workforce was dramatically decreased in 2009 and 2010 as a result of personnel<br />
reductions, attrition, and limited hiring beginning in 2007. Although there was a slight increase in<br />
staffing levels in <strong>2011</strong>, the workforce remains much smaller than in previous years. Compared<br />
to the workforce of 2007, the reduction has been 15.6%, accounting for the loss of over 5,800<br />
filled positions.<br />
Figure 5 – Employee Headcount – ADOA Personnel<br />
40,000<br />
38,506<br />
38,000<br />
36,000<br />
37,293<br />
37,306<br />
36,674<br />
36,442<br />
35,847 36,030<br />
34,000<br />
33,236<br />
32,000<br />
30,832<br />
31,496<br />
30,000<br />
2002 2003 2004 2005 2006 2007 2008 2009 2010 <strong>2011</strong><br />
Source: <strong>2011</strong> State of <strong>Arizona</strong> Workforce Report. Includes covered and uncovered employees in<br />
the ADOA Personnel System, excluding limited, seasonal, and part-time of less than 0.25 FTE.<br />
Retirement Rates<br />
One of the critical issues facing the state is the ability to retain a skilled and effective workforce.<br />
This may be especially significant with the well-documented trend of increasing retirements and<br />
the subsequent loss of institutional knowledge (Figure 6).<br />
Figure 6 – Percent of Separations Due to Retirement<br />
25%<br />
20%<br />
22.0%<br />
21.0%<br />
15%<br />
10%<br />
10.9%<br />
9.4%<br />
11.7% 12.2% 13.9% 14.2% 10.2%<br />
5.9%<br />
5%<br />
0%<br />
2002 2003 2004 2005 2006 2007 2008 2009 2010 <strong>2011</strong><br />
Source: <strong>2011</strong> State of <strong>Arizona</strong> Workforce Report. Includes covered and uncovered employees<br />
in the ADOA Personnel System separating from state service during the fiscal year.<br />
6
Current estimates suggest that over 89% of the larger state agencies are expected to have<br />
more than 25% of their active workforce eligible to retire in the next five years (<strong>2011</strong> ADOA<br />
<strong>Human</strong> <strong>Resources</strong> System Annual Report), including fourteen agencies that are anticipated to<br />
have over 35% of their workforce eligible to retire in five years. The data further emphasizes the<br />
need for the state to be prepared to attract and retain an effective workforce in the near future.<br />
Economic Forces<br />
A key factor that must be taken into consideration when developing a compensation strategy to<br />
address employee salaries is the health of the economy. The U.S. Bureau of Labor Statistics<br />
reports on voluntary turnover as a measure of workers’ willingness or ability to change jobs. In<br />
June <strong>2011</strong>, the number of employees who voluntarily quit (1.9 million) was nearly a million less<br />
than the 2.8 million who quit in December 2007 when the recession began 5 . Unfortunately, it<br />
appears that economic conditions in <strong>Arizona</strong> may be slightly worse than at the national level.<br />
The <strong>Arizona</strong> unemployment rate in July was 9.4%, up one tenth of a percentage point from<br />
9.3% in June. The U.S. unemployment rate decreased from 9.2% in June to 9.1% in July. 6<br />
CONCLUSION<br />
The state made significant progress towards improving the position of state employee salaries<br />
relative to the market during FY 2007 and FY 2008. The Executive and Legislative branches<br />
sent a clear message to state employees that salary issues were important, and the gap<br />
between state employee salaries and the market was reduced to the lowest level in nearly two<br />
decades. Unfortunately, due to the economic challenges at the national and local levels, the<br />
state did not allocate funding for salary increases in FY 2009 or FY 2010. The impact on<br />
employee salaries was compounded in FY <strong>2011</strong> with the elimination of the performance pay<br />
program (2.75%) and the introduction of furlough days. Although the furlough days were<br />
eliminated in FY 2012, the market is projected to continue to move forward, albeit at a slower<br />
rate than in years past. It is expected that state salaries will remain below the market, or slowly<br />
lose further ground.<br />
RECOMMENDATION<br />
As soon as it is fiscally possible, addressing issues of state employee compensation should be<br />
a priority and the goal of bringing salaries within 5% of the market should be addressed.<br />
However, the Department of Administration understands and appreciates the realities of the<br />
current economic situation of the state’s budget. When also taking into consideration the health<br />
of the economy at a national and regional level, the Department recommends deferring any<br />
salary increases until budget conditions improve.<br />
5 Job Openings and Labor Turnover – June <strong>2011</strong>. U.S. Bureau of Labor Statistics. News Release. August 10, <strong>2011</strong>.<br />
6 <strong>Arizona</strong> Workforce Employment Report, Employment & Population Statistics. August 18, <strong>2011</strong>.<br />
7