6 Gsps ADC Interleave Test - CASPER
6 Gsps ADC Interleave Test - CASPER
6 Gsps ADC Interleave Test - CASPER

You also want an ePaper? Increase the reach of your titles
YUMPU automatically turns print PDFs into web optimized ePapers that Google loves.
6 <strong>Gsps</strong> <strong>ADC</strong> <strong>Interleave</strong> <strong>Test</strong><br />
Rick Raffanti<br />
Sept 10, 2007<br />
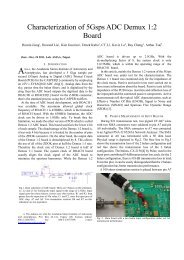
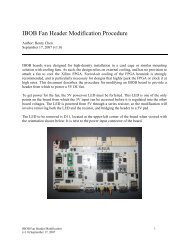
The purpose of this test was to interleave two <strong>ADC</strong>083000 boards and measure the <strong>ADC</strong> board<br />
frequency response. Each <strong>ADC</strong> board sampled at 3 <strong>Gsps</strong>, for an effective sample rate of 6<br />
<strong>Gsps</strong>. The two <strong>ADC</strong> boards (Assembly R271, revA), were plugged into a Virtex 5 board (”Roach<br />
1.0”, revA), with FPGA type XC5VSX50TFF1136 installed.<br />
I drove the two <strong>ADC</strong> clock inputs with 1.5GHz through a ZAPDQ-2-S quadrature splitter (so one<br />
is delayed ¼ cycle at 1.5GHz, thus ½ cycle at 3GHz). I drove the two <strong>ADC</strong> inputs through a<br />
ZFRSC-42-S+ resistive splitter. I carefully matched cable lengths, and used all SMA<br />
connections. Clock frequency of the <strong>ADC</strong> interface is 375MHz, for a 750MHz DDR data rate.<br />
<strong>Test</strong> setup shown in photo below.
First I acquired 128 sample records and plotted them at various input frequencies:<br />
250<br />
200<br />
150<br />
100<br />
66MHz<br />
166MHz<br />
266MHz<br />
50<br />
0<br />
1 6 11 16 21 26 31 36 41 46 51 56 61 66 71 76 81 86 91 96 101 106 111 116 121 126<br />
250<br />
200<br />
150<br />
100<br />
566MHz<br />
866MHz<br />
1166MHz<br />
50<br />
0<br />
1 6 11 16 21 26 31 36 41 46 51 56 61 66 71 76 81 86 91 96 101 106 111 116 121 126<br />
200<br />
180<br />
160<br />
140<br />
120<br />
100<br />
80<br />
2066MHz<br />
2566MHz<br />
3066MHz<br />
60<br />
40<br />
20<br />
0<br />
1 6 11 16 21 26 31 36 41 46 51 56 61 66 71 76 81 86 91 96 101 106 111 116 121 126
Next I acquired 1024 sample records and computed rms amplitude vs frequency. I used two<br />
different RF generators for the input, an HP8616A (only goes 1.8GHz and up) and a PTS3200<br />
(1MHz to 3.2GHz). I calibrated the PTS3200 output using an HP432A RF power meter. The red<br />
plot below shows the calibrated data.<br />
Sine Sweep, Mini Roach 6GSPS<br />
2<br />
0<br />
-2<br />
dB rel 66MHz<br />
-4<br />
-6<br />
-8<br />
-10<br />
-12<br />
-14<br />
PTS3200 generator<br />
HP8616A generator<br />
PTS3200, calibrated<br />
1 10 freq, 100MHz<br />
1000 10000<br />
Conclusions:<br />
From the 266MHz plot it’s clear that the differential sampling phase is off by something like 50ps.<br />
This will distort the waveforms, especially at higher frequencies, but shouldn’t affect the rms<br />
values.<br />
Analog bandwidth falls off rapidly above 2.5GHz, probably due to the <strong>ADC</strong>083000 response itself<br />
(National warned us that the 3GHz specified in the data sheet was not actually achieved).<br />
Between 1GHz and 2.5GHz response is bumpy, maybe due to balun or PCB issues.