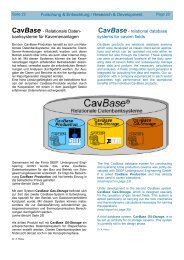
PUB02-01 - SOCON Sonar Control Kavernenvermessung GmbH
PUB02-01 - SOCON Sonar Control Kavernenvermessung GmbH
PUB02-01 - SOCON Sonar Control Kavernenvermessung GmbH

You also want an ePaper? Increase the reach of your titles
YUMPU automatically turns print PDFs into web optimized ePapers that Google loves.
A. REITZE, H. VON TRYLLER : PC-based 3D-Visualisation of Cavern Fields Page 1 of 10<br />
Solution Mining Research Institute, Fall 20<strong>01</strong> Technical Meeting<br />
Albuquerque, New Mexico, USA, October 7-10<br />
PC-based 3D-Visualisation of Cavern Fields<br />
Andreas Reitze, Hartmut von Tryller<br />
<strong>SOCON</strong> <strong>Sonar</strong> <strong>Control</strong> <strong>Kavernenvermessung</strong> <strong>GmbH</strong><br />
Schachtstr. 3b, 31180 Giesen, Germany<br />
Abstract<br />
The advent of ever more powerful personal computers has made it possible for such<br />
hardware to run applications that until just a few years ago were restricted to the<br />
realm of workstations and mainframe computers. Nowadays PCs running suitable<br />
software can be used to display entire cavern fields in a general 3D model depicting<br />
not only the cavern geometry but also the geology, the course of the wells and the<br />
Earth's surface.<br />
Here a practical example is used to show how 3D models of cavern fields can be<br />
efficiently generated by applying software optimized for this job. Such models are<br />
suitable not only for presentation purposes but also, for example, for correlating<br />
survey results with the geology or for supporting planning work.<br />
All the data and information needed for a 3D model are acquired via CavMap, the<br />
central program within the CavInfo software suite. Based on the acquired data,<br />
modeling is performed automatically by means of the CavWalk program, which has<br />
been specially developed for the 3D display of cavern fields. Finally a 3D animation<br />
created with CavWalk is presented.<br />
1. Introduction<br />
In the seventies and eighties caverns were predominantly displayed twodimensionally<br />
in the form of horizontal and vertical sections. As computers became<br />
more powerful, programs were developed for displaying individual caverns threedimensionally.<br />
The continued rapid development over the last few years in particular<br />
has now enabled standard personal computers to display not only individual caverns,<br />
but also entire cavern fields including supplementary information in a 3D model<br />
(Fig. 1).
A. REITZE, H. VON TRYLLER : PC-based 3D-Visualisation of Cavern Fields Page 2 of 10<br />
1970 1980 1990 2000<br />
Fig. 1: Development of how a cavern can be displayed<br />
Just a few years ago such applications could be run only on workstations and<br />
mainframe computers, but nowadays PCs can be used to display entire cavern fields<br />
in a general 3D model depicting not only the cavern geometry but also the geology,<br />
the course of the wells and the Earth's surface. Besides being useful for presentation<br />
purposes such models prove helpful in correlating survey results with the geology or<br />
in various planning work.<br />
2. Data sources<br />
2.1 Subsurface data<br />
In addition to the void geometry of an individual cavern (Fig. 1), a cavern operator<br />
must nowadays collect, analyze, manage and if necessary suitably display a wide<br />
range of further data and information about a cavern or cavern field. Without the use<br />
of suitable software it would be virtually impossible to manage this mass of data. The<br />
information originating from the subsurface includes in particular geological data, well<br />
data and data about the cavern formed.
A. REITZE, H. VON TRYLLER : PC-based 3D-Visualisation of Cavern Fields Page 3 of 10<br />
2.1.1 Geology<br />
Prior to constructing a cavern geological data are acquired during the investigation of<br />
the salt deposit. Besides the results of any seismic surveys that may have been<br />
carried out, the geological data normally originates from selective sources such as<br />
well coring and logs. In the first place geological data support the simulation and<br />
control of the leaching process, but the data are also needed so that they can be<br />
displayed along with the recorded cavern geometry (Fig. 2). Only then it is possible to<br />
better analyze and explain any irregularities in the cavern contours. Up to now<br />
geological information was visualized predominantly two-dimensionally.<br />
Tertiary<br />
Caprock<br />
Salt<br />
Fig 2: 2D display of geological data using CavMap,<br />
left: geological well profile,<br />
top right: geological section obtained from well profiles,<br />
bottom right: map showing interpreted geology
A. REITZE, H. VON TRYLLER : PC-based 3D-Visualisation of Cavern Fields Page 4 of 10<br />
2.1.2 Wells and caverns<br />
In addition to the geological information gained from a well, it is important to know the<br />
subsurface course that a well takes. The precise course of a well obtained from a<br />
deviation survey is essential for determining the proper location of a cavern within a<br />
cavern field. It is possible to accurately determine pillar thicknesses and the shortest<br />
distances between adjacent caverns only if the cavity survey is precisely referred to<br />
the position of the reference point within the casing – normally this is the deepest<br />
cemented casing shoe.<br />
Important for visualizing the cavern situation are not only the pure geometrical data<br />
from wells and caverns but also a wide range of data that are acquired when creating<br />
the cavern as well as during the subsequent storage operation. This includes data on<br />
well completion, interfaces and amount of fill.<br />
Well<br />
course<br />
Position of hanging strings and<br />
interfaces<br />
Shortest<br />
distance<br />
Fig. 3: 2D displays of well and cavern data<br />
bottom left: well course in plan view<br />
top left: well course in vertical view<br />
right: vertical section between adjacent caverns
A. REITZE, H. VON TRYLLER : PC-based 3D-Visualisation of Cavern Fields Page 5 of 10<br />
2.2 Surface data<br />
The subsurface details and data necessary for operating caverns must be<br />
supplemented by considering the situation at the surface. In the past these data were<br />
acquired and used mainly for internal company use – for example for planning<br />
operating facilities – but during recent years the relevance of surface information has<br />
become increasingly important for official purposes and for informing the public.<br />
Of particular significance with respect to cavern operations is the information about<br />
the surface pipelines and services network which connects the individual caverns<br />
with the operating facilities. So as to be able to show the services network in the<br />
correct location with regard to existing surface conditions, it is necessary to<br />
superimpose the topography (Fig. 4). This can be done by including official maps or<br />
aerial photographs.<br />
As all cavern operations eventually lead to surface subsidence, visualization of the<br />
surface changes in relation to the positions of the caverns can be useful.<br />
Fig. 4: 2D display of surface data<br />
top: aerial photograph, left: subsidence contours, right: services network map
A. REITZE, H. VON TRYLLER : PC-based 3D-Visualisation of Cavern Fields Page 6 of 10<br />
3. 3D visualization of a cavern field<br />
3.1 Data acquisition with CavMap<br />
All the surface and subsurface data sources and information described above that<br />
need to be considered in 3D modeling must first of all be properly recorded and<br />
managed so that on the one hand visualization can be effected with a reasonable<br />
amount of manpower and on the other hand all the data can be displayed in a<br />
mutually logical and correct arrangement. CavMap, the key program in the CavInfo<br />
software suite [2,3], has been specifically developed for acquiring these data.<br />
CavMap enables several caverns to be displayed at the same time as a cavern field.<br />
CavMap is also an ideal company information system for cavern operations due to its<br />
internal database for storing operating data, its tailor-made cavern operation<br />
functions as well as its open architecture. This program has already been presented<br />
in detail [1].<br />
Fig. 5: Maximum radii plot of caverns together with an aerial photograph of the<br />
surface in CavMap
A. REITZE, H. VON TRYLLER : PC-based 3D-Visualisation of Cavern Fields Page 7 of 10<br />
3.2 Visualization with CavWalk<br />
3D modeling is effected with the CavWalk program based on the data acquired with<br />
CavMap. CavWalk is a component of the CavInfo software suite, and has been<br />
specially developed for the 3D display of cavern fields. The user has only to select a<br />
cavern field or part of a field in CavMap and then start CavWalk. When this is done<br />
all the data available to CavMap – from the cavern geometry and the casing levels to<br />
the geology and the surface situation – are automatically transferred to a 3D model<br />
and displayed with CavWalk.<br />
Fig. 6: 3D model of a cavern field in CavWalk<br />
In automatic modeling first of all each of the most recent sonar surveys of all caverns<br />
is transferred, considering the coordinates of their reference points, to a uniform<br />
three-dimensional coordinate system. 3D visualization of the caverns together with<br />
the course of the wells are presented within a cube, which has a map or picture of<br />
the Earth's surface on the top and geological sections on the sides.
A. REITZE, H. VON TRYLLER : PC-based 3D-Visualisation of Cavern Fields Page 8 of 10<br />
From the geological information, which is usually available only for specific points, the<br />
relevant geological interfaces are calculated automatically from the existing data<br />
during modeling. The interfaces in the model shown in Fig. 6 are the bottom of the<br />
Quarternary as well as the top and bottom of the salt deposit. These surfaces can be<br />
displayed either as solid surfaces or as a grid.<br />
Geological sections can also run directly through a cavern field (Fig. 7) or directly<br />
through a cavern. In this case the lateral limits can be completed by coordinate grids<br />
and the floor by a plan view of the maximum radii.<br />
Fig. 7: 3D model of a cavern field in CavWalk
A. REITZE, H. VON TRYLLER : PC-based 3D-Visualisation of Cavern Fields Page 9 of 10<br />
CavWalk now allows the user to make a virtual tour of the 3D model of the cavern<br />
field that has been generated. Using the mouse as his means of control the user can<br />
move anywhere outside and inside the model. In this way the user can view, for<br />
example, the inside of caverns (Fig. 8) as well as the Earth's surface above the<br />
caverns (Fig. 9), as would normally be seen only from the air. 3D animations can be<br />
generated from the model, saved and then played back as films using CavMovie.<br />
Figs 8 and 9 show four scenes of such a 3D animation that have been created from<br />
the 3D model shown in Fig. 6.<br />
Fig. 8: Scenes of a 3D animation created with CavWalk<br />
An excellent spatial presentation quality can be experienced with CavWalk provided<br />
the user has a computer with a suitable graphic card and wears the appropriate 3D<br />
glasses with LCD shutter technology. Images and animations then appear on<br />
conventional PC screens with an impressive three-dimensional depth, which is<br />
comparable only with that of holographic images.
A. REITZE, H. VON TRYLLER : PC-based 3D-Visualisation of Cavern Fields Page 10 of 10<br />
Fig. 9: Scenes of a 3D animation created with CavWalk<br />
4. Bibliography<br />
[1] REITZE A., VON TRYLLER H.: Mapping of cavity fields using the CavMap<br />
program - an information system for cavity operators, SMRI Spring meeting,<br />
April 19-22, 1998, New Orleans, Louisiana, U.S.A. (1998).<br />
[2] REITZE A., VON TRYLLER H.: Einsatz der CavInfo Software Suite zur<br />
Darstellung und Analyse von <strong>Kavernenvermessung</strong>en, Logs sowie<br />
Kavernenfeldern, DGMK Report 2000-2, Spring meeting, April 27-28, 2000 in<br />
Celle, pp. 489-497.<br />
[3] REITZE A., VON TRYLLER H.: Correlation of cavern survey data with geological<br />
and log data, 8 th World Salt Symposium (SALT 2000)- Volume 1,<br />
Amsterdam, Lausanne, New York, Oxford, Shannon, Singapore, Tokyo;<br />
Elsevier Science b.v.:2000, pp. 313-317.