OFFERING MEMORANDUM Global Offering of up to ... - Nordex
OFFERING MEMORANDUM Global Offering of up to ... - Nordex
OFFERING MEMORANDUM Global Offering of up to ... - Nordex

You also want an ePaper? Increase the reach of your titles
YUMPU automatically turns print PDFs into web optimized ePapers that Google loves.
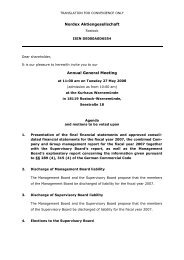
(Combined)<br />
pro forma CONSOLIDATED INCOME STATEMENTS<br />
according <strong>to</strong> IAS<br />
in a subsumed 3-year presentation<br />
for the twelve months ended September 30, 2000<br />
for the twelve months ended September 30, 1999<br />
for the twelve months ended September 30, 1998<br />
Note<br />
1999/00<br />
pro forma<br />
1998/99<br />
pro forma<br />
1997/98<br />
pro forma<br />
E E E<br />
Net sales (6.1) 272,669,814.84 223,742,801.56 82,476,587.43<br />
Change in inven<strong>to</strong>ries <strong>of</strong> work in process (6.2) (3,213,876.05) 8,436,511.87 2,782,896.07<br />
Work and material capitalized (6.3) 735,399.55 444,670.55 0.00<br />
Total operating performance 270,191,338.34 232,623,983.98 85,259,483.50<br />
Other operating income (6.4) 1,973,699.62 1,191,065.76 897,484.15<br />
Cost <strong>of</strong> materials (6.5)<br />
cost <strong>of</strong> raw materials and s<strong>up</strong>plies (166,500,959.01) (156,020,672.38) (52,747,855.91)<br />
cost <strong>of</strong> services purchased (37,276,316.89) (32,859,080.43) (13,845,817.20)<br />
Gross pr<strong>of</strong>it 68,387,762.06 44,935,296.93 19,563,294.54<br />
Personnel expenses (6.6)<br />
(a) wages and salaries (16,806,910.28) (11,211,819.34) (5,216,417.18)<br />
(b) social security taxes (2,398,742.33) (1,538,926.27) (783,680.16)<br />
Amortization <strong>of</strong> intangible assets and depreciation <strong>of</strong><br />
property, plant and equipment (6.7) (3,725,019.82) (2,096,032.78) (862,057.71)<br />
Other operating expenses (6.8) (32,242,773.24) (20,088,169.96) (9,885,015.53)<br />
Operating pr<strong>of</strong>it 13,214,316.39 10,000,348.58 2,816,123.96<br />
Other interest and similar income (6.9) 516,156.93 1,110,856.41 70,445.35<br />
Other interest and similar expenses (6.9) (3,381,480.21) (988,672.70) (405,895.16)<br />
Net financial result (2,865,323.28) 122,183.71 (335,449.81)<br />
Pr<strong>of</strong>it from ordinary operations 10,348,993.11 10,122,532.29 2,480,674.15<br />
Income taxes (6.10)<br />
current taxes (2,376,192.57) (869,930.44) 0.00<br />
imputed taxes (2,139,535.64) (703,692.55) 263,560.23<br />
deferred taxes 631,068.14 (2,043,133.61) (1,141,783.80)<br />
Other taxes (6.11) (29,736.46) 24,476.49 (7,255.31)<br />
Net income 6,434,596.58 6,530,252.18 1,595,195.27<br />
Adjustment for pro forma gro<strong>up</strong> fee apportionment and<br />
imputed taxes 4,829,520.30 3,090,692.55 1,618,439.77<br />
Pr<strong>of</strong>it transfer (7,987,930.09) (4,129,487.53) (1,229,370.33)<br />
Pr<strong>of</strong>it/(loss) carryover 6,384,188.00 892,730.80 (1,091,533.91)<br />
Pro forma net earnings 9,660,374.79 6,384,188.00 892,730.80<br />
F-5