Reequilibrationof fluid inclusions - Geochemistry - Virginia Tech
Reequilibrationof fluid inclusions - Geochemistry - Virginia Tech
Reequilibrationof fluid inclusions - Geochemistry - Virginia Tech

You also want an ePaper? Increase the reach of your titles
YUMPU automatically turns print PDFs into web optimized ePapers that Google loves.
Bodnar RJ (2003) Introduction to aqueous <strong>fluid</strong> systems. In I. Samson, A. Anderson, & D. Marshall, eds.<br />
Fluid Inclusions: Analysis and Interpretation. Mineral. Assoc. Canada, Short Course 32, 81-99.<br />
CHAPTER 4. INTRODUCTION TO AQUEOUS -ELECTROLYTE FLUID INCLUSIONS<br />
Robert J. Bodnar<br />
The Bubble Factory<br />
<strong>Virginia</strong> <strong>Tech</strong><br />
Blacksburg, VA 24061 USA<br />
rjb@vt.edu<br />
INTRODUCTION<br />
Aqueous <strong>fluid</strong>s containing various<br />
amounts of salts are common in many geologic<br />
environments. In most environments, NaCl, KCl or<br />
CaCl 2 is the dominant salt, but MgCl 2 or LiCl can<br />
be present in significant amounts in some<br />
environments. Before the 1960s, essentially all<br />
gas-free aqueous <strong>inclusions</strong> were interpreted<br />
using PVTX data for H 2 O (cf. Kennedy 1950,<br />
Skinner 1953, Kalyuzhnyy 1960), for two reasons.<br />
First, <strong>fluid</strong> inclusion microthermometric and<br />
analytical techniques were rather primitive,<br />
precluding the possibility of determining which<br />
salts were present or even the total salt content.<br />
Secondly, even if the nature of the salts in the<br />
<strong>inclusions</strong> could be determined, the PVTX data for<br />
salt solutions needed to interpret the microthermo -<br />
metric results were almost non-existent.<br />
The 1960s saw the introduction of a<br />
reasonably accurate cooling stage for measuring<br />
ice-melting temperatures of aqueous <strong>inclusions</strong><br />
(Roedder 1962), and the application of these data<br />
to determine salinities of <strong>fluid</strong> <strong>inclusions</strong> (Roedder<br />
1963). At about this same time, workers were<br />
beginning to determine the composition of<br />
<strong>inclusions</strong> using a variety of bulk extraction<br />
techniques (Roedder 1958; see also Roedder<br />
1990). Also, in 1962, the classic paper by<br />
Sourirajan & Kennedy (1962), describing the PTX<br />
properties of the H 2 O-NaCl system at elevated<br />
temperatures and pressures was published.<br />
Finally, techniques were available to estimate<br />
salinities of aqueous <strong>inclusions</strong>, and PTX data<br />
were available to interpret the results. The next<br />
three decades saw a significant increase in the<br />
number of studies of the H 2 O-NaCl system, as well<br />
as other aqueous-salt systems, improving the<br />
accuracy of available data and extending the<br />
database to significantly higher temperatures,<br />
pressures and salinities. In 1977, Potter & Brown<br />
(1977) published a summary of available PVT data<br />
for H 2 O-NaCl to 500°C and 2,000 bars, allowing<br />
workers to estimate isochores for aqueous<br />
<strong>inclusions</strong>. Hilbert (1979) extended these data to<br />
600°C and 4,000 bars, and Bodnar (1985) extended<br />
the range of PVT data to salinities of 70 wt.%.<br />
The best-studied binary aqueous<br />
electrolyte system is H 2 O-NaCl, owing to its<br />
importance not only in geologic studies, but also<br />
in many industrial and engineering applications.<br />
PVTX data for H 2 O-NaCl have been used to<br />
interpret results from <strong>fluid</strong> <strong>inclusions</strong> which show<br />
no detectable gases during normal microthermo -<br />
metric and/or crushing analysis, and for those<br />
<strong>inclusions</strong> which show first melting of ice near the<br />
H 2 O-NaCl eutectic temperature (-21.2°C).<br />
Properties of H 2 O-NaCl are also commonly used to<br />
interpret microthermometric data from <strong>inclusions</strong><br />
with much lower first melting temperatures<br />
(indicating the presence of cations other than Na<br />
or K), owing to the lack of PVTX data for most<br />
other aqueous electrolyte systems.<br />
In this chapter PVTX properties of<br />
aqueous electrolyte systems are summarized and<br />
the application of these data to interpretation of<br />
aqueous <strong>fluid</strong> <strong>inclusions</strong> is presented. Because<br />
data for the H 2 O-NaCl system are more complete<br />
than those for other aqueous electrolyte systems,<br />
this system will be described in detail. The<br />
methodology and problems associated with<br />
obtaining microthermometric data have been<br />
discussed in detail by other workers (Roedder<br />
1984, Goldstein & Reynolds 1994, Goldstein 2003)<br />
and are not included here.<br />
H 2O-NaCl SYSTEM<br />
PTX Topology of the H 2 O-NaCl System<br />
The H 2 O-NaCl system is an example of a<br />
binary system in which the solubility curve does<br />
not intersect the critical curve (Morey 1957); that<br />
is, the system exhibits a critical curve that is<br />
continuous between the critical points of the two<br />
end-members. The H 2 O-NaCl system is<br />
characterized by a large region of PTX space in<br />
which <strong>fluid</strong> immiscibility, represented by<br />
coexisting higher salinity liquid and lower salinity<br />
vapor, is possible (Fig. 4-1). The H 2 O-NaCl liquidvapor<br />
two-phase region is bounded by:<br />
81
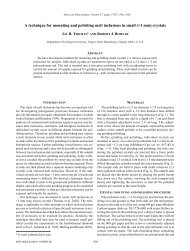
FIG.4-1. Distorted, schematic PT projection of the H 2 O-NaCl liquid-vapor envelope. TP H2 O = H 2 O triple point (T<br />
= 0.01ºC, P = 0.006 bar); CP H2 O = H 2 O critical point (T = 374.1ºC, P = 220 bars); TP NaCl = NaCl triple point (T =<br />
801ºC, P = approx. 1 bar); CP NaCl = NaCl critical point (T = approx. 3327ºC, P = approx. 235 bars); E = eutectic<br />
point (L + V + I + HH, T = -21.2ºC, P = 0.001 bar, 23.2 wt% NaCl); P = peritectic point (L + V + HH + H, T =<br />
0.1ºC, P = 0.004 bar, 26.2 wt.% NaCl). Within the shaded region, <strong>fluid</strong> immiscibility to produce a high salinity<br />
liquid in equilibrium with a lower salinity vapor is possible (modified from Bodnar et al. 1985a). The shaded<br />
area of the inset is a schematic representation of the liquid-vapor two -phase region for a composition of 20<br />
wt.% NaCl.<br />
• the liquid-vapor curve for pure H 2 O, that<br />
extends from the triple point of pure water<br />
(TP H2 O: T = 0.01ºC, P = 0.006 bar) to the critical<br />
point of H 2O (CP H2 O: T = 374.1ºC, P = 220 bars);<br />
• the locus of liquid-vapor-ice triple points<br />
(L+V+I) or ice-melting curve that extends from<br />
the triple point of H 2 O to the eutectic point (E,<br />
I+L+V+Hydrohalite (HH); T = -21.2°C, P ˜ 0.001<br />
bars);<br />
• the locus of liquid-vapor-hydrohalite triple<br />
points (L+V+HH) that extends from the eutectic<br />
to the peritectic, (P, L+V+Halite (H) +HH; T =<br />
0.1°C, P ˜ 0.004 bars);<br />
• the locus of liquid-vapor-halite triple points<br />
(L+V+H) that extends from the peritectic (P) to<br />
the NaCl triple point (TP NaCl : T = 801ºC, P ≈ 1<br />
bar);<br />
• the NaCl liquid -vapor curve that extends from<br />
the NaCl triple point to the NaCl critical point<br />
(CP NaCl : T ≈ 3327ºC, P ≈ 235 bars);<br />
• the locus of critical points that extends from the<br />
critical point of H 2 O to the critical point of NaCl.<br />
Within the region of P-T space bounded<br />
by these various phase surfaces (labeled "L + V"<br />
on Fig. 4-1), a <strong>fluid</strong> with a given bulk composition<br />
may exist as either a single-phase liquid or singlephase<br />
vapor, or may split into two coexisting<br />
phases (Sourirajan & Kennedy 1962, Bodnar et al.<br />
1985a). The shaded region of Figure 1 (labeled "L<br />
+ V) represents the complete P-T range over which<br />
liquid-vapor immiscibility is possible. For any<br />
82
particular composition, the region of immiscibility<br />
occupies a somewhat smaller region of P-T space,<br />
as described by Bodnar et al. (1985a). For example,<br />
an H 2 O-NaCl <strong>fluid</strong> with a bulk composition of 20<br />
wt.% NaCl would become immiscible within the<br />
shaded region labeled "L+V 20 wt.% NaCl" shown<br />
in the inset on Figure 4-1, but would exist as a<br />
single -phase <strong>fluid</strong> (either liquid or vapor,<br />
depending on the P-T conditions) at temperatures<br />
and pressures outside of the shaded region. How<br />
one determines the compositions of the coexisting<br />
liquid and vapor phases within the two-phase<br />
region is described below.<br />
Determination of Inclusion Compos ition<br />
Before one can interpret microthermo -<br />
metric data obtained from <strong>fluid</strong> <strong>inclusions</strong>, the<br />
composition of the <strong>inclusions</strong> must be known so<br />
that PVTX data for the appropriate chemical<br />
system may be used. Compositions of <strong>fluid</strong><br />
<strong>inclusions</strong> represented by the H 2 O-NaCl system<br />
are easily determined from temperatures of phase<br />
changes during microthermometric analysis.<br />
Figure 4-2 is a T-X projection of the H 2 O-NaCl<br />
system showing the phases that are stable at<br />
various temperature-composition conditions. Note<br />
that vapor is present and in equilibrium everywhere<br />
on the diagram.<br />
For salinities
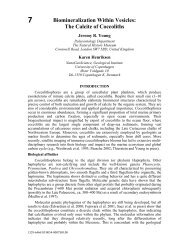
FIG.4-3. Phase behavior of an H 2 O-NaCl <strong>fluid</strong> inclusion with a salinity of 10 wt.% during heating from low<br />
temperature. At -46°C the inclusion contains a glassy solid that devitrifies at the eutectic temperature<br />
(-21.2°C) to produce a fine-grained mixture of hydrohalite and ice. With slight heating above the eutectic<br />
temperature the hydrohalite disappears and the ice re-crystallizes to form several large crystals. With<br />
continued heating, the ice crystals gradually dissolve, leaving a single small crystal at -7°C, which dissolves<br />
completely at -6.6°C.<br />
TABLE 4-1.<br />
Salinities (wt.%) corresponding to measured freezing point depressions (degrees<br />
Celsius) calculated according to Bodnar (1993)<br />
FPD .0 .1 .2 .3 .4 .5 .6 .7 .8 .9<br />
0. 0.0 0.2 0.4 0.5 0.7 0.9 1.1 1.2 1.4 1.6<br />
1. 1.7 1.9 2.1 2.2 2.4 2.6 2.7 2.9 3.1 3.2<br />
2. 3.4 3.6 3.7 3.9 4.0 4.2 4.3 4.5 4.7 4.8<br />
3. 5.0 5.1 5.3 5.4 5.6 5.7 5.9 6.0 6.2 6.3<br />
4. 6.5 6.6 6.7 6.9 7.0 7.2 7.3 7.5 7.6 7.7<br />
5. 7.9 8.0 8.1 8.3 8.4 8.6 8.7 8.8 9.0 9.1<br />
6. 9.2 9.3 9.5 9.6 9.7 9.9 10.0 10.1 10.2 10.4<br />
7. 10.5 10 6 10.7 10.9 11.0 11.1 11.2 11.3 11.5 11.6<br />
8. 11.7 11.8 11.9 12.0 12.2 12.3 12.4 12.5 12.6 12.7<br />
9. 12.9 13.0 13.1 13.2 13.3 13.4 13.5 13.6 13.7 13.8<br />
10. 13.9 14.0 14.2 14.3 14.4 14.5 14.6 14.7 14.8 14.9<br />
11. 15.0 15.1 15.2 15.3 15.4 15.5 15.6 15.7 15.8 15.9<br />
12. 16.0 16.1 16.2 16.2 16.3 16.4 16.5 16.6 16.7 16.8<br />
13. 16.9 17.0 17.1 17.2 17.3 17.3 17.4 17.5 17.6 17.7<br />
14. 17.8 17.9 18.0 18.0 18.1 18.2 18.3 18.4 18.5 18.6<br />
15. 18.6 18.7 18.8 18.9 19.0 19.1 19.1 19.2 19.3 19.4<br />
16. 19.5 19.5 19.6 19.7 19.8 19.8 19.9 20.0 20.1 20.2<br />
17. 20.2 20.3 20.4 20.5 20.5 20.6 20.7 20.8 20.8 20.9<br />
18. 21.0 21.0 21.1 21.2 21.3 21.3 21.4 21.5 21.5 21.6<br />
19. 21.7 21.8 21.8 21.9 22.0 22.0 22.1 22.2 22.2 22.3<br />
20. 22.4 22.4 22.5 22.6 22.7 22.7 22.8 22.9 22.9 23.0<br />
21. 23.1 23.1 23.2<br />
84
FIG.4-4. Vapor-saturated phase relations in the NaCl- H 2 O system at low temperatures constructed from data<br />
presented in Hall et al. (1988), Sterner et al. (1988) and Bodnar et al. (1989). I = ice; L = liquid; HH =<br />
hydrohalite; H = halite; P = peritectic (0.1°C, 26.3 wt.% NaCl); E = eutectic (-21.2°C, 23.2 wt.% NaCl).<br />
relating the freezing-point depression to salinity<br />
according to:<br />
Salinity (wt.%) = 0.00 + 1.78 - 0.0442 2<br />
+ 0.000557 3 (1)<br />
where is the freezing point depression (FPD) in<br />
degrees Celsius [Note that FPD is simply the<br />
negative of the freezing temperature. Thus, a<br />
freezing temperature of -10°C corresponds to an<br />
FPD of 10 degrees Celsius]. Equation (1)<br />
reproduces the original experimental data of Hall et<br />
al. (1988) to better than ±0.05 wt.% NaCl at all<br />
temperatures from 0.0°C to -21.2°C, the eutectic<br />
temperature for H 2 O-NaCl. Table 4-1 lists the<br />
salinity as a function of freezing-point depression<br />
(FPD) in 0.1 degree Celsius increments for compositions<br />
ranging from pure water to the eutectic<br />
composition, calculated using equation (1).<br />
While this chapter does not consider the<br />
practical aspects of <strong>fluid</strong> inclusion microthermo -<br />
metry, it is worth noting for the beginning<br />
inclusionist that it is not always easy (or possible)<br />
to determine the eutectic temperature or the final<br />
ice-melting temperature accurately. Often, the<br />
formation of ice during cooling cannot be<br />
observed, and little or no difference in appearance<br />
is seen during heating to determine eutectic and<br />
final ice melting, especially for small or thin<br />
(tabular) <strong>inclusions</strong>. For a detailed discussion of<br />
techniques for studying such <strong>inclusions</strong>, the<br />
reader is referred to Goldstein & Reynolds (1994;<br />
their Chapter 7) and Wilson et al. (2003).<br />
Inclusions having salinities between the<br />
eutectic composition (23.2 wt.%) and the peritectic<br />
composition (26.3 wt.%) also freeze to produce a<br />
mixture of ice and hydrohalite when cooled to low<br />
temperatures. However, when these <strong>inclusions</strong><br />
are heated to the eutectic temperature the phase<br />
that is completely consumed (melts) is the ice,<br />
leaving hydrohalite and liquid in the inclusion.<br />
With further heating the hydrohalite dissociates<br />
and disappears at some temperature between the<br />
eutectic (-21.2°C) and the peritectic (0.1°C)<br />
temperatures (Fig. 4-4). Hydrohalite does not<br />
easily recrystallize during heating from the<br />
eutectic and remains as many small crystals, unlike<br />
ice, which normally recrystallizes to form a few<br />
large crystals (see Fig. 4-3). The salinity of an<br />
inclusion in which hydrohalite is the last solid to<br />
dissolve is determined from the known relationship<br />
between salinity and hydrohalite dissociation<br />
temperature as presented by Sterner et al. (1988)<br />
and Bodnar et al. (1989). It should be noted that<br />
hydrohalite dissociation can be very sluggish<br />
compared to ice melting and hydrohalite has been<br />
known to persist metastably for several minutes to<br />
hours at temperatures above 0.1°C (Roedder,<br />
1984). Inclusions with salinities between the<br />
85
eutectic and peritectic compositions are rarely<br />
reported in the literature. This may reflect the<br />
failure to recognize hydrohalite as the last phase<br />
to melt in the inclusion; many reports of "icemelting"<br />
may in fact be hydrohalite dissociation.<br />
A slow response in the rate of melting of the solid<br />
during heating of a frozen inclusion is an<br />
indication that the phase being monitored is<br />
hydrohalite rather than ice.<br />
Inclusions with salinities greater than the<br />
peritectic composition (26.3 wt.% NaCl) should<br />
show halite as the last solid phase to disappear<br />
during heating from low temperatures (Fig. 4-2). In<br />
practice, <strong>inclusions</strong> with salinities less than 30-35<br />
wt.% NaCl often fail to nucleate a halite crystal,<br />
even during repeated thermal cycling at<br />
temperatures below 0°C. For this reason, there are<br />
relatively few reported salinities in the range 25-35<br />
wt.% in the literature.<br />
While freezing data for pure H 2 O-NaCl<br />
<strong>inclusions</strong> that contain halite cannot be used to<br />
determine the salinity, most (all) natural<br />
<strong>inclusions</strong> do not contain pure H 2 O-NaCl. As<br />
such, freezing of natural halite-bearing <strong>inclusions</strong><br />
can provide valuable information concerning the<br />
chemical system that should be used to interpret<br />
the microthermometric data obtained from the<br />
<strong>inclusions</strong>. When halite-bearing <strong>inclusions</strong> are<br />
cooled for the first time, generally all of the halite<br />
does not react with the solution to produce<br />
hydrohalite, and it is necessary to warm the<br />
inclusion to a temperature where the reaction<br />
proceeds. After all the halite disappears, the<br />
inclusion can be cooled a second time to produce<br />
the equilibrium assemblage. A more detailed<br />
discussion of the behavior of halite-bearing<br />
<strong>inclusions</strong> during freezing, and application of<br />
these data to determine <strong>fluid</strong> compositions, is<br />
given in Samson & Sinclair (1992).<br />
The solubility of halite under vaporsaturated<br />
conditions has been determined by<br />
Sterner et al. (1988), and the data have been fitted<br />
to an equation describing salinity as a function of<br />
halite dissolution temperature according to:<br />
Salinity (wt.%) = 26.242 + 0.4928 + 1.42 2<br />
- 0.223 3 + 0.04129 <br />
4 + 6.295 x 10<br />
-3 <br />
5<br />
- 1.967 x 10 -3 6 + 1.1112 x 10 -4 <br />
7<br />
(2)<br />
where = T(°C)/100. Equation (2) accurately<br />
represents the solubility of NaCl in water from the<br />
peritectic temperature (0.1°C) to the NaCl triple<br />
point (801°C). Salinities calculated using Equation<br />
(2) are shown on Figure 4-5 and listed in Table 4-2.<br />
During heating of a halite-bearing <strong>fluid</strong><br />
inclusion, it is possible for the halite crystal to<br />
disappear at a temperature higher than, lower than,<br />
or at the same temperature as the vapor<br />
bubble (Fig. 4-6). Equation (2) is theoretically<br />
FIG.4-5. Solubility of NaCl in water under vaporsaturated<br />
conditions calculated using the FORT -<br />
RAN program SALTY (Bodnar et al., 1989)<br />
TABLE 4-2. Halite solubility (in wt.%) as a function of temperature [Tm(halite)] calculated using equation (2).<br />
Tm (halite) 0 10 20 30 40 50 60 70 80 90<br />
0 26.2 26.3 26.4 26.5 26.7 26.8 27.0 27.2 27.4 27.7<br />
100 28.0 28.3 28.6 28.9 29.3 29.7 30.1 30.5 30.9 31.4<br />
200 31.9 32.4 32.9 33.5 34.1 34.7 35.3 36.0 36.7 37.4<br />
300 38.2 38.9 39.8 40.6 41.5 42.4 43.3 44.3 45.3 46.4<br />
400 47.4 48.5 49.7 50.8 52.0 53.3 54.5 55.8 57.1 58.4<br />
500 59.8 61.1 62.5 63.9 65.3 66.8 68.2 69.6 71.1 72.5<br />
600 74.0 75.4 76.9 78.3 79.7 81.1 82.5 83.9 85.3 86.6<br />
700 87.9 89.2 90.5 91.8 93.0 94.2 95.4 96.6 97.7 98.9<br />
800 100.<br />
86
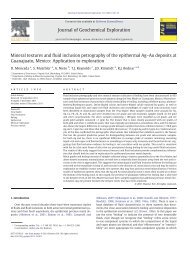
FIG.4-6. Series of photomicrographs depicting the<br />
three different modes of homogenization possible<br />
for halite-bearing <strong>fluid</strong> <strong>inclusions</strong>. All <strong>inclusions</strong><br />
have a salinity of 40 wt.% NaCl, and the scale bar<br />
represents 25 micrometers for each inclusion.<br />
(from Bodnar, 1994).<br />
FIG.4-7. Pressure-temperature diagram showing<br />
the three different modes of homogenization<br />
possible for a 40 wt.% NaCl <strong>fluid</strong> inclusion and<br />
the P-T fields in which the <strong>inclusions</strong> were<br />
trapped. The halite in inclusion "A" will dissolve<br />
at about 323°C, followed by bubble<br />
disappearance at 500°C. Inclusion "C" will<br />
display vapor bubble disappearance at 200°C<br />
followed by halite dissolution at ~300°C. Both<br />
the vapor bubble and halite in inclusion "B" will<br />
disappear at 323°C. (modified from Bodnar, 1994)<br />
valid only for <strong>fluid</strong> <strong>inclusions</strong> in which the halite<br />
and vapor bubble disappear at the same<br />
temperature, i.e., homogenization occurs along the<br />
three phase liquid + vapor + halite curve (Fig. 4-1).<br />
However, equation (2) can be used to approximate<br />
the salinity within a few percent for <strong>inclusions</strong> in<br />
which liquid -vapor homogenization is higher than<br />
the halite dissolution temperature by several tens<br />
of degrees (see Chou, 1987). If the liquid-vapor<br />
homogenization temperature is less than the halite<br />
dissolution temperature, then trapping must have<br />
occurred at a P-T condition such that the<br />
inclusion isochore intersects the halite liquidus<br />
before intersecting the liquid-vapor curve during<br />
cooling (Isochore "C", Fig. 4-7).<br />
During heating, halite dissolution, and<br />
therefore total homogenization, occurs along the<br />
halite liquidus (Bodnar, 1994). For <strong>inclusions</strong> that<br />
homogenize along the liquidus by halite<br />
dissolution, equation (2) ma y over or<br />
underestimate the salinity in the inclusion,<br />
depending on the slope of the liquidus in P-T<br />
space, which varies as a function of salinity<br />
according to (Bodnar, 1994):<br />
dT/dP (°C/kbar) =<br />
–38.38 + 0.90 S – 0.0029 S 2 (3)<br />
where "S" is the inclusion salinity in weight<br />
percent NaCl.<br />
The position of the 50 wt.% NaCl<br />
liquidus is independent of pressure (i.e., dT/dP =<br />
0), and an inclusion containing ~50 wt.% NaCl will<br />
show the same halite dissolution temperature<br />
(423ºC) regardless of whether dissolution occurs<br />
along the 3-phase curve or along the liquidus at<br />
higher pressures (Fig. 4-8). For lower salinities,<br />
the slope of the liquidus (dT/dP) is negative,<br />
meaning that the actual salinity in the inclusion is<br />
higher than that predicted by equation (2). Conversely,<br />
the slope of the liquidus is positive for<br />
salinities >50 wt.% NaCl, and the actual salinity in<br />
the inclusion will be lower than that predicted by<br />
equation (2). The magnitude of the error in both<br />
cases depends upon the pressure in the inclusion<br />
at halite dissolution, as well as on the salinity.<br />
However, if it is assumed that the pressure will<br />
generally not be higher than about 2 kbars<br />
(otherwise the inclusion would decrepitate; see<br />
Bodnar et al., 1989), possible errors range from an<br />
underestimate of the salinity by ~1.3 wt.% for a<br />
halite dissolution temperature of 200°C, to an<br />
overestimate of the salinity by ~2.6 wt.% for a<br />
halite dissolution temperature of 600°C.<br />
87
FIG.4-8. Halite liquidi in the NaCl-H 2 O system.<br />
Along each liquidus line a liquid with the salinity<br />
indicated (in wt.% NaCl) is in equilibrium with<br />
halite. L+V+H refers to the vapor-saturated halite<br />
solubility curve. (modified after Bodnar, 1994).<br />
Vapor Pressures of H 2 O-NaCl Solutions<br />
One of the goals of most <strong>fluid</strong> inclusion<br />
studies is to determine the temperature and<br />
pressure of formation of the <strong>inclusions</strong> and, by<br />
inference, the host phase formation conditions.<br />
The first step in this process is to measure the<br />
homogenization temperature of the <strong>inclusions</strong>. If<br />
there is no evidence that the <strong>fluid</strong> <strong>inclusions</strong> have<br />
reequilibrated following entrapment (see Bodnar,<br />
2003), and if there is evidence that the <strong>inclusions</strong><br />
were trapped in a boiling or immiscible <strong>fluid</strong><br />
system, then the homogenization temperature is<br />
equal to the trapping temp erature. In this case,<br />
the trapping pressure is equal to the vapor<br />
pressure in the inclusion at the temperature of<br />
homogenization. Atkinson (2002) recently<br />
developed an empirical equation describing the<br />
vapor pressure of H 2 O-NaCl solutions as a<br />
function of salinity and temperature. Figure 4-9<br />
shows vapor pressure curves calculated from the<br />
equations presented by Atkinson (2002).<br />
Isopleths (lines of constant composition) shown<br />
on Figure 4-9 and labeled in wt.% NaCl represent<br />
the liquid-limb or bubble-curve (see Diamond,<br />
2003, his Fig. 3-4) for an H 2 O-NaCl solution having<br />
the composition indicated on each curve. Thus,<br />
the isopleth labeled "60" represents the bubble<br />
curve for a 60 wt.% NaCl composition. Along this<br />
line a liquid with a salinity of 60 wt.% NaCl<br />
coexists with a vapor phase of lower salinity. The<br />
salinity of the vapor phase varies along the line<br />
according to PTX relations in the H 2 O-NaCl<br />
system (Sourirajan & Kennedy 1962, Bodnar et al.<br />
1985a). [At the critical point the salinities of the<br />
liquid phase and the vapor phase would be equal.]<br />
The homogenization conditions (the temperature<br />
and the pressure in the inclusion at the moment of<br />
homogenization) of any H 2 O-NaCl <strong>fluid</strong> inclusion<br />
FIG.4-9. Vapor pressure curves (labeled in wt.% NaCl) for H 2 O-NaCl calculated using equations in Atkinson<br />
(2002). Numbers (0, 10, 20, 30 40) along the locus of critical points represent the critical points for solutions<br />
having the salinity listed (wt.% NaCl).<br />
88
with a composition of 60 wt.% NaCl that<br />
homogenizes to the liquid phase must lie along the<br />
60 wt.% isopleth.<br />
If <strong>fluid</strong> <strong>inclusions</strong> are trapped in the one<br />
phase <strong>fluid</strong> field, then the homogenization<br />
temperature (along the isopleth corresponding to<br />
the inclusion composition) represents the<br />
minimum temperature of formation. In this case, a<br />
pressure correction must be added to the<br />
measured homogenization temperature to obtain<br />
the trapping temperature. The trapping temperature<br />
must lie along the line of constant density<br />
(or volume) that originates on the liquid-vapor<br />
curve and extends into the one-phase field (Figs.<br />
4-10, 4-11). The first step in estimating the<br />
trapping temperature is to determine the starting<br />
point for the constant density line, or isochore, on<br />
the bubble curve. This point corresponds to the<br />
measured temperature of homogenization and the<br />
bubble curve pressure at the homogenization<br />
temperature.<br />
H 2 O-NaCl Isochores<br />
Once the composition, homogenization<br />
temperature and vapor pressure in the inclusion at<br />
homogenization have been determined, it is<br />
necessary to determine the slope of the isochore<br />
along which the inclusion was trapped in order to<br />
estimate a pressure correction. The relationship<br />
between trapping temperature and pressure,<br />
salinity, and homogenization temperature for H 2 O-<br />
NaCl <strong>inclusions</strong> has been determined using the<br />
synthetic <strong>fluid</strong> inclusion technique (Bodnar &<br />
Vityk 1994). The results are represented by an<br />
equation of the form:<br />
dP/dT (bar/°C) = a S + b S * Th + c S * Th 2 (4)<br />
where dP/dT is the slope of the iso-Th line<br />
(˜ isochore), Th is the homogenization<br />
temperature in degrees Celsius, and "a S ", "b S ", and<br />
"c S " are salinity-dependent fitting parameters<br />
defined by:<br />
a S = 18.28 + 1.4413 S + 0.0047241 S 2<br />
– 0.0024213 S 3 + 0.000038064 S 4 (5)<br />
b S = 0.019041 – 1.5268 x 10 -2 S<br />
+ 5.6012 x 10 -4 S 2 – 4.2329 x 10 -6 S<br />
3<br />
– 3.0354 x 10 -8 S<br />
4<br />
(6)<br />
c S = –1.5988 x 10 -4 + 3.6892 x 10 -5 S<br />
– 1.9473 x 10 -6 S 2 + 4.1674 x 10 -8 S 3<br />
– 3.3008 x 10 -10 S<br />
4<br />
(7)<br />
Equation (4) predicts the slope of iso-Th lines for<br />
H 2 O-NaCl solutions having salinities from 0-40<br />
wt.% NaCl, and homogenization temperatures from<br />
50 to 700°C or the critical temperature, whichever<br />
is lower. Slopes of iso-Th lines predicted by<br />
equation (4) are valid to the upper limits of the<br />
experimental data, which is 6 kbars. Iso-Th lines<br />
calculated from equation (4) have been used to<br />
construct "isochore" diagrams for H 2O-NaCl<br />
<strong>inclusions</strong> and are shown on Figures 4-10 and 4-<br />
11. Densities along these iso-Th lines can be<br />
approximated using data for PVT properties of<br />
H 2 O-NaCl solutions along the liquid-vapor curve<br />
(cf. Bodnar 1983).<br />
PVT data required to extend isochores<br />
beyond the range indicated in Figs. 4-10 and 4-11<br />
do not presently exist. Some workers (cf. Anderko<br />
& Pitzer 1993) have developed theoretical<br />
equations of state to predict PVT properties of<br />
H 2 O-NaCl to P-T conditions beyond those shown<br />
here. Zhang & Frantz (1987) determined slopes of<br />
isochores for a range of compositions in the NaCl-<br />
KCl-CaCl 2 -H 2 O from 300° to 700°C and 1-3 kbars.<br />
Bakker & Brown (2003) summarize the various<br />
numerical models that are available to determine<br />
PVTX properties of inclusion <strong>fluid</strong>s.<br />
Interpretation of Inclusions Trapped in a Two-<br />
Phase (Immiscibility) Field<br />
Fluid <strong>inclusions</strong> having compositions<br />
approximated by H 2 O-NaCl and trapped in a<br />
boiling or immiscible <strong>fluid</strong> system are common in<br />
many geologic environments, including terrestrial<br />
geothermal systems and their fossil equivalents,<br />
the epithermal precious-metals deposits (Bodnar<br />
et al. 1985b), and magmatic-hydrothermal ore<br />
deposits associated with silicic magmas (Bodnar<br />
1992, 1995, Beane & Bodnar 1995, Roedder &<br />
Bodnar 1997). Inclusions trapped under<br />
conditions of immiscibility are valuable P-T<br />
indicators because the homogenization temperature<br />
equals the formation temperature (Roedder<br />
& Bodnar 1980), eliminating the need for a<br />
pressure correction to obtain the trapping temperature.<br />
The complete range of P-T conditions over<br />
which immiscibility may occur in the H 2 O-NaCl<br />
system is unknown, although experimental<br />
(Bodnar et al. 1985a) and theoretical (Pitzer 1984)<br />
studies indicate that the two-phase region extends<br />
to at least 2 kbars and temperatures in excess of<br />
3,000°C (Fig 4-1). For any composition, the two -<br />
phase region extends to temperatures at least as<br />
high as the critical temperature. Knight &<br />
89
FIG.4-10. Iso-Th lines for NaCl-H 2O <strong>inclusions</strong> having salinities of 0, 5, 10, 15, 20 and 25 wt.% NaCl calculated<br />
using data from Bodnar & Vityk (1994).<br />
90
FIG.4-11. Liquidi and iso-Th lines for NaCl-H 2 O<br />
<strong>inclusions</strong> having salinities of 30 and 40 wt.%<br />
NaCl. Constructed from data in Bodnar (1994),<br />
Cline & Bodnar (1994) and Bodnar & Vityk (1994).<br />
Bodnar (1989) determined the critical properties for<br />
H 2 O-NaCl solutions having salinities =30 wt.%<br />
NaCl, and described the relationship between<br />
salinity and the critical temperature (Tc) as:<br />
T C (ºC) = 374.1 + 8.800 f + 0.1771 f 2<br />
– 0.0211 f 3 + 7.334 x 10 4 f 4 (8)<br />
where f is the salinity in weight percent NaCl.<br />
These data indicate two -phase behavior up to at<br />
least 800°C and 1.5 kbars for a 30 wt.% NaCl<br />
solution. This range includes the P-T conditions<br />
of many crustal magmatic-hydrothermal systems.<br />
In the H 2 O-NaCl system, as in any twocomponent<br />
system, the comp ositions of the<br />
coexisting phases at any P-T condition are defined<br />
by the isopleths that intersect at that point on a P-<br />
T diagram. Ideally, the technique that would be<br />
used to define the P-T formation conditions for<br />
H 2 O-NaCl <strong>inclusions</strong> trapped in the two-phase<br />
field would be to determine the salinities of the<br />
coexisting vapor-rich and liquid-rich <strong>inclusions</strong>.<br />
Then, these data would be referred to the<br />
appropriate phase diagram for H 2 O-NaCl to<br />
determine the unique P-T condition at which these<br />
two compositions may coexist. For example,<br />
consider a 20 wt.% NaCl composition at some P-T<br />
condition within the two-phase, liquid + vapor<br />
field, as shown by the star in the inset in Figure<br />
4-1. Assuming that the P-T conditions are 700°C<br />
and 1 kbar, the two phases that are in equilibrium<br />
are a 4 wt.% NaCl vapor and a 49 wt.% NaCl liquid<br />
(Bodnar et al. 1985a). At room temperature,<br />
<strong>inclusions</strong> that trapped the vapor phase will be<br />
vapor-rich with a small rim of low-salinity (4 wt.%)<br />
liquid, and <strong>inclusions</strong> that trapped the liquid phase<br />
will contain a halite crystal and a smaller vapor<br />
bubble (Fig. 4-12). Assuming that <strong>inclusions</strong><br />
trapped only the vapor or only the liquid phase,<br />
both the vapor-rich and the halite-bearing<br />
<strong>inclusions</strong> would homogenize at 700°C, which is<br />
equal to the trapping temperature.<br />
Unfortunately, this "ideal" approach<br />
generally cannot be used to determine the P-T<br />
formation conditions for <strong>inclusions</strong> trapped in the<br />
two-phase field, for several reasons. First, it is<br />
well known that the vapor-rich <strong>inclusions</strong> almost<br />
always trap some small amount of liquid along<br />
with the vapor phase (Bodnar et al. 1985a,b).<br />
Therefore, the salinity determined from the<br />
freezing-point depression of the liquid in the<br />
vapor-rich inclusion does not represent the<br />
composition of the vapor phas e present at<br />
trapping but, rather, some salinity intermediate<br />
between the vapor and liquid compositions.<br />
However, even if <strong>inclusions</strong> which trapped only<br />
vapor could be identified and their salinities<br />
determined, data for the P-T locations of low<br />
salinity is opleths beyond the critical point are<br />
scarce and not of sufficient accuracy to<br />
adequately constrain the P-T formation conditions<br />
(Sourirajan & Kennedy 1962, Bodnar et al. 1985a).<br />
Finally, the homogenization temperatures of the<br />
vapor-rich <strong>inclusions</strong> generally cannot be<br />
determined with<br />
91
FIG.4-12. P-X diagram for the system H 2 O-NaCl showing compositions of coexisting phases in the liquid +<br />
vapor region as a function of pressure at 700°C. Any pressure-composition combination under the 700°C<br />
solvus is in the two-phase liquid + vapor field where a higher salinity liquid is in equilibrium with a lower<br />
salinity vapor phase. For example, a <strong>fluid</strong> with a bulk composition of 20 wt.% NaCl at 700°C and 1 kbar is in<br />
the two-phase field, and would split into a liquid with a salinity of 49 wt.% NaCl and a vapor with a salinity of<br />
4 wt.% NaCl. At room temperature the <strong>inclusions</strong> would appear as shown schematically and by the<br />
photographs of <strong>fluid</strong> <strong>inclusions</strong> trapped in the two-phase field.<br />
sufficient accuracy to confirm that they were<br />
trapped at the same P-T condition as the<br />
coexisting halite-bearing <strong>inclusions</strong> owing to the<br />
inability to visually estimate when the vapor phase<br />
fills the inclusion (Bodnar et al. 1985a,b, Sterner<br />
1992).<br />
The procedure that is recommended to<br />
define formation conditions for <strong>fluid</strong> <strong>inclusions</strong><br />
trapped in the two-phase (liquid + vapor) field<br />
includes a combination of petrographic and PVTX<br />
techniques. If immiscibility is suggested, based<br />
on careful observation of a Fluid Inclusion<br />
Assemblage (FIA) (Goldstein & Reynolds 1994)<br />
along growth zones and/or healed fractures, the<br />
salinities and homogenization temperatures of the<br />
liquid-rich (halite-bearing) <strong>inclusions</strong> are<br />
determined. It should be noted here that if there is<br />
petrographic evidence to suggest immiscibility,<br />
and the halite-bearing, liquid-rich <strong>inclusions</strong><br />
homogenize by halite dissolution (at a temperature<br />
higher than the vapor-bubble disappearance<br />
temperature), then the halite-bearing and vaporrich<br />
<strong>inclusions</strong> can not represent an immis cible<br />
pair. Phase equilibrium constraints do not permit<br />
<strong>inclusions</strong> that homogenize by halite dissolution<br />
(i.e., those trapped in Field "C", Fig. 4-7) to be<br />
trapped in equilibrium with a vapor phase (see<br />
Roedder & Bodnar 1980, Bodnar 1994), except<br />
along the three-phase (liquid + vapor + halite)<br />
curve (L+V+H, Fig. 4-8). However, even in this<br />
case, halite dissolution can only occur at a<br />
temperature higher than vapor disappearance if<br />
the inclusion traps halite along with the liquid<br />
phase. Assuming that the halite-bearing inclusion<br />
trapped the liquid phase (and only the liquid<br />
phase) in an immiscible <strong>fluid</strong> system, the<br />
composition of the inclusion is determined from<br />
the halite dissolution temperature, and the<br />
trapping temperature is equal to the<br />
homogenization temperature.<br />
Once trapping in the two-phase field is<br />
confirmed from petrographic observations and the<br />
salinity and homogenization temperature of the<br />
liquid-rich (usually halite-bearing) <strong>inclusions</strong> have<br />
been determined, these data are referred to<br />
bubble-point or vapor-pressure curves for H 2 O-<br />
NaCl solutions (Fig. 4-9). The intersection of the<br />
vapor pressure isopleth corresponding to the<br />
92
FIG.4-13. Recommended technique for determining the trapping conditions for a 40 wt.% NaCl <strong>fluid</strong> inclusion<br />
trapped in the two -phase (liquid + vapor) field. See text for explanation.<br />
inclusion composition (i.e., the line labeled "40"<br />
on Fig. 4-13) with the measured homogenization<br />
temperature [Th(L-V)] in P-T space defines the<br />
pressure (P f ) at the time of trapping. Thus, a halitebearing<br />
inclusion with a halite dissolution<br />
temperature of ~323°C, corresponding to a salinity<br />
of 40 wt.% NaCl, and a homogenization<br />
temperature of 500°C would have been trapped at<br />
about 480 bars according to Figure 13. The vapor<br />
phase that is in equilibrium with a 40 wt.% NaCl<br />
liquid at 500°C and 500 bars has a salinity of about<br />
1 wt.% NaCl (Bodnar et al. 1985a). Thus, the icemelting<br />
temperature of the vapor-rich <strong>inclusions</strong><br />
that coexist with the halite-bearing <strong>inclusions</strong><br />
should be -1.7°C, or lower if the <strong>inclusions</strong><br />
trapped some liquid along with the vapor.<br />
Consistent ice-melting temperatures higher than -<br />
1.7°C might indicate that the vapor-rich and halitebearing<br />
<strong>inclusions</strong> are not coeval, assuming that<br />
the experimental data for compositions of<br />
coexisting phases at this temperature and pressure<br />
are correct and that the inclusion compositions are<br />
adequately described using PVTX data for the<br />
system H 2 O-NaCl.<br />
OTHER AQUEOUS SYSTEMS<br />
H 2 O-NaCl-KCl<br />
In magmatic -hydrothermal systems<br />
associated with granitic magmas, the dominant<br />
cations in solution are usually Na and K (Burnham<br />
1979, 1997). In this case, PVTX data for the H 2 O-<br />
NaCl-KCl system are most appropriate for<br />
interpreting <strong>fluid</strong> inclusion microthermometric<br />
data. Phase relations in the low temperature (icestable)<br />
region of the ternary have been determined<br />
by Hall et al. (1988), and those in the high<br />
temperature (sylvite ± halite stable) region have<br />
been determined by Sterner et al. (1988). A Fortran<br />
model describing phase equilibria in the entire<br />
ternary system was developed by Bodnar et al.<br />
(1989). If <strong>fluid</strong> <strong>inclusions</strong> contain two phases<br />
(liquid and vapor) at room temperature, one would<br />
generally not be able to determine if the <strong>inclusions</strong><br />
contain both NaCl and KCl based on<br />
microthermo metric analysis. The eutectic<br />
temperature for the system H 2 O-NaCl is -21.2°C,<br />
whereas the eutectic for the ternary H 2 O-NaCl-KCl<br />
is -22.9°C (Fig. 4-14). Owing to the difficulty in<br />
recognizing first<br />
93
FIG.4-14. Isotherms in the vapor-saturated ice field in the H 2 O-NaCl-KCl system (modified after Hall et al.<br />
1988).<br />
melting during heating of frozen <strong>inclusions</strong>, it is<br />
unlikely that one would be able to distinguish<br />
between <strong>inclusions</strong> that begin to melt at -21.2° and<br />
those that start to melt at -22.9°C.<br />
The system H 2 O-NaCl-KCl is most often<br />
used to interpret microthermometric results from<br />
<strong>fluid</strong> <strong>inclusions</strong> that contain both halite and<br />
sylvite daughter minerals. Such <strong>inclusions</strong> are<br />
common in many granitic rocks, and are nearly<br />
ubiquitous in porphyry copper deposits (Bodnar<br />
1992, 1995, Bodnar & Beane 1980, Roedder &<br />
Bodnar 1997). In most cases, the composition of<br />
<strong>inclusions</strong> containing both halite and sylvite is<br />
such that the sylvite daughter mineral dissolves<br />
first, followed by the halite. In any case, halite and<br />
sylvite are easily distinguished based on the<br />
behavior during heating from room temperature to<br />
150°C. At temperatures between the ternary<br />
eutectic (-22.9°C) and approximately 150°C, NaCl<br />
shows retrograde solubility in the presence of a<br />
KCl-saturated solution, whereas KCl solubility in<br />
an NaCl-saturated solution increases with temperature<br />
over this same temperature range. Thus,<br />
asan inclusion containing halite and sylvite is<br />
heated from room temperature, the sylvite phase<br />
dissolves noticeably while the halite phase grows<br />
as NaCl precipitates. Halite precipitation during<br />
heating to 150°C is most often manifest as a<br />
noticeable sharpening of the corners of the halite<br />
crystal (compare the appearance of halite at 25°C<br />
and 100°C; Fig. 4-15).<br />
FIG.4-15. Behavior during heating of <strong>fluid</strong> <strong>inclusions</strong> containing sylvite (S) and halite (H) daughter minerals.<br />
(modified from Sterner & Bodnar 1984).<br />
94
The composition of halite + sylvitebearing<br />
<strong>inclusions</strong> is determined from the<br />
temperatures of dissolution of the two phases. As<br />
long as both phases are present, the composition<br />
of the liquid phase is defined by the halite-sylvite<br />
cotectic (Fig. 4-16). After dissolution of one of the<br />
phases, the liquid composition moves toward<br />
either the NaCl corner (sylvite dissolves first) or<br />
the KCl corner (halite dissolves first). The bulk<br />
composition of the inclusion is defined by the<br />
temperature of dissolution of the last phase, using<br />
PTX data for the ternary system (Fig. 4-16).<br />
H 2 O-NaCl-CaCl 2<br />
Fluid <strong>inclusions</strong> approximated by the<br />
H 2 O-NaCl-CaCl 2 system are common in many<br />
environments, including sedimentary basins and<br />
medium to high-grade metamorphic rocks. Fluid<br />
<strong>inclusions</strong> containing H 2 O-NaCl-CaCl 2 are most<br />
often identified based on low first melting<br />
temperatures observed during freezing studies.<br />
The eutectic in this ternary system is ˜ -52°C (Fig.<br />
4-17), usually resulting in recognizable melting at<br />
temperatures in the range -40° to -50°C. Many<br />
workers report "eutectic events" at temperatures<br />
well below the H 2O-NaCl (-21.2°C) and H 2O-NaCl-<br />
KCl (-22.9°C) eutectics, and these are usually<br />
interpreted to indicate the presence of calcium or<br />
other divalent cations in solution. In some cases,<br />
these low temperature events do not represent<br />
eutectic melting but, rather, represent metastable<br />
(or stable) crystallization of the inclusion<br />
contents. For a more detailed discussion of low<br />
temperature behavior in complex aqueous<br />
<strong>inclusions</strong>, the reader is referred to Davis et al.<br />
(1990) and Samson & Walker (2000).<br />
Most two-phase (liquid + vapor)<br />
<strong>inclusions</strong> in the H 2O-NaCl-CaCl 2 system freeze to<br />
form a mixture of ice, hydrohalite and antarcticite<br />
(CaCl 2 •6H 2 O). Eutectic melting is first observed at -<br />
52°C during heating (Fig. 4-17). Except for<br />
extremely CaCl 2 -rich compositions, antarcticite will<br />
disappear at the eutectic, leaving a fine-grained<br />
mixture of ice and hydrohalite in the liquid phase.<br />
With continued heating the liquid composition<br />
follows the hydrohalite-ice cotectic (Fig. 4-18)<br />
until the hydrohalite phase completely disappears.<br />
The path then proceeds into the ice field and<br />
moves towards the ice corner with continued<br />
heating. The bulk composition is defined by the<br />
intersection of the melting path with the<br />
appropriate isotherm in the ice-stable field (Fig. 4-<br />
18). For example, if hydrohalite disappears at -25°C<br />
and ice melts at -10°C, the inclusion would have a<br />
composition indicated by the open circle on the -<br />
10°C isotherm on Figure 18. In practice, it is very<br />
difficult to distinguish between ice and<br />
hydrohalite, and to determine the<br />
FIG.4-16. Vapor-saturated solubility relations in the H 2 O-NaCl-KCl system calculated using equations in<br />
Bodnar et al. (1989).<br />
95
FIG.4-17. Vapor-saturated phase equilibria in the H 2 O-NaCl-CaCl 2 system showing isotherms (in degrees<br />
Celsius) of halite solubility and ice-melting. (modified after Vanko et al. 1988).<br />
temperature at which the hydrohalite disappears,<br />
during the initial heating sequence owing to the<br />
fine-grained nature of these phases. Haynes<br />
(1985) described a technique involving sequential<br />
freezing of H 2 O-NaCl-CaCl 2 <strong>inclusions</strong> to coarsen<br />
the phases, making it easier to identify the phases<br />
FIG.4-18. Isotherms (in degrees Celsius) of the ice<br />
liquidus at 1 atmosphere pressure in the H 2O-<br />
NaCl-CaCl 2 system (modified after Oakes et al.<br />
1990).<br />
and determine the melting temperatures. Samson<br />
& Walker (2000) described a cryogenic Raman<br />
technique that can be used to detect the presence<br />
or absence) of hydrohalite in <strong>fluid</strong> <strong>inclusions</strong><br />
during low-temperature microthermometry.<br />
Fluid <strong>inclusions</strong> approximated by the<br />
H 2 O-NaCl-CaCl 2 system and containing halite<br />
daughter minerals at room temperature have been<br />
reported from many different geologic<br />
environments, including submarine hydrothermal<br />
systems. Ideally, the composition can be<br />
determined by measuring the temperature of<br />
hydrohalite dissolution along the hydrohalitehalite<br />
cotectic, followed by measurement of the<br />
halite dissolution temperature at higher<br />
temperature. However, the temperature at which<br />
the last hydrohalite crystal dissolves is difficult to<br />
determine accurately because the crystals are<br />
often small and melting is extremely sluggish<br />
compared to melting of ice or halite. And, because<br />
the hydrohalite isotherms intersect the<br />
hydrohalite-halite cotectic at a low angle, a small<br />
error in the temperature of hydrohalite dissolution<br />
represents a relatively large error in the Na/Ca<br />
ratio and in the "take off" point into the halite<br />
field. Moreover, as the Na/Ca ratio changes, the<br />
point of intersection with the halite dissolution<br />
isotherm changes, resulting also in an error in the<br />
total salinity of the inclusion (Williams-Jones &<br />
96
Samson 1990). To avoid these problems, Vanko et<br />
al. (1988) and Williams -Jones & Samson (1990)<br />
used the ice-melting temperature and the halite<br />
dissolution temperatures to estimate compositions<br />
of halite-bearing <strong>fluid</strong> <strong>inclusions</strong> in the H 2 O-NaCl-<br />
CaCl 2 system. This approach introduces relatively<br />
little error, as evidenced by comparing known and<br />
calculated compositions of synthetic <strong>fluid</strong><br />
<strong>inclusions</strong> (Vanko et al. 1988). As an example, a<br />
halite-bearing inclusion in which ice melts at -25°C<br />
and halite dissolves at 350°C would have a<br />
composition indicated by the open circle on the<br />
350°C isotherm shown on Figure 4-17.<br />
SUMMARY<br />
Fluid <strong>inclusions</strong> containing aqueous<br />
solutions with no detectable gases are arguably<br />
the most common type of <strong>fluid</strong> inclusion in most<br />
geologic environments. Interpretation of<br />
microthermo metric data from these <strong>inclusions</strong><br />
requires PTX data to estimate the inclusion<br />
composition, and PVT data to determine trapping<br />
conditions. Many aqueous <strong>fluid</strong> <strong>inclusions</strong> are<br />
approximated by the H 2 O-NaCl system. While<br />
more complex aqueous <strong>fluid</strong> compositions are<br />
common in many environments, our ability to<br />
interpret these <strong>inclusions</strong> is hampered by (1) the<br />
difficulty of observing and identifying phase<br />
changes in complex aqueous solutions (especially<br />
in small, natural <strong>inclusions</strong>) and (2) the paucity of<br />
PVTX data to interpret these more complex<br />
compositions.<br />
ACKNOWLEDGEMENTS<br />
Much of the information presented in this<br />
chapter represents studies by former students and<br />
post-doctoral researchers and visitors to the<br />
Fluids Research Laboratory, especially Don Hall,<br />
Charlie Oakes, Mike Sterner and Max Vityk. Phil<br />
Brown, Jean Cline and Iain Samson are thanked for<br />
their comments and suggestions on an earlier<br />
version of this manuscript. The National Science<br />
Foundation, Department of Energy, NASA, and<br />
the American Chemical Society have supported<br />
work in the Fluids Research Laboratory over the<br />
years. NSF Grants EAR-0001168 and EAR-0125918<br />
provided support during preparation of this<br />
manuscript.<br />
REFERENCES<br />
ANDERKO A. & PITZER K.S. (1993): Equation-ofstate<br />
representation of phase equilibria and<br />
volumetric properties of the system NaCl-H 2 O<br />
above 573K. Geochim. Cosmochim. Acta 57,<br />
1657-1680.<br />
ATKINSON, A.B. (2002): A model for the PTX<br />
properties of H 2 O-NaCl. Unpublished M.S.<br />
Thesis, <strong>Virginia</strong> <strong>Tech</strong>, Blacksburg VA 133pp.<br />
BAKKER, R.J. & BROWN, P.E. (2003): Computer<br />
modelling in <strong>fluid</strong> inclusion research. In I.<br />
Samson, A. Anderson, & D. Marshall, eds. Fluid<br />
Inclusions: Analysis and Interpretation.<br />
Mineral. Assoc. Can., Short Course Ser. 32,<br />
175-204.<br />
BEANE, R.E. & BODNAR, R.J. (1995): Hydrothermal<br />
<strong>fluid</strong>s and hydrothermal alteration in<br />
porphyry copper deposits. In Pierce, F.W. and<br />
Bohm, J.G., Porphyry Copper Deposits of the<br />
American Cordillera. Arizona Geological Society<br />
Digest 20, Tucson, AZ p. 83-93.<br />
BODNAR, R.J. (1983): A method of calculating<br />
<strong>fluid</strong> inclusion volumes based on vapor bubble<br />
diameters and P-V-T-X properties of inclusion<br />
<strong>fluid</strong>s. Econ. Geology 78, 535-542.<br />
BODNAR, R.J. (1985): Pressure-volumetemperature-composition<br />
(PVTX) properties of<br />
the system H 2 O-NaCl at elevated temperatures<br />
and pressures. Unpub. Ph. D. Dissertation, The<br />
Pennsylvania State University, University Park,<br />
PA, 183 pp.<br />
BODNAR, R. J. (1992): Can we recognize magmatic<br />
<strong>fluid</strong> <strong>inclusions</strong> in fossil hydrothermal systems<br />
based on room temperature phase relations and<br />
microthermo metric behavior. Geological Survey<br />
of Japan, report No. 279, p. 26-30.<br />
BODNAR, R.J. (1993): Revised equation and table<br />
for determining the freezing point depression of<br />
H 2 O-NaCl solutions. Geochim. Cosmochim.<br />
Acta 57, 683-684.<br />
BODNAR, R.J. (1994): Synthetic <strong>fluid</strong> <strong>inclusions</strong>.<br />
XII. Experimental determination of the liquidus<br />
and isochores for a 40 wt.% H 2 O-NaCl solution.<br />
Geochim. Cosmochim. Acta 58, 1053-63.<br />
BODNAR, R.J. (1995): Fluid inclusion evidence for<br />
a magmatic source for metals in porphyry<br />
copper deposits. In Thompson JFH (ed.)<br />
Magmas, Fluids and Ore Deposits. Mineral<br />
Assoc Canada Short Course 23, pp 39-152.<br />
BODNAR, R.J. (2003): Re-equilibration of <strong>fluid</strong><br />
<strong>inclusions</strong>. In I. Samson, A. Anderson, & D.<br />
Marshall, eds. Fluid Inclusions: Analysis and<br />
97
Interpretation. Mineral. Assoc. Can., Short<br />
Course Ser. 32, 213-230.<br />
BODNAR, R.J. & BEANE, R.E. (1980): Temporal<br />
and spatial variations in hydrothermal <strong>fluid</strong><br />
characteristics during vein filling in preore cover<br />
overlying deeply buried porphyry copper-type<br />
mineralization at Red Mountain, Arizona. Econ.<br />
Geol. 75, 876-893.<br />
BODNAR, R.J. & VITYK, M.O. (1994):<br />
Interpretation of Microthermometric data for<br />
H 2 O-NaCl <strong>fluid</strong> <strong>inclusions</strong>. In De Vivo B. and<br />
Frezzotti M. L. (eds) Fluid Inclusions in<br />
Minerals: Methods and Applications.<br />
Blacksburg, VA: <strong>Virginia</strong> <strong>Tech</strong>, pp. 117-130.<br />
BODNAR, R.J., BINNS, P.R. & HALL, D.L. (1989):<br />
Synthetic <strong>fluid</strong> <strong>inclusions</strong>. VI. Quantitative<br />
evaluation of the decrepitation behavior of <strong>fluid</strong><br />
inclusion in quartz at one atmosphere confining<br />
pressure. J Meta Geol. 7, 229-242.<br />
BODNAR, R.J., BURNHAM, C.W. & STERNER,<br />
S.M. (1985a): Synthetic <strong>fluid</strong> <strong>inclusions</strong> in<br />
natural quartz. III. Determination of phase<br />
equilibrium properties in the system H 2 O-NaCl<br />
to 1000ºC and 1500 bars. Geochim. Cosmochim.<br />
Acta 49, 1861-1873.<br />
BODNAR, R.J., REYNOLDS, T.J. & KUEHN, C.A.<br />
(1985b): Fluid inclusion systematics in<br />
epithermal systems. In. Society of Economic<br />
Geologists, Reviews in Economic Geology, 2,<br />
Geology and <strong>Geochemistry</strong> of Epithermal Systems,<br />
B.R. Berger and P.M. Bethke, eds., 73-98.<br />
BODNAR, R.J., STERNER, S.M. & HALL, D.L.<br />
(1989): SALTY: a FORTRAN program to calculate<br />
compositions of <strong>fluid</strong> <strong>inclusions</strong> in the system<br />
NaCl-KCl-H2O. Comp. & Geos. 15, 19-41.<br />
BURNHAM, C.W. (1979): Magmas and<br />
hydrothermal <strong>fluid</strong>s, In Barnes, H.L., ed.,<br />
<strong>Geochemistry</strong> of Hydrothermal Ore Deposits,<br />
2nd edition. New York, J. Wiley and Sons. pp.<br />
71-136.<br />
BURNHAM, C.W. (1997): Magmas and<br />
hydrothermal <strong>fluid</strong>s, In Barnes, H.L., ed.,<br />
<strong>Geochemistry</strong> of Hydrothermal Ore Deposits,<br />
3rd edition. New York, J. Wiley and Sons. pp.<br />
63-124.<br />
CHOU, I-MING (1987): Phase relations in the<br />
system NaCl-KCl-H 2 O. III. Solubilities of halite<br />
in vapor-saturated liquids above 445°C and<br />
redetermination of phase equilibrium properties<br />
in the system NaCl-H 2 O to 1000°C and 1500<br />
bars. Geochim. Cosmochim. Acta 51, 1965-75.<br />
CLINE, J. S. & BODNAR, R. J. (1994): Experimental<br />
determination of the PVTX properties of 30<br />
wt.% NaCl-H 2 O using synthetic <strong>fluid</strong> <strong>inclusions</strong><br />
[abstr.]. PACROFI V, Abstracts & Program, 12.<br />
DAVIS, D.W., LOWENSTEIN, T.K. & SPENCER,<br />
R.J. (1990) melting behavior of <strong>fluid</strong> <strong>inclusions</strong><br />
in laboratory-grown halite crystals in the<br />
systems NaCl-H 2 O, NaCl-KCl-H 2 O, NaCl-MgCl 2 -<br />
H 2 O, and NaCl-CaCl 2 -H 2 O. Geochim. Cosmo -<br />
chim. Acta 54, 591-601.<br />
DIAMOND, L.W. (2003): Systematics of H 2 O<br />
<strong>inclusions</strong>. In I. Samson, A. Anderson, & D.<br />
Marshall, eds. Fluid Inclusions: Analysis and<br />
Interpretation. Mineral. Assoc. Can., Short<br />
Course Ser. 32, 55-79.<br />
GOLDSTEIN, R.H. (2003): Petrographic analysis of<br />
<strong>fluid</strong> <strong>inclusions</strong>. In I. Samson, A. Anderson, &<br />
D. Marshall, eds. Fluid Inclusions: Analysis and<br />
Interpretation. Mineral. Assoc. Can., Short<br />
Course Ser. 32, 9-53.<br />
GOLDSTEIN, R. H. & REYNOLDS, T. J. (1994):<br />
Systematics of <strong>fluid</strong> <strong>inclusions</strong> in diagenetic<br />
minerals. Society for Sedimentary Geology<br />
Short Course 31, SEPM, Tulsa, OK, 199 pp.<br />
HALL, D.L., STERNER, S.M. & BODNAR, R.J.<br />
(1988): Freezing point depression of NaCl-KCl-<br />
H 2 O solutions. Econ. Geol. 83, 197-202.<br />
HAYNES, F.M. (1985): Determination of <strong>fluid</strong><br />
inclusion compositions by sequential freezing.<br />
Econ. Geol. 80, 1436-1439.<br />
HILBERT, R. (1979): PVT -Daten von Wasser and<br />
von wässrigen Natriumchlorid-Lösungen bis<br />
873K, 4000 Bar und 25 Gewichtsprozent NaCl.<br />
Diss. -Ing. Karlsruhe, 212 (in German).<br />
KALYUZHNYY, V.A. (1960): Liquid <strong>inclusions</strong> in<br />
minerals as a geologic barometer. Int. Geol.<br />
Review 2, 181-195.<br />
KENNEDY, G.C. (1950): "Pneumatolysis" and the<br />
liquid inclusion method of geologic thermo -<br />
metry. Econ. Geol. 45, 533-547.<br />
KNIGHT, C.L. & BODNAR, R.J. (1989): Synthetic<br />
<strong>fluid</strong> <strong>inclusions</strong>. IX. Critical PVTX properties of<br />
NaCl-H 2 O solutions. Geochim. Cosmochim.<br />
Acta 53, 3-8.<br />
98
MOREY, G.W. (1957): The solubility of solids in<br />
gases. Econ. Geol. 52, 225-251.<br />
OAKES, C.S., BODNAR, R.J. & SIMONSON, J.M.<br />
(1990): The system NaCl-CaCl 2 -H 2 O. I. The<br />
vapor-saturated ice liquidus. Geochim.<br />
Cosmochim. Acta 54, 603-610.<br />
PITZER, K.S. (1984): Ionic <strong>fluid</strong>s. J. Physical<br />
Chemistry 88, 2689-2697.<br />
POTTER, R.W., II & BROWN , D.L. (1977): The<br />
volumetric properties of aqueous sodium<br />
chloride solutions from 0º to 500ºC at pressures<br />
up to 2000 bars based on a regression of<br />
available data in the literature. Geol. Surv. Bull.<br />
1421-C, 1-36.<br />
ROEDDER, E. (1958): <strong>Tech</strong>nique for the extraction<br />
and partial chemical analysis of <strong>fluid</strong>-filled<br />
<strong>inclusions</strong> from minerals. Econ. Geol. 53, 235-<br />
269.<br />
ROEDDER, E. (1962): Studies of <strong>fluid</strong> <strong>inclusions</strong> I:<br />
Low temperature application of a dual-purpose<br />
freezing and heating stage. Econ. Geol. 57,<br />
1045-1061.<br />
ROEDDER, E. (1963): Studies of <strong>fluid</strong> <strong>inclusions</strong> II:<br />
Freezing data and their interpretation. Econ.<br />
Geol. 58, 167-211.<br />
ROEDDER, E. (1984): Fluid Inclusions.<br />
Mineralogical Society of America, Reviews in<br />
Mineralogy, Vol. 12, 646 pp.<br />
ROEDDER, E. (1990): Fluid inclusion analysis -<br />
Prologue and epilogue. Geochim. Cosmochim.<br />
Acta 54, 495-507.<br />
ROEDDER, E. & BODNAR, R.J. (1980): Geologic<br />
pressure determinations from <strong>fluid</strong> inclusion<br />
studies. Ann. Rev. Earth Planet. Sci. 8, 263-301.<br />
ROEDDER, E. & BODNAR, R.J. (1997): Fluid<br />
inclusion studies of hydrothermal ore deposits.<br />
In: Barnes H. L. (ed) <strong>Geochemistry</strong> of<br />
Hydrothermal Ore Deposits 3rd edition. New<br />
York, NY: John Wiley, pp. 657-697.<br />
SAMSON, I. & SINCLAIR, W.D. (1992): Magmatic<br />
hydrothermal <strong>fluid</strong>s and the origin of quartztourmaline<br />
orbicules in the Seagull Batholith,<br />
Yukon Territory. Can. Mineral. 30, 937-954.<br />
SAMSON, I. & WALKER, R.T. (2000): Cryogenic<br />
Raman spectroscopic studies in the system<br />
NaCl-CaCl 2 -H 2 O and implications for lowtemperature<br />
phase behavior in aqueous <strong>fluid</strong><br />
<strong>inclusions</strong>. Can. Mineral. 38, 35-43.<br />
SKINNER, N.J. (1953): Some considerations<br />
regarding liquid <strong>inclusions</strong> as geologic<br />
thermometers. Econ. Geol. 48, 541-550.<br />
SOURIRAJAN, S. & KENNEDY, G.C. (1962): The<br />
system H 2 O-NaCl at elevated temperatures and<br />
pressures. Amer. J. Sci 260, 115-141.<br />
STERNER, S.M. (1992): Homogenization of <strong>fluid</strong><br />
<strong>inclusions</strong> to the vapor phase: The apparent<br />
homogenization phenomenon. Econ. Geol. 87,<br />
1616-1623.<br />
STERNER, S.M. & BODNAR, R.J. (1984):<br />
Synthetic <strong>fluid</strong> <strong>inclusions</strong> in natural quartz. I.<br />
Compositional types synthesized and<br />
applications to experimental geochemistry.<br />
Geochim Cosmochim Acta 48, 2659-2668.<br />
STERNER, S.M., HALL, D.L. & BODNAR, R.J.<br />
(1988): Synthetic <strong>fluid</strong> <strong>inclusions</strong>. V. Solubility<br />
relations in the system NaCl-KCl-H 2 O under<br />
vapor-saturated conditions. Geochim.<br />
Cosmochim. Acta 52, 989-1005.<br />
VANKO, D.A., BODNAR, R.J. & STERNER, S.M.<br />
(1988): Synthetic <strong>fluid</strong> <strong>inclusions</strong>. VIII. Vaporsaturated<br />
halite solubility in part of the system<br />
NaCl-CaCl 2 -H 2 O, with application to <strong>fluid</strong><br />
<strong>inclusions</strong> from oceanic hydrothermal systems.<br />
Geochim. Cosmochim. Acta 52, 2451-2456.<br />
WILLIAMS-JONES, A.E. & SAMSON, I. (1990):<br />
Theoretical estimation of halite solubility in the<br />
system NaCl-CaCl 2 -H 2 O: Applications to <strong>fluid</strong><br />
<strong>inclusions</strong>. Can. Mineral. 28, 299-204.<br />
WILSON, N.S.F., CLINE, J.S. & AMELIN, Y.V.<br />
(2003): Origin, timing and temperature of<br />
secondary calcite-silica mineral formation at<br />
Yucca mountain, Nevada. Geochim Cosmochim<br />
Acta 67, 1145-1176.<br />
ZHANG, YI-G. & FRANTZ, J.D. (1987):<br />
Determination of the homogenization<br />
temperatures and densities of supercritical<br />
<strong>fluid</strong>s in the system NaCl-KCl-CaCl 2 -H 2 O using<br />
synthetic <strong>fluid</strong> <strong>inclusions</strong>. Chem. Geol. 64, 335-<br />
350.<br />
99