MeasureIT Scanning Platform Troubleshooting Procedures Manual
MeasureIT Scanning Platform Troubleshooting Procedures Manual
MeasureIT Scanning Platform Troubleshooting Procedures Manual

You also want an ePaper? Increase the reach of your titles
YUMPU automatically turns print PDFs into web optimized ePapers that Google loves.
Measure IT<br />
<strong>Scanning</strong> <strong>Platform</strong><br />
<strong>Troubleshooting</strong> <strong>Procedures</strong> <strong>Manual</strong>
PROPRIETARY DATA<br />
This document contains proprietary data of ABB Inc.<br />
No disclosure, distribution (electronic or otherwise), reproduction,<br />
or other means of dissemination may be made without written permission.<br />
Produced by QCS Product Development.<br />
Writers: Bill Houston, Pamela Murray<br />
Illustrators: Melinda Hoyle, Todd Theodore<br />
Technical Contributor: Mort Jensen<br />
© 1992, 1994-1999, 2002-2003 by ABB Inc. All rights reserved.<br />
1180 MICRO, 1190, Smart <strong>Platform</strong>, and ACE are trademarks of ABB Inc.<br />
UNIX® is a registered trademark of AT&T.<br />
DESQview is a registered trademark of Quarter Deck Office Systems.<br />
® AccuRay is a registered trademark and service mark of ABB Inc.<br />
March 2003<br />
3BUS 208 055 R1101<br />
(formerly 101761-001)
PROPRIETARY DATA: This document contains proprietary data of ABB Inc. No disclosure, distribution (electronic or otherwise),<br />
reproduction, or other means of dissemination may be made without written permission.<br />
Document Version History<br />
Measure IT<br />
<strong>Scanning</strong> <strong>Platform</strong><br />
<strong>Troubleshooting</strong> <strong>Procedures</strong> <strong>Manual</strong><br />
Version<br />
Level<br />
Effective<br />
Date<br />
Sections Changed<br />
by Revision<br />
Sections Added<br />
by Revision<br />
Sections Deleted<br />
by Revision<br />
A April 1992 Original Release<br />
B March 1994 Entire <strong>Manual</strong><br />
C December 1995 Entire <strong>Manual</strong><br />
D April 1996 Profile Development in the<br />
<strong>Scanning</strong> <strong>Platform</strong>, 24<br />
ABB 1190<br />
Measurement Analysis<br />
Using On-Line Utilities,<br />
28-36<br />
Startup Messages, 75-76<br />
AEOS Setup Problems, 94<br />
E October 1996 Entire <strong>Manual</strong><br />
F March 1997 Servo and Scanner Diagnostic<br />
Instance Variables, 87<br />
<strong>Troubleshooting</strong> Flow Charts,<br />
61, 69<br />
G<br />
September<br />
1997<br />
Entire <strong>Manual</strong><br />
H August 1998 Entire <strong>Manual</strong><br />
I August 1999 “Power Down and DC Power<br />
Analysis” on page 149<br />
“Micro-Controller DC Power<br />
Log” on page 152<br />
J January 2002 cover art, header, product<br />
names<br />
K February 2002 Exercising the Reflection IR<br />
Flag, 237<br />
11 March 2003 <strong>Manual</strong> Part Numbers<br />
3BUS 208 055 R1101<br />
Document Version History
Blank Page
PROPRIETARY DATA: This document contains proprietary data of ABB Inc. No disclosure, distribution (electronic or otherwise),<br />
reproduction, or other means of dissemination may be made without written permission.<br />
Preface<br />
The Measure IT <strong>Scanning</strong> <strong>Platform</strong> <strong>Troubleshooting</strong> <strong>Procedures</strong> <strong>Manual</strong>, 3BUS 208 055 R1101, is<br />
a reference guide to troubleshooting the SP 1200 and the SP 700. This manual contains information<br />
for the trained diagnostician on the theory of <strong>Scanning</strong> <strong>Platform</strong> operation and advanced<br />
troubleshooting tools.<br />
3BUS 208 055 R1101<br />
Preface<br />
i
Blank Page
PROPRIETARY DATA: This document contains proprietary data of ABB Inc. No disclosure, distribution (electronic or otherwise),<br />
reproduction, or other means of dissemination may be made without written permission.<br />
Table of Contents<br />
Preface ........................................................................................... i<br />
List of Figures ............................................................................. xi<br />
1 Selected Theories of Operation.............................................. 1<br />
Positioning System Overview......................................................................2<br />
Head Package Dimensions Setup ...............................................................3<br />
Definition of Head Package Dimensions ..............................................................4<br />
How Head Position is Determined...............................................................5<br />
Motion Theory ...............................................................................................7<br />
Servo Theory of Operation....................................................................................7<br />
ACCELERATION Phase Operation..............................................................9<br />
CRUISING Phase Operation..........................................................................9<br />
DECELERATION Phase Operation ............................................................10<br />
HOMING Phase Operation ..........................................................................11<br />
Motion Control Theory .......................................................................................12<br />
System Response to Some Position Parameters..................................................13<br />
Moving from Off–Sheet to On–Sheet ..........................................................17<br />
Detecting Edges While <strong>Scanning</strong>.................................................................18<br />
Profile Development for 1190 Systems.....................................................19<br />
Time Based Measurement ...................................................................................19<br />
Profile Development in the <strong>Scanning</strong> <strong>Platform</strong>...................................................21<br />
Profile Transmission to the Host Computer ........................................................25<br />
Profile Development in the 1190 Host Computer ...............................................26<br />
1190 Measurement Analysis using On-Line Utilities ...............................27<br />
Introductory Comments.......................................................................................27<br />
ABB Measurement Analysis Using the tbmcu Utility ........................................27<br />
Using tbmcu Utility in Stand-alone.....................................................................31<br />
Converting tbmcu Files for Spreadsheet Analysis ..............................................32<br />
Examining Floating Point TBM Arrays ..............................................................34<br />
1190 Measurement Analysis Using sentest Utility .............................................35<br />
Profile Data ..................................................................................................36<br />
Single Point Drift Data.................................................................................37<br />
Profile Development for 1180 Systems.....................................................38<br />
Profile Transmission and Development ..............................................................38<br />
Profile Development in the <strong>Scanning</strong> <strong>Platform</strong>...................................................39<br />
Accessing 1180 MICRO Profile Data Inside the <strong>Scanning</strong> <strong>Platform</strong>..................42<br />
Displaying the Mini-Access Profile Array...................................................44<br />
Profile Transmission to a Host Computer ...........................................................45<br />
Profile Development within the Host Computer..........................................46<br />
Data Box Collection Calculation..................................................................47<br />
Logical Zone Calculations...................................................................................48<br />
3BUS 208 055 R1101<br />
Table of Contents<br />
iii
PROPRIETARY DATA: This document contains proprietary data of ABB Inc. No disclosure, distribution (electronic or otherwise),<br />
reproduction, or other means of dissemination may be made without written permission.<br />
Sensor Theory .............................................................................................49<br />
Sensor Processing Overview ...............................................................................49<br />
Filtering ........................................................................................................49<br />
Normalization...............................................................................................49<br />
Linearization.................................................................................................50<br />
Correction.....................................................................................................50<br />
Conversion ...................................................................................................50<br />
Compensation...............................................................................................50<br />
Fine Tuning ..................................................................................................50<br />
Sensor Input Signal Processing ...........................................................................51<br />
Sensor Output Signal Processing ........................................................................55<br />
2 General <strong>Troubleshooting</strong> Instructions................................. 59<br />
Data Required for Problem Escalation......................................................60<br />
<strong>Troubleshooting</strong> Flow Charts ....................................................................63<br />
Host Computer Coldstart Data File Overview ..........................................76<br />
Startup Messages .......................................................................................77<br />
Changing the Host/SP BAUD Rate and the Station ID.............................85<br />
Radiological Safety Features and Alarms ................................................86<br />
Broken Grid Alarm..............................................................................................86<br />
Inherent Sheet Break (ISB) Alarm ......................................................................86<br />
Head Tracking Error............................................................................................87<br />
Shutter Closed During Prepare to Move .............................................................87<br />
Shutter Closed When Host Computer is Down...................................................87<br />
Invalid Shutter Open Alarm ................................................................................87<br />
3 Position and Motion Problems ............................................. 89<br />
Preliminary <strong>Troubleshooting</strong> Activity .......................................................90<br />
Positioning Events Historical Diagnostic .................................................91<br />
Mechanical Influence on Motion Problems ..............................................94<br />
Comments About the Motor Controller.....................................................95<br />
Diagnosis of <strong>Platform</strong> and Servo Problems .............................................96<br />
Hang Up Problems ..............................................................................................96<br />
vmin Too Small............................................................................................96<br />
Motor Controller Slope Too Small...............................................................97<br />
servo01 Request Complete...........................................................................97<br />
Overcontrol Problems..........................................................................................97<br />
vmin Too Large (or activeVmin) .................................................................97<br />
Motor Controller Slope and Offset Too Large.............................................98<br />
xdb Too Small ..............................................................................................98<br />
Miscellaneous...............................................................................................98<br />
Servo & Scanner Diagnostic Instance Variables .....................................99<br />
servo01 object......................................................................................................99<br />
xdb................................................................................................................99<br />
iv<br />
Table of Contents<br />
3BUS 208 055 R1101
PROPRIETARY DATA: This document contains proprietary data of ABB Inc. No disclosure, distribution (electronic or otherwise),<br />
reproduction, or other means of dissemination may be made without written permission.<br />
vdb................................................................................................................99<br />
avdb ..............................................................................................................99<br />
advdb ............................................................................................................99<br />
vmin/activeVmin..........................................................................................99<br />
vmax...........................................................................................................100<br />
vminFilterFactor.........................................................................................100<br />
ddcExcessiveErrorPercent..........................................................................100<br />
ddcRestrictedMotionPercent ......................................................................100<br />
Accel...........................................................................................................100<br />
Kp...............................................................................................................100<br />
Ki................................................................................................................101<br />
slopep .........................................................................................................101<br />
slopen .........................................................................................................101<br />
biasp ...........................................................................................................101<br />
biasn ...........................................................................................................101<br />
vminTune ...................................................................................................101<br />
sampleInterval ............................................................................................101<br />
xfinal[3]......................................................................................................101<br />
vfinal[3]......................................................................................................101<br />
increment[3] ...............................................................................................101<br />
duration[3]..................................................................................................102<br />
homingError ...............................................................................................102<br />
farEdge .......................................................................................................102<br />
homeEdge...................................................................................................102<br />
scanner01 object ................................................................................................102<br />
maxEdgeChange.........................................................................................102<br />
dbWidth......................................................................................................102<br />
dbAvgTime.................................................................................................102<br />
healthRequest .............................................................................................103<br />
maxSpeed ...................................................................................................103<br />
positioningSafetyMargin............................................................................103<br />
target...........................................................................................................103<br />
autoEOS .....................................................................................................103<br />
farEOSUnknown/homeEOSUnknown.......................................................103<br />
inTransit .....................................................................................................103<br />
scanning......................................................................................................103<br />
sheetBreakPresent ......................................................................................104<br />
stdzPending ................................................................................................104<br />
offSheetTimer.............................................................................................104<br />
onSheetTimer .............................................................................................104<br />
Servo Diagnostic <strong>Troubleshooting</strong> Utility ........................................................104<br />
Selected Servo Diagnostics Definition of Terms: .............................................105<br />
delx.............................................................................................................105<br />
STOP_PAST ..............................................................................................105<br />
CONTINUE HOMING..............................................................................105<br />
FINISHED HOMING ................................................................................105<br />
3BUS 208 055 R1101<br />
Table of Contents<br />
v
PROPRIETARY DATA: This document contains proprietary data of ABB Inc. No disclosure, distribution (electronic or otherwise),<br />
reproduction, or other means of dissemination may be made without written permission.<br />
AEOS Setup Problems..............................................................................107<br />
Frame Tuning and Diagnostic Tool, ft.....................................................110<br />
Enter ft Utility ............................................................................................112<br />
4 ABB Smart Processing Center (ASPC) Hardware............. 113<br />
Host/Workstation Interface to the ASPC.................................................114<br />
Inspecting and Repairing BRAM .............................................................116<br />
Digital I/O Utility ........................................................................................118<br />
dim Main Menu .................................................................................................118<br />
Procedure for Using the dim Utility ..................................................................118<br />
dim Reports .......................................................................................................119<br />
I/O Selection..............................................................................................119<br />
Printout of I/O Configuration.....................................................................119<br />
Digital Input/Output Signal Verification and Tracing.............................120<br />
Analog Input Monitor Utility .....................................................................121<br />
aim Main Menu .................................................................................................121<br />
Procedure for Using the aim Utility ..................................................................121<br />
aim Reports........................................................................................................122<br />
I/O Device Selection Report ......................................................................122<br />
AI Signal Report (Statistics) ......................................................................123<br />
AI Channel Gains Report ...........................................................................124<br />
AI Channel Slopes and Offsets Report ......................................................124<br />
Analog Input Signal Verification and Tracing ........................................125<br />
Using the Diagnostic Card Adapter.........................................................126<br />
Diagnostic Cards ...............................................................................................130<br />
Replacement Parts .............................................................................................138<br />
LED Interpretation.....................................................................................139<br />
Power Supply LEDs ..........................................................................................139<br />
ECF, ECS, and ECC LEDs ...............................................................................140<br />
ECF and ECC Boards (Only).....................................................................140<br />
MPRC LEDs......................................................................................................141<br />
Analog and Digital I/O Documentation....................................................146<br />
Power Down Analysis...............................................................................147<br />
Safety Interrupt Alert.........................................................................................147<br />
Power Down and DC Power Analysis...............................................................149<br />
Micro-Controller DC Power Log...............................................................152<br />
5 Software Diagnostic Tools.................................................. 155<br />
Software Diagnosis...................................................................................156<br />
General Software <strong>Troubleshooting</strong> Techniques ................................................156<br />
Resource ............................................................................................................156<br />
Operating System ..............................................................................................157<br />
Application ........................................................................................................157<br />
vi<br />
Table of Contents<br />
3BUS 208 055 R1101
PROPRIETARY DATA: This document contains proprietary data of ABB Inc. No disclosure, distribution (electronic or otherwise),<br />
reproduction, or other means of dissemination may be made without written permission.<br />
AVOS and Application Utilities........................................................................158<br />
General AVOS Utilities .............................................................................158<br />
The inspect Utility .............................................................................................160<br />
The gstore Utility...............................................................................................162<br />
Identifying Sensor Configuration ............................................................164<br />
Identifying Software Release Levels .......................................................165<br />
Finding System Release Levels.........................................................................165<br />
Finding Subsystem Release Levels ...................................................................165<br />
Release Level Check of Diskettes .....................................................................166<br />
Signal/Measurement Processing Analysis and Reporting (smr)..........168<br />
Summary of smr Capabilities ............................................................................168<br />
Operation Overview ..........................................................................................169<br />
Triggers..............................................................................................................171<br />
Outputs ..............................................................................................................173<br />
Automatic Reporting and Retriggering .............................................................175<br />
Global Access....................................................................................................176<br />
Starting and Stopping Data Collection..............................................................176<br />
Overview of Menu Selection.............................................................................176<br />
General Procedure......................................................................................176<br />
Practical Application..................................................................................177<br />
Example......................................................................................................177<br />
Trigger Setup..............................................................................................177<br />
Collect Data On:.........................................................................................178<br />
smr Work Sheet .................................................................................................178<br />
Resource Checks ......................................................................................180<br />
Obtaining the monitor Report............................................................................180<br />
Obtaining derr, bfchk, and dfree Data...............................................................183<br />
How to Start the <strong>Scanning</strong> <strong>Platform</strong>........................................................185<br />
Displaying Reports within inspect ..........................................................187<br />
Standardize Report ............................................................................................187<br />
Sample Check Report........................................................................................188<br />
Calibrate Sample Report....................................................................................189<br />
Preparing On–Site Documentation..........................................................190<br />
Operation of the Sensor Health Pages....................................................191<br />
Off-Line Debug ..........................................................................................195<br />
6 Sensor <strong>Troubleshooting</strong>...................................................... 197<br />
Sensor Compensation - Operation and Setup .......................................198<br />
Definition of Terms ...........................................................................................198<br />
Operation ...........................................................................................................199<br />
Compensation Flag Setup..................................................................................201<br />
Air Column Compensation for Smart Sensors.......................................202<br />
Procedure to Disable Gap Compensation..........................................................202<br />
3BUS 208 055 R1101<br />
Table of Contents<br />
vii
PROPRIETARY DATA: This document contains proprietary data of ABB Inc. No disclosure, distribution (electronic or otherwise),<br />
reproduction, or other means of dissemination may be made without written permission.<br />
Changing the Measurement Resolution .................................................203<br />
Sensor Measurement Validity Codes ......................................................205<br />
Sensor Local Modes of Operation...........................................................206<br />
Basis Weight Sensor (TLK, TLP, and TLS) .............................................209<br />
<strong>Troubleshooting</strong> Flow Chart .............................................................................209<br />
Basis Weight Hardware Diagnostics.................................................................211<br />
To Open or Close Shutter:..........................................................................211<br />
To Unclamp or Clamp Electrometer ..........................................................211<br />
Infrared Moisture Sensor..........................................................................213<br />
Sensor Alarm Codes..........................................................................................213<br />
Alarms 4619/4719 and 4624/4724 .............................................................214<br />
Alarms 4615/4715, 4616/4716, 4617/4717, 4618/4718, & 4622/4722 .....215<br />
Alarm 4603/4703........................................................................................216<br />
Alarm 4608/4708........................................................................................217<br />
Alarm 4602/4702........................................................................................217<br />
Alarm 4621/4721........................................................................................217<br />
Alarms 4609/4709, 4611/4711, 4612/4712, 4613/4713, 4614/4714, and<br />
4679/4779............................................................................................217<br />
Correlation Problems.........................................................................................218<br />
General Correlation Scatter........................................................................218<br />
Rewet..........................................................................................................218<br />
Dirt Buildup on the Sensor Window..........................................................218<br />
Step-Outs in the Trend ...............................................................................219<br />
Composition Effects on Infrared Sensors...................................................219<br />
Operation at Design Limits ........................................................................219<br />
Insufficient Cooling....................................................................................220<br />
<strong>Troubleshooting</strong> Flow Charts............................................................................220<br />
Exercising the Gain Using Software Commands ..............................................237<br />
Using inspect..............................................................................................237<br />
Using the Health Page Pulse Monitor ........................................................237<br />
Exercising the Reflection IR Flag .....................................................................237<br />
Discontinuity Counter .......................................................................................238<br />
Ash Sensors (TLXR) .................................................................................239<br />
Ash Sensor Standardize Results ........................................................................240<br />
Ash Sensor Hardware Diagnostics ....................................................................242<br />
To Open or Close Shutter...........................................................................242<br />
To Unclamp or Clamp the Electrometer ....................................................242<br />
Ash Correlation Problems ...............................................................................244<br />
Air Bearing, Contacting, and Non-Contacting Caliper Sensors ...........246<br />
Exercising the Caliper Sensor ...........................................................................246<br />
<strong>Troubleshooting</strong> Alarms....................................................................................247<br />
Alarm Code Classification ................................................................................249<br />
Sensor Validity Codes .......................................................................................250<br />
viii<br />
Table of Contents<br />
3BUS 208 055 R1101
PROPRIETARY DATA: This document contains proprietary data of ABB Inc. No disclosure, distribution (electronic or otherwise),<br />
reproduction, or other means of dissemination may be made without written permission.<br />
Appendix A: Quick Reference Guide ..................................... 251<br />
<strong>Scanning</strong> <strong>Platform</strong> Utilities ......................................................................252<br />
Line Prompts .....................................................................................................252<br />
Special Functions ..............................................................................................252<br />
Utility Command Response to a File ................................................................252<br />
Utility Commands......................................................................................253<br />
File Commands..................................................................................................253<br />
Maintenance and Debugging.............................................................................253<br />
Performing a gstore ..................................................................................254<br />
Object Inspector........................................................................................255<br />
Display Object...................................................................................................255<br />
Modify Object ...................................................................................................256<br />
Special Characters .............................................................................................257<br />
Inspect Messages...............................................................................................257<br />
Command Format.......................................................................................257<br />
Examples:...................................................................................................258<br />
Using the Editor.................................................................................................258<br />
Enter Editor ................................................................................................258<br />
Editor Commands.......................................................................................258<br />
Editor Example...........................................................................................258<br />
Function Keys ...........................................................................................259<br />
DESQview Operations ..............................................................................260<br />
Open Window....................................................................................................260<br />
Close Window ...................................................................................................260<br />
Switch Window .................................................................................................260<br />
Rearrange...........................................................................................................260<br />
Move..................................................................................................................261<br />
Resize ................................................................................................................261<br />
Creating a Hot Key............................................................................................261<br />
Display Scripts ..................................................................................................262<br />
Off-Line Debug ..........................................................................................263<br />
Inspect Messages .....................................................................................264<br />
Application Tools ......................................................................................265<br />
Index ......................................................................................... 267<br />
3BUS 208 055 R1101<br />
Table of Contents<br />
ix
Blank Page
PROPRIETARY DATA: This document contains proprietary data of ABB Inc. No disclosure, distribution (electronic or otherwise),<br />
reproduction, or other means of dissemination may be made without written permission.<br />
List of Figures<br />
Figure .............................................................................................................Page<br />
Figure 1-1 Diagram of Positioning Subsystem ..................................................... 2<br />
Figure 1-2 Sensor Head Positions & their Relationship to the Scanner ............... 14<br />
Figure 1-3 Frame Scan Limits Aligned about the Center of the Process ............. 15<br />
Figure 1-4 Position Relationships of Various Sheet Width Parameters ............... 20<br />
Figure 1-5 TBM Profiling Parameters (Sensor Measurement Using LO RES 1) 23<br />
Figure 1-6 Data Box Relationships for Different Resolutions ............................. 24<br />
Figure 1-7 Sheet Width and Profile Relationships ............................................... 40<br />
Figure 1-8 profiler object display ......................................................................... 43<br />
Figure 1-9 <strong>Scanning</strong> <strong>Platform</strong> Algorithm Processing ........................................... 49<br />
Figure 1-10 Sensor Input/Output Signal Relationship ........................................... 51<br />
Figure 1-11 Example Printout of Input Signal Array ............................................. 52<br />
Figure 1-12 Locating A2D Data in a Logical Channel .......................................... 54<br />
Figure 1-13 outputSignals as Inputs to Other Sensors ........................................... 56<br />
Figure 1-14 Example Printout of Output Signal Array .......................................... 57<br />
Figure 2-1 <strong>Troubleshooting</strong> Flow Chart A ........................................................... 64<br />
Figure 2-2 <strong>Troubleshooting</strong> Flow Chart B ........................................................... 65<br />
Figure 2-3 <strong>Troubleshooting</strong> Flow Chart C ........................................................... 66<br />
Figure 2-4 <strong>Troubleshooting</strong> Flow Chart D ........................................................... 67<br />
Figure 2-5 <strong>Troubleshooting</strong> Flow Chart E ........................................................... 68<br />
Figure 2-6 <strong>Troubleshooting</strong> Flow Chart F ............................................................ 69<br />
Figure 2-7 <strong>Troubleshooting</strong> Flow Chart G ........................................................... 70<br />
Figure 2-8 <strong>Troubleshooting</strong> Flow Chart H ........................................................... 71<br />
Figure 2-9 <strong>Troubleshooting</strong> Flow Chart I ............................................................. 72<br />
Figure 2-10 <strong>Troubleshooting</strong> Flow Chart J ............................................................ 73<br />
Figure 2-11 <strong>Troubleshooting</strong> Flow Chart K ........................................................... 74<br />
Figure 2-12 <strong>Troubleshooting</strong> Flow Chart L ........................................................... 75<br />
Figure 3-1 Servo Diagnostics Report ................................................................... 105<br />
Figure 3-2 Frame Tuning Utility Menu Tree ........................................................ 111<br />
Figure 3-3 Description of ft Menu Options .......................................................... 112<br />
Figure 4-1 Debug Port on the <strong>Scanning</strong> <strong>Platform</strong> ................................................ 115<br />
Figure 4-2 Example of Diskette Repair Activity .................................................. 116<br />
Figure 4-3 Main Menu for the Digital I/O Utility ................................................ 118<br />
Figure 4-4 I/O Selection Menu ............................................................................. 119<br />
Figure 4-5 Digital I/O Monitor ............................................................................. 119<br />
Figure 4-6 Partial Example of an I/O Configuration Printout .............................. 119<br />
Figure 4-7 aim Main Menu ................................................................................... 121<br />
3BUS 208 055 R1101<br />
List of Figures<br />
xi
PROPRIETARY DATA: This document contains proprietary data of ABB Inc. No disclosure, distribution (electronic or otherwise),<br />
reproduction, or other means of dissemination may be made without written permission.<br />
Figure 4-8 I/O Selections from the aim Report .................................................... 122<br />
Figure 4-9 Device Selected ................................................................................... 122<br />
Figure 4-10 aim Input Values ................................................................................. 123<br />
Figure 4-11 aim Statistics Display Page ................................................................. 123<br />
Figure 4-12 aim Software Gains Report ................................................................. 124<br />
Figure 4-13 aim Slopes and Offsets Report ........................................................... 124<br />
Figure 4-14 Example of aim Analog Input Display ............................................... 125<br />
Figure 4-15 ASPC Backplane (-003 Version Shown) ............................................ 127<br />
Figure 4-16 Test Board Hookup ............................................................................. 128<br />
Figure 4-17 Carriage Assembly .............................................................................. 129<br />
Figure 4-18 Diagnostic Card: Top Power .............................................................. 130<br />
Figure 4-19 Diagnostic Card: Bottom Power ......................................................... 131<br />
Figure 4-20 Diagnostic Card: Top Signal ............................................................. 132<br />
Figure 4-21 Diagnostic Card: Bottom Signal Sensor ............................................ 133<br />
Figure 4-22 Diagnostic Card: Backplane Power ................................................... 134<br />
Figure 4-23 Diagnostic Card: Bottom Auxiliary Power ......................................... 135<br />
Figure 4-24 Detector Module Diagnostics Card .................................................... 136<br />
Figure 4-25 Source Module Diagnostics Card ....................................................... 137<br />
Figure 4-26 Smart Plarform Electronics Cabinet (-003 Backplane) ...................... 143<br />
Figure 4-27 Location of SMI and BRAM Boards .................................................. 144<br />
Figure 4-28 Location of OSPS2 and EC24V (SP1200) ......................................... 145<br />
Figure 4-29 Example of Analog I/O Documentation ............................................. 146<br />
Figure 4-30 Historical Trend for Microcontroller DC Voltages ............................ 153<br />
Figure 5-1 gstore Menu Screen ............................................................................ 162<br />
Figure 5-2 Hierarchical View of the smr Utility .................................................. 169<br />
Figure 5-3 smr Menu Selection Tree .................................................................... 170<br />
Figure 5-4 Analog and Measurement Historical Data Display ............................ 174<br />
Figure 5-5 Digital Historical Data Display ........................................................... 174<br />
Figure 5-6 Statistical Data Display ....................................................................... 175<br />
Figure 5-7 Monitor Command Menu ................................................................... 180<br />
Figure 5-8 Monitor General Time Display ........................................................... 181<br />
Figure 5-9 monitor Resource Activity Display .................................................... 182<br />
Figure 5-10 Example of the Use of derr, bfchk, and dfree ..................................... 183<br />
Figure 5-11 Standardize Report .............................................................................. 187<br />
Figure 5-12 Check Sample Report ......................................................................... 188<br />
Figure 5-13 Check Sample Report ......................................................................... 189<br />
Figure 5-14 Health Overview Page ........................................................................ 191<br />
Figure 5-15 Basis Weight Health Report Showing Sample Check ........................ 193<br />
Figure 5-16 Basis Weight Health Page Showing Calibrate Sample ....................... 194<br />
Figure 6-1 Flow Diagram of Compensation Selection Logic ............................... 200<br />
xii List of Figures 3BUS 208 055 R1101
PROPRIETARY DATA: This document contains proprietary data of ABB Inc. No disclosure, distribution (electronic or otherwise),<br />
reproduction, or other means of dissemination may be made without written permission.<br />
Figure 6-2 Basis Weight <strong>Troubleshooting</strong> Flow Chart ........................................ 210<br />
Figure 6-3 Sensor Head Signals ........................................................................... 216<br />
Figure 6-4 <strong>Troubleshooting</strong> Flow Chart 1 ........................................................... 221<br />
Figure 6-5 <strong>Troubleshooting</strong> Flow Chart 2 ........................................................... 222<br />
Figure 6-6 <strong>Troubleshooting</strong> Flow Chart 3 ........................................................... 223<br />
Figure 6-7 <strong>Troubleshooting</strong> Flow Chart 4 ........................................................... 224<br />
Figure 6-8 <strong>Troubleshooting</strong> Flow Chart 5 ........................................................... 225<br />
Figure 6-9 <strong>Troubleshooting</strong> Flow Chart 6 ........................................................... 226<br />
Figure 6-10 <strong>Troubleshooting</strong> Flow Chart 7 ........................................................... 227<br />
Figure 6-11 <strong>Troubleshooting</strong> Flow Chart 8 ........................................................... 228<br />
Figure 6-12 <strong>Troubleshooting</strong> Flow Chart 9 ........................................................... 229<br />
Figure 6-13 <strong>Troubleshooting</strong> Flow Chart 10 ......................................................... 230<br />
Figure 6-14 <strong>Troubleshooting</strong> Flow Chart 11 ......................................................... 231<br />
Figure 6-15 <strong>Troubleshooting</strong> Flow Chart 12 ......................................................... 232<br />
Figure 6-16 <strong>Troubleshooting</strong> Flow Chart 13 ......................................................... 233<br />
Figure 6-17 <strong>Troubleshooting</strong> Flow Chart 14 ......................................................... 234<br />
Figure 6-18 <strong>Troubleshooting</strong> Flow Chart 15 ......................................................... 235<br />
Figure 6-19 <strong>Troubleshooting</strong> Flow Chart 16 ......................................................... 236<br />
Figure 6-20 Ash Sensor <strong>Troubleshooting</strong> Flow Chart ........................................... 239<br />
Figure 6-21 Ash Correlation <strong>Troubleshooting</strong> Flow Chart .................................... 245<br />
3BUS 208 055 R1101<br />
List of Figures<br />
xiii
Blank Page
PROPRIETARY DATA: This document contains proprietary data of ABB Inc. No disclosure, distribution (electronic or otherwise),<br />
reproduction, or other means of dissemination may be made without written permission.<br />
1<br />
Selected Theories of Operation<br />
This section presents an overview of profile and motion theory for both<br />
ABB 1190 and ABB 1180 systems.<br />
This chapter contains the following major sections:<br />
Section ...............................................................................................Page<br />
Positioning System Overview ........................................................................ 2<br />
Head Package Dimensions Setup ................................................................... 3<br />
How Head Position is Determined ................................................................. 5<br />
Motion Theory ............................................................................................... 7<br />
Profile Development for 1190 Systems ......................................................... 19<br />
1190 Measurement Analysis using On-Line Utilities .................................... 27<br />
Profile Development for 1180 Systems ......................................................... 38<br />
Sensor Theory ................................................................................................ 49<br />
3BUS 208 055 R1101<br />
Selected Theories of Operation<br />
1
PROPRIETARY DATA: This document contains proprietary data of ABB Inc. No disclosure, distribution (electronic or otherwise),<br />
reproduction, or other means of dissemination may be made without written permission.<br />
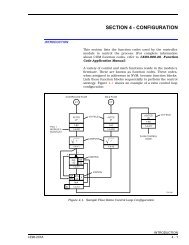
Positioning System Overview<br />
The positioning subsystem is made up of several components encompassing both<br />
software and hardware elements. See Figure 1-1. In simplified terms, scanner01<br />
determines what is to be done, getting needs from other parts of the system and<br />
determining priorities. servo01, upon a request from the scanner01, decides how<br />
to do it by establishing the needed acceleration, cruise, deceleration, and homing<br />
instructions. The ECF portion of the servo software translates these instructions<br />
for the Motor Controller which delivers the required energy to the motor. It is<br />
here that the motor controller slope and offset (MCslope & MCcoffset) are applied<br />
to the voltage being sent to the Motor Controller. The action of the motor rotates<br />
the encoder whose output is interpreted by the ECF who, in turn, converts it into<br />
position complete information. This is sent to the servo01 who determines<br />
completion of the task and notifies the scanner01 that it is done.<br />
MPRC<br />
scanner01<br />
ECF<br />
Micro–controller<br />
(servo execution)<br />
Motor<br />
Controller<br />
motor<br />
trajectory<br />
servo01<br />
(trajectory)<br />
position<br />
complete<br />
encoder<br />
Figure 1-1 Diagram of Positioning Subsystem<br />
2 Selected Theories of Operation<br />
3BUS 208 055 R1101
PROPRIETARY DATA: This document contains proprietary data of ABB Inc. No disclosure, distribution (electronic or otherwise),<br />
reproduction, or other means of dissemination may be made without written permission.<br />
Head Package Dimensions Setup<br />
The sensor head package dimensions are used to control the orientation of the<br />
window over the sheet as the head moves through its various sequences. The<br />
variables used for this purpose can be manipulated to accomplish a variety of head<br />
behavior patterns as the head moves from off sheet to a scanning condition. This<br />
section contains information about the locations of these variables and a procedure<br />
for determining their values. The head package dimensional variables are defined<br />
below. Two basic equations deal with bringing the head on sheet, depending on<br />
whether auto edge-of-sheet is turned on or not:<br />
Auto Edge-of-Sheet Turned Off:<br />
Prepare to measure position=homeScanLimit + homeHeadClearance - homeWindowClearance<br />
+ curlDist + positioningSafetyFactor<br />
Auto Edge-of-Sheet Turned On:<br />
Prepare to measure position = homeEOS + homeHeadClearance + curlDist + positioningSafetyFactor<br />
3BUS 208 055 R1101<br />
Selected Theories of Operation<br />
3
PROPRIETARY DATA: This document contains proprietary data of ABB Inc. No disclosure, distribution (electronic or otherwise),<br />
reproduction, or other means of dissemination may be made without written permission.<br />
Definition of Head Package Dimensions<br />
homeHeadClearance This variable represents the distance between the home–side<br />
edge of the sensor head package and the measurement center<br />
line. Its value will depend on how far beyond the home edge of<br />
the sheet the head must come before starting the Prepare To<br />
Measure activity. In any event, it must always be larger than the<br />
homeWindowClearance.<br />
farHeadClearance This variable represents the distance between the far–side edge<br />
of the sensor head package and the measurement center line.<br />
This variable only comes into play when the head must enter the<br />
prepare to measure position from the far side of the scanner. In<br />
that case, it will have the same function as the<br />
homeHeadClearance. When it is to be used, it must be larger<br />
than the farWindowClearance.<br />
homeWindowClearance This variable represents the distance, on the home–side of the<br />
head package, from the measurement center line to the edge of<br />
the largest sensor window in the head package. The window<br />
radii will range from approximately 0.3 inches for an STLXR<br />
Ash sensor, to 2.5 inches for a HemiPlus IR sensor.<br />
farWindowClearance This variable represents the distance, on the far–side of the head<br />
package, from the measurement center line to the edge of the<br />
largest sensor window in the head package. The window radii<br />
will range from approximately 0.3 inches for an STLXR Ash<br />
sensor, to 2.5 inches for a HemiPlus IR sensor.<br />
curlDist<br />
This variable represents the additional distance that the heads<br />
will travel when first coming on–sheet to the prepare-tomeasure<br />
position to assure that sheet contacting sensors, such as<br />
caliper, are fully on-sheet before making contact. The head will<br />
then back up to the current homeScanLimit to start scanning. If<br />
desired, the entire prepare-to-measure positioning can be<br />
accomplished with the homeHeadClearance dimension, leaving<br />
the curlDist at its default value of 0.1 units.<br />
positioningSafetyFactor This is a small amount of distance (default of approximately 0.5<br />
inches) which is included in the various positioning algorithms<br />
to assure that errors made in determining the dimensional<br />
characteristics of the head and the sheet positions, will result in<br />
a minimal exposure of the window being off the sheet during a<br />
measure operation.<br />
The locations of these positions on a <strong>Scanning</strong> <strong>Platform</strong> sensor head package are<br />
shown in Figure 1-2 on page 14.<br />
4 Selected Theories of Operation<br />
3BUS 208 055 R1101
PROPRIETARY DATA: This document contains proprietary data of ABB Inc. No disclosure, distribution (electronic or otherwise),<br />
reproduction, or other means of dissemination may be made without written permission.<br />
How Head Position is Determined<br />
This section will trace the operational steps and calculations being made along the<br />
way as head position calibration is established within the <strong>Scanning</strong> <strong>Platform</strong>.<br />
Several components and software programs come into play as calibration takes<br />
place. These are:<br />
Table 1-1 Head Position Calibration Components and Programs<br />
The Digital Encoder<br />
ECF Micro–controller<br />
ft. utility<br />
home limit switch<br />
home mechanical stop<br />
home reference plane<br />
A electro-mechanical device which outputs a<br />
stream of pulses. Based on the gear ratios used,<br />
each pulse represents 0.010 in. of linear motion.<br />
Each rotation of the shaft generates an index pulse<br />
which computes out to once every 20 in.<br />
Contains hardware devices to collect and process<br />
the pulses coming from the encoder. Resident<br />
software then converts the information into<br />
engineering units for the rest of the system to use.<br />
A diagnostic utility which is used to establish the<br />
relationships between the encoder and the physical<br />
dimensions of the frame.<br />
A device which will interrupt the motor drive<br />
power when activated by the head carriage<br />
assembly as it drives toward the home end column.<br />
It serves to prevent a mechanical collision with the<br />
end column as well as identifying a point where the<br />
encoder signals can become synchronized.<br />
A bump block several inches past the limit switch<br />
(about 4 in.), which defines the absolute farthest the<br />
head can go in the home direction.<br />
The point in space where position of the head<br />
package on the frame are referenced to. This is<br />
typically the inside surface of the home end<br />
column. It could be any structural point that has a<br />
fixed positional relationship with the frame as long<br />
as it is past the head carriage position.<br />
With these definitions in mind, the steps to head position calibration can be<br />
explained as follows. In order to perform the head position calibration, the encoder<br />
must be synchronized. This happens when the system is started up and the Frame<br />
Control Panel (FCP) is placed in remote. At this point in time, the head is driven<br />
in search of the home limit switch. When the switch is tripped, the head stops and<br />
immediately the direction of motion is reversed and the head is moved very slowly<br />
until the system senses that the limit switch has disengaged. At this point, the A2D<br />
value becomes arbitrarily defined as 2001. This A2D value has the default engSlope<br />
and engOffset for headPosition01_ai applied to it to establish a default head<br />
position. The ft utility can now be activated to do the head position calibration.<br />
3BUS 208 055 R1101<br />
Selected Theories of Operation<br />
5
PROPRIETARY DATA: This document contains proprietary data of ABB Inc. No disclosure, distribution (electronic or otherwise),<br />
reproduction, or other means of dissemination may be made without written permission.<br />
The ft utility does several things during the course of calibration. First, it modifies<br />
the engSlope and engOffset of headPosition01_ai so that all reported positions<br />
will be relative to the home reference plane. Then it divides up the maximum travel<br />
available (farTravelLimit - homeTravelLimit) into an A2D range of 1000 to 31767<br />
units. It also establishes an a2dConversionSlope and a2dConversionOffset which<br />
is used to convert the reported head positions into pseudo-A2D units for transmittal<br />
to a host. This slope and offset is stored in the pmmFrame01 object.<br />
The sequence of steps is as follows. The operator places the head at the home<br />
mechanical stop as directed by the utility. The distance from the home reference<br />
plane and the head carriage support surface is then measured and the value entered<br />
into the utility. The utility then adds a fixed amount to this value so that the value<br />
becomes the distance from the home reference plane to the measure window center<br />
line. A different add-on dimension is used for SP1200 and SP700 due to slight<br />
differences in their head sizes.<br />
It should be noted here that it really does not matter what the entered value is. It<br />
only becomes important if someone decides to take a tape measure and check the<br />
distance from the measure window centerline to the home reference plane. CMC<br />
does use the value in its setup, however, it does not care what it is in reference to,<br />
only that it be consistent over time.<br />
Here are some of the equations the calibration goes through:<br />
Hpslope = engSlope = 0.0254/units (where units = 1.0 for cm, and 2.54 for in.)<br />
Hpoffset = engOffset = homePosition - (homePosCounts * engSlope)<br />
a2dConversionSlope = (farTravelLimit - homeTravelLimit)/30767<br />
a2dConversionOffset = homeTravelLimit - (1000 * a2dConversionSlope)<br />
Here is a summary of what happens to an actual head position as it gets processed<br />
and sent up to a host. The ECF micro–controller software has kept track of encoder<br />
pulses with respect to the point at which it was synchronized. The current position,<br />
therefore, has a specific count associated with it. This count is converted to customer<br />
units by applying the engSlope and engOffset. Along with being used by other<br />
parts of the <strong>Scanning</strong> <strong>Platform</strong>, the position is also converted to pseudo-a2d units<br />
for availability to the host. This is done by taking the head position in customer<br />
units, and applying the a2dConversionSlope and a2dConversionOffset factors to<br />
it. The exception to this are AccuRay Direct applications which present the host<br />
with data in terms of customer units.<br />
6 Selected Theories of Operation<br />
3BUS 208 055 R1101
PROPRIETARY DATA: This document contains proprietary data of ABB Inc. No disclosure, distribution (electronic or otherwise),<br />
reproduction, or other means of dissemination may be made without written permission.<br />
Motion Theory<br />
Servo Theory of Operation<br />
The scanner sends trajectories to the servo asynchronously and without regard to<br />
the servo’s current duties. The previously requested trajectory may be overridden<br />
at any time by the scanner, even if the servo has not yet responded to that previously<br />
received trajectory.<br />
A trajectory consists of the following information. Refer to Table 1-2.<br />
Type:<br />
FIXED_POINT<br />
STOP_PAST<br />
MOVING<br />
HOLD_POSITION<br />
STOP<br />
POSITION<br />
VELOCITY<br />
MESSAGE<br />
Table 1-2 Trajectory Type and Definition<br />
One of the following:<br />
Go to position and stop (single point, stdz position, etc.)<br />
Go slightly beyond position and stop (scanning)<br />
Go to position and remain moving at speed<br />
Stop and return to current position<br />
Stop and remain at resulting position<br />
Desired final position in units of head position<br />
Desired average velocity to position<br />
Response to the scanner upon satisfaction of this trajectory<br />
Most trajectory requests from the scanner are of the type STOP_PAST; this insures<br />
that the requested positions are attained plus a small dead band. Using STOP_PAST<br />
trajectory requests insures that data is filled in all assigned profile boxes.<br />
Occasionally, the scanner will request a STOP type trajectory in order to guarantee<br />
that it has an unchanging position before making motion decisions. MOVING and<br />
HOLDING_POSITION are rarely used. FIXED_POINT is used to achieve Off–<br />
Sheet, Standardize, and Single Point positions.<br />
The servo attempts to satisfy the requested trajectory by applying four control<br />
phases in sequential order. These phases are defined in Table 1-3.<br />
Table 1-3 Control Phases and Definitions<br />
Control Phase<br />
ACCELERATION<br />
CRUISING<br />
DECELERATION<br />
HOMING<br />
Definition<br />
Increments the velocity from the current output value<br />
Maintains the requested velocity via Direct Digital Control<br />
(DDC)<br />
Decrements the velocity to the final value<br />
Closes on the final position at the minimum velocity<br />
These four phases are unconditionally performed, regardless of the trajectory.<br />
3BUS 208 055 R1101<br />
Selected Theories of Operation<br />
7
PROPRIETARY DATA: This document contains proprietary data of ABB Inc. No disclosure, distribution (electronic or otherwise),<br />
reproduction, or other means of dissemination may be made without written permission.<br />
When the trajectory is first received from the scanner, the servo computes a vector<br />
for each of the first three phases: ACCELERATION, CRUISING, and<br />
DECELERATION based on the tuning parameters provided to it, such as vmin,<br />
vmax, Accel, xdb, vdb, and so forth. These vectors define the predicted endpoint<br />
for each phase in space and time. The fourth phase HOMING, infers its end point<br />
from the original trajectory and therefore does not need a vector to define it, for<br />
example, the final position at zero velocity. The run task of servo will make every<br />
effort to match these predicted end points.<br />
Each of the three vectors contain the following information. Refer to Table 1-4.<br />
Table 1-4 Information Type and Description<br />
Information Type<br />
POSITION<br />
VELOCITY<br />
INCREMENT<br />
DURATION<br />
Description<br />
Predicted final position for this phase<br />
Desired termination velocity for this phase<br />
Per execution VELOCITY or POSITION<br />
increment for this phase<br />
Predicted total time of execution for this phase<br />
The Servo run task determines when each phase is finished by performing the<br />
following comparisons (referred to as the “done check”). Refer to Table 1-5.<br />
Table 1-5 Motion Phases and Descriptions<br />
Comparison<br />
ACCELERATION<br />
CRUISING<br />
DECELERATION<br />
HOMING<br />
Definition<br />
Finished when current output velocity exceeds the<br />
requested speed for this phase or when the requested<br />
acceleration is close to zero.<br />
Finished when the position is close to the estimated<br />
end point<br />
OR<br />
Finished when the elapsed time is greater than the<br />
predicted duration<br />
OR<br />
Finished when the trajectory type is STOP<br />
Finished when the position is close to the predicted end<br />
point<br />
OR<br />
Finished when the elapsed time is greater than the<br />
predicted duration<br />
OR<br />
Finished when the velocity is within vmin of the<br />
desired speed<br />
Finished when the position is close to the trajectory<br />
end point<br />
OR<br />
Finished when the trajectory is STOP<br />
8 Selected Theories of Operation<br />
3BUS 208 055 R1101
PROPRIETARY DATA: This document contains proprietary data of ABB Inc. No disclosure, distribution (electronic or otherwise),<br />
reproduction, or other means of dissemination may be made without written permission.<br />
When the final phase, HOMING, is complete, the required message is returned to<br />
the scanner object to indicate that this trajectory has been achieved.<br />
The following phase logic is executed by the Servo’s run task every 200<br />
milliseconds. Each phase executes its “done check” prior to continuing. When the<br />
“done check” is complete, then the next phase begins.<br />
ACCELERATION Phase Operation<br />
During the ACCELERATION phase, Servo increments its velocity output by adding<br />
the predicted velocity increments during each sampleInterval. The predicted<br />
velocity increment is derived from the following equation:<br />
inc [this phase] = Accel * sampleInterval<br />
CRUISING Phase Operation<br />
During the HOMING phase, the positioning is handled in two different ways. One<br />
way is used when the trajectory mode is scanning and the other is used for all other<br />
trajectory modes.<br />
For the normal scanning mode (called STOP_PAST in the program), the head is<br />
driven toward the target until it reaches a location close to the target and then the<br />
output to the motor controller is set to zero and the head comes to a stop slightly<br />
past the target. The servo logic monitors the distance the head travels after<br />
outputting the zero output (the stopping distance) in order to determine how far in<br />
advance of the target to start stopping the head. A separate distance is kept<br />
depending on the direction the head is moving. Initially, the servo logic has no<br />
history of the stopping distance so it defaults to using the actual target for when to<br />
start stopping. But after scanning in both directions the operation of the servo will<br />
get much better. This is a key point to keep in mind, because after every restart the<br />
system must go through this learning process. That means that the initial scans<br />
after a restart will not be as accurate in terms of achieving the correct EOS position<br />
as will later scans. The learning curve is, however, fairly short with only two to<br />
four scans needed to establish reasonable results.<br />
The other trajectory modes; i.e., single point, standardize, etc., are handled in the<br />
traditional positioning (called NON_STOP_PAST in the program) way. The head<br />
is driven toward the target until it gets to a location close to the target and then the<br />
output to the motor controller is set to zero and the head should come to a stop<br />
slightly past the target. The determination of how far in advance of the target to<br />
start stopping is the same as for the scanning mode. After once trying to stop, the<br />
logic reverts back to keeping the head inside the deadband of xdb around the target.<br />
The stopping distance is not monitored for the positioning cases. In this way, the<br />
stopping distance is more accurately kept for the scanning logic (scanning is the<br />
mode desired to optimize).<br />
During the CRUISING phase, Servo performs a DDC-PI (proportional and integral<br />
direct digital control) algorithm on the desired scan position which insures that the<br />
position error is kept to a minimum.<br />
3BUS 208 055 R1101<br />
Selected Theories of Operation<br />
9
PROPRIETARY DATA: This document contains proprietary data of ABB Inc. No disclosure, distribution (electronic or otherwise),<br />
reproduction, or other means of dissemination may be made without written permission.<br />
A motion restriction detector has been built into this phase which senses the<br />
increased effort required to overcome an obstacle. Its sensitivity may be adjusted<br />
infinitely from zero. If an obstacle has been detected, then the head is immediately<br />
stopped and the platform is put in local. To recover, the platform must be cycled<br />
through local using the pushbuttons at the platform control panel. A console<br />
message notes this local condition.<br />
The algorithm used for the obstacle detection is:<br />
IF: ddc speed is more than ddcExcessiveErrorPercent greater than<br />
requested speed<br />
AND IF: measured motion is less than ddcRestrictedMotionPercent of<br />
expected motion<br />
OR IF: measured motion is close to zero<br />
THEN: motion is restricted.<br />
DECELERATION Phase Operation<br />
During the DECELERATION phase, Servo decrements the velocity output by<br />
subtracting the predicted velocity increment each sampleInterval. The predicted<br />
velocity increment is derived from the following equation:<br />
inc [ACCELERATION] = Accel * sampleInterval<br />
The terminal velocity for this phase is assumed to be vmin for most trajectories<br />
since the HOMING phase is next and will zero the output immediately if the position<br />
dead band, xdb, has been satisfied. This velocity assures that “stiction” (an<br />
impedance to free movement either by friction or stickiness) does not occur between<br />
deceleration and homing.<br />
10 Selected Theories of Operation<br />
3BUS 208 055 R1101
PROPRIETARY DATA: This document contains proprietary data of ABB Inc. No disclosure, distribution (electronic or otherwise),<br />
reproduction, or other means of dissemination may be made without written permission.<br />
HOMING Phase Operation<br />
For both modes of HOMING when trying to drive the head (non-zero output to the<br />
motor controller), the initial output to the motor controller will be the activeVmin<br />
speed. If the head stalls (no movement when trying to drive the head), the output<br />
is increased by a small amount velInc (velInc = vminFilterFactor * activeVmin).<br />
After two time iterations, the movement is checked again. If there is still no<br />
movement, the output is again increased by velInc. This procedure is repeated until<br />
the head shows movement.<br />
After driving the head close enough to the target, the output to the motor controller<br />
is set to zero (as previously mentioned). At that time a check is made to determine<br />
if the previous output was more than two times velInc larger than activeVmin and<br />
if the flag vminTune is TRUE. If that is the case, the activeVmin is increased by<br />
velInc. By operating with the flag vminTune TRUE, activeVmin would eventually<br />
reach a value that will assure movement of the head. If the flag vminTune is FALSE,<br />
the output to the motor controller will be incrementally increased. But, the<br />
activeVmin will not be modified so that the starting activeVmin for the next<br />
trajectory would revert back to the same value each time.<br />
If the communication to the ECF is lost, then restored, the activeVmin will get<br />
initialized to the value of vmin even if the activeVmin value had been changed<br />
because of the flag vminTune being set to TRUE. So the proper way to tune the<br />
frame is to set vmin to a relatively small value and then set vminTuning FALSE<br />
and then back to TRUE with either the ft utility or the Frame Health Page. Let the<br />
system scan until activeVmin reaches a stable value, then set vmin equal to the<br />
stable value and turn vminTuning FALSE.<br />
For FIXED_POINT positioning during the HOMING phase, the head position is<br />
compared to the end point of the requested trajectory. The Servo will remain in this<br />
phase until it is sent a new trajectory. The two possibilities for control are:<br />
Acceptable:<br />
The current head position is close enough to the target. The output velocity is set<br />
to zero. The actual current velocity of the head is not necessarily zero at this instant.<br />
Assuming that the velocity remaining from the DECELERATION control phase is<br />
usually equal to vmin, the actual velocity should be zero within the next 100<br />
milliseconds.<br />
Unacceptable:<br />
The current head position is too far from the target. The minimum velocity vmin<br />
is requested. A DDC proportional and integral algorithm is performed to insure<br />
that minimum velocity is achieved. Additionally, if the flag vminTune is set, then<br />
vmin may be modified in the following way prior to use:<br />
If the DDC algorithm is detecting excessive homing errors (that is, total correction<br />
is greater than vmin) and if there has been no detected motion in the last 0.1 seconds,<br />
then vmin is increased using the following formula:<br />
new vmin = (old vmin * vminFilterFactor) + old vmin<br />
3BUS 208 055 R1101<br />
Selected Theories of Operation<br />
11
PROPRIETARY DATA: This document contains proprietary data of ABB Inc. No disclosure, distribution (electronic or otherwise),<br />
reproduction, or other means of dissemination may be made without written permission.<br />
This increase insures that vmin reaches a value which is correctable by the DDC,<br />
but is not too large. Positioning delays may still occur, however DDC will eventually<br />
overcome platform resistance. vmin is limited in this algorithm to no more than<br />
one third of vmax.<br />
In a poorly tuned platform, the required minimum velocity may approach or exceed<br />
the desired scanSpeed or onSheetSpeed of the scanner. If the platform is poorly<br />
tuned, the head may “hang up” or “hunt” when trying to achieve a position.<br />
Motion Control Theory<br />
Proper setup of the <strong>Scanning</strong> <strong>Platform</strong> is very important to trouble free operation.<br />
There are critical factors in both the hardware and the <strong>Scanning</strong> <strong>Platform</strong> software.<br />
A brief description of the motion algorithm may be of help in case of problems.<br />
The <strong>Scanning</strong> <strong>Platform</strong> software controls the motion of the head package with an<br />
object called Servo. The servo object is told to wait for the next input value of its<br />
head position (called servoHeadPosition0x). This head position is expected every<br />
100 milliseconds. If it does not arrive within 500 milliseconds, an error will be<br />
generated in the error log (pe) and the previous velocity will be used.<br />
Upon receipt of the head position, the servo executes its position algorithm. This<br />
algorithm uses a DDC loop with both integral and proportional control. The<br />
components of the output velocity in customer units from the servo are:<br />
command<br />
pcommand<br />
icommand<br />
lcommand<br />
= total output cu/sec<br />
= proportional error cu/sec<br />
= integral error cu/sec<br />
= desired velocity cu/sec<br />
The position tolerance xdb is used to determine position complete of the head.<br />
The scan speed used by the servo is computed by the pmmFrame0x object from<br />
information it receives from the Host Computer. The scan speed is used for several<br />
modes besides scanning; for instance, to move between single point positions which<br />
are close together, and for moving from off–sheet to near the sheet edge position.<br />
The new velocity command is sent to a signal object called servoVelocity0x. All<br />
objects which are waiting for this signal will be awaken for processing.<br />
The servo drive program in the frame SMI has been told to wait for the next update<br />
of the velocity command signal from the MPRC servo object.<br />
12 Selected Theories of Operation<br />
3BUS 208 055 R1101
PROPRIETARY DATA: This document contains proprietary data of ABB Inc. No disclosure, distribution (electronic or otherwise),<br />
reproduction, or other means of dissemination may be made without written permission.<br />
System Response to Some Position Parameters<br />
The <strong>Scanning</strong> <strong>Platform</strong> subsystem uses the following rules and equations to safely<br />
position the measure window over the process. While the entries refer to actual<br />
physical dimensions on the head and frame, the values used may be modified to<br />
accomplish desired results. For example, a process with little or no curl and no<br />
edge flutter need not take into account the full homeHeadClearance or curlDist<br />
when bringing the head on–sheet for the prepare–to–measure function.<br />
Read the following six comments to assist your understanding of the parameters<br />
used. See Figure 1-2 on page 14 and Figure 1-3 on page 15.<br />
3BUS 208 055 R1101<br />
Selected Theories of Operation<br />
13
PROPRIETARY DATA: This document contains proprietary data of ABB Inc. No disclosure, distribution (electronic or otherwise),<br />
reproduction, or other means of dissemination may be made without written permission.<br />
Home<br />
End<br />
Column<br />
homeTravelLimit<br />
Far<br />
End<br />
Column<br />
Home Limit Switch<br />
garagePosition<br />
stdzPosition<br />
homeTrimLimit<br />
homeMeasureLimit(LHEOS)<br />
homeEOS (auto EOS only)<br />
homeScanLimit (KHEOS)<br />
homeDetector<br />
curlDist<br />
farTravelLimit<br />
frameWidth<br />
Measurement<br />
Reference Line<br />
farScanLimit (KFEOS)<br />
farEOS (auto EOS only)<br />
farMeasurementLimit (LFEOS)<br />
farTrimLimit<br />
Process Sheet<br />
Figure 1-2 Sensor Head Positions & their Relationship to the Scanner<br />
Far Limit Switch<br />
farDetector<br />
14 Selected Theories of Operation<br />
3BUS 208 055 R1101
PROPRIETARY DATA: This document contains proprietary data of ABB Inc. No disclosure, distribution (electronic or otherwise),<br />
reproduction, or other means of dissemination may be made without written permission.<br />
D1<br />
HomeEdge<br />
Detector<br />
homeHeadClearance<br />
Measurement<br />
Reference Line<br />
HEOS<br />
Process Sheet<br />
farDetectorOffset<br />
and D2<br />
Figure 1-3 Frame Scan Limits Aligned about the Center of the Process<br />
farHeadClearance<br />
FEOS<br />
FarEdgeTrackingDistance<br />
Far Edge<br />
Detector<br />
D2<br />
EOS<br />
DB<br />
homeEdgeTrackingDistance<br />
homeEdgeWindowClearance<br />
farEdgeWindowClearance<br />
homeDetectorOffset<br />
and D1<br />
EOS<br />
DB<br />
3BUS 208 055 R1101<br />
Selected Theories of Operation 15
PROPRIETARY DATA: This document contains proprietary data of ABB Inc. No disclosure, distribution (electronic or otherwise),<br />
reproduction, or other means of dissemination may be made without written permission.<br />
1. The homeHeadClearance and farHeadClearance variables are cross–<br />
machine distances with respect to the head position reference point<br />
(measurement window center line). They establish a cross–machine area called<br />
the head. These values define a boundary along each home edge of the process<br />
sheet when the head is going on–sheet.<br />
The head will not move past the homeHeadClearance if any portion of the<br />
head is already determined to be on the sheet. This is particularly significant<br />
for auto edge–of–sheet measurements.<br />
Note:<br />
The instance variable curlDist can be used in place of<br />
homeHeadClearance. Whichever one is used, the other should be<br />
set to a very small value such as 0.1. However,<br />
homeHeadClearance must always be larger than<br />
homeWindowClearance.<br />
2. The homeWindowClearance and farWindowClearance variables are cross–<br />
machine distances with respect to the head position reference point<br />
(measurement window centerline). They establish a cross–machine area called<br />
the head window. The purpose for these special areas is to restrict measurement<br />
operations which would have any part of the window area to be off–sheet.<br />
3. When auto edge–of–sheet is enabled, the edge detectors will be used to find the<br />
actual edge–of–sheet. With auto edge–of–sheet disabled, the envelope<br />
dimensions of the head and measure limits will be used to compute and<br />
anticipate the sheet edge position.<br />
4. Three speeds are defined in the Scanner community file in the <strong>Scanning</strong><br />
<strong>Platform</strong>. maxSpeed is the high velocity used for moving the head distances<br />
which are greater than one fourth the platform width and which do not cause<br />
the sheet boundary to be crossed. scanSpeed is determined by the desired scan<br />
time and the current scan limits. It is computed by the <strong>Scanning</strong> <strong>Platform</strong> based<br />
on data sent to it by the Host. The third speed, onSheetSpeed, is invoked any<br />
time the head is given a command to cross the sheet edge boundary area from<br />
the off–sheet position.<br />
5. On platforms significantly longer or shorter than 6–7 meters, the variable xdb<br />
in the servo0x object file may need adjustment. xdb is the position dead band.<br />
Adjust it smaller on short platforms and wider on long platforms. The criteria<br />
is attainment of position, complete without hunting.<br />
6. The acceleration variable “Accel”, has a large impact on stability at the scan<br />
edges. A typical value should be about one-half of the scan speed. Too high<br />
of a value will cause the head to start abruptly and shoot past the target at the<br />
end. Too low of a value will cause the head to struggle in getting to its cruising<br />
velocity.<br />
16 Selected Theories of Operation<br />
3BUS 208 055 R1101
PROPRIETARY DATA: This document contains proprietary data of ABB Inc. No disclosure, distribution (electronic or otherwise),<br />
reproduction, or other means of dissemination may be made without written permission.<br />
The heads will appear to move at different rates to get to a particular target position.<br />
This is because the system keeps a constant monitor of the positional relationship<br />
between the sheet edge and the current head position. Moving the head, then,<br />
becomes a complex process involving several computations to determine how fast<br />
the heads may be moved. An example of moving the head from off–sheet at the<br />
home end to a scanning position inside the curl area is as follows:<br />
Example:<br />
ACTION<br />
How It Happened<br />
The head package moves<br />
to a position just off<br />
the homeTrimLimit<br />
at maxSpeed. position target = (homeTrimLimit - farHeadClearance<br />
- positionSafetyMargin)<br />
The head package moves<br />
to a position just beyond<br />
the curl area at<br />
the onSheetSpeed. position target = (homeScanLimit -<br />
homeWindowClearance +<br />
homeHeadClearance +<br />
curlDist + positionSafetyMargin)<br />
The head package moves<br />
to the starting scan<br />
position at maxSpeed. position target = (homeScanLimit)<br />
Moving from Off–Sheet to On–Sheet<br />
When you move the head from the off–sheet position, either garagePosition or<br />
stdzPosition, the initial request to scan causes the head to move towards the sheet<br />
edge at maximum speed. When the far edge detector sees the home edge, the head<br />
halts momentarily, checks that all the sensors are prepared to cross the sheet edge,<br />
then proceeds at onSheetSpeed to the prepare to measure position. The system<br />
then knows where the home edge is located. This knowledge causes the head to<br />
proceed to the calculated homeScanLimit to start the scanning operation, just as<br />
it would under non–AEOS conditions.<br />
3BUS 208 055 R1101<br />
Selected Theories of Operation<br />
17
PROPRIETARY DATA: This document contains proprietary data of ABB Inc. No disclosure, distribution (electronic or otherwise),<br />
reproduction, or other means of dissemination may be made without written permission.<br />
Detecting Edges While <strong>Scanning</strong><br />
During the scanning process, the leading edge detector is constantly monitored to<br />
determine the location of the edge–of–sheet. When the edge is detected, the detector<br />
computes a new ideal scan limit for that edge. The difference between this new<br />
ideal scan limit and the current scan limit is compared to the EOSDeadband. If<br />
the difference is greater than the EOSDeadband, the scan limit is changed to the<br />
new ideal scan limit. The head then pauses and moves to the new scan limit. If the<br />
scan limit is not changed, the head continues to use the current scan limit.<br />
If the edge is not detected before the sensor window reaches the current scan limit,<br />
the system causes the head to proceed to the corresponding MeasureLimit as a<br />
target. The edge–of–sheet should be detected before the sensor window reaches<br />
the MeasureLimit target. A new ideal scan limit is then computed and the head<br />
moves to this new location. As of SCN release SP210.2, any further edge detections<br />
by the farDetector are ignored (for example ropes). If the sensor window reaches<br />
the MeasureLimit before the edge is detected, then the MeasureLimit is used as<br />
the scan limit.<br />
Whenever the system determines that the EOSDeadband has been exceeded and<br />
a new ideal scan limit is to be used, the Host is notified and it in turn will compute<br />
a new scan speed if necessary. The Host will delay the next scan enable until it has<br />
completed its analysis and sent the new information to the <strong>Scanning</strong> <strong>Platform</strong>.<br />
18 Selected Theories of Operation<br />
3BUS 208 055 R1101
PROPRIETARY DATA: This document contains proprietary data of ABB Inc. No disclosure, distribution (electronic or otherwise),<br />
reproduction, or other means of dissemination may be made without written permission.<br />
Profile Development for 1190 Systems<br />
Time Based Measurement<br />
This section contains information on how the <strong>Scanning</strong> <strong>Platform</strong> software produces<br />
time based measurement profiles, how these profiles are transmitted to the Host<br />
computer, and how the Host computer displays the time based profiles.<br />
In the TBM (Time Based Measurement) system, there is only one type of profile<br />
generated within the <strong>Scanning</strong> <strong>Platform</strong> for each sensor. It is an uncomposited<br />
profile which the Host computer can then composite if desired. All profiling takes<br />
place within the pmmSensor objects (for example: pmmBeta01, pmmIR01) rather<br />
than in the sensor objects (for example: betaSensor01, IRSensor01). By having the<br />
profiling occur in the pmmSensor objects, the <strong>Scanning</strong> <strong>Platform</strong> software can<br />
interface with a variety of Host computers, each of which might have unique profile<br />
generation requirements.<br />
The <strong>Scanning</strong> <strong>Platform</strong> software supports any number of data boxes for its profiles.<br />
The number of data boxes is determined by the variable fsdi->ibxw, which is in the<br />
pmmFrame’s static data area from the Host. This variable specifies the width of<br />
the data box for the highest resolution profile that the system will support. Data<br />
box numbers start at 0 at the location defined by LHEOS (the pmmFrame’s<br />
homeTrimLimit), and increase by 1 each data box width (fsdi stands for frame static<br />
data input from the Host.)<br />
The width of the data boxes in the <strong>Scanning</strong> <strong>Platform</strong> and the host computer are the<br />
same with a value calculated and provided by the host. A maximum number of<br />
data boxes can be displayed if the current scan limits are made equal to the maximum<br />
measure limits. Due to round off errors in converting from integer to floating point<br />
of the box width variation. The maximum number of boxes for display may be less<br />
than the system defined number of boxes. It is important that the maximum scan<br />
limits (LFEOS and LHEOS) be set to the maximum trim of the machine. If this is<br />
not done, the operator will lose the perspective of which slice screw represents<br />
which area of the profile. As the current scan limits are moved inward (KFEOS<br />
and KHEOS), the number of profile boxes displayed will be reduced proportionally<br />
to the decrease in sheet width. See Figure 1-4.<br />
3BUS 208 055 R1101<br />
Selected Theories of Operation<br />
19
PROPRIETARY DATA: This document contains proprietary data of ABB Inc. No disclosure, distribution (electronic or otherwise),<br />
reproduction, or other means of dissemination may be made without written permission.<br />
HEADBOX<br />
Maximum Slice<br />
Maximum Head Position Range of Encoder<br />
1 count 65535 counts<br />
homeTravelLimit<br />
at homeLimitSwitch<br />
(2001 counts)<br />
Maximum Head Position Readings<br />
farTravelLimit<br />
at farLimitSwitch<br />
(2001 + [farLS - homeLS] / .01 inch per count)<br />
homeMeasureLimit<br />
(minhl/LHEOS)<br />
Maximum Trim<br />
farMeasureLimit<br />
(maxfl/LFEOS)<br />
homeScanLimit<br />
(heos/KHEOS)<br />
Scan Limits<br />
farScanLimit<br />
(feos/KFEOS)<br />
homeEOS<br />
EOS Positions<br />
(same as above if no AEOS)<br />
farEOS<br />
Figure 1-4 Position Relationships of Various Sheet Width Parameters<br />
20 Selected Theories of Operation<br />
3BUS 208 055 R1101
PROPRIETARY DATA: This document contains proprietary data of ABB Inc. No disclosure, distribution (electronic or otherwise),<br />
reproduction, or other means of dissemination may be made without written permission.<br />
Profile Development in the <strong>Scanning</strong> <strong>Platform</strong><br />
Placing the measurement data received from the various sensor objects in profile<br />
arrays requires first that appropriate array objects be built to contain the data. This<br />
is only done once when the <strong>Scanning</strong> <strong>Platform</strong> starts up. These array objects are<br />
circular buffers of 500 entries. The data stored in these array objects are from the<br />
static and dynamic data input areas of pmmFrame (fsdi/fddi) and from the dynamic<br />
data input areas of pmmSensor (ddi). The information format for the circular buffer<br />
arrays is normally scaled, customer unit data, in integer format. For chemical and<br />
AccuRay Direct applications, it is the floating point format. This information is<br />
shown in Table 1-6 on page 22.<br />
The <strong>Scanning</strong> <strong>Platform</strong> software identifies which data box a measurement belongs<br />
in, based on its head position (which was calibrated using the frame tuning utility<br />
ft) and on data box specification information sent down from the Host in the<br />
<strong>Scanning</strong> <strong>Platform</strong>’s static and dynamic input data areas. As each measurement<br />
data point is received, the microcontroller routine stuffs that data into the correct<br />
data box, averaging it with the previous data points in that data box. The boxes of<br />
averaged signals are then delivered to the MPRC board processing where the boxes<br />
are converted into sensor measurements. Each time that the data box number<br />
changes, a new cell in the circular buffer is updated. The number of data points<br />
included in each data box is determined by:<br />
• the sensor sampling rate (which is 50 or 60 smples/second based on power<br />
frequency),<br />
• the scan speed, and<br />
• the number of data boxes per scan (which is a function of data box width and<br />
scan limits).<br />
For all sensors except IR, use the following equation:<br />
z samples -------------------- = 1000 samples<br />
databox seconds<br />
Equation 1-1<br />
For IR sensors, use the following equation:<br />
-------------------- x--------------------<br />
seconds 1<br />
× × -----------------------------<br />
scan<br />
z samples -------------------- = hHz × x--------------------<br />
seconds<br />
databox<br />
scan<br />
Equation 1-2<br />
y databoxes --------------------------<br />
scan<br />
1<br />
× -----------------------------<br />
y databoxes --------------------------<br />
scan<br />
3BUS 208 055 R1101<br />
Selected Theories of Operation<br />
21
PROPRIETARY DATA: This document contains proprietary data of ABB Inc. No disclosure, distribution (electronic or otherwise),<br />
reproduction, or other means of dissemination may be made without written permission.<br />
Example: The number of IR data points in each of 600 data boxes for a 30<br />
second scan on a 60 Hz system would be:<br />
----------------------------------------------<br />
Number of Samples<br />
data box<br />
60<br />
--------------------------<br />
samples 30<br />
-------------------------<br />
seconds 1 scan<br />
= × × ----------------------------------- =<br />
second scan 600 data boxes<br />
3<br />
-----------------------<br />
samples<br />
data box<br />
Table 1-6 Scan and Data Box Width Elements<br />
Function Structure Element <strong>Scanning</strong> <strong>Platform</strong><br />
Variable Name<br />
Current home scan limit<br />
KHEOS<br />
Current far scan limit<br />
KFEOS<br />
Hi res profile box width<br />
Minimum home edge-of-sheet<br />
LHEOS<br />
Max far edge-of-sheet<br />
LFEOS<br />
Box width multiplication<br />
factor<br />
Resolution selector<br />
Indexes into circular TBM<br />
buffers<br />
fsdi->heos<br />
(in A/D units)<br />
fsdi->feos<br />
(in A/D units)<br />
fsdi->ibxw<br />
(in A/D units scaled by 64)<br />
fsdi->minhl<br />
(in A/D units)<br />
fsdi->maxfl<br />
(in A/D units)<br />
fsdi->bxwmf[0-3]<br />
One factor for each of the 4<br />
resolutions:<br />
HI RES factor = 1<br />
each of the LO RES factors is<br />
a power of 2 (e.g. 2,4,8,16)<br />
ddi->ressel<br />
(Selects either the HI RES or<br />
one of the 3 LO RES)<br />
fddo->index[0-3]<br />
One index for each of the 4<br />
resolutions<br />
scanner->homeScanLimit<br />
(in customer units)<br />
scanner->farScanLimit<br />
(in customer units)<br />
scanner->dbWidth<br />
(in customer units)<br />
scanner->homeMeasureLimit<br />
pmmFrame->homeTrimLimit<br />
(in customer units)<br />
scanner->farMeasureLimit<br />
pmmFrame->farTrimLimit<br />
(in customer units)<br />
pmmSensor->resolution<br />
(resolution = ddi->ressel - 1)<br />
22 Selected Theories of Operation<br />
3BUS 208 055 R1101
PROPRIETARY DATA: This document contains proprietary data of ABB Inc. No disclosure, distribution (electronic or otherwise),<br />
reproduction, or other means of dissemination may be made without written permission.<br />
Time based measurement profile development in the <strong>Scanning</strong> <strong>Platform</strong> involves<br />
the following sequence of events:<br />
1. The pmmFrame object waits on the head position signal to be updated. This<br />
signal is updated with data from the ECF board every second (and contains 50<br />
or 60 data points).<br />
2. When the system is scanning, the logic sequences over each data point in the<br />
head position object determines which data box that head position value falls<br />
into. Whenever the calculated data box number changes, an entry<br />
corresponding to that data box number is put into the next consecutive cell of<br />
the box TBM circular buffer. Each consecutive head position signal that falls<br />
into the same data box is averaged together so that the average head position<br />
(for that data box) can be put into a corresponding cell of the position TBM<br />
circular buffer. The amount of time that was spent scanning each data box is<br />
put into a corresponding cell of the time TBM circular buffer. After processing<br />
the entire head position signal, the three circular buffers will all have been<br />
updated based upon the high resolution data box width. An index is kept that<br />
always indicates where data is being placed in the high resolution buffers. See<br />
Figure 1-5.<br />
FRAME:<br />
CIRCULAR BUFFERS (500 CELLS)<br />
Box 1 2 3 500<br />
Time<br />
Position<br />
SENSOR :<br />
Measurement<br />
indexes (points to current position in circular buffers)<br />
index [HI RES]<br />
x<br />
H<br />
index [LO RES 1]<br />
index [LO RES 2]<br />
index [LO RES 3]<br />
a<br />
b<br />
c<br />
H<br />
Note that the different resolution indexes point<br />
to different cell positions in the circular buffers.<br />
There is no relationship between these with<br />
respect to where they point.<br />
Figure 1-5 TBM Profiling Parameters (Sensor Measurement Using LO RES 1)<br />
3BUS 208 055 R1101<br />
Selected Theories of Operation<br />
23
PROPRIETARY DATA: This document contains proprietary data of ABB Inc. No disclosure, distribution (electronic or otherwise),<br />
reproduction, or other means of dissemination may be made without written permission.<br />
3. After the high resolution box buffer has been updated, calculations are made to<br />
determine the number of consecutive samples (in a data signal packet) that fall<br />
into each data box for each of the three lower data box width resolutions. Indexes<br />
for each of the lower resolution buffers are updated. This information is made<br />
available to each of the pmmSensor objects so that they can quickly process<br />
their measurement signals when they become available, and not have to<br />
recalculate which data box each sample falls into. Lower resolution data box<br />
widths are all a multiple of the high resolution data box width. A lower<br />
resolution box width can be calculated by multiplying the high resolution box<br />
width by the appropriate low resolution box width multiplication factor. A<br />
lower resolution data box will contain an even, integral number of high<br />
resolution data boxes, the number of which is equal to the box width<br />
multiplication factor (BXWMF). Box width multiplication factors are<br />
restricted to being powers of 2 (for example: 2, 4, 8, 16, 32). See Figure 1-6.<br />
RESOLUTION BXWMF<br />
DATA BOX NUMBERS<br />
a<br />
b<br />
HI RES<br />
LO RES (1)<br />
1<br />
2<br />
1 2 3 4 5 6 7 8 9 10 11 12 . . . . 599 600<br />
1 2 3 4 5 6 . . . . 300<br />
LO RES (2)<br />
4<br />
1<br />
2 3<br />
.<br />
.<br />
.<br />
150<br />
LO RES (3)<br />
8<br />
1<br />
2 . 75<br />
There is only one circular buffer for data box numbers, that of the HI RES. These data box numbers<br />
line up exactly with entries in the HI RES measurement arrays. To determine corresponding data box<br />
numbers for LOW RES measurement arrays, it is necessary to base these numbers upon the HI RES<br />
values. One must divide the HI RES data box number by the box width multiplication factor (BXWMF),<br />
realizing that a LOW RES data box will not be filled in until the completion of the data box.<br />
From the picture above:<br />
a The HI RES data box number would be 8;<br />
LOW RES (1) would be 4, LOW RES (2) would be 2, LOW RES (3) would be 1.<br />
b The HI RES data box number would be 10;<br />
LOW RES (1) would be 5, LOW RES (2) would be 2, LOW RES (3) would be 1.<br />
Figure 1-6 Data Box Relationships for Different Resolutions<br />
24 Selected Theories of Operation<br />
3BUS 208 055 R1101
PROPRIETARY DATA: This document contains proprietary data of ABB Inc. No disclosure, distribution (electronic or otherwise),<br />
reproduction, or other means of dissemination may be made without written permission.<br />
4. When the system is not scanning (for example, single point, dwelling at edgeof-sheet,<br />
standardizing, off-sheet) all measurement data points in a one second<br />
data packet are averaged together and put into a single cell of the TBM circular<br />
buffers. The time buffer would contain 1000 milliseconds, the box buffer would<br />
contain the negated data box number corresponding to the data box of the last<br />
piece of data in the data packet, and the position buffer would contain the<br />
average head position for the data packet. The system is operating in what is<br />
termed the TIME mode. When the system is scanning and comes to the edge<br />
of the sheet, zeros are put into a cell of every circular buffer (regardless of<br />
resolution). The system switches into the TIME mode at that time.<br />
5. There are two modes of operation with regards to how data is calculated and<br />
stored in the circular buffers: TIME mode and SPACE mode. When the system<br />
is actually scanning, the system is in the SPACE mode. At all other times, it is<br />
in the TIME mode.<br />
6. When in the SPACE mode, a unique cell is updated every time that the system<br />
scans over a different data box. Data box numbers are determined based upon<br />
the actual position of the head. When in the TIME mode, only one cell is<br />
updated each second. Data box numbers are either zero (if off-sheet), or the<br />
negative of the actual data box number. Transitions can occur in the middle of<br />
a data packet, for example: at edge-of-sheet, or at the beginning of a scan.<br />
Transitions that occur in the middle of a packet are processed in one mode until<br />
the transition and in the other mode after the transition.<br />
Profile Transmission to the Host Computer<br />
Transmission of the sensor profiles to the Host computer is done over a serial link<br />
operating normally at a 9600 baud rate. Where real time permits, this can be<br />
increased to 19200 baud. The actual transmission of the data involves the Host<br />
reading the fddo->index[0-3] variables every five seconds to determine the number<br />
of additional entries in the circular buffers (for each resolution) since the last time<br />
that the buffers were read. All new entries are then read for time, position, box<br />
number, and for each sensor’s measurement data. The time, position, and box<br />
number arrays are all high resolution buffers. The resolution of each of the sensors’<br />
measurement data arrays will be determined by the sensor’s ddi->ressel variable,<br />
which is sent down from the Host for each sensor. This variable selects the desired<br />
data box resolution for the sensor and is used in conjunction with the system’s box<br />
width multiplication factor that is sent down from the Host in the fsdi->bxwmf<br />
variable.<br />
fddo stands for frame dynamic data output to the Host. fsdi stands for frame static<br />
data input from the Host. ddi stands for (sensor) dynamic data input from the Host.<br />
3BUS 208 055 R1101<br />
Selected Theories of Operation<br />
25
PROPRIETARY DATA: This document contains proprietary data of ABB Inc. No disclosure, distribution (electronic or otherwise),<br />
reproduction, or other means of dissemination may be made without written permission.<br />
Profile Development in the 1190 Host Computer<br />
In the Host computer maximum scan limits are maintained which indicate the limits<br />
of displayed profiles. The closer these limits are to the actual scan limits means<br />
that more data is displayed. The number of data boxes included in a profile is<br />
determined by the box width variable that the Host sends down to the <strong>Scanning</strong><br />
<strong>Platform</strong> in its Frame Static Data area.<br />
Every five seconds, the Host reads a Frame Dynamic Data area from the <strong>Scanning</strong><br />
<strong>Platform</strong> to check four index counters (one for each of the possible data box<br />
resolutions). These index counters indicate where in the circular data buffers the<br />
last data has been entered by the <strong>Scanning</strong> <strong>Platform</strong>. The Host then reads all data<br />
from the circular buffer that has been updated since its last data read five seconds<br />
previously. This data includes platform data (box, position, and time) and<br />
measurement data from all of the sensors. Since the circular buffers contain data<br />
already averaged over the data box regions (one data box value per circular buffer<br />
cell) it is already in the form needed for display. Now, the Host has the capability<br />
to composite its profiles, if desired, before they are displayed. Compositing is based<br />
on an exponential averaging technique, which can place more or less importance<br />
upon the last scan (based upon selected filter factors).<br />
When the Host builds a profile for the previous scan, it looks at every data box in<br />
the scan checking for valid data. As long as every data box is valid, the scan can<br />
be composited with the previous composite scan and displayed. For those boxes<br />
which do not have valid data, the previous scan’s value for that data box is used as<br />
long as the previous value was valid. If the previous value was not valid, then that<br />
data box is marked invalid, which invalidates the entire scan. Invalid scans are not<br />
displayed.<br />
26 Selected Theories of Operation<br />
3BUS 208 055 R1101
PROPRIETARY DATA: This document contains proprietary data of ABB Inc. No disclosure, distribution (electronic or otherwise),<br />
reproduction, or other means of dissemination may be made without written permission.<br />
1190 Measurement Analysis using On-Line<br />
Utilities<br />
Introductory Comments<br />
Analysis of 1190 measurements at the <strong>Scanning</strong> <strong>Platform</strong> level involves<br />
examination of the TBM arrays which contain the data as it is delivered to an 1190<br />
host. There are two utilities available to examine this TBM data when it is in scaled<br />
integer format. Systems with an AccuRay Direct host interface will have the data<br />
in floating point format and cannot use these utilities. They must use the procedure<br />
found under the topic “Examining Floating Point TBM Arrays” on page 34.<br />
The tbmcu utility offers a way of seeing detailed data box values for each<br />
measurement selected. It will display measurement data in a side by side, parallel<br />
fashion, to facilitate the presence of spikes or other noise in specific data boxes.<br />
The sentest is another utility which provides a means of doing a quick quality<br />
assessment of the statistical content of both scan profiles and long-term stability.<br />
Both utilities are suitable for doing single point as well as scanning performance<br />
analysis.<br />
ABB Measurement Analysis Using the tbmcu Utility<br />
With release SP270.3, there is a utility to examine the TBM arrays on 1190 systems.<br />
In the past, examination of the TBM arrays required multiple steps to obtain the<br />
needed data. This utility simplifies the data extracting process, permitting quicker<br />
analysis of the arrays. The utility tbmcu is an interactive menu driven program. It<br />
provides access to the following TBM data:<br />
• All configured sensor measurements except for color<br />
• Data box numbers<br />
• Dwell time<br />
• Head position<br />
3BUS 208 055 R1101<br />
Selected Theories of Operation<br />
27
PROPRIETARY DATA: This document contains proprietary data of ABB Inc. No disclosure, distribution (electronic or otherwise),<br />
reproduction, or other means of dissemination may be made without written permission.<br />
There are separate start/stop commands so the user can manually control the<br />
collection period. The data collection buffer is able to hold up to 12 scans of data.<br />
When the display mode is selected, the initial selection menu is displayed showing<br />
what data has been collected. Note that there are two columns in front of each item,<br />
one for collection and one for display. After making the display selections, the<br />
utility then asks if you want to display one item at a time, or all together (side by<br />
side). If side by side is chosen, the display then presents a header, or index to the<br />
columnized data. The naming convention is “cu.xxxxx” where “xxxxx” is the item<br />
name. After each page of display (23 lines), type a carriage return to get the next<br />
page. All data is displayed in hex format. Zero data will indicate an edge of sheet<br />
occurrence. A value of “0x8000” in a measurement indicates invalid data. Edge<br />
of sheet measurements will always be shown as invalid. This SP270.3 version of<br />
the utility can only be used for integer TBM arrays. Use by the Chemical and<br />
Accuray Direct systems, which have floating point arrays, will have to wait for a<br />
later release. Those floating point arrays can be viewed using the Examine Floating<br />
Point TBM Arrays procedure. It should be noted that the procedural description<br />
given here is for a <strong>Scanning</strong> <strong>Platform</strong> connected to an 1190 host system. To use<br />
this utility in stand-alone, see the supplemental instructions in the Using tbmcu<br />
Utility in Stand-alone.<br />
When the utility is activated there are five commands presented in a menu:<br />
1. Select Arrays to Capture<br />
2. Start Data Capture<br />
3. Stop Data Capture<br />
4. Display Captured Arrays<br />
5. Quit<br />
The general sequence of operation is to first select the desired profile arrays along<br />
with support data such as head position, time in the data box, and/or data box number.<br />
An example of this menu is shown in Table 1-7.<br />
28 Selected Theories of Operation<br />
3BUS 208 055 R1101
PROPRIETARY DATA: This document contains proprietary data of ABB Inc. No disclosure, distribution (electronic or otherwise),<br />
reproduction, or other means of dissemination may be made without written permission.<br />
Table 1-7 Example of “Select Arrays to Capture”<br />
Item<br />
Selected for<br />
Capture Display<br />
Array Description<br />
00 END SELECTION<br />
01 * Databox Number<br />
02 * Time in Databox<br />
03 Head Position<br />
04 * pmmBeta01<br />
05 pmmCaliper01<br />
06 pmmIR01<br />
07 * pmmAsh01<br />
* The asterisk is replaced by a smiling face on the profile display. The<br />
selection notation appears under the Capture column with the Display column<br />
being left blank. It will be filled out when the display function is selected later.<br />
In the above example, Basis Weight and Ash profiles were selected along with the<br />
data box number and the amount of dwell time in each box.<br />
After all the desired selections have been made and the select command function<br />
exited (by entering item “0”), start the data collection by selecting Start Data<br />
Capture. If the system is under host control, each edge of sheet will be noted by<br />
an incremental counter called Edges-of-Sheet Detected=. The utility will collect<br />
up to 12 scans of data, after which a wraparound message will appear at each<br />
subsequent edge of sheet indicating that the buffer is full.<br />
The decision to stop data collection can be issued at any time. At this point, the<br />
data can then either be viewed immediately, or the utility exited and re-entered at<br />
a later time. The profile array data and box position/number data is stored as<br />
individual cu.xxxx binary files in the /ss01 directory so that collected data from the<br />
most recent activity is always available. It should be noted that the files are not<br />
readily useable in a spread sheet. If a spread sheet analysis is desired, it is<br />
recommended that while the display is being brought to the screen, the disk logging<br />
function (F3) be activated so that an ASCII file can be created on the workstation<br />
hard disk.<br />
The display function has two options. The data can be brought to the screen in a<br />
serial fashion, displaying each cu.xxxx file separately, or the presentation can be a<br />
parallel one in which all the files are arranged side by side. This is particularly<br />
useful if looking for common points of interest in the profiles. The first step in<br />
getting the data displayed is to select the desired files. This is done through a similar<br />
menu as was used to set up the collection in the first place. The menu is displayed<br />
identifying the selections made initially. Any combination of collected data may<br />
be selected for display. As each item is selected, a second selection notation (*) is<br />
shown under the Display column. Table 1-8 is an example.<br />
3BUS 208 055 R1101<br />
Selected Theories of Operation<br />
29
PROPRIETARY DATA: This document contains proprietary data of ABB Inc. No disclosure, distribution (electronic or otherwise),<br />
reproduction, or other means of dissemination may be made without written permission.<br />
Table 1-8 Example of “Display Captured Arrays”<br />
Item<br />
Selected for<br />
Capture Display<br />
Array Description<br />
00 END SELECTION<br />
01 ** Databox Number<br />
02 * Time in Databox<br />
03 Head Position<br />
04 * * pmmBeta01<br />
05 pmmCaliper01<br />
06 pmmIR01<br />
07 * pmmAsh01<br />
* The asterisk is replaced by a smiling face on the profile display.<br />
After exiting the display selection menu, an interactive sequence continues as the<br />
display format is being defined.<br />
1. Print arrays one at a time<br />
2. Print arrays together<br />
Enter: 2<br />
TBM Display<br />
TBM Synchronized Display<br />
Column File Name<br />
1 /ss01/cu.boxnum<br />
2 /ss01/cu.Beta01<br />
30 Selected Theories of Operation<br />
3BUS 208 055 R1101
PROPRIETARY DATA: This document contains proprietary data of ABB Inc. No disclosure, distribution (electronic or otherwise),<br />
reproduction, or other means of dissemination may be made without written permission.<br />
The utility will ask if data is to be paged. Answer yes (y) if you want to see the<br />
data a screen full at a time. Answer no (n) to have the display continuously scroll<br />
until the end of available data.<br />
Enter: c to continue; q to stop display: c<br />
01f3 0288<br />
01f2 0287<br />
01f1 0289<br />
01f0 0289<br />
01ef 028a<br />
•<br />
•<br />
•<br />
01db 0287<br />
01da 0287<br />
01d9 0285<br />
01d8 0288<br />
01d7 0287<br />
The data is displayed in hex format. If paging was requested, a carriage return must<br />
be pressed to bring up the next page of data. After all the data has been displayed,<br />
the utility may be exited by selecting Quit from the main menu.<br />
Using tbmcu Utility in Stand-alone<br />
In a stand-alone situation, where there is no host connected, the tbm buffers will<br />
not update on their own. It is possible to use the utility under these conditions,<br />
where the scanner is operating under either Health Page Control, or in the noMini<br />
mode. To activate the TBM arrays, proceed as follows:<br />
1. In the avos shell, change the forceMode.s flag to a 1:<br />
mm forceMode.s /X<br />
2. In the inspect utility, change the compositeScaleFactor value in each desired<br />
pmm sensor object from a 0 to a 10. For example:<br />
pmmBeta01->compositeScaleFactor=10<br />
3. Start scanning activity.<br />
Activate the tbmcu utility following the instructions given earlier in this section.<br />
3BUS 208 055 R1101<br />
Selected Theories of Operation<br />
31
PROPRIETARY DATA: This document contains proprietary data of ABB Inc. No disclosure, distribution (electronic or otherwise),<br />
reproduction, or other means of dissemination may be made without written permission.<br />
Converting tbmcu Files for Spreadsheet Analysis<br />
The tbmcu utility creates one binary file in the /ss01/clm directory for each selected<br />
parameter. Each file is sized at 12,288 bytes. These files are identified by the root<br />
name cu. with extensions showing the particular parameter. In their binary state,<br />
these files can only be used by the utility in its display function. In order to have<br />
these files be available for spreadsheet analysis, it is necessary to move them into<br />
a PC environment and convert them into ASCII files. This can be done using a DOS<br />
utility call cvtbm.exe found in the \ACE2 directory of the workstation (release<br />
SP280.3 and later). For convenience, it might be helpful to place this utility in the<br />
workstation’s \DOS directory so that the conversion activity can take place in any<br />
desired directory.<br />
Since the cu. file extensions are more than three characters, it will be necessary to<br />
rename the files before the gonzo transfer takes place. A convenient way to do this<br />
is to reverse the extension and root so that, as an example, cu.boxnum becomes<br />
boxnum.cu. On some sensors, where the extension is greater than eight characters,<br />
it may be necessary to abbreviate the sensor name. Having all the files with a<br />
common extension; i.e. .cu, makes the file transfer to the workstation a little easier.<br />
Use the gonzo utility to transfer the files as follows:<br />
1. Make the file directory active; type:<br />
cd /ss01/clm<br />
2. Activate gonzo by pressing F6.<br />
3. Select directory where files are to reside:<br />
w (directory path)<br />
4. Transfer the files:<br />
r cu.*<br />
The conversion utility can now be used to change each binary file into a column of<br />
ASCII floating point numbers. The operation of the conversion utility takes the<br />
following format:<br />
cvtbm srcFile destFile scaleFactor<br />
Where:<br />
srcFile = the binary .cu source file<br />
destFile = the new ASCII file to be created<br />
scaleFactor = the measurement scale factor of the data that was collected.<br />
See Table 1-9 on page 33 for values to use.<br />
32 Selected Theories of Operation<br />
3BUS 208 055 R1101
PROPRIETARY DATA: This document contains proprietary data of ABB Inc. No disclosure, distribution (electronic or otherwise),<br />
reproduction, or other means of dissemination may be made without written permission.<br />
Table 1-9<br />
Variable<br />
Value<br />
cu.boxnum 1<br />
cu.time 1<br />
cu.hp 100<br />
cu.sensor Use measurementScaleFactor found in the pmm interface object.<br />
The format shown above assumes that the cvtbm.exe utility has already been placed<br />
in the \DOS directory. If not, the complete path name of the utility will have to be<br />
included unless the data files are in the same location.<br />
The ASCII file for each parameter can be ported into a spreadsheet, taking care to<br />
maintain the start of each file in the same row. This is because the data in the files<br />
was collected at the same time in parallel, so that, for example, the first element in<br />
cu.boxnum, matches the first element in cu.Beta01 with regard to time collected.<br />
Starting the data for each parameter in the same row will properly line up and relate<br />
measured data to a box number or head position or any of the other collected data.<br />
The following will assist in interpreting the floating point data. ALL analysis should<br />
be done using the databox number as a referee to determine where scans start and<br />
end, and where the edge of sheet dwell times are. The data box column being the<br />
key then, here is what will be found in there:<br />
Table 1-10<br />
sequential numbers These are the data box numbers, ascending for a<br />
forward scan and descending for a reverse scan.<br />
zero<br />
The notification that edge-of-sheet has been reached.<br />
There should only be one at the end of each scan. More<br />
than one indicates instability at the edge position.<br />
negative numbers These occur in conjunction with the edge-of-sheet and<br />
are actually considered a single point positions with<br />
valid measurement data associated with each number.<br />
They will occur after each zero value. The more there<br />
are, the longer the dwell time is.<br />
-32768 This is invalid data. It appears for all measurements<br />
when the head goes off-sheet for any reason. It also<br />
appears in the measured data when the edge-of-sheet<br />
notification is received. At that point in time, the<br />
measurement data is invalid.<br />
Use of a spreadsheet to analyze the tbmcu data is left to the expertise and creativity<br />
of the user.<br />
3BUS 208 055 R1101<br />
Selected Theories of Operation<br />
33
PROPRIETARY DATA: This document contains proprietary data of ABB Inc. No disclosure, distribution (electronic or otherwise),<br />
reproduction, or other means of dissemination may be made without written permission.<br />
Examining Floating Point TBM Arrays<br />
This procedure is designed to examine the raw data being sent to the AccuRay Direct<br />
DCS system from a <strong>Scanning</strong> <strong>Platform</strong>. The general approach will be to establish<br />
a shell script which will take a snapshot of the fbox and tbmf arrays in the <strong>Scanning</strong><br />
<strong>Platform</strong> when the script is activated. The captured arrays can then be printed out<br />
and examined. fbox reports the data box activity, and tbmf contains the<br />
corresponding sensor data. There is a separate tbmf array for each sensor. Each<br />
tbmf array contains 500 floating point elements in a rotating buffer. That means<br />
that with a 600 data box profile, the buffer will contain 500 data boxes of<br />
information. With a 30 second scan, it will take about 25 seconds for the buffer to<br />
rotate.<br />
1. Locate the 0xaddress for the tbmf and fbox arrays using the inspect utility as<br />
follows:<br />
pmmFrame->fbox<br />
pmmCaliper01->tbmf<br />
pmmIR01->tbmf<br />
pmmBeta01->tbmf<br />
etc. for each sensor in the configuration<br />
The response to each of the above commands will be a 0xaddress. Note the<br />
address part, leaving off the 0x. For other sensors, use the :glob command to<br />
find their global names.<br />
2. Change the working directory to /ss01, and create the following script using the<br />
edit utility:<br />
ed<br />
a<br />
md (address of fbox) 50(10x) > /ss01/fbox<br />
md (address of caliper tbmf) 50(10f) > /ss01/ctbmf<br />
md (address of IR tbmf) 50(10f) > /ss01/itbmf<br />
md (address of beta tbmf) 50(10f) > /ss01/btbmf<br />
etc. for each additional sensor.<br />
w t<br />
q<br />
This will create a script file called “t” in the /ss01 directory.<br />
3. As the frame is scanning, execute the script. To execute the script, make sure<br />
the working directory is /ss01, then type:<br />
. t<br />
34 Selected Theories of Operation<br />
3BUS 208 055 R1101
PROPRIETARY DATA: This document contains proprietary data of ABB Inc. No disclosure, distribution (electronic or otherwise),<br />
reproduction, or other means of dissemination may be made without written permission.<br />
4. Print out the arrays as follows:<br />
cat fbox<br />
cat ctbmf<br />
cat itbmf<br />
cat btbmf<br />
etc..<br />
5. Examine the arrays as follows:<br />
The fbox array will show the position of the first data box after the scan starts.<br />
This will generally be the first location after a series of FFFF and Fxxx data<br />
values. The FFFF indicates off sheet and prepare to measure times. The Fxxx<br />
identifies valid data made available while the head is waiting for a scan enable<br />
command. The actual box numbers will be in hex notation. All fbox and tbmf<br />
arrays captured by the shell script will have their data in the same index position<br />
within the array.<br />
Invalid data within the tbmf arrays will have a very large negative number.<br />
Edge of sheet dwell times will mark the data value as zero for one box. Then,<br />
until the head starts to scan again, the data will be invalid and should be the<br />
same as the values shown in the fbox array. These will not be data boxes but<br />
will represent a single point value. Other times invalid data will appear, are<br />
those times when the head is in prepare-to-measure mode (coming on sheet),<br />
or one second after receiving a prepare to go off sheet command.<br />
1190 Measurement Analysis Using sentest Utility<br />
With Software Release 280.2, there is a utility available to provide a quality analysis<br />
of profile or single point data using the reporting of statistical parameters. The<br />
utility has two modes of operation. One is to report on profile quality, and the other<br />
is to report on single point drift. Each mode has a unique report presentation. In<br />
both cases, however, the statistical parameters of mean, hi, lo, p-p, and 2-sigma,<br />
are provided.<br />
Perform the following steps to get a report:<br />
1. Activate the utility by typing sentest at the AVOS prompt.<br />
2. Select command 1, Select Sensors to Test, from the main menu.<br />
3. The display will show all the available measurements which may be tested in<br />
the form of pmmSensor. Select the desired assortment of measurements to be<br />
tested by entering the associated number.<br />
4. When all desired measurements have been selected, terminate the selection<br />
process by entering a 0.<br />
Note:<br />
At this time (Software Release 280.2), the Change Peak-to-Peak<br />
Limits selection is not functional. This will be addressed in a later<br />
release.<br />
3BUS 208 055 R1101<br />
Selected Theories of Operation<br />
35
PROPRIETARY DATA: This document contains proprietary data of ABB Inc. No disclosure, distribution (electronic or otherwise),<br />
reproduction, or other means of dissemination may be made without written permission.<br />
5. Set the scanner in the mode desired, either scanning or in single point.<br />
6. Select either Start Drift Test, or Start Profile Test as desired. If Start Profile<br />
Test was selected, the reports will print out automatically after each scan and<br />
a summary after 10 scans. If Start Drift Test was selected, a report will be<br />
issued after each minute of operation.<br />
7. When the Drift test has run for as much time as desired, select Print Drift Test<br />
Summary. This willl terminate the collection process and cause the report to<br />
be printed.<br />
8. Select Quit to exit the utility.<br />
The following are examples of the two reports available.<br />
Profile Data<br />
As the sentest utility collects profile data, it will display an individual report as each<br />
scan is accomplished. When the 10 scans have been completed, a summary report<br />
will be displayed showing the individual scan values of all sensors selected. Make<br />
sure that the Disk Logging function is turned and that the destination file is unique<br />
(i.e., profile.log) and empty initially, so that when the summary report is requested<br />
it can be saved in a file. The summary data is displayed on a per sensor basis in the<br />
following format:<br />
Scan * 1 2 ----- 9 10<br />
High ...... ...... ...... ...... ......<br />
Low ...... ...... ...... ...... ......<br />
Mean ...... ...... ...... ...... ......<br />
p-p ...... ...... ...... ...... ......<br />
2SIGMA ...... ...... ...... ...... ......<br />
%Inv ...... ...... ...... ...... ......<br />
High Low Avg P-P<br />
Trend ...... ...... ...... ......<br />
Composit<br />
e<br />
...... ...... ...... ......<br />
Trend is the variation seen in the Mean which is calculated for each scan.<br />
Composite is a 10-scan filtering of the profile data for all the scans. Compare each<br />
sensor’s limits to the collected data.<br />
36 Selected Theories of Operation<br />
3BUS 208 055 R1101
PROPRIETARY DATA: This document contains proprietary data of ABB Inc. No disclosure, distribution (electronic or otherwise),<br />
reproduction, or other means of dissemination may be made without written permission.<br />
Single Point Drift Data<br />
The sentest utility drift test summary report for all selected sensors will be presented<br />
in the following format:<br />
Drift Test Summary<br />
Run Time: xx Minutes<br />
P-P 2SigmaMax 2SigmaMean MeanVarn Sensor<br />
p-p gives the peak-to-peak variation of one-minute averages during the test;<br />
mean var gives a 2-sigma calculation on the one-minute averages.<br />
2SigmaMax is the maximum noise value during any one-minute interval;<br />
2SigmaMean is the average of the noise during the collection period.<br />
3BUS 208 055 R1101<br />
Selected Theories of Operation<br />
37
PROPRIETARY DATA: This document contains proprietary data of ABB Inc. No disclosure, distribution (electronic or otherwise),<br />
reproduction, or other means of dissemination may be made without written permission.<br />
Profile Development for 1180 Systems<br />
Profile Transmission and Development<br />
This section contains information on how the <strong>Scanning</strong> <strong>Platform</strong> software produces<br />
profiles, how they are transmitted to the minicomputer, and how the Host computer<br />
displays the data.<br />
The <strong>Scanning</strong> <strong>Platform</strong> software provides for a maximum of 480 single scan (no<br />
composite) data boxes. The number is determined by the variable MBOXES in the<br />
Host Computer. An initialization task at startup calculates the starting, ending, and<br />
box width in both computers.<br />
The width of the data boxes in the <strong>Scanning</strong> <strong>Platform</strong> and the host computer are the<br />
same, with a value calculated and provided by the host. A maximum number of<br />
data boxes can be displayed if the current scan limits are made equal to the maximum<br />
measure limits. Due to round off errors in converting from integer to floating point<br />
of the box width variation, the maximum number of boxes for display may be less<br />
than the system defined number of boxes. It is important that the maximum scan<br />
limits (LFEOS and LHEOS) be set to the maximum trim of the machine. If this<br />
is not done, the operator will lose the perspective on which slice screw represents<br />
which area of the profile. As the current scan limits are moved inward (KFEOS<br />
and KHEOS), the number of profile boxes displayed will be reduced proportionally<br />
to the decrease in sheet width. Whenever the number of defined data boxes is an<br />
integer multiple of 60, the host display will resize to fill the allotted profile space.<br />
38 Selected Theories of Operation<br />
3BUS 208 055 R1101
PROPRIETARY DATA: This document contains proprietary data of ABB Inc. No disclosure, distribution (electronic or otherwise),<br />
reproduction, or other means of dissemination may be made without written permission.<br />
Profile Development in the <strong>Scanning</strong> <strong>Platform</strong><br />
Placing the measurement data received from the various sensor objects in a profile<br />
array requires first that an appropriate array receptacle be built to contain the data.<br />
This is done each time a PMMRLD command is issued and the frame static data<br />
input fields get updated from the Host Computer. Information shown in Table 1-7<br />
is received in the static data input specification table (fsdi) in the pmmFrame01<br />
object, and is used to construct the profile array in customer units.<br />
Table 1-11 Box and Zone Relationships to the Process<br />
<strong>Scanning</strong> <strong>Platform</strong><br />
Function<br />
fsdi Variable Name Variable Name<br />
Current home scan limit heos homeScanLimit<br />
Current far scan limit feos farScanLimit<br />
Std. profile box width<br />
ibxw<br />
First zone box boundary fznb<br />
Zone width in boxes<br />
znwd<br />
Minimum home edge-of-sheet minhl homeMeasureLimit<br />
Maximum far edge-of-sheet maxfl farMeasureLimit<br />
Number of logical zones nlogz<br />
Number of std. boxes<br />
stdProfDataPts<br />
3BUS 208 055 R1101<br />
Selected Theories of Operation<br />
39
PROPRIETARY DATA: This document contains proprietary data of ABB Inc. No disclosure, distribution (electronic or otherwise),<br />
reproduction, or other means of dissemination may be made without written permission.<br />
Figure 1-7 shows the headbox to profile relationships in a graphic format.<br />
Headbox<br />
Maximum Slice<br />
0 vdc<br />
approx<br />
1000 A/D<br />
homeTravelLimit<br />
homeMeasureLimit<br />
(minhl)<br />
Maximum Head Position Range<br />
Maximum Head Position Readings<br />
Maximum Trim<br />
10.0 vdc<br />
approx<br />
31267 A/D<br />
farTravelLimit<br />
farMeasureLimit<br />
(maxfl)<br />
homeScanLimit<br />
(heos)<br />
Scan Limits<br />
farScanLimit<br />
(feos)<br />
homeEOS<br />
EOS Positions<br />
(same as above if no AEOS)<br />
farEOS<br />
POBOX (firstMiniBox)<br />
PLBOX (lastMiniBox)<br />
1 2 3 - - - - - - - - - - - - - - 477 478 479 480<br />
_Profile<br />
<strong>Scanning</strong> <strong>Platform</strong><br />
Mini Profile Ptr.<br />
1 2 3 - - - - - - - - - - - - - - 477 478 479 480<br />
Mini-Access Profile<br />
Updated<br />
at zone<br />
boundaries<br />
MOBOX<br />
MLBOX<br />
1 2 3 - - - - - - - - - - - - - - 477 478 479 480<br />
Actual Minicomputer Profile<br />
BXFOF<br />
BXLOF<br />
1 2 - - 120<br />
1 2 - - 120 1 2 - - 120 1 2 - - 120<br />
Log Zone #1<br />
Log Zone #2 Log Zone #3 Log Zone #4<br />
Figure 1-7 Sheet Width and Profile Relationships<br />
40 Selected Theories of Operation<br />
3BUS 208 055 R1101
PROPRIETARY DATA: This document contains proprietary data of ABB Inc. No disclosure, distribution (electronic or otherwise),<br />
reproduction, or other means of dissemination may be made without written permission.<br />
As a part of the edge change or scan width adjustment activities, the <strong>Scanning</strong><br />
<strong>Platform</strong> software identifies the head position boundaries of each data box in<br />
customer units. This is based on the head position calibration done using the frame<br />
tuning utility ft. Then, as each measurement data point is received with its<br />
associated head position, the profile routine stuffs the data into the correct box,<br />
averaging it in with the previous data points in the box. The boxes of averaged<br />
signals are then delivered to the MPRC board processing where the boxes are<br />
converted into sensor measurements. To provide standard profiles free from data<br />
aliases for use in both display and process control, it is important that each data box<br />
contain at least three or four samples or data points. This can be controlled by<br />
proper setup of scan speed in conjunction with the sensor sample rate and the number<br />
of data boxes. Sampling rates for all sensors except for IR are 1000 samples per<br />
second. For IR, the rate is dependent on the line frequency.<br />
For all sensors except IR and Color, use the following equation:<br />
z samples -------------------- 1000 samples -------------------- x--------------------<br />
seconds 1<br />
=<br />
× × -----------------------------<br />
databox seconds scan<br />
y databoxes --------------------------<br />
scan<br />
Equation 1-3<br />
For IR and Color sensors, use the following equation:<br />
z samples -------------------- = hHz × x--------------------<br />
seconds<br />
databox<br />
scan<br />
Equation 1-4<br />
1<br />
× -----------------------------<br />
y databoxes --------------------------<br />
scan<br />
Example: The number of IR data points in each of 600 data boxes for a 30<br />
second scan on a 60 Hz system would be:<br />
Number<br />
----------------------------------------------<br />
of Samples<br />
data box<br />
60<br />
--------------------------<br />
samples 30<br />
-------------------------<br />
seconds 1 scan<br />
= × × ----------------------------------- =<br />
second scan 600 data boxes<br />
3<br />
-----------------------<br />
samples<br />
data box<br />
3BUS 208 055 R1101<br />
Selected Theories of Operation<br />
41
PROPRIETARY DATA: This document contains proprietary data of ABB Inc. No disclosure, distribution (electronic or otherwise),<br />
reproduction, or other means of dissemination may be made without written permission.<br />
Accessing 1180 MICRO Profile Data Inside the <strong>Scanning</strong><br />
<strong>Platform</strong><br />
The <strong>Scanning</strong> <strong>Platform</strong> 1180M interface for each sensor (pmmBeta01, pmmIR01,<br />
and so forth) creates an instance of profiler each time the system is started up.<br />
Contained within the profiler object, are the instance variables _profile and<br />
_nSamples. _profile is the 480 data box array where the profile data is accumulated.<br />
Each element in the array represents a data box and contains two components, V1,<br />
which is the floating point value of the data box, and V2, a time stamp in<br />
milliseconds. The number of data boxes available to be used is defined by the<br />
1180M host. The defined boxes are equally divided between the home and far<br />
measure limits (LHEOS and LFEOS). The first element in the array which contains<br />
data is defined by the current home scan limit, KHEOS. The actual head position<br />
in customer units for this box can be found in the header information of _profile<br />
under the instance variable name startingPosition. The width of the box (and all<br />
subsequent boxes) is given in samplingInterval. The number of boxes with data<br />
is of course defined by the actual scanned area (KHEOS and KFEOS). An example<br />
of the profiler object display in the inspect utility is shown in Figure 1-8.<br />
42 Selected Theories of Operation<br />
3BUS 208 055 R1101
PROPRIETARY DATA: This document contains proprietary data of ABB Inc. No disclosure, distribution (electronic or otherwise),<br />
reproduction, or other means of dissemination may be made without written permission.<br />
pmmBeta01->profiler<br />
| profiler: 0x391f56 (hid)<br />
I>0x391f56 (Bolded line is a typed command)<br />
0x391f56 (id)<br />
|-------------------<br />
| 0x39156: “0x39156” (struct _PRIVATE)<br />
| isa: PmmProfiler (struct _SHARED *)<br />
| mySelf: 0x39156 (long)<br />
| dataProtected: 0 ‘\0’ (char)<br />
| index(): 0x2279c2 (hid)<br />
| measurementName: 0x393696 (id)<br />
| _measurementSignal: 0x393736 (id)<br />
| _nSamples: 0x393e96 (id)<br />
| _profile: 0x391fb6 (id)<br />
| profilingProcess: 0x3936d6 (id)<br />
| resetProfile: 0 ‘\0’ (char)<br />
| updateProfile: 0 ‘\0’ (char)<br />
| suspended: 0x1 ‘\1’ (char)<br />
| waitingToFree: 0 ‘\0’ (char)<br />
| validityAcceptanceMask 0xffff (short)<br />
| initializeMiniProfile: 0 ‘\0’ (char)<br />
| pmmProfileProcessing: 0 ‘\0’ (char)<br />
| pmmProfileReset: 0 ‘\0’ (char)<br />
| customerUnitsConversion: 0.614452 (double)<br />
| measurementScaleFactor: 100 (double)<br />
| processingRequestor: 0 (id)<br />
| firstBoxToCheck: 0 (short)<br />
| invalidBoxes: 0 (short)<br />
| lastBoxToCheck 0 (short)<br />
| miniProfilePtr: 0x36566c (struct PROFILE_DATA *)<br />
| scanMinBox: 0 (short)<br />
| scanMaxBox: 0 (short)<br />
| -------------------<br />
Figure 1-8 profiler object display<br />
3BUS 208 055 R1101<br />
Selected Theories of Operation<br />
43
PROPRIETARY DATA: This document contains proprietary data of ABB Inc. No disclosure, distribution (electronic or otherwise),<br />
reproduction, or other means of dissemination may be made without written permission.<br />
Profile data is placed into the _profile array in the following manner. At the start<br />
of each scan, the array is cleared (all zeros). Then, as the head starts the transition<br />
across the sheet, the data boxes are updated with the latest measurement. Each time<br />
a logical zone is crossed, the data from the completed zone is copied into the miniaccess<br />
area array. The complete profile of the scan in this array, is only available<br />
for the short time between the ending of the scan and the clearing of the array prior<br />
to starting the next scan.<br />
The mini-access area in the <strong>Scanning</strong> <strong>Platform</strong> is located from the miniProfilePtr<br />
pointer in the profiler object display. This pointer is the starting address of a 480<br />
box array. Access to this array is through use of the md utility (memory display).<br />
In this array, the unused data boxes, those outside the current scan limit range, are<br />
populated with the value of the end data boxes. This means that the data box average<br />
in the box associated with the home scan limit, will be used to fill all those boxes<br />
which occur between the home measure limit and the home scan limit. Likewise,<br />
the box average associated with the far scan limit, will be used to populate the unused<br />
boxes between the far measure limit and the far scan limit. It should also be noted<br />
that there is no clearing of the array after each scan. This means that it is possible<br />
to look at the array when, for example, it contains zone one and two data for the<br />
forward scan while zones three and four contain data for the reverse scan. Therefore<br />
to get a snapshot of the current scan profile, the printing out of the array should be<br />
done at the end of the scan and not during it. One technique might be to take the<br />
head off sheet at the end of the scan, then print out the data.<br />
Displaying the Mini-Access Profile Array<br />
1. Obtain the 0xaddress of the miniProfilePtr pointer from the profiler object<br />
display. See Figure 1-8 on page 43.<br />
2. Exit the inspect utility.<br />
3. In the avos shell ($$), type the following command. Do not include the 0x in<br />
the address from step 1:<br />
md address 48(10d)<br />
44 Selected Theories of Operation<br />
3BUS 208 055 R1101
PROPRIETARY DATA: This document contains proprietary data of ABB Inc. No disclosure, distribution (electronic or otherwise),<br />
reproduction, or other means of dissemination may be made without written permission.<br />
Profile Transmission to a Host Computer<br />
Transmission of the sensor profiles up to the Host Computer is done over a serial<br />
link operating normally at a 9600 baud rate. Where real time permits, this can be<br />
increased to 19200 baud.<br />
The actual transmission of the data involves breaking up the profiles into logical<br />
zones. As each zone is built in the <strong>Scanning</strong> <strong>Platform</strong>, that portion of the array is<br />
then transmitted to the Host. There can be anywhere from four to six logical zones.<br />
The number is determined in the minicomputer by a variable called NCZONE<br />
(number of control zones). This variable defines how often during the scan that<br />
machine direction control actions are taken. The number of logical zones needs to<br />
have an even integer relationship to NCZONE. See Table 1-12 for the relationships.<br />
The number of logical zones (NLZONE) computed from the number of control<br />
zones (NCZONE).<br />
Table 1-12 Control Zone Versus Logical Zone Relationship<br />
NCZONE<br />
NLZONE<br />
1 4<br />
2 4<br />
3 3<br />
4 4<br />
5 5<br />
6 6<br />
These logical zone determinations are established in the Host Computer and sent<br />
down to the <strong>Scanning</strong> <strong>Platform</strong> software at PMMRLD time via the fsdi specification<br />
table as variable nlogz. The zone calculations performed in the Host Computer are<br />
shown in Table 1-13.<br />
3BUS 208 055 R1101<br />
Selected Theories of Operation<br />
45
PROPRIETARY DATA: This document contains proprietary data of ABB Inc. No disclosure, distribution (electronic or otherwise),<br />
reproduction, or other means of dissemination may be made without written permission.<br />
Table 1-13 Data Box Calculations in the 1180 MICRO<br />
Host ComputerProfile<br />
Variable Calculation Comments<br />
IBOXW (LFEOS-LHEOS)/MBOXES Independent for Data box width (round<br />
up) each frame in A/D units<br />
POBOX [(KHEOS-LHEOS)/IBOXW]+1 Calculated at First data box restart and<br />
when with sensor data scan limits are<br />
changed<br />
PLBOX [(KFEOS-LHEOS)/IBOXW]+1 Calculated at First data box restrart and<br />
when with sensor data scan limits are<br />
changed<br />
PFBOX =1 Defined profile First defined start data<br />
box in AAM<br />
MOBOX POBOX-PFBOX+1 First actual data box in Host Computer<br />
MLBOX MOBOX+PLBOX-POBOX Last actual data box in Host Computer<br />
KBOX MLBOX-MOBOX +1 Host Computer Number of boxes<br />
profile in Host Computer<br />
Profile Development within the Host Computer<br />
The Host Computer performs a variety of calculations at both system restart (of the<br />
Host) and when scan limits are changed. These calculations are to determine the<br />
profile alignment between the process, the <strong>Scanning</strong> <strong>Platform</strong> software, and the user<br />
display. There are two aspects to this process. The first is to determine the data<br />
positioning within the profile along with the dimensional aspects of the profile<br />
boxes. The second item is to calculate the partitioning of the profile into logical<br />
zones and their associated parameters. Zone partitioning is used to accommodate<br />
data transmission constraints, and to permit multiple machine direction control<br />
actions within a scan by calculating moving averages as the profile develops on a<br />
logical zone basis.<br />
46 Selected Theories of Operation<br />
3BUS 208 055 R1101
PROPRIETARY DATA: This document contains proprietary data of ABB Inc. No disclosure, distribution (electronic or otherwise),<br />
reproduction, or other means of dissemination may be made without written permission.<br />
Data Box Collection Calculation<br />
Data box calculations use coldstart entries of LHEOS, LFEOS, KHEOS, KFEOS,<br />
NCZONE, and MBOXES to determine the following series of variables. These<br />
variables are generally local variables within the computing program and are not<br />
necessarily available for examination. Table 1-13 contains a description of the<br />
calculations made for each variable. Figure 1-7 shows the relative location of each<br />
data box.<br />
1. Data box width (IBOXW)<br />
2. First data box with sensor data (POBOX)<br />
3. Last data box with sensor data (PLBOX)<br />
4. First defined data box in AAM (PFBOX)<br />
5. First actual data box in Host (MOBOX)<br />
6. Last actual data box in Host (MLBOX)<br />
7. The number of boxes in Host (KBOX)<br />
3BUS 208 055 R1101<br />
Selected Theories of Operation<br />
47
PROPRIETARY DATA: This document contains proprietary data of ABB Inc. No disclosure, distribution (electronic or otherwise),<br />
reproduction, or other means of dissemination may be made without written permission.<br />
Logical Zone Calculations<br />
The final step in completing the initialization and setup process involves<br />
determining the following set of logical zone calculations. As with the data box<br />
calculations, these are generally local variables and not available for examination.<br />
Table 1-14 describes the calculations.<br />
1. Number of logical zones (NLZONE)<br />
2. Zone size (LZNSIZ)<br />
3. Extra data boxes (NBOX)<br />
4. Last box offset in Host (BXLOF)<br />
5. First box offset in Host (BXFOF)<br />
6. First box of zone one (PZ1BX)<br />
7. Zone one box boundary (FZNB)<br />
Table 1-14 Logical Zone Calculations in the 1180 Host Computer<br />
Variable Calculation Comments<br />
LZNSIZ KBOX/NLZONE Zone size in data boxes<br />
(round up<br />
NBOX (LZXIZ)(NLZONE-KBOX) Number of boxes outside scan limits<br />
BXLOF<br />
NBOX<br />
Last box offset in Host Computer<br />
2<br />
BXFOF NBOX-BXLOF First box offset in Host Computer<br />
PX1BX POBOX-BXFOF Defines start of zone one First box of<br />
logical zone 1<br />
FZNB PZ1BX + (LZNSIZ-1) Defines limit of zone one Box number of<br />
all zones are same size zone one boundary<br />
48 Selected Theories of Operation<br />
3BUS 208 055 R1101
PROPRIETARY DATA: This document contains proprietary data of ABB Inc. No disclosure, distribution (electronic or otherwise),<br />
reproduction, or other means of dissemination may be made without written permission.<br />
Sensor Theory<br />
Sensor Processing Overview<br />
Sensor processing from signal to measurement is outlined in Figure 1-9. From this<br />
diagram, the transformation from raw signal to displayable measurement can be<br />
seen. The transformation process involves both hardware and software.<br />
Sensor<br />
Hardware<br />
Filter (ECF/<br />
ECS Board)<br />
Normalize<br />
(STDZ)<br />
Linearize<br />
(Nat. Log)<br />
Correct<br />
(Decouple)<br />
Convert<br />
(Calibrate)<br />
Compensate<br />
(External<br />
Dependencies)<br />
Fine Tune<br />
(Slope and<br />
Offset)<br />
Signal Input<br />
Processing<br />
(allocate<br />
databoxes)<br />
Sensor Processing<br />
(MPRC Board)<br />
Measurement Processing<br />
(MPRC Board)<br />
Measurement<br />
Display Via<br />
PMM Objects<br />
Figure 1-9 <strong>Scanning</strong> <strong>Platform</strong> Algorithm Processing<br />
All sensor signal processing can be broken down into three stages. These stages<br />
are input signal processing, signal processing, and measurement processing. These<br />
stages are in turn broken down into sub–functions which include filtering,<br />
normalizing, linearizing, correction, conversion, compensation, and fine tuning. It<br />
should be noted that not all sensors require each and every step.<br />
Filtering<br />
The filtering step is to improve the statistical nature of the incoming signal and is<br />
accomplished in <strong>Scanning</strong> <strong>Platform</strong> by providing a filter on the microcontroller<br />
ECS board. This filter provides an excellent frequency response while maintaining<br />
the signal information provided by the sensor. The filter time constant is selected<br />
based on the sampling rate of the particular sensor in question. At this time, the<br />
filtered sensor signals are averaged into the appropriate databox.<br />
Normalization<br />
The normalization step is used to adjust the signal level due to variations caused by<br />
components aging, environmental considerations, and sensor physical conditions.<br />
This is normally accomplished by applying an adjustment determined by the<br />
standardize process. Within <strong>Scanning</strong> <strong>Platform</strong>, most of the sensors provide the<br />
normalization stage by subtracting any zero offset introduced by the hardware and<br />
then by dividing the signal by the full scale range which was determined at<br />
standardize. Air profile compensation adjustments are also made at this stage when<br />
appropriate for the sensor.<br />
3BUS 208 055 R1101<br />
Selected Theories of Operation<br />
49
PROPRIETARY DATA: This document contains proprietary data of ABB Inc. No disclosure, distribution (electronic or otherwise),<br />
reproduction, or other means of dissemination may be made without written permission.<br />
Linearization<br />
The linearization stage performs the appropriate mathematical operation to form a<br />
linear sensor signal over the range of interest. This is required for about one half<br />
of the sensors and is done by taking the natural logarithm of the incoming signal.<br />
The output of the linearization stage is in general a signal which is directly related<br />
to some process characteristics and therefore is ready for conversion to a<br />
measurement.<br />
Correction<br />
The correction stage is required whenever there is adjustment to the signal for some<br />
mechanical or electrical variation. Currently, this is only true for the Brightness<br />
sensor in OptiPak where it needs to be adjusted for the sheet opacity. This is the<br />
last of the sensor dependent stages.<br />
Conversion<br />
The conversion stage provides the mathematical conversion from a signal to a<br />
measurement. The most common function at this stage is a polynomial curve-fit<br />
using from two to five coefficients. This is used for approximately three fourths of<br />
the sensors. Other sensors either use a direct mathematical conversion or require<br />
none at all.<br />
Compensation<br />
The compensation stage provides corrections determined by other external<br />
dependencies. This includes such things as window dirt accumulation, other sensor<br />
measurement effects, and one air gap temperature.<br />
Fine Tuning<br />
The fine tuning stage is the final step in the sensor algorithm processing and provides<br />
the last chance to adjust the measurement value to the other system modules,<br />
including display. This stage consists of a product code dependent slope and offset<br />
correction applied mathematically as mx+b. This stage is common to all sensor<br />
measurements.<br />
50 Selected Theories of Operation<br />
3BUS 208 055 R1101
PROPRIETARY DATA: This document contains proprietary data of ABB Inc. No disclosure, distribution (electronic or otherwise),<br />
reproduction, or other means of dissemination may be made without written permission.<br />
Sensor Input Signal Processing<br />
Having presented the general flow of signal to measurement processing, we now<br />
come to some specifics regarding the synchronization of signals with respect to<br />
each other within the <strong>Scanning</strong> <strong>Platform</strong> environment. Sensor processing in<br />
<strong>Scanning</strong> <strong>Platform</strong> software assumes that each sensor is an independent object with<br />
discrete input and output signals. See Figure 1-10.<br />
inputSignal A<br />
inputSignal B<br />
Sensor<br />
Object<br />
outputSignal<br />
Figure 1-10 Sensor Input/Output Signal Relationship<br />
Usually there are at least two input signals for a sensor, namely, head position and<br />
the sensor signal. The exact name for each input signal can usually be found in<br />
each sensor object as inputName or some similar variable. A sensor signal is<br />
frequently a double signal type (floating point) of object. Figure 1-11 shows an<br />
example of a printout of an input signal array which can be useful in troubleshooting<br />
any of these objects.<br />
3BUS 208 055 R1101<br />
Selected Theories of Operation<br />
51
PROPRIETARY DATA: This document contains proprietary data of ABB Inc. No disclosure, distribution (electronic or otherwise),<br />
reproduction, or other means of dissemination may be made without written permission.<br />
I> betaSensor01->inputSignal<br />
inputSignal: 0x367226 (hid)<br />
I> 0x367226 (id)<br />
|------------------------------------------------<br />
| 0x367226: “0x367226” (struct_PRIVATE)<br />
| isa: DoubleSignal (struct_SHARED *)<br />
| mySelf: 0x367226 (long)<br />
| capacity: 0x32 (int)<br />
| myName: 0x33f326 (id)<br />
| objectToken: 0x100012b (long)<br />
| dataToken: 0x100012c (long)<br />
| timeStamp: (struct_S_5)<br />
| status: 0 ‘\0’ (char)<br />
| subscribed: 0x1 ‘\1’ (char)<br />
| controlledAccess: 0 ‘\0’ (char)<br />
| reserved: 0 ‘\0’ (char)<br />
| owner: 0 (int)<br />
| dataType: 0x1 (short)<br />
| initOption: 0 (short)<br />
| ioPoint: 0x4c (id)<br />
| logicalChannel: 0x352546 (hid)<br />
| samplingInterval: 20 (double)<br />
| units: 0x33fb46 (id)<br />
| =====:0x367264 (struct NDXVAR [50])<br />
| [0]: (struct NDXVAR)<br />
| | V1: 3.68815 (double)<br />
| | V2: 0 0 (short)<br />
| | V3: 34883 0x86b3 (long)<br />
| [1]: (struct NDXVAR)<br />
| | V1: 3.6718 (double)<br />
| | V2: 0 0 (short)<br />
| | V3: 34533 0x86e5 (long)<br />
| [2]: (struct NDXVAR)<br />
| | V1: 3.65788 (double)<br />
| | V2: 0 0 (short)<br />
| | V3: 34583 0x8717 (long)<br />
| [3]: (struct NDXVAR)<br />
| | V1: 3.65324 (double)<br />
| | V2: 0 0 (short)<br />
| | V3: 34634 0x874a (long)<br />
| [4]: (struct NDXVAR)<br />
| | V1: 3.64618 (double)<br />
| | V2: 0 0 (short)<br />
| | V3: 37643 0x930b (long)<br />
| [5]: (struct NDXVAR)<br />
| | V1: 3.6729 (double)<br />
| | V2: 0 0 (short)<br />
| | V3: 37688 0x9338 (long)<br />
| [6]: (struct NDXVAR)<br />
| | V1: 3.67754 (double)<br />
| | V2: 0 0 (short)<br />
| | V3: 37732 0x9364 (long)<br />
Figure 1-11 Example Printout of Input Signal Array<br />
52 Selected Theories of Operation<br />
3BUS 208 055 R1101
PROPRIETARY DATA: This document contains proprietary data of ABB Inc. No disclosure, distribution (electronic or otherwise),<br />
reproduction, or other means of dissemination may be made without written permission.<br />
The following explains some key elements of the inputSignal array.<br />
1. Capacity - The total size of this array; typically this will be the most recent 60<br />
data points (0x3c in hex).<br />
2. Subscribed - The number of external objects which are waiting for data from<br />
this signal<br />
3. logicalChannel - A pointer to the channel information associated with this<br />
signal; the raw A/D data may be accessed via this channel (see Figure 1-12).<br />
3BUS 208 055 R1101<br />
Selected Theories of Operation<br />
53
PROPRIETARY DATA: This document contains proprietary data of ABB Inc. No disclosure, distribution (electronic or otherwise),<br />
reproduction, or other means of dissemination may be made without written permission.<br />
0289d2 (taken from logicalChannel entry printout of inputSignal)<br />
0x289d2 (id)<br />
......................................................<br />
0x289d2:<br />
“0x289d2”<br />
(struct PRIVATE)<br />
isa:<br />
LUCChanne<br />
myself:<br />
0x289d2<br />
capacity:<br />
0<br />
(int)<br />
myName:<br />
0x289432<br />
parent:<br />
0x2882c2<br />
offset:<br />
0xc<br />
analogType:<br />
0x1230<br />
a2dSignal:<br />
0x2894ba<br />
a2dSignalPtr: 0x2894f8<br />
cFactorRatio: 1<br />
compositeSlope: -10.0103<br />
compositeOffset: 0.0003055<br />
(double)<br />
globalOutputEnabled:<br />
0x1<br />
ioSignal:<br />
ioSignalPtr:<br />
signalSize:<br />
samplingInterval:<br />
====:0x289422(struct NDXVAR [0])<br />
......................................................<br />
I> 0x279822<br />
0x289422 (id)<br />
......................................................<br />
0x289422:<br />
isa:<br />
mySelf:<br />
capacity:<br />
myName:<br />
objectToken:<br />
dataToken:<br />
timeStamp:<br />
status:<br />
subscribed:<br />
owner:<br />
initOption:<br />
ioPoint:<br />
logicalChannel:0<br />
phase:<br />
SamplingInterval:<br />
units:<br />
0x2834da<br />
0x283518<br />
16.6667<br />
0x64<br />
0<br />
0<br />
0<br />
0x3c<br />
“0x289422”<br />
ShortSignal<br />
0x289422<br />
0<br />
0<br />
(struct_S_8)<br />
0<br />
0<br />
0<br />
0<br />
0<br />
0<br />
(id*)<br />
(id)<br />
(char*)->0x2894f8<br />
(double)<br />
(double)<br />
‘\1’ (char)<br />
(id)<br />
(char*)->0x283518<br />
(double)<br />
(struct PRIVATE)<br />
(struct_SHARED*)<br />
(long)<br />
(int)<br />
(id)<br />
(long)<br />
(long)<br />
‘\0’<br />
‘\0’<br />
‘\0’<br />
(id)<br />
(double)<br />
(struct_SHARED*)<br />
(long)<br />
(id)<br />
(id)<br />
(int)<br />
(short)<br />
(int)<br />
(char)<br />
(char)<br />
(char)<br />
(short)<br />
(long)<br />
(id)<br />
Figure 1-12 Locating A2D Data in a Logical Channel<br />
(Continued on next page)<br />
54 Selected Theories of Operation<br />
3BUS 208 055 R1101
PROPRIETARY DATA: This document contains proprietary data of ABB Inc. No disclosure, distribution (electronic or otherwise),<br />
reproduction, or other means of dissemination may be made without written permission.<br />
====: 0x27985e (struct NDXVAR [100]).<br />
[0]: (struct NDXVAR)<br />
V1: 1333 0x535 (short)<br />
V2: 0 0 (short)<br />
V3: 6911551 0x69763f (long)<br />
[1]: (struct NDXVAR)<br />
V1: 1339 0x53b (short)<br />
V2: 0 0 (short)<br />
V3: 6911561 0x697649 (long)<br />
Array of raw A2D values for BW<br />
signal. format:V1A2D<br />
V2 validity<br />
V3 snych value<br />
Figure 1-12 (Continued)<br />
4. samplingInterval - The time between consecutive inputs in milliseconds since<br />
startup<br />
5. Converted Input Signal Array - The converted A/D units data array is at the<br />
end of the signal object. It provides raw input values in volts along with validity<br />
and synchronization values. All sensor signal elements within a block are<br />
examined with each other, element by element (each data point in the array is<br />
considered an element). If the synchronization values of the element fall within<br />
the synchTolerance of each other, then the signals are processed normally. It<br />
is assumed that all other elements of that block align properly. If they do not<br />
align within the synchTolerance of each other, then the oldest signal is reread.<br />
If a match does not occur on the re-read, then the data for the outputSignal is<br />
marked invalid.<br />
Sensor Output Signal Processing<br />
The output of each sensor processing algorithm is a stream of data box average<br />
values in customer units along with the associated time and position stamps, and a<br />
validity code. These can be observed in an array called outputSignal. As these<br />
values are determined, the sensor objects collects and places them in profile data<br />
arrays for transmission to a Host Computer. Also, some sensor outputSignal values<br />
are used as inputs to other computed sensor algorithms such as conditioned weight<br />
and apparent density. This relationship can be seen in Figure 1-13.<br />
3BUS 208 055 R1101<br />
Selected Theories of Operation<br />
55
PROPRIETARY DATA: This document contains proprietary data of ABB Inc. No disclosure, distribution (electronic or otherwise),<br />
reproduction, or other means of dissemination may be made without written permission.<br />
raw A2D head position<br />
(shortSignal)<br />
raw A2D Beta input<br />
(ShortSignal)<br />
“sensorGroup01HeadPosition01”<br />
(DoubleSignal) - cm<br />
Beta Sensor<br />
“BetaInputSignal01”<br />
(DoubleSignal) - volts<br />
“BWMeasurent01”<br />
(DoubleSignal) - grams<br />
“IRMeasurement01”<br />
(DoubleSignal) - %<br />
Cond Wt Sensor<br />
“CondWtMeasurement01”<br />
(DoubleSignal) - grams<br />
Figure 1-13 outputSignals as Inputs to Other Sensors<br />
(Example shown here is for conditioned weight)<br />
The layout of outputSignal is similar to that of inputSignal described earlier. In<br />
outputSignal, however, the primary point of interest is the data array at the end.<br />
Each element in the array is made up of five entries. The example in Figure 1-14<br />
shows the arrangement.<br />
56 Selected Theories of Operation<br />
3BUS 208 055 R1101
PROPRIETARY DATA: This document contains proprietary data of ABB Inc. No disclosure, distribution (electronic or otherwise),<br />
reproduction, or other means of dissemination may be made without written permission.<br />
outputSignal<br />
BetaSignal -> outputSignal<br />
outputSignal0x2acc52<br />
in<br />
ox2acc52<br />
0x2acc52(id)<br />
................................<br />
0x2acc52: “0x2acc52” (struct PRIVATE)<br />
isa: SheetMeas (struct_SHARED *)<br />
myself: 0x2acc52 (long)<br />
capacity: 0x32 (int)<br />
myName: 0x2ad282 (id)<br />
objectToken: 0x100023e (long)<br />
dataToken: 0x100023f (long)<br />
timeStamp:<br />
(struct_s_7)<br />
timeMS: 0 (short)<br />
timeLS: 0 (long)<br />
status: 0 ‘\0’ (char)<br />
subscribed: 0 ‘\0’ (char)<br />
controlledAccess: 0 ‘\0’ (char)<br />
reserved: 0 ‘\0; (char)<br />
owner: 0x1 (int)<br />
initOption: 0 (short)<br />
ioPoint: 0 (id)<br />
logicalChannel: 0 (hid)<br />
phase: 0 (long)<br />
samplingInterval: 0 (double)<br />
units: 0 (id)<br />
avgFactor: 0 (long)<br />
====: 0x2acc96 (struct NDXVAR [50])<br />
[0]: (struct NDXVAR)<br />
V1: -0.66202 (double) value in customer units<br />
V2: 249.464 (double) cross direction position in customer units<br />
V3: 0 (double) machine direction position in customer units (not used)<br />
V4: 0 0 (double) validity code<br />
V5: 353237171 0x150df8b3 (long) synchronization<br />
[3]: (struct NDXVAR)<br />
V1: 0.13285 (double)<br />
V2: 278.47 (double)<br />
V3: 0 (double)<br />
V4: 0 0 (short)<br />
V5: 353239231 0x150e00bf (long)<br />
[4]: (struct NDXVAR)<br />
V1: -0.221129 (double)<br />
V2: 278.619 (double)‘<br />
V3: 0 (double)<br />
V4: 0 0 (short)<br />
V5: 353239251 0x150e00d3 (long)<br />
Figure 1-14 Example Printout of Output Signal Array<br />
For Software Release 260.0 and later only:<br />
Note:<br />
The number of valid data elements in the array is a function of the<br />
data box width and scan speed. This results in each valid element<br />
being the average of one data box while scanning. In single point<br />
mode, there will be 10 valid entries in the array. All other elements<br />
in the array are marked invalid and should be ignored.<br />
3BUS 208 055 R1101<br />
Selected Theories of Operation<br />
57
Blank Page
PROPRIETARY DATA: This document contains proprietary data of ABB Inc. No disclosure, distribution (electronic or otherwise),<br />
reproduction, or other means of dissemination may be made without written permission.<br />
2<br />
General <strong>Troubleshooting</strong><br />
Instructions<br />
This section provides you with some actions you can take when you have a problem<br />
with your system. The format is a troubleshooting flow chart which will guide you<br />
through a variety of thought processes which should bring the system back to<br />
acceptable operation. However, you may still have to call ABB in Columbus, Ohio<br />
sometimes. At those times, you should have some documented data from the<br />
subsystem printed out before you make the call. Below is a list of the things of<br />
which you should have a printout:<br />
• dproc A list of all the processors in use<br />
• dfree The amount of free memory available<br />
• bfchk The status of all buffers and stacks<br />
• derr The exception error log<br />
• pe The last 100 application software event messages<br />
• A printout of the instance variables in the object with the problem<br />
This chapter contains the following major sections:<br />
Section ...............................................................................................Page<br />
Data Required for Problem Escalation .......................................................... 60<br />
<strong>Troubleshooting</strong> Flow Charts ......................................................................... 63<br />
Host Computer Coldstart Data File Overview ............................................... 76<br />
Startup Messages ........................................................................................... 77<br />
Changing the Host/SP BAUD Rate and the Station ID .................................. 85<br />
Radiological Safety Features and Alarms ...................................................... 86<br />
3BUS 208 055 R1101<br />
General <strong>Troubleshooting</strong> Instructions<br />
59
PROPRIETARY DATA: This document contains proprietary data of ABB Inc. No disclosure, distribution (electronic or otherwise),<br />
reproduction, or other means of dissemination may be made without written permission.<br />
Data Required for Problem Escalation<br />
If you are planning to escalate a problem to a high level for assistance, the following<br />
worksheets will assist in gathering pertinent information about the system and the<br />
problem. This will assist the Level III or Level IV support team to respond more<br />
efficiently.<br />
Description of Problem:<br />
System Configuration:<br />
SP Release:<br />
If problem is a result of an upgrade, what was previous SP release<br />
Scanner Feature<br />
FRAME<br />
Auto Edge of Sheet<br />
Scan Limit/Head Position Setup<br />
Check If Applicable<br />
_____<br />
full reduced<br />
Required Supplemental<br />
Information<br />
AEOS/Servo: TrackingDistance: h___f___<br />
WindowClearance:h___f___<br />
Detector Offset: h___f___<br />
EOSDeadband: _____<br />
Pos. Deadband (xdb):_____<br />
Scan Speed: _____<br />
vminActive: _____<br />
Acceleration: _____<br />
Head Clearance: h___f___<br />
curlDist: _____<br />
Head Positions: garage: _____<br />
standardize: _____<br />
MeasureLimit: h___f___<br />
Scan Limit: h___f___<br />
TravelLimits: h___f___<br />
60 General <strong>Troubleshooting</strong> Instructions<br />
3BUS 208 055 R1101
PROPRIETARY DATA: This document contains proprietary data of ABB Inc. No disclosure, distribution (electronic or otherwise),<br />
reproduction, or other means of dissemination may be made without written permission.<br />
SENSORS<br />
Basis Weight _____ TLK _____ STLK<br />
_____ TLP _____ STLP<br />
_____ TLS<br />
_____ HAW/CAP<br />
IR Moisture _____ L/T/HEMI<br />
___ BW Comp<br />
_____ HEMI+<br />
___ BW Comp___Ash Comp<br />
_____ REFL<br />
___ BW Comp<br />
_____ REFL+<br />
___ BW Comp___Ash Comp<br />
_____ Head Heater<br />
yes (y) - from frame no (n) - from Product Code File<br />
Top IR Coat Weight<br />
Bottom IR Coat Weight<br />
_____<br />
_____<br />
___ Slot IR 1<br />
___ Slot IR 2<br />
Caliper _____ GT<br />
_____ Air Bearing<br />
_____ Air Bearing Probe Heater<br />
_____ Contacting<br />
_____ Non–Contacting<br />
Apparent Density<br />
_____<br />
Ash _____ 2C _____ Smart 2C _____BW Comp_____Moisture Comp<br />
_____ 3C _____ Smart 3C _____BW Comp_____Moisture Comp<br />
_____ X–Ray Coat Weight yes (y) - from frame no (n) - from Product Code File<br />
OptiPak<br />
_____<br />
Top Gloss<br />
Bottom Gloss<br />
_____<br />
_____<br />
Sheet Temperature _____ _____Algorithm (linear/quadradic)<br />
_____Slot<br />
Top Smoothness<br />
Bottom Smoothness<br />
_____<br />
_____<br />
Microwave Moisture _____ _____Wet End_____Dry End<br />
Top Color<br />
Bottom Color<br />
_____<br />
_____<br />
Unique Sensor<br />
_____<br />
Aseptic, Top Sensor _____ inside<br />
_____ outside<br />
Aseptic, Bottom Sensor _____ inside<br />
_____ outside<br />
IR Ratio _____ top<br />
____Aseptic/EVOH____Trans/Refl____# Ref Filter<br />
_____ bottom<br />
____Aseptic/EVOH____Trans/Refl____# Ref Filter<br />
SYSTEM<br />
Power Frequency______50 HZ______60 HZ<br />
Host ______ 1190______ 1180M______ AccuRay Direct______ Chemical______ Aseptic<br />
Is host sensor configuration at least a subset of <strong>Scanning</strong> <strong>Platform</strong> ______<br />
Do host and <strong>Scanning</strong> <strong>Platform</strong> have same baud rate ______; station ID ______; Frame Number ______<br />
3BUS 208 055 R1101<br />
General <strong>Troubleshooting</strong> Instructions<br />
61
PROPRIETARY DATA: This document contains proprietary data of ABB Inc. No disclosure, distribution (electronic or otherwise),<br />
reproduction, or other means of dissemination may be made without written permission.<br />
Diagnostic Utility Results:<br />
Utility Results Notes<br />
derr _____ OK_____ Fail If report shows a bus error,<br />
obtain a printout of dproc<br />
and map -m.<br />
bfchk _____ OK_____ Fail If report shows a buffer<br />
error, run bfchk -s.<br />
dfree<br />
pool 13 ______Frags ______<br />
pool 15 ______Frags ______<br />
pool 31 ______Frags ______<br />
Total ______ Frags ______<br />
Total fragments for any one<br />
pool should be under 99.<br />
Total can be >99.<br />
pe -a ______ done Print out entire report.<br />
Data Validity Problems at Host:<br />
1. Is data valid on the Health Pages ______<br />
2. Is data valid in the tbm arrays (with release SP270.3, run tbmcu utility) ______<br />
62 General <strong>Troubleshooting</strong> Instructions<br />
3BUS 208 055 R1101
PROPRIETARY DATA: This document contains proprietary data of ABB Inc. No disclosure, distribution (electronic or otherwise),<br />
reproduction, or other means of dissemination may be made without written permission.<br />
<strong>Troubleshooting</strong> Flow Charts<br />
Figure 2-1 is a guide to troubleshooting. The symptoms are addressed in the specific<br />
flow charts labeled A through M.<br />
Table 2-1 Guide to <strong>Troubleshooting</strong> Flow Charts<br />
Symptoms<br />
System will not reboot.<br />
Cannot communicate with the Host computer.<br />
System halts. One or more LEDs are lit.<br />
Cannot access AVOS shell<br />
Some sensor is not working (measurement, standardize, sample<br />
check, or calibrate sample).<br />
Sensor heads will not move<br />
Scan is erratic (fast, slow, or jerky)<br />
Auto edge–of–sheet problems<br />
<strong>Platform</strong> stays in local mode.<br />
Console displays: <br />
Cannot operate utilities.<br />
Cannot determine what is wrong.<br />
See Flow Chart<br />
A<br />
B<br />
C<br />
D<br />
E<br />
F<br />
G<br />
H<br />
I<br />
J<br />
K<br />
L<br />
Note:<br />
In all cases, if recovery of the system functionality has been achieved<br />
and nothing done except reset the system, call the 24 x 365 support<br />
line with the information regarding the circumstances surrounding<br />
the problem and recovery. The data will be useful in determining<br />
and rectifying problems in the more obscure areas of the system.<br />
3BUS 208 055 R1101<br />
General <strong>Troubleshooting</strong> Instructions<br />
63
PROPRIETARY DATA: This document contains proprietary data of ABB Inc. No disclosure, distribution (electronic or otherwise),<br />
reproduction, or other means of dissemination may be made without written permission.<br />
System will not reboot.<br />
A<br />
Is the MPRC<br />
YES<br />
board new<br />
NO<br />
Has it been<br />
updated<br />
NO<br />
Perform the new<br />
board installation<br />
activities.<br />
YES<br />
Are there any startup<br />
response messages<br />
on the console<br />
screen<br />
YES<br />
Compare messages with information<br />
given in Startup Message Chart, and<br />
take corrective action indicated.<br />
NO<br />
Check the static condition of the front<br />
panel LEDs. Compare with Startup<br />
Symptoms/Causes/Corrective Actions.<br />
See page 77.<br />
Is there a<br />
match <br />
YES<br />
Take corrective action<br />
indicated and restart<br />
NO<br />
Reset the <strong>Platform</strong> and observe the<br />
front panel LEDs sequence. Compare<br />
to sequence given in Startup Sequence<br />
Chart. See page 77.<br />
Figure 2-1 <strong>Troubleshooting</strong> Flow Chart A<br />
64 General <strong>Troubleshooting</strong> Instructions<br />
3BUS 208 055 R1101
PROPRIETARY DATA: This document contains proprietary data of ABB Inc. No disclosure, distribution (electronic or otherwise),<br />
reproduction, or other means of dissemination may be made without written permission.<br />
Cannot Communicate with Host Computer.<br />
B<br />
Is the Host<br />
computer up<br />
NO<br />
Restart the Host<br />
Computer System<br />
YES<br />
Does<br />
<strong>Platform</strong><br />
respond to<br />
keyboard<br />
command<br />
YES<br />
NO<br />
Is <strong>Platform</strong> up<br />
and running<br />
NO<br />
Restart<br />
<strong>Platform</strong><br />
YES<br />
Do <strong>Platform</strong><br />
Number and baud<br />
rate agree with host<br />
computer<br />
NO<br />
Has this<br />
configuration run in<br />
the past<br />
YES<br />
Execute a<br />
PMMRLD<br />
YES<br />
Check console operation.<br />
May have to reboot Service<br />
Workstation.<br />
Replace the<br />
MPRC Board<br />
NO<br />
Make<br />
corrections<br />
Get connecting<br />
message<br />
YES<br />
All done.<br />
so they<br />
agree.<br />
NO<br />
Check Host hardware interface.<br />
NOTE:<br />
1. Check for any Host Computer communication error messages.<br />
2. The normal <strong>Platform</strong> based rate is 9600. Some sites are set to 19200<br />
however.<br />
Figure 2-2 <strong>Troubleshooting</strong> Flow Chart B<br />
3BUS 208 055 R1101<br />
General <strong>Troubleshooting</strong> Instructions<br />
65
PROPRIETARY DATA: This document contains proprietary data of ABB Inc. No disclosure, distribution (electronic or otherwise),<br />
reproduction, or other means of dissemination may be made without written permission.<br />
System halts. One or more red LED’s are lit.<br />
C<br />
Note the conditions under which<br />
the system was operating when<br />
the halt occurred or was first<br />
noticed.<br />
Is<br />
this a first<br />
occurrence<br />
YES<br />
YES<br />
NO<br />
Is<br />
this a frequent<br />
occurrence<br />
(>1/wk)<br />
NO<br />
Restart the<br />
<strong>Platform</strong><br />
Are there any<br />
symptoms prior to<br />
halt<br />
NO<br />
All done.<br />
YES<br />
Record symptomatic data by<br />
executing the utilities: derr,<br />
bfchk, dfree, pe -a, dproc<br />
Put <strong>Platform</strong> in DEBUG Mode. Restart the <strong>Platform</strong><br />
with the StartMode switch in the STOP/DEBUG<br />
position. When appears, go to<br />
CASE K and perform the actions listed. With this data<br />
in hand, contact the Support Line as soon as possible.<br />
The system may continue to be used in the mean time.<br />
Figure 2-3 <strong>Troubleshooting</strong> Flow Chart C<br />
66 General <strong>Troubleshooting</strong> Instructions<br />
3BUS 208 055 R1101
PROPRIETARY DATA: This document contains proprietary data of ABB Inc. No disclosure, distribution (electronic or otherwise),<br />
reproduction, or other means of dissemination may be made without written permission.<br />
Cannot Access AVOS Shell.<br />
D<br />
At the console type CTRL-q or CTRL-<br />
C, CTRL BREAK or CTRL |.<br />
Is<br />
access to the<br />
shell restored<br />
YES<br />
Note the<br />
occurrence<br />
for future<br />
reference<br />
NO<br />
Reboot the Service Workstation.<br />
Is<br />
access to the<br />
shell restored<br />
NO<br />
Reboot the<br />
<strong>Platform</strong><br />
YES<br />
Does<br />
this happen very<br />
often<br />
(>1/wk)<br />
NO<br />
Note the<br />
occurrence<br />
for future<br />
reference<br />
YES<br />
Note the<br />
occurrence<br />
for future<br />
reference<br />
NO<br />
YES<br />
Does<br />
this happen very<br />
often<br />
(>1/wk)<br />
Is<br />
access to the<br />
shell restored<br />
Possible problem with<br />
Service Workstation.<br />
Reboot Service<br />
Workstation with the<br />
backup software.<br />
YES<br />
Collect system<br />
error data<br />
Figure 2-4 <strong>Troubleshooting</strong> Flow Chart D<br />
3BUS 208 055 R1101<br />
General <strong>Troubleshooting</strong> Instructions<br />
67
PROPRIETARY DATA: This document contains proprietary data of ABB Inc. No disclosure, distribution (electronic or otherwise),<br />
reproduction, or other means of dissemination may be made without written permission.<br />
Some Sensor(s) are not working.<br />
E<br />
Each Sensor Technical <strong>Manual</strong> should be consulted for specific troubleshooting<br />
procedures for that sensor. Here is a summary list of areas to consider and utilities<br />
to use in the troubleshooting process:<br />
All sensors are failed<br />
Is the sensor data invalid<br />
Check sensor status code.<br />
Check last standardize results.<br />
Health Report<br />
l>()pmmFrame0x stdzErrors](gives all failed parameters)<br />
Check input signals.<br />
aim<br />
SensorObject->inputSignal<br />
Check sensor processed data.<br />
SensorObject->outputSignal<br />
Check setup parameters; slope. offset, Cal Constants.<br />
Health Report<br />
SensorObject->slope<br />
SensorObject->offset<br />
Figure 2-5 <strong>Troubleshooting</strong> Flow Chart E<br />
68 General <strong>Troubleshooting</strong> Instructions<br />
3BUS 208 055 R1101
PROPRIETARY DATA: This document contains proprietary data of ABB Inc. No disclosure, distribution (electronic or otherwise),<br />
reproduction, or other means of dissemination may be made without written permission.<br />
Sensor head will not move.<br />
F<br />
Has<br />
the head ever<br />
moved<br />
NO<br />
Do <strong>Platform</strong><br />
tuning<br />
with the ft<br />
utility.<br />
YES<br />
Check for the following system conditions:<br />
Is<br />
the <strong>Platform</strong> in<br />
local<br />
NO<br />
Is<br />
system in<br />
correct mode for<br />
requested<br />
function<br />
YES<br />
NO<br />
1. Host Communication down (OFF-SHEET/REMOTE).<br />
2. Process Sheet Break (OFF-SHEET/REMOTE).<br />
3. Sensor Alarm Grid Broken (LOCAL).<br />
4. Air Pressure low at the <strong>Platform</strong> (LOCAL).<br />
5. <strong>Platform</strong> split heads condition set (LOCAL).<br />
6. Heads sitting on a limit switch. (Note that this also causes loss of<br />
serial communications to the <strong>Platform</strong> with a resultant loss of lamp<br />
illumination to the ON/OFF sheet push buttons) (LOCAL).<br />
7. Invalid head position (bad encoder). Check the ft utility encoder<br />
page (LOCAL).<br />
8. No chiller flow (OFF-SHEET/REMOTE).<br />
9. Inherent Sheet Break (OFF-SHEET/REMOTE).<br />
10. Head Tracking error (OFF-SHEET/REMOTE).<br />
11. Auto Edge-of-Sheet error (OFF-SHEET/REMOTE).<br />
12. Head has restricted motion (LOCAL).<br />
13. Bad Edge Detector (OFF-SHEET/REMOTE).<br />
Put system in correct<br />
mode.<br />
YES<br />
Check the pe utility messages<br />
and the requestList display<br />
function in the ft utility.<br />
Figure 2-6 <strong>Troubleshooting</strong> Flow Chart F<br />
3BUS 208 055 R1101<br />
General <strong>Troubleshooting</strong> Instructions<br />
69
PROPRIETARY DATA: This document contains proprietary data of ABB Inc. No disclosure, distribution (electronic or otherwise),<br />
reproduction, or other means of dissemination may be made without written permission.<br />
Scan Is erratic.<br />
G<br />
Has<br />
<strong>Platform</strong> tuning been<br />
done<br />
NO<br />
Tune the <strong>Scanning</strong> <strong>Platform</strong><br />
using the ft utility.<br />
YES<br />
Monitor the scanning<br />
performance using the<br />
ft utility DISPLAY<br />
function.<br />
Does<br />
head move freely<br />
across <strong>Platform</strong><br />
width<br />
NO<br />
<strong>Troubleshooting</strong> for<br />
possible drag on heads.<br />
YES<br />
Check setup of motor<br />
controller. Retune if<br />
changed.<br />
If <strong>Platform</strong> > 6–7 meters<br />
or < 6–7 meters, manual<br />
tuning of parameters may<br />
be necessary. Consult<br />
section 3 of this manual.<br />
Figure 2-7 <strong>Troubleshooting</strong> Flow Chart G<br />
70 General <strong>Troubleshooting</strong> Instructions<br />
3BUS 208 055 R1101
PROPRIETARY DATA: This document contains proprietary data of ABB Inc. No disclosure, distribution (electronic or otherwise),<br />
reproduction, or other means of dissemination may be made without written permission.<br />
Auto edge–of–sheet problems.<br />
H<br />
Is<br />
AEOS turned<br />
ON<br />
NO<br />
Turn AEOS on<br />
at the Host<br />
Computer.<br />
YES<br />
Check pe utility for<br />
related AEOS<br />
messages.<br />
Do<br />
edge detectors<br />
work Use dim<br />
utility to<br />
examine.<br />
NO<br />
Troubleshoot<br />
detectors<br />
and repair.<br />
YES<br />
Check AEOS setup with ft<br />
utility display feature.<br />
NOTE: If the far edge detector<br />
could not find the home edge of<br />
sheet, the detector itself may be<br />
defective, or the orientation of the<br />
home edge limits in the scanner<br />
object may be incorrect.<br />
Figure 2-8 <strong>Troubleshooting</strong> Flow Chart H<br />
3BUS 208 055 R1101<br />
General <strong>Troubleshooting</strong> Instructions<br />
71
PROPRIETARY DATA: This document contains proprietary data of ABB Inc. No disclosure, distribution (electronic or otherwise),<br />
reproduction, or other means of dissemination may be made without written permission.<br />
<strong>Platform</strong> stays in local mode.<br />
I<br />
Check for the following system conditions:<br />
1. Host Communication down (OFF-SHEET/REMOTE).<br />
2. Process Sheet Break (OFF-SHEET/REMOTE).<br />
3. Sensor Alarm Grid Broken (LOCAL).<br />
4. Air Pressure low at the <strong>Platform</strong> (LOCAL).<br />
5. <strong>Platform</strong> split heads condition set (LOCAL).<br />
6. Heads sitting on a limit switch. (Note that this also causes loss of<br />
serial communications to the <strong>Platform</strong> with a resultant loss of lamp<br />
illumination to the ON/OFF sheet push buttons) (LOCAL).<br />
7. Invalid head position (bad encoder). Check the ft utility encoder<br />
page (LOCAL).<br />
8. No chiller flow (OFF-SHEET/REMOTE).<br />
9. Inherent Sheet Break (OFF-SHEET/REMOTE).<br />
10. Head Tracking error (OFF-SHEET/REMOTE).<br />
11. Auto Edge-of-Sheet error (OFF-SHEET/REMOTE).<br />
12. Head has restricted motion (LOCAL).<br />
13. Bad Edge Detector (OFF-SHEET/REMOTE).<br />
14. One or more defective Frame Control Panels with a LOCAL<br />
pushbutton stuck in the closed position. Disconnect each panel, one<br />
at a time (one panel must always be connected) to isolate out the<br />
defective panel.<br />
Figure 2-9 <strong>Troubleshooting</strong> Flow Chart I<br />
72 General <strong>Troubleshooting</strong> Instructions<br />
3BUS 208 055 R1101
PROPRIETARY DATA: This document contains proprietary data of ABB Inc. No disclosure, distribution (electronic or otherwise),<br />
reproduction, or other means of dissemination may be made without written permission.<br />
Console displays <br />
This message appears after the front panel switch on the ASPC is placed in the down<br />
position and the system reset.<br />
J<br />
Note the conditions under which the<br />
message occurred. Such things as<br />
rebooting, scanning with no user<br />
intervention going on, utilities in use, and<br />
so forth.<br />
At the Service Workstation console, type e.<br />
The response will be a report of the<br />
condition.<br />
At the Service Workstation console, type x.<br />
The response will be an exception report of<br />
the bus error(s).<br />
At the Service Workstation console, type d 1<br />
100. The response will be a memory dump of<br />
the first 100 locations.<br />
Restart the <strong>Platform</strong>. Run<br />
the bfck utility periodically to uncover buffer<br />
problems. Call the Support Line with the<br />
results of the collected report. This should be<br />
done as soon as possible while the event is<br />
fresh in the mind.<br />
Figure 2-10 <strong>Troubleshooting</strong> Flow Chart J<br />
3BUS 208 055 R1101<br />
General <strong>Troubleshooting</strong> Instructions<br />
73
PROPRIETARY DATA: This document contains proprietary data of ABB Inc. No disclosure, distribution (electronic or otherwise),<br />
reproduction, or other means of dissemination may be made without written permission.<br />
Cannot operate utilities.<br />
K<br />
Can<br />
the dfree utility be<br />
run<br />
YES<br />
Record the dfree<br />
data and reboot<br />
the <strong>Platform</strong><br />
NO<br />
Record pe error messages if<br />
possible, and reboot the <strong>Platform</strong><br />
Using dfree and monitor utilities,<br />
get initial usage of memory and<br />
buffers. (Usage should stabilize<br />
after several days.)<br />
Every several hours, gather the<br />
following data:<br />
dfree<br />
bfchk<br />
derr<br />
monitor (resources)<br />
pe -a<br />
Are<br />
resources being<br />
consumed and/or are<br />
errors being<br />
generated<br />
YES<br />
With the collected<br />
data available,<br />
contact the Support<br />
Line.<br />
NO<br />
Increase interval of monitoring to once per<br />
month. If problem reoccurs, call the Support<br />
Line.<br />
Figure 2-11 <strong>Troubleshooting</strong> Flow Chart K<br />
74 General <strong>Troubleshooting</strong> Instructions<br />
3BUS 208 055 R1101
PROPRIETARY DATA: This document contains proprietary data of ABB Inc. No disclosure, distribution (electronic or otherwise),<br />
reproduction, or other means of dissemination may be made without written permission.<br />
Cannot determine what is wrong.<br />
L<br />
Is the <strong>Platform</strong><br />
running with access<br />
to the Service<br />
Workstation<br />
NO<br />
Troubleshoot using<br />
either flow chart A or D.<br />
YES<br />
Execute the following<br />
utilities: derr, bfchk,<br />
dfree, dproc, pe -a.<br />
Note the conditions<br />
surrounding the problem<br />
being experienced and,<br />
together with the<br />
printouts just obtained,<br />
call the Support Line<br />
for assistance.<br />
Figure 2-12 <strong>Troubleshooting</strong> Flow Chart L<br />
3BUS 208 055 R1101<br />
General <strong>Troubleshooting</strong> Instructions<br />
75
PROPRIETARY DATA: This document contains proprietary data of ABB Inc. No disclosure, distribution (electronic or otherwise),<br />
reproduction, or other means of dissemination may be made without written permission.<br />
Host Computer Coldstart Data File Overview<br />
The <strong>Scanning</strong> <strong>Platform</strong> software requires certain system parameters to be sent from<br />
the Host computer upon the issue of a PMMRLD command, to complete the initial<br />
configuration initialization. The specific set of parameters required will depend on<br />
the type of Host system involved and, if an 1190 (Software Release 3.0 and later)<br />
or AccuRay Direct, on the status of a flag in the pmmFrame01 object called<br />
shortFrameSetup. For Release 3.0 and later of the 1190 and all AccuRay Direct<br />
systems, the shortFrameSetup flag is automatically set to 1 meaning a shorter set<br />
of parameters are required from the host. For 1190 releases prior to 3.0, this flag<br />
must be set to 0, either by using the inspect utility, or by answering the appropriate<br />
query during the extended configuration session.<br />
The following table gives the parameter list for the data transfers during the<br />
PMMRLD command:<br />
Variable 1190/AccuRay Direct/Chem 1180M<br />
Flag=1 Flag=0<br />
Current Far Scan limit 3 3<br />
Current Home Scan Limit 3 3<br />
Far Measure Limit 3 3<br />
Home Measure Limit 3 3<br />
Off Sheet Position 3 3<br />
Standardize Position 3 3<br />
AEOS Enable Flag 3 3 3<br />
Single Point Position 3 3 3<br />
Number of Data Boxes 3 3 3<br />
Number of Control Zones 3<br />
Cond. Weight Factor 3 3 3<br />
Scan Time 3 3 3<br />
76 General <strong>Troubleshooting</strong> Instructions<br />
3BUS 208 055 R1101
3BUS 208 055 R1101<br />
General <strong>Troubleshooting</strong> Instructions 77<br />
Startup Messages<br />
Use the following table to troubleshoot the <strong>Scanning</strong> <strong>Platform</strong> at startup or after a reset. The table lists the start–up messages<br />
in sequence along with a description of system activities and corrective actions (where appropriate).<br />
Table 2-2 086349-002 MPRC Board<br />
Expected Start-up Console Message Activity Corrective Action<br />
Smart <strong>Platform</strong> start-up revision IMP 200 001<br />
(c) Copyright 1991, ABB Process Automation Inc.<br />
All Rights Reserved<br />
Prior to messages, the MPRC<br />
is running internal<br />
diagnostics on the CPU memory<br />
and the HDLC serial<br />
interface. The messages are<br />
at the beginning of the startup<br />
file and indicate the first<br />
attempts to read the RAM disk<br />
area.<br />
If the messages never appear<br />
on the screen either the MPRC<br />
diagnostics have failed or<br />
the RAM disk area cannot be<br />
read.<br />
PROPRIETARY DATA: This document contains proprietary data of ABB Inc. No disclosure, distribution (electronic or otherwise),<br />
reproduction, or other means of dissemination may be made without written permission.
78 General <strong>Troubleshooting</strong> Instructions<br />
3BUS 208 055 R1101<br />
Expected Start-up Console Message Activity Corrective Action<br />
HDLC Loop back Test (Dev0/ChanB): PASSED<br />
HDLC Loop back Test (Dev0/ChanA): PASSED<br />
BRAM address:0x2000000<br />
BRAM size:0x200<br />
Checksum Table:0x207fc00<br />
BRAM checksumsOK<br />
BRAM address 0x2080000<br />
BRAM size:0x9ff<br />
Checksum table:0x22ff000<br />
BRAM ChecksumsOK<br />
/bram1 (NO WRITE)<br />
File System: Volume:<br />
** Phase 1 Check Blocks and Sizes<br />
** Phase 2 Check Pathnames<br />
** Phase 3 Check Connectivity<br />
** Phase 4 Check Reference Counts<br />
** Phase 5 Check Free List<br />
46 files 389 blocks 112 free<br />
/bram2 (NO WRITE)<br />
File System: Volume:<br />
** Phase 1 Check Blocks and Sizes<br />
** Phase 2 Check Pathnames<br />
** Phase 3 Check Connectivity<br />
** Phase 4 Check Reference Counts<br />
** Phase 5 Check Free List<br />
70 files 2502 blocks 12 free<br />
These messages are responses<br />
to diagnostic exercises which<br />
include a check on the MPRC<br />
microprocessor serial link<br />
(HDLC) and a check on the RAM<br />
disk area integrity and<br />
condition.<br />
The fsck repair utility is run<br />
for both bram1 and bram2 RAM<br />
disk areas. The utility<br />
response will only be to<br />
report conditions found.<br />
The loading process will not<br />
halt during these checks but<br />
it will be up to service<br />
personnel to go back later and<br />
correct any RAM disk file<br />
errors found. Errors found<br />
during the HDLC checks will<br />
probably prevent<br />
communications with the<br />
micro-controllers and any<br />
BRAM errors will prevent the<br />
libraries from loading.<br />
PROPRIETARY DATA: This document contains proprietary data of ABB Inc. No disclosure, distribution (electronic or otherwise),<br />
reproduction, or other means of dissemination may be made without written permission.
3BUS 208 055 R1101<br />
General <strong>Troubleshooting</strong> Instructions 79<br />
Expected Start-up Console Message Activity Corrective Action<br />
lib: /lib01/drv/session.lib loaded. btoken[12]<br />
task: /lib01/drv/hdlc loaded. btoken [13], entry[0x14c8c0], stacksize[2048]<br />
lib: /lib01/lib/libm loaded. btoken [16]<br />
lib: /lib01/lib/libsl loaded. btoken [17]<br />
Using revision file found on: /lib01/avrev, the following diskettes are required:<br />
disk: /lib01/avrev at release av280.5 Avos diskette<br />
.<br />
.<br />
.<br />
.<br />
ss280.5 ss01 diskette<br />
task: /lib01/drv/slvpmm loaded. btoken [18], entry[0x1834a8], stacksize[2048]<br />
lib: /lib01/lib/insp_lib loaded. btoken [20]<br />
expanding and loading po_clas.lc<br />
•<br />
•<br />
•<br />
expanding and loading pm_msdmg.lc<br />
task: /appl/lib/pm_appl.lib loaded. btoken[53], entry[0x23e408], stacksize[4096]<br />
AVOS SCNs and special<br />
operating system drivers<br />
are loaded into memory<br />
from the MPRC PROM area.<br />
A special utility to check<br />
the revision levels of the<br />
diskettes from which the<br />
software was loaded, is<br />
run here.<br />
The system then starts to<br />
load the various libraries<br />
from the bram2 RAM disk<br />
area. The final activity<br />
is to load the appl.lib<br />
configuration.<br />
If there are any<br />
application SCNs, they<br />
will be installed at this<br />
time also.<br />
1. If any AVOS task cannot be<br />
loaded, it will be noted.<br />
The problem is probably a<br />
bad image. Use the last<br />
saved version of the AVOS<br />
lib01 directory.<br />
2. If any AVOS library cannot<br />
be loaded, an “Entering<br />
Migration Mode” message<br />
will be issued. Use the<br />
last saved version of the<br />
AVOS lib01 directory.<br />
Use CTRL-SHIFT |, to get Avos<br />
prompt. Look at the list of<br />
diskettes used to find the<br />
offending diskette. Reload<br />
with the correct diskettes.<br />
If a module cannot be loaded,<br />
the “Entering Migration Mode”<br />
message will be issued.<br />
Restore the system files from<br />
the backup copy.<br />
PROPRIETARY DATA: This document contains proprietary data of ABB Inc. No disclosure, distribution (electronic or otherwise),<br />
reproduction, or other means of dissemination may be made without written permission.
80 General <strong>Troubleshooting</strong> Instructions<br />
3BUS 208 055 R1101<br />
Expected Start-up Console Message Activity Corrective Action<br />
Smart <strong>Platform</strong> Application; rev.:@(#)appl_init.m:190.1<br />
<br />
[1]:APPL_INIT defining exception handlers<br />
[2]:APPL_INIT defining Network Object Dictionary<br />
[3]:APPL_INIT creating global object collection<br />
[4]:APPL_INIT creating error history<br />
[5]:APPL_INIT creating appl_start community<br />
The system release is: SP280.5 Host communications is set for:<br />
Station ID = 1 Baud Rate = 9600<br />
[01_0]$$<br />
Down-line load Message Banner announcing OK to connect to Host<br />
Computer<br />
The configuration files are<br />
read and the system software<br />
is linked.<br />
Announcement that the downloaded<br />
command from the Host<br />
computer is ready to be<br />
received. Gives conditions<br />
for the manual or automatic<br />
loading.<br />
Any failure in this process<br />
indicates that one or more<br />
configuration files are<br />
defective. Restore the last<br />
saved .init files from<br />
diskette and restart.<br />
Any failure in this process<br />
indicates that one or more<br />
configuration files are<br />
defective. Restore the last<br />
saved .init files from<br />
diskette and restart.<br />
PROPRIETARY DATA: This document contains proprietary data of ABB Inc. No disclosure, distribution (electronic or otherwise),<br />
reproduction, or other means of dissemination may be made without written permission.
3BUS 208 055 R1101<br />
General <strong>Troubleshooting</strong> Instructions 81<br />
Table 2-3 086444-001 MPRC Board<br />
Expected Start-up Console Message Activity Corrective Action<br />
Smart <strong>Platform</strong> start-up revision IMP 200 001<br />
(c) Copyright 1991, ABB Process Automation Inc.<br />
All Rights Reserved<br />
Prior to messages, the MPRC<br />
is running internal<br />
diagnostics on the CPU memory<br />
and the HDLC serial<br />
interface. The messages are<br />
at the beginning of the startup<br />
file and indicate the first<br />
attempts to read the RAM disk<br />
area.<br />
If the messages never appear<br />
on the screen either the MPRC<br />
diagnostics have failed or<br />
the RAM disk area cannot be<br />
read.<br />
PROPRIETARY DATA: This document contains proprietary data of ABB Inc. No disclosure, distribution (electronic or otherwise),<br />
reproduction, or other means of dissemination may be made without written permission.
82 General <strong>Troubleshooting</strong> Instructions<br />
3BUS 208 055 R1101<br />
Expected Start-up Console Message Activity Corrective Action<br />
BRAM address 0x2000000<br />
BRAM size: 0xaff<br />
Checksum table:0x22bf000<br />
BRAM Checksums OK.<br />
/bram1 (NO WRITE)<br />
File System: Volume:<br />
** Phase 1 Check Blocks and Sizes<br />
** Phase 2 Check Pathnames<br />
** Phase 3 Check Connectivity<br />
** Phase 4 Check Reference Counts<br />
** Phase 5 Check Free List<br />
35 files 155 blocks 2610 free<br />
AccuRay Virtual Operating System<br />
(c) Copyright 1991-1998, Process Automation Business, Inc.<br />
/nram1 (NO WRITE)<br />
File System: Volume:<br />
** Phase 1 Check Blocks and Sizes<br />
** Phase 2 Check Pathnames<br />
** Phase 3 Check Connectivity<br />
** Phase 4 Check Reference Counts<br />
** Phase 5 Check Free List<br />
79 files 3418 blocks 517 free<br />
These messages are responses<br />
to diagnostic exercises which<br />
include a check on the MPRC<br />
microprocessor serial link<br />
(HDLC) and a check on the RAM<br />
disk area integrity and<br />
condition.<br />
The fsck repair utility is run<br />
for both bram1 and bram2 RAM<br />
disk areas. The utility<br />
response will only be to<br />
report conditions found.<br />
The loading process will not<br />
halt during these checks but<br />
it will be up to service<br />
personnel to go back later and<br />
correct any RAM disk file<br />
errors found. Errors found<br />
during the HDLC checks will<br />
probably prevent<br />
communications with the<br />
micro-controllers and any<br />
BRAM errors will prevent the<br />
libraries from loading.<br />
PROPRIETARY DATA: This document contains proprietary data of ABB Inc. No disclosure, distribution (electronic or otherwise),<br />
reproduction, or other means of dissemination may be made without written permission.
3BUS 208 055 R1101<br />
General <strong>Troubleshooting</strong> Instructions 83<br />
Expected Start-up Console Message Activity Corrective Action<br />
All Rights Reserved<br />
lib: /lib01/drv/session.lib loaded. btoken[15]<br />
task: /lib01/drv/hdlc360 loaded. btoken [16],entry[0x8aff4f4],stacksize [4000]<br />
lib: /lib01/lib/stack.lib loaded. btoken [19]<br />
Using revision file found on: /lib01/avrev, the following diskettes are required:<br />
disk: /lib01/avrev, at release av300_0 Avos diskette<br />
disk: /appl/clm/prrev, at release pr300_0 Product diskette<br />
disk: /appl/clm/serev, at release se300_0 Sensors diskette<br />
disk: /appl/clm/a1rev, at release a1300_0 APPL1 diskette<br />
disk: /appl/clm/a2rev, at release a2300_0 APPL2 diskette<br />
Using revision file found on: /lib01/avrev, the following disks are required:<br />
SP300.0 SystemRelease<br />
ac300_0 Ace diskette<br />
av300_0 Avos diskette<br />
h1300_0 Health1 diskette<br />
h2300_0 Health2 diskette<br />
pr300_0 Product diskette<br />
se300_0 Sensors diskette<br />
a1300_0 APPL2 diskette<br />
a2300_0 APPL2 diskette<br />
sa300_0 SCNA diskette<br />
sb300_0 SCNB diskette<br />
ss300_0 SS01 diskette<br />
task: /lib01/drv/ethertsk loaded. btoken[20], entry[0x8b3860c], stacksize[8000]<br />
task: /lib01/bin/sokit2me loaded. btoken[23], entry[0x8b3b5a4], stacksize[10000]<br />
Sokit2me Running...<br />
lib: /lib01/lib/insp_lib loaded. btoken [24]<br />
lib: /lib01/lib/libm loaded. btoken[25]<br />
lib: /lib01/lib/libs1 loaded. btoken[26]<br />
AVOS SCNs and special<br />
operating system drivers<br />
are loaded into memory from<br />
the MPRC PROM area.<br />
A special utility to check<br />
the revision levels at the<br />
diskettes from which the<br />
software was loaded,is run<br />
here.<br />
1. If any AVOS task cannot be<br />
loaded, it will be noted.<br />
The problem is probably a<br />
bad image. Use the last<br />
saved version of the AVOS<br />
lib01 directory.<br />
2. If any AVOS library cannot<br />
be loaded, an “Entering<br />
Migration Mode” message<br />
will be issued. Use the<br />
last saved version of the<br />
AVOS lib01 directory.<br />
Use CTRL-SHIFT |, to set the<br />
AVOS prompt. Look at the<br />
list of diskettes used to<br />
find the offending<br />
diskette. Reload with the<br />
correct diskette.<br />
PROPRIETARY DATA: This document contains proprietary data of ABB Inc. No disclosure, distribution (electronic or otherwise),<br />
reproduction, or other means of dissemination may be made without written permission.
84 General <strong>Troubleshooting</strong> Instructions<br />
3BUS 208 055 R1101<br />
Expected Start-up Console Message Activity Corrective Action<br />
task: /appl/bin/slvpmm loaded. btoken[28], entry[0x8b45304], stacksize[2048]<br />
lib: p0_clas.lib loaded. btoken[30]<br />
.<br />
.<br />
.<br />
.<br />
.<br />
lib: pm_msdmy.lib loaded. btoken[63]<br />
task: /appl/lib/p1_appl.lib loaded. btoken[64], entry[0x8c757b4], stacksize[4096]<br />
Smart <strong>Platform</strong> Application; rev.:@(#)appl_init.m 1.12<br />
<br />
[1]:APPL_INIT defining exception handlers<br />
[2]:APPL_INIT defining Network Object Dictionary<br />
[3]:APPL_INIT creating global object collection<br />
[4]:APPL_INIT creating error history<br />
[5]:APPL_INIT creating appl_start community<br />
THE SYSTEM RELEASE IS: SP300.0<br />
The current system release number has not been stored in: appl.ini---<br />
you may want to gstore: appl.ini!<br />
HOST COMMUNICATIONS IS SET UP FOR: stationID = 1 baudRate = 9600<br />
task: /lib01/bin/swi loaded. btoken[65], entry[0x8c9013c], stacksize[3000]<br />
task: /lib01/bin/asi loaded. btoken[66], entry[0x8c98fec], stacksize[4096]<br />
asiServer: Using nIndex = 0<br />
startdmp: comout_no in use is 4<br />
AVOS Shell 300.1.1.2<br />
[01_0] $$<br />
If the Host is down it will automatically download files to the Smart <strong>Platform</strong><br />
when it is started up.<br />
If the HOST is already up, then request a manual reload of this Smart <strong>Platform</strong>.<br />
The system then starts to<br />
load the various libraries<br />
from the bram2 RAM disk<br />
area. The final activity<br />
is to load the appl.lib<br />
configuration.<br />
If there are any<br />
application SCNs, they<br />
will be installed at this<br />
time also.<br />
The configuration files<br />
are read and the system<br />
software is linked.<br />
Announcement that the<br />
down-loaded command from<br />
the Host computer is ready<br />
to be received. Gives<br />
conditions for the manual<br />
or automatic loading.<br />
If a module cannot be<br />
loaded, the “Entering<br />
Migration Mode” message<br />
will be issued. Restore<br />
the system files from the<br />
backup copy.<br />
Any failure in this<br />
process indicates that one<br />
or more configuration<br />
files are defective.<br />
Restore the last saved<br />
.init files from diskette<br />
and restart.<br />
Any failure in this<br />
process indicates that one<br />
or more configuration<br />
files are defective.<br />
Restore the last saved<br />
.init files from diskette<br />
and restart.<br />
PROPRIETARY DATA: This document contains proprietary data of ABB Inc. No disclosure, distribution (electronic or otherwise),<br />
reproduction, or other means of dissemination may be made without written permission.
PROPRIETARY DATA: This document contains proprietary data of ABB Inc. No disclosure, distribution (electronic or otherwise),<br />
reproduction, or other means of dissemination may be made without written permission.<br />
Changing the Host/SP BAUD Rate and the<br />
Station ID<br />
In ABB 1190 Chemical and AccuRay Direct applications, the Station ID is<br />
typically 1. In 1180M applications, it can vary depending on the frame number and<br />
release level of the 1180M. In all cases, the standard host to the <strong>Scanning</strong> <strong>Platform</strong><br />
baud rate is 9600. There are occasions however, where other values for these<br />
parameters may be required. The following procedure will allow the values to be<br />
modified within the <strong>Scanning</strong> <strong>Platform</strong> and will require a system reset in all cases.<br />
1. Activate the inspect utility.<br />
2. Enter the following command:<br />
pmmInterface <br />
3. Observe and record the 0x address for the pmmDriver instance variable.<br />
4. To change the Station ID, enter the following command:<br />
()[0Xaaaaaa sid:yyyyy]<br />
Where: xxx is the drop address of the <strong>Scanning</strong> <strong>Platform</strong> and aaaaaa is the<br />
pmmDriver address. In the case of the 1180M, it is the LRN. Note that the<br />
X in the address expression is capitalized.<br />
5. To change the baud rate, enter the following command:<br />
()[0Xaaaaaa baudRate:yyyyy]<br />
Where: yyyyy is the baud rate to be used and aaaaaa is the pmmDriver address.<br />
6. Exit the inspect utility.<br />
7. Execute the gstore utility, saving the pmm community.<br />
8. Restart the <strong>Scanning</strong> <strong>Platform</strong>.<br />
3BUS 208 055 R1101<br />
General <strong>Troubleshooting</strong> Instructions<br />
85
PROPRIETARY DATA: This document contains proprietary data of ABB Inc. No disclosure, distribution (electronic or otherwise),<br />
reproduction, or other means of dissemination may be made without written permission.<br />
Radiological Safety Features and Alarms<br />
The features in this section add safety interlocks to the Ash and Basis Weight Sensor<br />
Package in order to further protect and inform personnel of malfunctions or special<br />
maintenance activities of the sensor.<br />
Broken Grid Alarm<br />
On any Basis Weight sensor having a non-gaseous, radioactive source (such as TLS1<br />
and TLP3), there will be a digital input which will notify the system whenever the<br />
grid is broken. This digital input will put the frame in local mode and display the<br />
alarm message on the Host computer operator console similar to:<br />
BW ALARM GRID BROKEN - FRAMEn<br />
The grid must be repaired before the heads can again be moved by the system.<br />
Inherent Sheet Break (ISB) Alarm<br />
If at any time the process disappears from the gap and the regular sheet break detector<br />
fails to take action, the system will sense the condition and put the frame in local<br />
mode and generate the alarm on the host computer operator console similar to:<br />
BW INHERENT SHEET-BREAK - FRAMEn<br />
ASH INHERENT SHEET-BREAK - FRAMEn<br />
The decision to alarm is based on an adjustable limit located in the Basis Weight<br />
and Ash object. The variables’ descriptions are as follows:<br />
Type Name Default<br />
double percentOfFullScaleForSheetBreak 98<br />
double timeForSheetBreak 5<br />
While these variables can be adjusted in the field, there are hard limits beyond which<br />
values should not be entered. The high limit signal can be a maximum of 99% of<br />
the signal voltage with nothing in the gap. The ISB maximum count delay between<br />
initial sheet-break detection and ISB actuation will not go over 30 seconds. The<br />
ISB override maximum count will not go past 700 seconds.<br />
Any time a change is made to these limits, the gauge must be standardized in order<br />
to make them effective.<br />
86 General <strong>Troubleshooting</strong> Instructions<br />
3BUS 208 055 R1101
PROPRIETARY DATA: This document contains proprietary data of ABB Inc. No disclosure, distribution (electronic or otherwise),<br />
reproduction, or other means of dissemination may be made without written permission.<br />
Head Tracking Error<br />
If at any time the heads become severely misaligned or separated, resulting in severe<br />
attenuation of the signal, the system will put the <strong>Platform</strong> in local mode and display<br />
the alarm on the Host computer operator console similar to:<br />
BW HEAD TRACKING ERROR - FRAMEn<br />
ASH HEAD TRACKING ERROR - FRAMEn<br />
The system will behave exactly as if there was a sheet-break. If the condition persists<br />
after going back on-sheet, the alarm will repeat.<br />
The decision to alarm is based on adjustable limits located in the Basis Weight and<br />
Ash community object. The variables’ descriptions are as follows:<br />
Type Name Default<br />
double percentOfFullScaleForHeadTracking 3 (TLK, TLS, and STLK)<br />
2 (STLP & TLP only)<br />
double timeToTriggerHeadTrackingError 5<br />
Shutter Closed During Prepare to Move<br />
When a prepare to move request is made for Basis Weight or Ash, a countdown<br />
starts. If the end location is not reached before the time limit is exceeded, the shutter<br />
will close. The specified time is a coldstart instance variable, shutterGracePeriod.<br />
It is located in the Frame community Object. shutterGracePeriod allows the<br />
shutters to stay open long enough when the snsor heads need to traverse the full<br />
length of the frame. The shutterGracePeriod time limit reduces the frequency of<br />
shutter cycling and reduces wear. Longer durations in prepare to move indicates a<br />
problem, and the shutter will close.<br />
Shutter Closed When Host Computer is Down<br />
Anytime the Host computer goes down, or is halted, leaving the platform up and<br />
running, the <strong>Scanning</strong> <strong>Platform</strong> software will sense loss of communication and close<br />
the shutter. When Host and <strong>Scanning</strong> <strong>Platform</strong> communications are restored, the<br />
normal shutter operation will continue.<br />
Invalid Shutter Open Alarm<br />
If the shutter is supposed to be closed and it is not (such as off-sheet), an alarm<br />
message will appear on the Host computer operator console similar to:<br />
BW SHUTTER OPEN ERROR - FRAMEn<br />
ASH SHUTTER OPEN ERROR - FRAMEn<br />
The system takes no other corrective actions beyond this notification.<br />
3BUS 208 055 R1101<br />
General <strong>Troubleshooting</strong> Instructions<br />
87
Blank Page
PROPRIETARY DATA: This document contains proprietary data of ABB Inc. No disclosure, distribution (electronic or otherwise),<br />
reproduction, or other means of dissemination may be made without written permission.<br />
3<br />
Position and Motion Problems<br />
This chapter is about troubleshooting problems with the platform.<br />
This chapter contains the following major sections:<br />
Section ...............................................................................................Page<br />
Preliminary <strong>Troubleshooting</strong> Activity ........................................................... 90<br />
Positioning Events Historical Diagnostic ...................................................... 91<br />
Mechanical Influence on Motion Problems ................................................... 94<br />
Comments About the Motor Controller ......................................................... 95<br />
Diagnosis of <strong>Platform</strong> and Servo Problems ................................................... 96<br />
Servo & Scanner Diagnostic Instance Variables ............................................ 99<br />
AEOS Setup Problems ................................................................................... 107<br />
Frame Tuning and Diagnostic Tool, ft ........................................................... 110<br />
3BUS 208 055 R1101<br />
Position and Motion Problems<br />
89
PROPRIETARY DATA: This document contains proprietary data of ABB Inc. No disclosure, distribution (electronic or otherwise),<br />
reproduction, or other means of dissemination may be made without written permission.<br />
Preliminary <strong>Troubleshooting</strong> Activity<br />
Prior to attempting to diagnose motion problems, it is strongly advised that complete<br />
<strong>Platform</strong> setup be performed using the ft utility for each platform on the system. It<br />
is important that the full sequence of head position and motor controller tuning be<br />
performed in this specific order.<br />
90 Position and Motion Problems<br />
3BUS 208 055 R1101
PROPRIETARY DATA: This document contains proprietary data of ABB Inc. No disclosure, distribution (electronic or otherwise),<br />
reproduction, or other means of dissemination may be made without written permission.<br />
Positioning Events Historical Diagnostic<br />
There is an array of data stored on the ECF boards’ SMI that gives an historical<br />
sequence of the more recent 20 states changes which the ECF board has seen. These<br />
events are generally related to FCP push button status and limit switch operation.<br />
It is useful in sometimes determining the sequence of those events which brought<br />
the system into whatever current situation is being examined. This array is<br />
populated by a state determined program in the ECF board. Various events may<br />
cause the state of the ECF board to change. A rotating buffer of 20 entries are kept<br />
where each entry contains an event and a corresponding state resulting from that<br />
event. Each line in the printout contains two fields following is the absolute address<br />
location in the ECF board (actually the SMI mounted on the ECF). The first field<br />
is the event, followed by the second field which is the state. There is a pointer (first<br />
entry in the buffer, second line in the printout) which indicates the next entry in the<br />
rotating buffer of events and corresponding states that were logged. To examine<br />
this array, execute the following commands:<br />
$$ uc 0x1f<br />
uc 0x1f> md ∆ HisPut.1 ∆ 21(2d)<br />
By looking at the first line in the printout, it can be determined where the next event<br />
will be logged. This will be the decimal offset into the array after the pointer,<br />
ranging from 0 to 19. At startup, the second entry will always have an initial 0 in<br />
the first and second fields, indicating that the buffer has not wrapped around yet.<br />
Always remember to count starting at 0 when counting the entries after the pointer.<br />
Table 3-1 on page 92 is a breakdown of the event codes and states of the ECF board:<br />
3BUS 208 055 R1101<br />
Position and Motion Problems<br />
91
PROPRIETARY DATA: This document contains proprietary data of ABB Inc. No disclosure, distribution (electronic or otherwise),<br />
reproduction, or other means of dissemination may be made without written permission.<br />
Table 3-1 ECF Board Event Codes and States<br />
Event Table<br />
State Table<br />
Code Event Code State<br />
1 <strong>Manual</strong> (hand) push button is True 0 Initialization<br />
2 Head Split is True 1 Disabled<br />
3 Head Split is False 2 Safety<br />
4 Motor Overload is True 3 Local, Not Jogging<br />
5 Motor Overload is False 4 Local, No Limit Sw, Fwd Jogging<br />
6 Forward Limit Switch is True 5 Local, No Limit Sw, Rev Jogging<br />
7 Forward Limit Switch is False 6 Local, Fwd Limit Sw, Not Jogging<br />
8 Reverse Limit Switch is True 7 Local, Fwd Limit Sw, Rev Jog<br />
9 Reverse Limit Switch is False 8 Local, Rev Limit Sw, Not Jogging<br />
10 Remote (Computer) Push Button is 9 Local, Rev Limit Sw, Fwd Jog<br />
True<br />
11 Jog Forward is True 10 Local, Frame Self Test, Moving in<br />
Rev<br />
12 Jog Forward is False 11 Local, Frame Self Test, Moving Off<br />
Rev Limit Sw<br />
13 Jog Reverse is True 12 Diagnostic<br />
14 Jog Reverse is False 13 Remote, Moving Off Rev Limit Sw<br />
15 Safety Interrupt is True 14 Remote, Moving Off Fwd Limit Sw<br />
16 Safety Interrupt is False 15 Remote, No Limit Sw True<br />
17 Startup Initialization is Complete<br />
18 Encoder is Unsynchronized<br />
19 Encoder is Synchronized<br />
20 ECF hdlc Communications Lost<br />
21 ECF hdlc Communications<br />
Restored<br />
22 FCP Communications Lost<br />
23 FCP Communications Restored<br />
24 Servo Time-out<br />
25 Frame Diagnostic Push Button<br />
True<br />
26 Frame Diagnostic Push Button<br />
False<br />
27 Start Positioning Self Test<br />
92 Position and Motion Problems<br />
3BUS 208 055 R1101
PROPRIETARY DATA: This document contains proprietary data of ABB Inc. No disclosure, distribution (electronic or otherwise),<br />
reproduction, or other means of dissemination may be made without written permission.<br />
The example below is the output of the md HisPut.l command execution after the<br />
startup and synchronization of the encoder. It is the expected sequence after any<br />
reset.<br />
Table 3-4<br />
$$ uc 0x1f Request ECF shell<br />
uc 0x1f> md HisPut.1 21(2d) Command to get state array<br />
uc 0x1f<br />
ECF Shell Prompt<br />
00147674: 11 0 Next buffer entry to be used<br />
00147678: 0 0 First event always 0 after a reset; if non-zero, buffer has<br />
wrapped<br />
0014767C: 17 3 Startup Initialization Complete; Local, No Limit, Not<br />
Jogging<br />
00147680: 18 3 Encoder Unsynchronized; Local, No Limit, Not<br />
Jogging<br />
00147684: 21 3 ECF hdlc Comm Restored; Local, No Limit, Not<br />
Jogging<br />
00147688: 11 4 Jog Fwd is True; Local, No Limit Sw, Fwd Jog<br />
0014768C: 12 3 Jog Fwd is False; Local, No Limit Sw, Not Jogging<br />
00147690: 10 2 Remote Push Button True; Safety (Moves toward Rev<br />
Limit Sw)<br />
00147694: 8 13 Rev Limit Sw True; Remote, Moving Off Rev Limit Sw<br />
00147698: 16 13 Safety Interrupt is False; (see note 1)<br />
0014769C: 19 13 Encoder Synchronized<br />
001476A0: 9 15 Rev Limit Sw is False; Remote, No Limit Sw<br />
001476A4: 0 0<br />
001476A8: 0 0<br />
001476AC: 0 0<br />
001476B0: 0 0<br />
001476B4: 0 0<br />
001476B8: 0 0<br />
001476BC: 0 0<br />
001476C0: 0 0<br />
001476C4: 0 0<br />
Note: 1. If a safety interrupt is still present after encoder synchronization<br />
and the reverse limit switch is false, then the safety interrupt<br />
would not clear and the state would be “Local, No Limit Sw, Not<br />
Jogging”.<br />
3BUS 208 055 R1101<br />
Position and Motion Problems<br />
93
PROPRIETARY DATA: This document contains proprietary data of ABB Inc. No disclosure, distribution (electronic or otherwise),<br />
reproduction, or other means of dissemination may be made without written permission.<br />
2. If a safety interrupt happens while the system is in Remote, the<br />
system goes to the Safety Interrupt state and the head moves<br />
toward the Reverse Limit Switch.<br />
Mechanical Influence on Motion Problems<br />
The <strong>Platform</strong> hardware sometimes has “sticky” spots due to mechanical binding.<br />
If a high friction spot occurs near the off–sheet or standardize positions, an unusually<br />
large minimum velocity may be computed by the ft utility. Unfortunately, this large<br />
value must be retained for vmin as it is required to override the friction at these<br />
points. However, high friction spots at other positions may not affect the operation,<br />
as they are usually experienced only during the CRUISING phase which uses DDC.<br />
In general, any position which requires the HOMING phase (usually an end point)<br />
must have sufficient minimum velocity to overcome the local friction there.<br />
An alternative to determining a fixed vmin is to activate minimum velocity tuning<br />
permanently by setting vminTune in the Servo object. Permanently setting<br />
vminTune may cause vmin oscillation due to high friction at one end of the scan<br />
and low friction at the other end. This oscillation may result in long delays at the<br />
sticky end and overcontrol (hunting) at the low friction end.<br />
Note:<br />
activeVmin and Vmin are related as follows. Vmin is the coldstart<br />
variable used as a starting point for activeVmin. When vminTune<br />
is turned on, activeVmin is then allowed to ramp up as necessary,<br />
providing the working value for the system.<br />
94 Position and Motion Problems<br />
3BUS 208 055 R1101
PROPRIETARY DATA: This document contains proprietary data of ABB Inc. No disclosure, distribution (electronic or otherwise),<br />
reproduction, or other means of dissemination may be made without written permission.<br />
Comments About the Motor Controller<br />
The AC motor controller directly affects the perceived tuning of the Servo. The<br />
actual velocity of the head has a non-linear relationship to the velocity output by<br />
the Servo due to motor controller dynamics.<br />
The most noticeable affect of the motor controller on Servo operations is in the<br />
ability of the <strong>Platform</strong> to overcome static resistance. A “loosely tuned” (low boost<br />
and/or V/F) motor controller requires a much higher output to get the head moving.<br />
If the output required to overcome this resistance is greater than the desired scan<br />
speed, a hang up will result.<br />
The ability to HOME to a position when reaching the end of a trajectory is critical<br />
because the HOMING phase uses minimum velocity (vmin) which should always<br />
be smaller than scan speed. The HOMING function coupled with the looseness<br />
described above, can cause severe hang up problems.<br />
If the scan limits are set very narrow, the computed scan speed may be below the<br />
recommended torque limit of the motor controller. In this case, the heads may not<br />
move at all, or will crawl at a very low speed (cogging action). To correct this<br />
problem, it is possible to give the servo a minimum velocity in a variable called<br />
vmin. Typical values should be determined by the approximate equation:<br />
vmin = minimum scan width/scan time<br />
3BUS 208 055 R1101<br />
Position and Motion Problems<br />
95
PROPRIETARY DATA: This document contains proprietary data of ABB Inc. No disclosure, distribution (electronic or otherwise),<br />
reproduction, or other means of dissemination may be made without written permission.<br />
Diagnosis of <strong>Platform</strong> and Servo Problems<br />
This discussion of typical symptoms and their causes relating to Servo (or apparent<br />
Servo) operation is intended to provide a general guideline in diagnosing erratic<br />
motion by the <strong>Platform</strong>. It is not all-inclusive with regards to symptoms. There are<br />
two major categories into which most symptoms will fall: hang up and overcontrol.<br />
In both cases, there is a servo diagnostic utility which may be useful in determining<br />
the cause of any problems encountered.<br />
The most common symptom of a <strong>Platform</strong> control problem is motion failure. It is<br />
important to first check the Host computer operator console for alarms which would<br />
explain the symptom. For example, if there has been a sheet–break, head tracking<br />
error, an AEOS limit change error, or inherent sheet–break, the head will be locked<br />
off–sheet.<br />
Next, check the pe log on the <strong>Scanning</strong> <strong>Platform</strong> console for clues. The AEOS<br />
illegal transition indicates that the detectors saw a sheet when they should not have.<br />
If the edge detectors saw the sheet–break as a legal edge change (> 50% of width),<br />
then a narrow scan may occur on the next first scan. This narrow scan can be avoided<br />
by setting up maxEdgeChange properly.<br />
Head tracking (Basis Weight or Ash < 3% AIS) or inherent sheet–break (Basis<br />
Weight or Ash > 98% AIS) will occur only if there is a loss of apparent signal or<br />
an attempt to measure air. An apparent signal loss can occur if a standardize takes<br />
place with paper in the gap. The sensors may try to measure air following a sheet–<br />
break if the scan velocity is too small. If the scan velocity is too small, there is not<br />
enough torque to carry the head to an on–sheet position.<br />
Having verified the presence or absence of the above conditions, it is strongly<br />
advised that a complete <strong>Platform</strong> setup be performed via the ft utility for each<br />
<strong>Platform</strong> on the system. It is important that the full sequence of head position, and<br />
velocity calibrations be performed in this specific order.<br />
Hang Up Problems<br />
If a hang up problem is being caused by tuning problems, then the usual cause is<br />
that insufficient output is getting to the motor controller from the servo0x object.<br />
This insufficient output is typically related to vmin being too small to overcome<br />
friction or the motor controller slope being too small to cause motion, regardless of<br />
the servo0x output.<br />
vmin Too Small<br />
The quickest way to rule out if vmin is too small is to check the command variable<br />
in servo0x. The command is the actual output velocity being sent to the MPRC<br />
board. If it is zero, the cause for the hang up is some other reason (see “servo01<br />
Request Complete” on page 97). If command is non-zero and equal in magnitude<br />
to vmin, then vmin is too small and should probably be increased slightly.<br />
96 Position and Motion Problems<br />
3BUS 208 055 R1101
PROPRIETARY DATA: This document contains proprietary data of ABB Inc. No disclosure, distribution (electronic or otherwise),<br />
reproduction, or other means of dissemination may be made without written permission.<br />
Motor Controller Slope Too Small<br />
If command is much larger than vmin, then the motor controller slope variable<br />
may be too small. Rerun the motor controller tuning activities using the ft utility.<br />
servo01 Request Complete<br />
If the servo is not trying to move the head (see “vmin Too Small” and “Motor<br />
Controller Slope Too Small” on page 97), then the hang up must be related to a no<br />
motion request from the <strong>Platform</strong> which indirectly does the Host Computer’s<br />
bidding. By using the Display menus of the ft utility, the status of the <strong>Platform</strong>’s<br />
request list may be examined to see what has been requested.<br />
Confirmation that servo0x has successfully completed the last request can be<br />
derived from the Current <strong>Platform</strong> Status display. If the <strong>Platform</strong> is NOT in Transit,<br />
then the servo0x object has been told to remain stationary. Some reasons for system<br />
logic to be requesting a stationary position are:<br />
• No request from the Host Computer to do anything<br />
• Host/<strong>Scanning</strong> <strong>Platform</strong> communications down<br />
• <strong>Scanning</strong> <strong>Platform</strong> communications down<br />
• <strong>Platform</strong> in local<br />
• Sheet contacting sensor is inoperative or secure<br />
• Host Computer has not completed profile updates<br />
Frequently the error log (pe utility) will give some clue as to the current problem.<br />
Overcontrol Problems<br />
Overcontrol of the head is almost always the result of a servo tuning error. Insure<br />
that the frame tuning utility ft has been properly run. The usual reasons for<br />
overcontrol are almost the inverse of hang up (that is, vmin or motor controller<br />
slope is too large). In FIXED_POINT positioning, the symptom will be hunting.<br />
For STOP_PAST (scanning), the symptom will be the head jerking rapidly during<br />
the ACCELERATION mode.<br />
vmin Too Large (or activeVmin)<br />
Determining if vmin is too large is difficult because of the fact that vmin must be<br />
sufficiently big enough to overcome <strong>Platform</strong> resistance along its entire length and<br />
there may only be a small area of the <strong>Platform</strong> that has high resistance. If vmin is<br />
nearly the same magnitude as the scanSpeed in the scanner0x object (certainly<br />
never greater than scanSpeed), then it is probably too large. Any vmin which is<br />
more than 50% greater than this predicted value is probably too large.<br />
If motor controller tuning in the ft utility consistently computes a large vmin, then<br />
the motor controller boost adjustment is probably too low.<br />
3BUS 208 055 R1101<br />
Position and Motion Problems<br />
97
PROPRIETARY DATA: This document contains proprietary data of ABB Inc. No disclosure, distribution (electronic or otherwise),<br />
reproduction, or other means of dissemination may be made without written permission.<br />
Motor Controller Slope and Offset Too Large<br />
The symptoms associated with an excessive ucSlope/ucOffset are usually obvious.<br />
In addition to overcontrol at the edges, the head will have a noticeable jump at the<br />
beginning of each scan. The most definitive proof of an excessive slope condition<br />
is to examine the DDC error variable diagCorrectAvg in the servo0x object during<br />
a scan. If this value is more than 1.05, then the motor controller slope and offset<br />
should be adjusted using the ft utility.<br />
xdb Too Small<br />
In rare cases, the positioning dead band xdb as computed by the ft utility may be<br />
too small. It has been found however, that in most cases of overcontrol, the dead<br />
band is appropriate and that by addressing one of the other causes, the hunting can<br />
be reduced to a negligible amount. Using the smallest xdb possible insures that the<br />
scan end points are accurately reproduced.<br />
Miscellaneous<br />
A sine wave velocity across the scan can be caused by an excessively large integral<br />
gain for the DDC speed control (Ki). The cause of an excessively large integral<br />
gain can be a scan speed which is below the physical capability of the current motor<br />
controller setup. When the cause is related to the physical capabilities of the the<br />
motor controller, increase the scan speed or adjust the Boost or V/F pots on the<br />
motor controller.<br />
98 Position and Motion Problems<br />
3BUS 208 055 R1101
PROPRIETARY DATA: This document contains proprietary data of ABB Inc. No disclosure, distribution (electronic or otherwise),<br />
reproduction, or other means of dissemination may be made without written permission.<br />
Servo & Scanner Diagnostic Instance Variables<br />
The following selected instance variables found in the servo01 and scanner01<br />
objects are useful for debugging the positioning subsystem and analyzing<br />
undesirable symptoms. Some of the variable descriptions have been further<br />
annotated to describe their use and the likely symptomatic errors which they affect.<br />
servo01 object<br />
xdb<br />
Positioning deadband in customer units. Output velocity to the motor controller<br />
stops once a position complete is achieved within the dead band.<br />
The effect of making xdb too large is to have the scan positioning smooth but less<br />
reproducible. The increased positioning dead band absorbs much of the<br />
deceleration and no further corrections to the target position is made once the head<br />
has stopped. The net effect is to rely on coasting following the zero velocity output,<br />
to place the head in the same spot time after time. This effect is obviously related<br />
to the final head velocity prior to stopping and may be somewhat random.<br />
Making xdb too small will result in overshoot or oscillation of the head. As the<br />
head passes through the xdb area around the target, the head is brought back at<br />
activeVmin speed. If activeVmin is low, the comeback may be slow until , with<br />
vminTune turned on, activeVmin can be corrected. However, if activeVmin is<br />
large enough to overcome some high friction spot on the platform, it is likely that<br />
any overshoot will turn into an oscillation.<br />
vdb<br />
Velocity dead band in customer units per second. Is used to initialize avdb and<br />
dvdb at startup. DO NOT ADJUST!<br />
avdb<br />
Velocity dead band during the ACCELERATION phase. DO NOT ADJUST!<br />
advdb<br />
Velocity dead band used during the DECELERATION phase. DO NOT ADJUST!<br />
vmin/activeVmin<br />
vmin is the coldstart minimum velocity of the head when in the HOMING phase.<br />
activeVmin is the dynamic value that is used for the minimum velocity. If<br />
vminTune is turned off, then the two will always be equal. With vminTune turned<br />
on, activeVmin will increment as necessary to help overcome high friction spots<br />
along the frame. This adjustment is only made during the HOMING phase. If<br />
activeVmin gets too high, it can be brought back down to the original vmin value<br />
by turning off vminTune and re-entering the lower vmin value.<br />
3BUS 208 055 R1101<br />
Position and Motion Problems<br />
99
PROPRIETARY DATA: This document contains proprietary data of ABB Inc. No disclosure, distribution (electronic or otherwise),<br />
reproduction, or other means of dissemination may be made without written permission.<br />
The effect of activeVmin being too large causes noticeable speed increases when<br />
entering the HOMING phase, typically near the end point of a position request.<br />
Also the head will most likely oscillate around the position target.<br />
If activeVmin is too small, and vminTune is turned off, the head may take too much<br />
time before reaching the desired position target such as standardize, off-sheet, or<br />
the end point of a scan. If vminTune is turned on, then the servo will attempt to<br />
increase activeVmin until sufficient movement causes the position target to be<br />
reached.<br />
vmax<br />
The maximum allowed head velocity in customer units; this value limits any request<br />
for a higher velocity from the scanner01 object. For an English units system, this<br />
should be around 12-13 in/sec. On a Metric units system, it should be around<br />
31-32 cm/sec.<br />
vminFilterFactor<br />
Exponential filter factor used to adjust activeVmin when vminTune is active. DO<br />
NOT ADJUST!<br />
ddcExcessiveErrorPercent<br />
Only operative during the CRUISING phase, it is used to determine if an obstacle<br />
has been encountered. If so, the scanner is put in LOCAL (hand) mode, stopping<br />
the drive to the head. The units are in percent of speed target with failure occurring<br />
if a greater speed is required.<br />
ddcRestrictedMotionPercent<br />
Only operative during the CRUISING phase, it is used to determine if actual motion<br />
is too far below target. If so, the scanner is put in LOCAL (hand) mode, stopping<br />
the drive to the head. The units are in percent of expected motion with failure<br />
occurring if motion is too low.<br />
Accel<br />
The nominal acceleration in speed units per second. Typically this is set to one half<br />
the head velocity during scan. The value is used to determine both the<br />
ACCELERATION at the start of a scan, and the DECELERATION at the end of a<br />
scan. The higher the value, the faster cruise velocity is achieved at the start, and<br />
the quicker the speed drop off will be at the end of the scan. If too high, the head<br />
could appear to surge at the start of the scan, and, by coming into the position target<br />
too fast, can cause head overshoot and oscillation at the end of the scan. Low values<br />
of Accel will make the head appear to be sluggish as it may take a long time to reach<br />
cruising speed.<br />
Kp<br />
Proportional gain term of the DDC algorithm. DO NOT ADJUST!<br />
100 Position and Motion Problems<br />
3BUS 208 055 R1101
PROPRIETARY DATA: This document contains proprietary data of ABB Inc. No disclosure, distribution (electronic or otherwise),<br />
reproduction, or other means of dissemination may be made without written permission.<br />
Ki<br />
Integral gain term of the DDC algorithm. DO NOT ADJUST!<br />
slopep<br />
Positive direction servo velocity slope (home to far side of platform). DO NOT<br />
ADJUST!<br />
slopen<br />
Negative direction servo velocity slope (far to home side of platform). DO NOT<br />
ADJUST!<br />
biasp<br />
Positive direction servo velocity offset (home to far side of platform). DO NOT<br />
ADJUST!<br />
biasn<br />
Negative direction servo velocity offset (far to home side of platform). DO NOT<br />
ADJUST!<br />
vminTune<br />
Turns on/off the continuous tuning of activeVmin. It is only operative during the<br />
HOMING phase. The adjustment is only in the upward direction, making<br />
activeVmin ramp up as needed.<br />
sampleInterval<br />
The time interval in milliseconds between servo position commands. DO NOT<br />
ADJUST!<br />
xfinal[3]<br />
A three element array showing the intermediate breakpoint positions for<br />
ACCELERATION, CRUISING, and DECELERATION, for the current position<br />
request.<br />
vfinal[3]<br />
A three element array showing the intermediate velocities for ACCELERATION,<br />
CRUISING, and DECELERATION, for the current position request.<br />
increment[3]<br />
A three element array showing the intermediate velocity increments for<br />
ACCELERATION, CRUISING, and DECELERATION for the current position<br />
request. The units for CRUISE are in terms of position, while for ACCELERATION<br />
and DECELERATION, the units are in velocity.<br />
3BUS 208 055 R1101<br />
Position and Motion Problems<br />
101
PROPRIETARY DATA: This document contains proprietary data of ABB Inc. No disclosure, distribution (electronic or otherwise),<br />
reproduction, or other means of dissemination may be made without written permission.<br />
duration[3]<br />
A three element array showing the intermediate time duration for<br />
ACCELERATION, CRUISING, and DECELERATION for the current position<br />
request.<br />
homingError<br />
During the HOMING phase, it is the current head position error in customer units.<br />
farEdge<br />
The most recent target end point achieved in a forward direction. Not necessarily<br />
the actual far edge of sheet.<br />
homeEdge<br />
The most recent target end point achieved in a reverse direction. Not necessarily<br />
the actual home edge of sheet.<br />
scanner01 object<br />
maxEdgeChange<br />
If a sheet break occurs while the head is scanning, and the edge detectors see the<br />
tail of the sheet, it is possible that the system will incorrectly interpret this false<br />
edge as an edge change, resulting in incorrect scan limits the next time the head<br />
comes back on sheet. This variable will prevent a false edge from being established<br />
by only allowing a defined maximum change to take place. This variable should<br />
be set to correspond with the largest deckle change expected.<br />
dbWidth<br />
This is the databox width in customer units as determined at PMMRLD time. It is<br />
calculated from the max scan limits and number of data boxes.<br />
dbAvgTime<br />
The average amount of millisecond time spent in each databox. It is calculated from<br />
the scan time and the factual number of databoxes used.<br />
102 Position and Motion Problems<br />
3BUS 208 055 R1101
PROPRIETARY DATA: This document contains proprietary data of ABB Inc. No disclosure, distribution (electronic or otherwise),<br />
reproduction, or other means of dissemination may be made without written permission.<br />
healthRequest<br />
This variable controls the length of time the Workstation will stay in control of the<br />
scanner after exiting the Health Pages. The default time is approximately 15<br />
minutes. After leaving the Health Pages, this time can be extended by sending a<br />
message to the scanner defining the total amount of seconds desired for the extended<br />
control of the scanner by the workstation. The message to be sent while in the<br />
inspect utility is:<br />
()[scanner01 healthRequest:xxxxx]<br />
where: xxxxx is the desired number of<br />
seconds. The maximum time is<br />
32767 seconds.<br />
This permits troubleshooting to take place aside from that which can be done<br />
through the Health Pages alone. This variable must be set up each time the Health<br />
Pages are exited, if extended workstation control time is desired.<br />
maxSpeed<br />
Defines the maximum speed that the scanner can request from the servo. It should<br />
always be equal to or less than vmax in the servo01 object.<br />
positioningSafetyMargin<br />
The amount of buffer distance added to or deleted from the scanning trajectories in<br />
order to assure that the window does not go beyond the scan limits.<br />
target<br />
The current trajectory target in customer units.<br />
autoEOS<br />
An indication that the auto edge of sheet feature is active. This is controlled by the<br />
host computer and cannot be turned on from here.<br />
farEOSUnknown/homeEOSUnknown<br />
Two variables which indicate that there has been no detection of a sheet edge since<br />
startup. This can only be cleared if AEOS is on.<br />
inTransit<br />
Indicates that the head is currently moving or trying to move to a new position.<br />
During scan this is always true.<br />
scanning<br />
If true (1) it is an indication that the head has been told to scan.<br />
3BUS 208 055 R1101<br />
Position and Motion Problems<br />
103
PROPRIETARY DATA: This document contains proprietary data of ABB Inc. No disclosure, distribution (electronic or otherwise),<br />
reproduction, or other means of dissemination may be made without written permission.<br />
sheetBreakPresent<br />
True (1) if there is a physical sheet break present.<br />
stdzPending<br />
This will be true if a standardize request has been made from any source; host, FCP,<br />
or workstation.<br />
offSheetTimer<br />
Indicates the amount of accumulated time that the head has been off sheet provided<br />
that the offSheetTime instance variable has been set to a positive number of seconds<br />
(turned on).<br />
onSheetTimer<br />
Indicates the amount of accumulated time that the head has scanning on sheet since<br />
last being placed in scan mode, provided that the onSheetTime instance variable<br />
has been set to a positive number of seconds (turned on).<br />
Servo Diagnostic <strong>Troubleshooting</strong> Utility<br />
The servo system contains within itself, a diagnostic utility which will report the<br />
conditions and activities surrounding all trajectories requested by the scanner. This<br />
diagnostic will report details of how a trajectory achieving its goal, as well as how<br />
the HOMING activity is being adjusted in order to accomplish reaching the desired<br />
target. The bottom line is the ability to observe how close the system comes to<br />
reaching the desired trajectory target on any one scan or position request. The report,<br />
shown in Figure 3-1 on page 105, looks fairly complicated and is not designed for<br />
the casual user. It was intended for development checkout, but does contain<br />
information useful for service concerns.<br />
The structure of the report shows the following sequence of data:<br />
• Where the head is when a new trajectory request is made.<br />
• The mode (STOP_PAST, FIXED_POINT, etc.) and new target.<br />
• The ACCELERATION envelope.<br />
• The CRUISE envelope.<br />
• The DECELERATION envelope.<br />
• The HOMING envelope, including a separate line for each adjustment made<br />
within the HOMING process.<br />
• The final position is achieved.<br />
Activate the inspect utility and send the following message to start the diagnostic:<br />
()[servo01 startDiagnostics]<br />
104 Position and Motion Problems<br />
3BUS 208 055 R1101
PROPRIETARY DATA: This document contains proprietary data of ABB Inc. No disclosure, distribution (electronic or otherwise),<br />
reproduction, or other means of dissemination may be made without written permission.<br />
Each time a new trajectory is requested, a multi-line report with the above data will<br />
be brought to the screen. The report will continue to come out to the screen each<br />
time a new trajectory is computed until a command to stop is issued. Do this by<br />
again sending a message as follows:<br />
()[servo01 stopDiagnostics]<br />
NEW TRAJECTORY RCV0: at pos = 73.565000, v = 0.000000<br />
STOP_PAST : FROM: x = 73.565000, v = 0.000000 TO: X = 207.245000, V = 0.000000<br />
:ACCELERATING: FROM: x = 73.565000, v = 0.000000 TO: X = 77.530335, V = 4.455063, t = 1.308222, DELX = 0.340543<br />
:CRUISING: FROM: x = 76.235000, v = 4.455060 TO: X = 203.354310, V = 4.455060, t = 28.500000, DELX = 0.445500<br />
:DECELERATING: FROM: x = 203.125000, v = 4.204240 TO: X = 207.245000, V = 0.000000, t = 1.308000, DELX = -0.340540<br />
:REQUEST HONING: FROM: x = 204.815000, v = 2.842080 TO: X = 207.245000, V = 0.000000<br />
:CONTINUE HONING:FROM: x = 204.815000, v = 1.492990 TO: X = 207.245000, V = 0.000000<br />
:CONTINUE HONING:FROM: x = 207.045000, v = 0.000000 TO: X = 207.245000, V = 0.000000<br />
:CONTINUE HONING:FROM: x = 207.175000, v = 0.000000 TO: X = 207.245000, V = 0.000000<br />
:CONTINUE HONING:FROM: x = 207.205000, v = 0.000000 TO: X = 207.245000, V = 0.000000<br />
:CONTINUE HONING:FROM: x = 207.205000, v = 1.492990 TO: X = 207.245000, V = 0.000000<br />
:CONTINUE HONING:FROM: x = 207.205000, v = 1.791580 TO: X = 207.245000, V = 0.000000<br />
:CONTINUE HONING:FROM: x = 207.205000, v = 2.090170 TO: X = 207.245000, V = 0.000000<br />
:CONTINUE HONING:FROM: x = 207.245000, v = 0.000000 TO: X = 207.245000, V = 0.000000<br />
:CONTINUE HONING:FROM: x = 207.255000, v = 0.000000 TO: X = 207.245000, V = 0.000000<br />
:FINISHED HONING:Pos: = 207.255000, COM = 0.000000, TAR = 207.245000, ForStop = 0.244060, RevStop = 0.254530,<br />
HighFreq = 207.2550<br />
00<br />
POSITION ACHIEVED: AT: X = 207.255000: V = 0.000000<br />
Figure 3-1 Servo Diagnostics Report<br />
Selected Servo Diagnostics Definition of Terms:<br />
delx<br />
For Accel and Decel, it is the increment change in velocity. For Cruise, it is the<br />
incremental change in travel distance for DDC.<br />
STOP_PAST<br />
The normal mode for scanning where the goal is to make the head go just past the<br />
target so as to assure full measurement data is collected. In other scenarios, where<br />
a fixed position is sought, the mode will be FIXED_POINT.<br />
CONTINUE HOMING<br />
A line is output every time there is a position change or and incremental velocity<br />
change.<br />
FINISHED HOMING<br />
POS: The actual achieved position.<br />
COM: The final command velocity; normally 0.<br />
Tar: The initial target sought.<br />
ForStop: The forward scan coasting stopping distance after shutting off the<br />
drive.<br />
3BUS 208 055 R1101<br />
Position and Motion Problems<br />
105
PROPRIETARY DATA: This document contains proprietary data of ABB Inc. No disclosure, distribution (electronic or otherwise),<br />
reproduction, or other means of dissemination may be made without written permission.<br />
RevStop:<br />
HighFreq:<br />
The reverse scan coasting stopping distance after shutting off the<br />
drive.<br />
When the head reaches this position, the drive signal will be<br />
interrupted. It is determined by the following approximate<br />
relationship:<br />
HighFreq = Target + 0.8RevStop (reverse scan)<br />
HighFreq = Target - 0.8ForStop (forward Scan)<br />
106 Position and Motion Problems<br />
3BUS 208 055 R1101
PROPRIETARY DATA: This document contains proprietary data of ABB Inc. No disclosure, distribution (electronic or otherwise),<br />
reproduction, or other means of dissemination may be made without written permission.<br />
AEOS Setup Problems<br />
Make sure that you consistently use either all metric or all English dimensional<br />
units throughout the scanner, servo, and edgeDetector objects.<br />
If you use extended sheet guides on the head, make sure the edge detectors are<br />
outriggered outside the guide mounting. Placing them inside does not provide<br />
sufficient distance between the far window edge and the far detector. Mounting the<br />
edge detectors too close to the window edge may not give the head sufficient time<br />
to stop at the desired scan speed.<br />
The far and home TrackingDistance should be no smaller than the xdb variable<br />
in servo01. Making the tracking distances too small may position the window over<br />
the edge of the sheet. Also, the smaller EOSDeadband is made the more frequent<br />
edge changes will be reported to the host, resulting in longer edge-of-sheet times.<br />
Set the tracking distance variables so that the scan limit positions allow the edge<br />
detectors to see the edge of the sheet. If the tracking distance is larger than the<br />
DetectorOffset distance, especially on the far side where the farDetectorOffset<br />
distance tends to be short, then the head will move in a jerky manner when it is<br />
close to the edge of the sheet. The tracking distance should meet the following<br />
criteria at the respective far and home sides:<br />
(DetectorOffset - WindowClearance) > (TrackingDistance + EOSDeadband + xdb)<br />
Any time the farDetectorOffset or the homeDetectorOffset distance are changed,<br />
the ECF (platform microcontroller) must be reset using the uc_reset utility:<br />
uc_reset 31 -f<br />
The uc_reset utility writes the new values to the microcontroller from the MPRC<br />
board.<br />
3BUS 208 055 R1101<br />
Position and Motion Problems<br />
107
PROPRIETARY DATA: This document contains proprietary data of ABB Inc. No disclosure, distribution (electronic or otherwise),<br />
reproduction, or other means of dissemination may be made without written permission.<br />
Problem<br />
Detectors see an edge while the heads<br />
are not moving.<br />
Measure Scan Limits are exceeded.<br />
Neither detector sees a sheet edge while<br />
scanning.<br />
Head position problems.<br />
Detected edge is too close to the<br />
opposite edge.<br />
AEOS reached the limit without seeing<br />
edge.<br />
Table 3-5 Failure Modes<br />
Explanation<br />
When the head is stationary, a valid transition is<br />
unlikely. This invalid transition indicates a<br />
glitch in the edge detector electronics or an<br />
obstruction blocking the detectors from the<br />
sheet.<br />
If the detectors sense an edge–of–sheet which<br />
would cause the computed scan limit to be<br />
outside the MeasureLimit, the system issues an<br />
error message for the far side, or for the home<br />
side and uses that measurement.<br />
If the state of both edge detectors transition<br />
simultaneously, an error message is issued. This<br />
state may be caused by a sheet–break where the<br />
sheet disappears simultaneously from each<br />
detector, or it could indicate a glitch in the edge<br />
detector electronics.<br />
The system console reports several head<br />
position problems. If the head position analog<br />
input is not available or if the position<br />
computation cannot be completed, or if the head<br />
position analog signal is invalid, an error is<br />
issued.<br />
If the detected far edge–of–sheet is closer to the<br />
home edge–of–sheet than the width of the head<br />
(farHeadClearance plus<br />
homeHeadClearance) plus the curl distance,<br />
an error message is issued. If the detected home<br />
edge–of–sheet is closer to the far edge–of–sheet<br />
than the above distance, an error message is<br />
issued. These conditions can occur during a<br />
sheet–break where a tapered tail of the sheet is<br />
passing through the head, or it may also be a<br />
problem in the detector electronics.<br />
If the head is scanning toward the far side and<br />
the edge–of–sheet is not seen before the sensor<br />
window gets to the farMeasureLimit, an error<br />
message is issued. If the head is scanning toward<br />
the home side and the edge–of–sheet is not seen<br />
before the sensor window gets to the<br />
homeMeasureLimit, an error message is<br />
issued.<br />
(continued on next page)<br />
108 Position and Motion Problems<br />
3BUS 208 055 R1101
PROPRIETARY DATA: This document contains proprietary data of ABB Inc. No disclosure, distribution (electronic or otherwise),<br />
reproduction, or other means of dissemination may be made without written permission.<br />
Problem<br />
Far edge detector sees the paper<br />
machine threading ropes, driving the<br />
head into the ropes.<br />
The far and home edge detectors see a<br />
false home edge when the head is<br />
coming on-sheet, causing the head to go<br />
to a position just inside the<br />
homeMeasureLimit.<br />
Table 3-5 (continued)<br />
Explanation<br />
By setting the scanner01 flag<br />
allowSecondEdgeErrMsg to a 0, it will permit<br />
the AEOS logic to ignore the transition it sees<br />
when the far detector passes over the rope.<br />
The far detector sees the false edge and<br />
determines that is where the home sheet is,<br />
driving the head to a prepare to measure position<br />
based on the supposed edge sighting. This<br />
condition is more likely on a Smart Reflection<br />
Scanner where portions of the paper machine<br />
superstructure may be located such that it is<br />
detectable by the edge detectors. This situation<br />
can be alleviated by setting the flag<br />
allowEdgeOutsideLimits in the scanner01<br />
object to a “1”. This will ignore the error<br />
condition and permit the head to be positioned<br />
in the proper prepare to measure position.<br />
The above problems are visible through the pe utility error log printout.<br />
3BUS 208 055 R1101<br />
Position and Motion Problems<br />
109
PROPRIETARY DATA: This document contains proprietary data of ABB Inc. No disclosure, distribution (electronic or otherwise),<br />
reproduction, or other means of dissemination may be made without written permission.<br />
Frame Tuning and Diagnostic Tool, ft<br />
The ft utility is a menu driven, interactive program designed to allow the user to set<br />
up and monitor most of the variables associated with the scanner. Figure 3-2 and<br />
Figure 3-3 on the next two pages shows the organizational tree of the menu and is<br />
followed by a brief description of each function.<br />
To use the frame tuning utility, the console must be in the AVOS shell, indicated by<br />
the $$ prompt. Activate the utility by typing ft. Then follow the interactive<br />
instructions, selecting either the MODIFY path, or the DISPLAY path.<br />
In each of the MODIFY operations, the user is given the opportunity to save the<br />
modified data on diskette. The operation is similar to the gstore utility except that<br />
the proper community is selected automatically.<br />
When the option of saving the data is selected, the normal operation is to just press<br />
the carriage return and let the utility write the data to the indicated file using a date<br />
extension to the file name, just as is done using the gstore utility. As with the gstore<br />
utility, the current .init file should be saved on the DOS formatted diskette via the<br />
Service Workstation.<br />
110 Position and Motion Problems<br />
3BUS 208 055 R1101
PROPRIETARY DATA: This document contains proprietary data of ABB Inc. No disclosure, distribution (electronic or otherwise),<br />
reproduction, or other means of dissemination may be made without written permission.<br />
ENTER<br />
ft<br />
UTILITY<br />
Frame Tuning (ft) Menu Selections<br />
NOTE: After modifying any of the instance variables, remember<br />
to save the data to diskette either using the exit save commands<br />
within ft, or by doing a gstore to the appropriate frame or io<br />
community later.<br />
1<br />
2<br />
MODIFY<br />
VALUES<br />
DISPLAY<br />
STATUS<br />
1<br />
2 3 4 5 6<br />
7 8<br />
CURRENT<br />
SCANNER<br />
POSITION<br />
VALUES<br />
1<br />
CURRENT<br />
SPEED<br />
HEAD POSITION<br />
MOTOR<br />
CONTROLLER<br />
CALIBRATION<br />
2<br />
MOTOR<br />
CONTROLLER<br />
CALIBRATION<br />
3<br />
SCANNER/SHEET<br />
POSITION<br />
SETUP<br />
4<br />
SCANNER<br />
SPEED<br />
SETUP<br />
5<br />
SCANNER<br />
AUTO EDGE<br />
SETUP<br />
(if configured)<br />
CURRENT<br />
SCANNER<br />
REVIEW<br />
OPERATION<br />
6<br />
MANUAL<br />
SERVO<br />
CALIBRATION<br />
CURRENT<br />
SCANNER<br />
REQUEST LIST<br />
CURRENT<br />
SERVO<br />
STATUS<br />
SCANNING<br />
MONITOR<br />
CURRENT<br />
AEOS<br />
VALUES<br />
(if configured)<br />
ENGINEERING<br />
DISPLAY<br />
1 <strong>Scanning</strong> Monitor<br />
2 Servo Global Data<br />
3 Servo State Data<br />
4 Servo Timing Data<br />
5 Servo Trajectory Data<br />
6 Servo Tuning Data<br />
7 Frame Data<br />
8 Motor Controller Data<br />
9 Encoder Data<br />
Figure 3-2 Frame Tuning Utility Menu Tree<br />
3BUS 208 055 R1101<br />
Position and Motion Problems<br />
111
PROPRIETARY DATA: This document contains proprietary data of ABB Inc. No disclosure, distribution (electronic or otherwise),<br />
reproduction, or other means of dissemination may be made without written permission.<br />
Enter ft Utility<br />
1. Modify Values<br />
1. Head Position and Motor Controller Calibration<br />
Calibrates the head position encoder by first determining the encoder pulses at the homeTravelLimit, and then repeating the<br />
process at the farTravelLimit. Sets up default values for servo tuning parameters based on length of the frame.<br />
2. Motor Controller Calibration<br />
Determines the slope and offset calibration of the motor controller by driving the head at slow and fast speeds in both directions.<br />
3. Scanner/Sheet Position Setup<br />
Permits adjustment of the specific head positions on the scanner such as standardize position, measure limits, etc.<br />
4. Scanner Speed Setup<br />
Permits adjustment of the max speed, scan speed, on–sheet speed, and scan time.<br />
5. Scanner Auto Edge Setup (if configured)<br />
Permits adjustment of the various dimensions associated with the auto edge of sheet.<br />
6. <strong>Manual</strong> Servo Calibration<br />
Permits adjustment of variables associated with the tuning of the Servo object and motor controller.<br />
2. Display<br />
1. Current Scanner Position Values<br />
Shows current head positions along the length of the frame.<br />
2. Current Speed Values<br />
Shows the current speed values being used by the system.<br />
3. Current Scanner Review Operation<br />
Shows general operational status of the scanner including current head position, local/remote, sheet break, target position<br />
and velocity, AEOS on/off, and most recent edges.<br />
4. Current Scanner Request List<br />
Shows the current queue of trajectories and conditions that are in use and scheduled for use. The top request is the current<br />
active one.<br />
5. Current Servo Status<br />
Shows the accelerate, cruise, and decelerate target parameters for the servo in the current scan. Also indicates quality of the<br />
servo and motor controller tuning.<br />
6. <strong>Scanning</strong> Monitor<br />
A dynamic display with a 1/sec update showing a variety of parameters associated with servo tuning and trajectory, as well<br />
as error corrections being applied. Has dynamic picture of current head movement.<br />
7. Current AEOS Values (if configured)<br />
Shows the dimensions associated with the AEOS feature.<br />
8. Engineering Displays<br />
Advanced diagnostic displays. Update rates selectable at none, 1, 2, or 5 seconds. For example, selecting 91 will display the<br />
Encoder Data, updating at a 1/sec rate.<br />
1. <strong>Scanning</strong> Monitor<br />
A dynamic display with a 1/sec update showing a variety of parameters associated with servo tuning and trajectory, as<br />
well as error corrections being applied. Has dynamic picture of current head movement.<br />
2. Servo Global Data<br />
An update showing the servo parameters being used by the ECF board in both floating point and integer.<br />
3. Servo State Data<br />
Shows the operational condition of the servo<br />
4. Servo Timing Data<br />
A graphic display showing the dynamics associated with the accelerate, cruise, and decelerate phases<br />
of the scan. Includes last dwell time at the edge.<br />
5. Servo Trajectory Data<br />
A summary update of the current trajectory set point.<br />
6. Servo Tuning Data<br />
Shows the servo tuning data as it resides in the MPRC and in the ECF boards.<br />
7. Frame Data<br />
Update summary of the platform’s operational state showing dynamically determined edge positions, AEOS<br />
status, AEOS detector offsets, and setup status.<br />
8. Motor Controller Data<br />
Update of the current activities of the motor controller indicating its tuning, current output commands to the<br />
motor, and operational mode.<br />
9. Encoder Data<br />
Shows the current operational state of the encoder along with historical data regarding missed pulses and<br />
synchronization problems. This is a two-page report. Missed pulses at the home or off-sheet area are to be expected.<br />
Figure 3-3 Description of ft Menu Options<br />
112 Position and Motion Problems<br />
3BUS 208 055 R1101
PROPRIETARY DATA: This document contains proprietary data of ABB Inc. No disclosure, distribution (electronic or otherwise),<br />
reproduction, or other means of dissemination may be made without written permission.<br />
4<br />
ABB Smart Processing Center<br />
(ASPC) Hardware<br />
This chapter will help you trace signals to and from the ASPC by using specific<br />
software utilities.<br />
This chapter contains the following major sections:<br />
Section ...............................................................................................Page<br />
Host/Workstation Interface to the ASPC ....................................................... 114<br />
Inspecting and Repairing BRAM ................................................................... 116<br />
Digital I/O Utility ........................................................................................... 118<br />
Digital Input/Output Signal Verification and Tracing .................................... 120<br />
Analog Input Monitor Utility ......................................................................... 121<br />
Analog Input Signal Verification and Tracing ............................................... 125<br />
Using the Diagnostic Card Adapter ............................................................... 126<br />
LED Interpretation ......................................................................................... 139<br />
Analog and Digital I/O Documentation ......................................................... 146<br />
Power Down Analysis .................................................................................... 147<br />
Micro-Controller DC Power Log ................................................................... 152<br />
3BUS 208 055 R1101<br />
ABB Smart Processing Center (ASPC) Hardware<br />
113
PROPRIETARY DATA: This document contains proprietary data of ABB Inc. No disclosure, distribution (electronic or otherwise),<br />
reproduction, or other means of dissemination may be made without written permission.<br />
Host/Workstation Interface to the ASPC<br />
To use the Service Workstation for exercising the <strong>Scanning</strong> <strong>Platform</strong> you have to<br />
have the operation and application software loaded into the workstation and install<br />
a cable between the workstation and the platform. Refer to the <strong>Scanning</strong> <strong>Platform</strong><br />
System Software <strong>Manual</strong> (Software Releases 280.0 and Later),<br />
3BUS 208 051 RXX01.<br />
Connect the custom nine–pin connector from the serial port on the Service<br />
Workstation to the debug port (see Figure 4-1) on the <strong>Scanning</strong> <strong>Platform</strong>.<br />
114 ABB Smart Processing Center (ASPC) Hardware<br />
3BUS 208 055 R1101
PROPRIETARY DATA: This document contains proprietary data of ABB Inc. No disclosure, distribution (electronic or otherwise),<br />
reproduction, or other means of dissemination may be made without written permission.<br />
J1 TOP SIGNAL<br />
J2 DRIVE END P3 P4<br />
TOP POWER PROGRAM<br />
P5<br />
P1<br />
TOP POWER<br />
J3<br />
J4<br />
BOTTOM POWER PROGRAM<br />
P2<br />
J5 DRIVE END<br />
TOP SIG<br />
DIAG<br />
J6 SYSTEM SERIALJ7SERVICE PORT<br />
SHEET BREAK/REEL TURN-UP<br />
J8<br />
Service Port for the<br />
<strong>Scanning</strong> <strong>Platform</strong><br />
1<br />
2<br />
3<br />
J6 Socket Service Serial<br />
LOGIC_COMMON<br />
1<br />
2<br />
3<br />
LOGIC_COMMON 1<br />
4 HOST_20MA_TX+<br />
5 HOST_20MA_TX-<br />
6 HOST_20MA_RX+<br />
7 HOST_20MA_RX-<br />
8 HOST_20MA_DISABLE<br />
9 HOST_RS485_TX+<br />
10 HOST_RS485_TX-<br />
11 HOST_RS485_RX+<br />
12 HOST_RS485_RX-<br />
13 HOST_RX_ENABLE<br />
14 HOST_RTS<br />
15 LCOM<br />
16 LCOM<br />
17 LCOM<br />
086349-002<br />
Board Assignments<br />
J6 Socket Service Serial<br />
4 HOST_20MA_TX+<br />
5 HOST_20MA_TX-<br />
6 HOST_20MA_RX+<br />
7 HOST_20MA_RX-<br />
8 +15V TO AUI<br />
9 AUI TX-<br />
10 AUI TX+<br />
11 AUI CX-<br />
12 AUI CX+<br />
13 AUI RX+<br />
14 AUI RX-<br />
15 LOGIC COMMON<br />
LOGIC COMMON ON<br />
SCREWS<br />
086444-001<br />
Board Assignments<br />
J9<br />
J10<br />
WATER CHILLERS<br />
SMOOTHNESS 1<br />
J11<br />
SMOOTHNESS 2/MICRO WAVE<br />
ENVIRONMENT/HOME LIMIT SWITCH<br />
J12<br />
IDLE END<br />
J13 CONT PNL<br />
J17<br />
J18<br />
J15<br />
J16<br />
J19<br />
MOTOR<br />
DC<br />
IN<br />
J23<br />
J14<br />
BOTTOM AUX SIGNAL<br />
BOTTOM SIGNAL<br />
BOTTOM POWER<br />
J20<br />
POWER MONITOR<br />
DC<br />
IN<br />
J24<br />
REMOTE<br />
CONT PNL<br />
IR IR<br />
SOLA 1SOLA 2<br />
J21<br />
AC<br />
IN<br />
J22<br />
J25<br />
1<br />
2<br />
3<br />
4<br />
5<br />
6<br />
7<br />
8<br />
9<br />
10<br />
11<br />
J7<br />
Socket<br />
Service Port<br />
LOGIC_COMMON<br />
SRVC_20MA_TX+<br />
SRVC_20MA_TX-<br />
SRVC_20MA_RX+<br />
SRVC_20MA_RX-<br />
SRVC-RS232_TX<br />
SRVC_RS232_RX<br />
LCOM<br />
LCOM<br />
The Circuit Panel<br />
is located in the<br />
Idler End Column.<br />
Figure 4-1 Debug Port on the <strong>Scanning</strong> <strong>Platform</strong><br />
3BUS 208 055 R1101<br />
ABB Smart Processing Center (ASPC) Hardware<br />
115
PROPRIETARY DATA: This document contains proprietary data of ABB Inc. No disclosure, distribution (electronic or otherwise),<br />
reproduction, or other means of dissemination may be made without written permission.<br />
Inspecting and Repairing BRAM<br />
Periodically, the BRAM should be inspected and repaired if necessary, using the<br />
fsck utility. This routine comes with several options. The -n argument merely<br />
checks and notifies if there is a problem. This is done automatically at each startup.<br />
Repair of the BRAM can be done by using the fsck utility with a -y argument. The<br />
fsck utility with the -y argument, is a sophisticated repair routine which will clean<br />
up fragmented, unreadable, or otherwise unconnected files. Note that in the process<br />
of repair, some data may be lost depending on how extensive the repair activity is.<br />
The utility should be run with BRAM dismounted from the operating system. It<br />
should also be at a time when a restart could be made if necessary. Use the procedure<br />
below.<br />
Dismount the diskette to be repaired from the system, but do not remove it<br />
physically.<br />
$$ cd<br />
$$ umount /bram1or$$ umount /bram2<br />
Execute the following command:<br />
$$ fsck -y /bram1or $$ fsck -y /bram2<br />
The console will display the results as the operation progresses. See Figure 4-2 for<br />
an example.<br />
File System: Volume:<br />
** Phase 1 - Check Blocks and Sizes<br />
** Phase 2 - Check Path names<br />
** Phase 3 - Check Connectivity<br />
** Phase 4 - Check Reference Counts<br />
UNREF FILE I=263 OWNER=0<br />
MODE=100666<br />
SIZE=21412 MTIME=04-18-1986 10:12<br />
(NOT EMPTY)<br />
RECONNECT yes<br />
** Phase 5 - Check Free List<br />
84 files 1130 blocks 442 free (example)<br />
Figure 4-2 Example of Diskette Repair Activity<br />
116 ABB Smart Processing Center (ASPC) Hardware<br />
3BUS 208 055 R1101
PROPRIETARY DATA: This document contains proprietary data of ABB Inc. No disclosure, distribution (electronic or otherwise),<br />
reproduction, or other means of dissemination may be made without written permission.<br />
The repaired files will be placed in the lost+found directory just in case there was<br />
anything useful to be recovered. Generally, this is not the case. The free space will<br />
not be recovered until the bogus files are removed in the next step.<br />
Remount the repaired diskette and make the lost+found directory active by entering<br />
the following:<br />
$$ mount /bram1/ss01 $$ mount /bram2 /appl<br />
$$ cd /ss01/lost+found or $$ cd /appl/lost+found<br />
Remove the bogus files from the lost+found directory with the following command:<br />
$$ rm *<br />
3BUS 208 055 R1101<br />
ABB Smart Processing Center (ASPC) Hardware<br />
117
PROPRIETARY DATA: This document contains proprietary data of ABB Inc. No disclosure, distribution (electronic or otherwise),<br />
reproduction, or other means of dissemination may be made without written permission.<br />
Digital I/O Utility<br />
The interactive digital I/O utility, dim, is a menu driven display of the digital signals<br />
which are routed through the platform. Refer to Figure 4-3. The functions which<br />
are available are:<br />
• Display of current state and toggle bit masks<br />
• Print out the i/o configuration<br />
• Toggle the bit(s) on a user defined time<br />
dim Main Menu<br />
Enter<br />
DIGITAL I/O DIAGNOSTIC UTILITY<br />
@(#)dim.m:imp200.999; Tue MAY 14 16:24:15 EDT 1992<br />
1 to display digital i/o signals (invert input, toggle outputs)<br />
2 to print i/o configuration<br />
3 to change toggle duration [1200 secs.] or rate [5 secs.]<br />
q to exit<br />
Figure 4-3 Main Menu for the Digital I/O Utility<br />
Procedure for Using the dim Utility<br />
Instructions for using this activity appear at the bottom of the page displayed on the<br />
Service Workstation. They will direct you through the steps to be taken. Refer to<br />
the following pages for examples of the menus.<br />
1. At the $$ prompt type: dim<br />
The dim main menu is displayed.<br />
2. Select item 1 from the dim main menu to look at i/o states.<br />
The active options are displayed.<br />
3. Select the i/o device you want to view by identifying both number and port.<br />
4. Turn off the print function by pressing SHIFT and F2. This prevents the printer<br />
from responding to state changes when they occur.<br />
5. Perform whatever activities are desired. To make a hard copy, press PRINT<br />
SCREEN.<br />
6. To exit, press q. Each time q is pressed, the screen will go back to the previous<br />
page. If invert mask changes have been made, the utility will ask if they are to<br />
be left as is. Then it will remind the user to do a gstore to save the data for the<br />
next restart. The dim utility has been completely exited when the $$ prompt<br />
returns.<br />
Note:<br />
Bit toggling will cease upon exiting the utility.<br />
118 ABB Smart Processing Center (ASPC) Hardware<br />
3BUS 208 055 R1101
PROPRIETARY DATA: This document contains proprietary data of ABB Inc. No disclosure, distribution (electronic or otherwise),<br />
reproduction, or other means of dissemination may be made without written permission.<br />
dim Reports<br />
I/O Selection<br />
DIGITAL I/O MONITOR (i/o selection)<br />
Device<br />
Name Number Input Ports Output Ports<br />
ucFrame01 0 (1,3) (2,4)<br />
ucbeta01 1 (1) (2)<br />
Selection of Device 0, Input Port 1<br />
Figure 4-4 I/O Selection Menu<br />
DIGITAL I/O MONITOR (invert input)<br />
ucFrame01 [Board:00 Port:01] [Digital Input Session Status01]<br />
Signal Name Channel Value Validity<br />
Figure 4-5 Digital I/O Monitor<br />
Printout of I/O Configuration<br />
State<br />
Changes<br />
Invert<br />
sheetBreak01 0 1 0x0000 0 0<br />
reelTurnUp01 1 0 0x0000 0 0<br />
motorOverLoad01 2 0 0x0000 0 0<br />
airPurge01 3 1 0x0000 0 0<br />
chillerFlowSwitchA01 4 1 0x0000 0 0<br />
chillerFlowSwitchB01 5 1 0x0000 0 0<br />
homeEOSDetector01 6 1 0x0000 0 0<br />
farEOSDetector01 7 1 0x0000 0 0<br />
headsSplit01 8 0 0x0000 0 0<br />
reverseLimit01 9 0 0x0000 0 0<br />
forwardLimit01 10 0 0x0000 0 0<br />
frameBetaShutterNotClosed01 11 0 0x0000 0 0<br />
frameAshShutterNotClosed01 12 0 0x0000 0 0<br />
Not Defined 13 0 0x0000 0 0<br />
Not Defined 14 0 0x0000 0 0<br />
Not Defined 15 0 0x0000 0 0<br />
Enter ‘i’ to change invert flag or ‘q’ to quit<br />
at 0:<br />
ucHardware (UCSubsystem)<br />
at 0:ucFrame01 (UCFrame) [-->FRAME_UC hdlc_addr:0x1f]<br />
at 0:ucFrame01_port00 (UCAnalogPort)<br />
at 1:ucFrame01_port00_ch01 (UCAnalogChan) [-->framePurgeAirFlow01_ai]<br />
Figure 4-6 Partial Example of an I/O Configuration Printout<br />
3BUS 208 055 R1101<br />
ABB Smart Processing Center (ASPC) Hardware<br />
119
PROPRIETARY DATA: This document contains proprietary data of ABB Inc. No disclosure, distribution (electronic or otherwise),<br />
reproduction, or other means of dissemination may be made without written permission.<br />
Digital Input/Output Signal Verification and<br />
Tracing<br />
All digital inputs and outputs are transmitted via the microcontrollers. Examination<br />
of these digital signals is best accomplished using the dim utility. This interactive<br />
utility provides console access to each of the input and output databases. This utility<br />
will display name, bit number, current status, and invert status for each bit in the<br />
data base.<br />
The dim utility provides the capability of monitoring, inverting, or toggling any bit<br />
located within the system. The toggle feature exercises one or more bits on a user<br />
defined time cycle.<br />
Digital signal tracing between the ASPC assembly and the sensor head package can<br />
be done using the aids and tools described in “Using the Diagnostic Card Adapter”<br />
on page 126.<br />
120 ABB Smart Processing Center (ASPC) Hardware<br />
3BUS 208 055 R1101
PROPRIETARY DATA: This document contains proprietary data of ABB Inc. No disclosure, distribution (electronic or otherwise),<br />
reproduction, or other means of dissemination may be made without written permission.<br />
Analog Input Monitor Utility<br />
The analog input monitor utility, aim, has a variety of functions to assist in<br />
evaluating the performance of the analog inputs. The services include:<br />
• Input voltage monitoring<br />
• Statistical analysis of any selected input<br />
• Microcontroller board internal gain monitoring<br />
• Display of microcontroller A/D slope and offset<br />
aim Main Menu<br />
Upon entering the utility, a menu is displayed (see Figure 4-7). Except for the menu<br />
and statistics display pages, each page will show the analog input signal name and<br />
board/channel number. Only those analog inputs defined by the system<br />
configuration will be included. The bottom line of the page will give the interactive<br />
instructions to either exit or proceed to another function.<br />
The key to using the aim utility is to select the device first and then select the type<br />
of information you want to collect.<br />
ANALOG INPUT DIAGNOSTIC UTILITY<br />
@(#)aim.m:imp200.999:Thu Sep 12 09:21:07 EDT 1991<br />
Enter<br />
1 to select device (frame/sensor) for analog input display<br />
2 to display analog input signals (statistics)<br />
3 to display AI channel gains<br />
4 to display AI channel slopes and offsets<br />
q to quit<br />
Figure 4-7 aim Main Menu<br />
Procedure for Using the aim Utility<br />
Refer to the following pages for examples of the aim reports.<br />
1. At the $$ prompt type: aim<br />
2. At the aim Main Menu type: 1<br />
The Device Selection Menu appears. (Figure 4-8)<br />
3. At the Device Selection Menu select the number of the device you want to<br />
collect on.<br />
An arrow appears beside the selection you have picked.<br />
4. At the Device Selection Menu type: q<br />
This action returns you to the main menu so you can select the type of<br />
information to collect about the selected device.<br />
3BUS 208 055 R1101<br />
ABB Smart Processing Center (ASPC) Hardware<br />
121
PROPRIETARY DATA: This document contains proprietary data of ABB Inc. No disclosure, distribution (electronic or otherwise),<br />
reproduction, or other means of dissemination may be made without written permission.<br />
5. At the aim Main menu select:<br />
2 to display Input Signals<br />
3 to display Gains<br />
4 to display Slopes/Offsets<br />
6. To exit, press q.<br />
Each time q is pressed, the display will go back one page. Keep pressing q until<br />
the AVOS prompt returns.<br />
If displaying the input signal page or the statistics page, turn off the print function<br />
by pressing SHIFT and F2. This will prevent the printer from responding to each<br />
refresh of the screen.<br />
To make a hard copy, press SHIFT and PRINT.<br />
aim Reports<br />
I/O Device Selection Report<br />
Select the device you are going to collect data on from this menu. Refer to Figure<br />
4-8.<br />
ANALOG INPUT DIAGNOSTIC MONITOR (i/o selection)<br />
Device Name Number<br />
ucFrame01 0<br />
ucBeta01 1<br />
ucIR01 2<br />
ucOptipak01 4<br />
ucGeneral01 7<br />
Enter device number or ’q’ to return to menu<br />
Figure 4-8 I/O Selections from the aim Report<br />
After you have entered a device number an arrow appears to the right of your<br />
selection as in Figure 4-9.<br />
ANALOG INPUT DIAGNOSTIC MONITOR (i/o selection)<br />
Device Name Number<br />
ucFrame01 0<br />
ucBeta01 1<br />
ucIR01 2<br />
ucOptipak01 4
PROPRIETARY DATA: This document contains proprietary data of ABB Inc. No disclosure, distribution (electronic or otherwise),<br />
reproduction, or other means of dissemination may be made without written permission.<br />
AI Signal Report (Statistics)<br />
Input display maintains a one second refresh of the signal voltage input as it appears<br />
to the micro–controller board. See Figure 4-10 for an example. Selection is<br />
determined by entering the board and channel number as requested by the prompt.<br />
ANALOG INPUT MONITOR (Input values)<br />
Signal Name Bd-Ch Value Signal Name Bd-Ch Value<br />
framePurgeAirFlow01 0-01 5.0394 powerShelfTemp01 0-02 5.0394<br />
motorControllerTemp01 0-03 0.0000 frameAnalogOutVoltage01 0-05 0.0000<br />
frameDigitalSupplyVoltage 0-06 5.0000 frameBoardTemp01 0-07 1.1328<br />
frameThermRefVoltage01 0-08 5.0000 frameA2DPosSupplyVoltage0 0-09 15.0187<br />
frameA2DNegSupplyVoltage0 0-10 -14.691 frameA2DRefSupplyVoltage01 0-11 4.9609<br />
Enter ’s’ to collect/display stats for a signal or ’q’ to return to menu<br />
Figure 4-10 aim Input Values<br />
The statistics function for the selected analog input, will calculate and display the<br />
number of samples, mean, high, low, variance, and standard deviation, for as long<br />
as the display is active. Both the accumulated and the most recent delta values are<br />
displayed. See Figure 4-11 for an example. Keep in mind that any external<br />
interference in the signal, such as a standardize cycle, will be reflected in the<br />
displayed results.<br />
ANALOG INPUT MONITOR (AI channel statistics)<br />
Analog Input Statistics for headPosition01<br />
Accumulated<br />
Delta<br />
Samples 200 50<br />
Mean: 51.050 51.050<br />
High: 51.050 51.050<br />
Low: 51.050 51.050<br />
Variance: 0.000 0.000<br />
Std Dev: 0.000 0.000<br />
Figure 4-11 aim Statistics Display Page<br />
3BUS 208 055 R1101<br />
ABB Smart Processing Center (ASPC) Hardware<br />
123
PROPRIETARY DATA: This document contains proprietary data of ABB Inc. No disclosure, distribution (electronic or otherwise),<br />
reproduction, or other means of dissemination may be made without written permission.<br />
AI Channel Gains Report<br />
Figure 4-12 shows the gain (attenuation) being applied to analog inputs on channels<br />
1, 2, 3, 5, 6, 7, 8, 9, 10, and 16 on board 0. A gain (or attenuation) of 255 indicates<br />
no attenuation. A Gain of 128 would indicate a 0.5 attenuation.<br />
ANALOG INPUT MONITOR (SOFTWARE GAINS)<br />
Signal Name Bd-Ch Gain Signal Name Bd-Ch Gain<br />
framePurgeAirFlow01 0-01 0 powerShelfTemp01 0-02 0<br />
motorControllerTemp01 0-03 0 frameAnalogOutVoltage01 0-05 0<br />
frameDigitalSupplyVoltage 0-06 0 frameBoardTemp01 0-07 0<br />
frameThermRefVoltage01 0-08 0 frameA2DPosSupplyVoltage0 0-09 0<br />
frameA2DNegSupplyVoltage0 0-10 0 frameA2DRefSupplyVoltage01 0-11 0<br />
headPosition01 0-16 0 0<br />
Figure 4-12 aim Software Gains Report<br />
AI Channel Slopes and Offsets Report<br />
The same channels having gain adjustments also have adjustable slopes and offsets.<br />
All other channels are given a fixed slope of 1.0 and a fixed offset of 0.0. Slopes<br />
and offsets are computed at the beginning of each standardize and after each reset.<br />
See Figure 4-13.<br />
ANALOG INPUT MONITOR (A/D slopes & offsets)<br />
Signal Name Slope Offset Signal Name Slope Offset<br />
framePurgeAirFlow01 0.0394 0.0000 powerShelfTemp01 0.0394 0.0000<br />
motorControllerTemp01 1.0000 0.0000 frameAnalogOutVoltage01 0.0391 0.0000<br />
frameDigitalSupplyVoltage 0.0391 0.0000 frameBoardTemp01 0.0195 0.0000<br />
frameThermRefVoltage01 0.0391 0.0000 frameA2DPosSupplyVoltage0 0.0844 0.0000<br />
frameA2DNegSupplyVoltage0 0.0342 -18.38 frameA2DRefSupplyVoltage01 0.0391 0.0000<br />
headPosition01 1.0000 0.0000<br />
Figure 4-13 aim Slopes and Offsets Report<br />
124 ABB Smart Processing Center (ASPC) Hardware<br />
3BUS 208 055 R1101
PROPRIETARY DATA: This document contains proprietary data of ABB Inc. No disclosure, distribution (electronic or otherwise),<br />
reproduction, or other means of dissemination may be made without written permission.<br />
Analog Input Signal Verification and Tracing<br />
This section deals with the tools available to analyze these issues and to provide<br />
some direction in pursuing fault detection and isolation including:<br />
• Checking signal level as seen by software.<br />
• Determining the noise level present on the signal.<br />
• Tracing the signal from point of origin in the platform or sensor head to the<br />
microcontroller.<br />
As a quick check to see if analog signals are being received into the system, use the<br />
aim utility. The aim utility displays the complete array of sensor and <strong>Platform</strong><br />
related analog inputs giving the name, aim channel, and current value. The current<br />
value is refreshed every five seconds. Figure 4-14 shows an example of the aim<br />
analog input display.<br />
Note:<br />
Since data on this display is refreshed, turn off the printer by pressing<br />
Shift–F2. If you want a hard copy of the data, press<br />
Shift–Print Screen.<br />
aim Diagnostic Utility (input voltage)<br />
Signal Name Channel Volts Signal Name Channel Volts<br />
beta01 16 0.093 headPosition01 19 2.073<br />
IRMoistureAbsorption01 20 6.769 IRFiberAbsorption01 21 5.492<br />
IRMoistureReference01 22 6.632 IRFiberReference01 23 5.639<br />
detectorColumnTemp01 28 1.690 detectorGapTemp01 29 1.670<br />
SourceGapTemp01 30 1.661 sourceColumnTemp01 31 1.680<br />
Enter s to collect/display statistics for a channel or q to return to menu<br />
Figure 4-14 Example of aim Analog Input Display<br />
An additional aim function useful in troubleshooting analog input problems is<br />
Statistical analysis of any analog input. This gives a running calculation of the<br />
mean, high, low, variance, and standard deviation for as long as the variable is<br />
selected. When looking at sensor inputs, it is best to place the system in single<br />
point to avoid the periodic interference of the standardize mode which will affect<br />
the data.<br />
3BUS 208 055 R1101<br />
ABB Smart Processing Center (ASPC) Hardware<br />
125
PROPRIETARY DATA: This document contains proprietary data of ABB Inc. No disclosure, distribution (electronic or otherwise),<br />
reproduction, or other means of dissemination may be made without written permission.<br />
Using the Diagnostic Card Adapter<br />
It is possible to monitor the signals as they enter the <strong>Scanning</strong> <strong>Platform</strong> backplane<br />
connector panel. The signal connector panel on the backplane provides a parallel<br />
set of input connectors labeled Diagnostics, which use the Test Cable assembly<br />
(p/n 085126-002). Figure 4-16 shows the position of these connectors on the<br />
backplane. Test Card Kit (p/n 086086-005) should be used to identify the signal<br />
assignments for each connector.<br />
Note:<br />
The Test Card Kit is primarily for use with the -003 backplane. For<br />
a -004 backplane, use the generic diagnostic card from the kit. It<br />
does not have any predefined functions on it, but does give the<br />
correct pin numbers associated with the diagnostic plug to which the<br />
adaptor is connected. Use the System Functional Diagrams from<br />
the appropriate <strong>Scanning</strong> <strong>Platform</strong> Print Book, 3BUS 208 006<br />
RXX01 or<br />
3BUS 208 007 RXX01, to determine the pin numbers for desired<br />
functions.<br />
126 ABB Smart Processing Center (ASPC) Hardware<br />
3BUS 208 055 R1101
PROPRIETARY DATA: This document contains proprietary data of ABB Inc. No disclosure, distribution (electronic or otherwise),<br />
reproduction, or other means of dissemination may be made without written permission.<br />
Figure 4-15 ASPC Backplane (-003 Version Shown)<br />
3BUS 208 055 R1101<br />
ABB Smart Processing Center (ASPC) Hardware<br />
127
PROPRIETARY DATA: This document contains proprietary data of ABB Inc. No disclosure, distribution (electronic or otherwise),<br />
reproduction, or other means of dissemination may be made without written permission.<br />
The <strong>Scanning</strong> <strong>Platform</strong> diagnostic card slides into a plug–in unit that provides a<br />
source for easy checks for voltages and signals. The Smart Processing Center and<br />
the sensor electrical interconnect board (SEI) have diagnostic connectors with which<br />
the plug–in unit connects. Refer to Figure 4-16.<br />
Test Card Kit<br />
Smart Processing Center<br />
Test Board Kit<br />
<strong>Scanning</strong><br />
<strong>Platform</strong><br />
Top Signal<br />
J3<br />
TOP SIGNAL<br />
J1<br />
TOP<br />
SIGNAL<br />
DIAGNOSTICS<br />
J2<br />
J4<br />
TOP POWER<br />
DVM<br />
Figure 4-16 Test Board Hookup<br />
There is a separate test card for each diagnostic connector. Use a DVM or<br />
oscilloscope to monitor the desired signals at the test panel after inserting the correct<br />
test card.<br />
128 ABB Smart Processing Center (ASPC) Hardware<br />
3BUS 208 055 R1101
PROPRIETARY DATA: This document contains proprietary data of ABB Inc. No disclosure, distribution (electronic or otherwise),<br />
reproduction, or other means of dissemination may be made without written permission.<br />
Note:<br />
Note that the current diagnostic card inserts when used on the signed<br />
connectors of the ASPC backplane are only for the -003 version of<br />
the backplane. For a -004 backplane, use the universal card insert<br />
and refer to the -004 system functionals for pin function. The<br />
Diagnostic Card Adapter can be used to examine signals from the<br />
carriage assembly. Refer to Figure 4-17.<br />
NOTE: Static Box is not shown<br />
AUX SIGNAL<br />
AUX POWER<br />
SIGNAL<br />
POWER<br />
Idler End View<br />
Figure 4-17 Carriage Assembly<br />
Note:<br />
The Aux Signal is never used. Aux Power is only used with old Ash<br />
Sensors to access the external J–box.<br />
3BUS 208 055 R1101<br />
ABB Smart Processing Center (ASPC) Hardware<br />
129
PROPRIETARY DATA: This document contains proprietary data of ABB Inc. No disclosure, distribution (electronic or otherwise),<br />
reproduction, or other means of dissemination may be made without written permission.<br />
Diagnostic Cards<br />
The <strong>Scanning</strong> <strong>Platform</strong> Top Power card is to be used for diagnostics performed at<br />
the sensor only. Refer to Figure 4-18.<br />
1 POWER COMMON<br />
SYSTEM<br />
-12 VDC<br />
20<br />
2 HV TEST CARRIAGE<br />
21 +12 VDC<br />
ONLY<br />
SYSTEM<br />
IR<br />
120 VAC<br />
ABB®<br />
LO<br />
HI<br />
19<br />
37<br />
CALIPER<br />
PRESSURE LO 36<br />
22 RETURN<br />
GLOSS LAMP<br />
23 POWER<br />
120 VAC<br />
HEATED<br />
AIR WIPE LO 35<br />
HI 34<br />
24 RETURN<br />
OPTIPAK LAMP<br />
ASH<br />
HEATER<br />
LO 33<br />
25<br />
POWER<br />
120 VAC<br />
HI 32<br />
28 -15 VDC<br />
27<br />
SIGNAL<br />
COMMON<br />
28 +15 VDC<br />
SYSTEM<br />
BW<br />
HEATER LO 31<br />
CALIPER<br />
HEAD LIFT<br />
SOLENOID LO 30<br />
SCANNING PLATFORM<br />
TOP POWER<br />
086086-052, SIDE 1, REV A<br />
Figure 4-18 Diagnostic Card: Top Power<br />
130 ABB Smart Processing Center (ASPC) Hardware<br />
3BUS 208 055 R1101
PROPRIETARY DATA: This document contains proprietary data of ABB Inc. No disclosure, distribution (electronic or otherwise),<br />
reproduction, or other means of dissemination may be made without written permission.<br />
The <strong>Scanning</strong> <strong>Platform</strong> Bottom Power card is to be used for diagnostics performed<br />
at the sensor only. Refer to Figure 4-19.<br />
1 POWER COMMON<br />
20 -12 VDC<br />
SYSTEM<br />
ABB®<br />
19<br />
37<br />
21 +12 VDC<br />
BW SHUTTER<br />
LO 36<br />
22 SHUTTER<br />
ASH<br />
23 FLAG<br />
24 RETURN<br />
GLOSS LAMP<br />
25 POWER<br />
CALIPER HEATER/<br />
VACUUM/PURGE LO 35<br />
120 VAC<br />
ASH<br />
HEATER<br />
120 VAC<br />
HI 34<br />
LO 33<br />
HI 32<br />
26 -15 VDC<br />
27 SIGNAL<br />
COMMON SYSTEM<br />
28 +15 VDC<br />
BW<br />
HEATER<br />
HEATED<br />
AIR WIPE<br />
LO 31<br />
LO 30<br />
SCANNING PLATFORM<br />
BOTTOM POWER<br />
086086-052, SIDE 2, REV A<br />
Figure 4-19 Diagnostic Card: Bottom Power<br />
3BUS 208 055 R1101<br />
ABB Smart Processing Center (ASPC) Hardware<br />
131
PROPRIETARY DATA: This document contains proprietary data of ABB Inc. No disclosure, distribution (electronic or otherwise),<br />
reproduction, or other means of dissemination may be made without written permission.<br />
The <strong>Scanning</strong> <strong>Platform</strong> Top Signal card is to be used for diagnostics performed both<br />
at the sensor and the Smart Processing Center -003 backplane. Refer to Figure 4-<br />
20. For a -004 backplane, use the universal card insert and refer to the system<br />
functionals.<br />
1 ASH (Purge)<br />
ABB®<br />
20 COMMON<br />
DIAGNOSTIC<br />
IR LAMP SENSE<br />
19<br />
2 BW (Purge)<br />
21 HI<br />
3 LO<br />
22 HI<br />
4<br />
23<br />
5<br />
24<br />
6<br />
25<br />
7<br />
26<br />
8<br />
27<br />
9<br />
28<br />
10<br />
LO<br />
HI<br />
LO<br />
HI<br />
LO<br />
HI<br />
LO<br />
HI<br />
LO<br />
GAP<br />
SENSOR<br />
CAP<br />
or ATC COLUMN<br />
+4.5V BIAS<br />
BW<br />
ASH<br />
BRIGHTNESS<br />
ATC GAP<br />
BW<br />
INTERLOCK<br />
GLOSS<br />
CALIPER<br />
AIR<br />
BEARING<br />
BW<br />
THERMISTOR<br />
GLOSS CLAMP<br />
OPTIPAK CLAMP<br />
AUTO EDGE<br />
OF SHEET<br />
ELECTROMETER<br />
TEST/CLAMP<br />
SHEET<br />
TEMPERATURE<br />
ASH<br />
IR<br />
LOGIC<br />
SCANNING PLATFORM<br />
TOP SIGNAL<br />
086086-051, SIDE 1, REV A<br />
OFF<br />
ON<br />
ASH<br />
BW<br />
LO<br />
HI<br />
THERMISTOR<br />
+4.5V BIAS<br />
LO<br />
HI<br />
37<br />
18<br />
36<br />
17<br />
35<br />
16<br />
34<br />
15<br />
33<br />
14<br />
32<br />
13<br />
31<br />
12<br />
30<br />
11<br />
29<br />
Figure 4-20 Diagnostic Card: Top Signal<br />
132 ABB Smart Processing Center (ASPC) Hardware<br />
3BUS 208 055 R1101
PROPRIETARY DATA: This document contains proprietary data of ABB Inc. No disclosure, distribution (electronic or otherwise),<br />
reproduction, or other means of dissemination may be made without written permission.<br />
The <strong>Scanning</strong> <strong>Platform</strong> Bottom Signal card is to be used for diagnostics performed<br />
both at the sensor and the Smart Processing Center -003 backplane. Refer to Figure<br />
4-21 for the sensor card and to Figure 4-22 for the Backplane diagnostic card. For<br />
the -004 backplane, use the universal insert card and refer to the system functionals.<br />
1<br />
ASH (Purge)<br />
ABB®<br />
20<br />
COMMON<br />
DIAGNOSTIC<br />
19<br />
2<br />
BW (Purge)<br />
GLOSS CLAMP<br />
37<br />
21<br />
3<br />
22<br />
4<br />
HI (-)<br />
LO<br />
HI<br />
LO<br />
FORMATION<br />
CALIPER<br />
PROXIMITER<br />
OPTIPAK CLAMP<br />
ASH<br />
SHUTTER<br />
SWITCH<br />
CURRENT<br />
MONITOR<br />
MONITOR<br />
COMMON<br />
18<br />
36<br />
17<br />
35<br />
23<br />
5<br />
HI<br />
LO<br />
OPACITY<br />
X-RAY H.V.<br />
MONITOR<br />
16<br />
34<br />
24<br />
6<br />
25<br />
7<br />
26<br />
8<br />
27<br />
9<br />
28<br />
10<br />
INTERNAL CAP<br />
or ATC COLUMN<br />
+4.5V BIAS<br />
HI<br />
LO<br />
HI<br />
LO<br />
HI<br />
LO<br />
THERMISTOR<br />
+4.5V BIAS<br />
GLOSS<br />
OPTIPAK<br />
VACUUM<br />
CALIPER<br />
VACUUM/<br />
THERMISTOR<br />
BW<br />
THERMISTOR<br />
ASH<br />
BW<br />
IR<br />
ALARM<br />
GRID<br />
SHUTTER<br />
SWITCH<br />
INT. CHECK<br />
SAMPLE<br />
GAIN<br />
MONITOR<br />
LO<br />
SIGNAL<br />
HI<br />
DECREASE<br />
GAIN<br />
GAIN<br />
+15V<br />
INCREASE<br />
GAIN<br />
15<br />
33<br />
14<br />
32<br />
13<br />
31<br />
12<br />
30<br />
11<br />
29<br />
SCANNING PLATFORM<br />
BOTTOM SIGNAL<br />
086086-051, SIDE 2, REV A<br />
Figure 4-21 Diagnostic Card: Bottom Signal Sensor<br />
3BUS 208 055 R1101<br />
ABB Smart Processing Center (ASPC) Hardware<br />
133
PROPRIETARY DATA: This document contains proprietary data of ABB Inc. No disclosure, distribution (electronic or otherwise),<br />
reproduction, or other means of dissemination may be made without written permission.<br />
ABB®<br />
TOP POWER<br />
CALIPER HEAD<br />
LIFT SOLENOID<br />
120VAC HI<br />
120VAC HI<br />
CALIPER<br />
PRESSURE<br />
IR 120VAC LO<br />
J3<br />
J4<br />
BW HEATER<br />
ASH HEATER<br />
HEATED<br />
AIR WIPE<br />
IR 120VAC HI<br />
CHASSIS<br />
-12VDC<br />
GLOSS LAMP<br />
RETURN<br />
OPTIPAK LAMP<br />
RETURN<br />
-15VDC<br />
+15VDC<br />
POWER COMMON<br />
+12VDC<br />
GLOSS LAMP<br />
POWER<br />
OPTIPAK LAMP<br />
POWER<br />
SIGNAL COMMON<br />
1 2 3 4 5 6 7 8 9 10<br />
1 2 3 4 5 6 7 8 9 10<br />
BOTTOM POWER<br />
10<br />
9<br />
8<br />
7<br />
6<br />
5<br />
4<br />
3<br />
2<br />
1<br />
J17<br />
10<br />
9<br />
8<br />
7<br />
6<br />
5<br />
4<br />
3<br />
2<br />
1<br />
J18<br />
BW HEATER<br />
ASH HEATER<br />
CALIPER HEAT/<br />
VACUUM/PURGE<br />
CHASSIS<br />
-12VDC<br />
ASH SHUTTER<br />
GLOSS LAMP<br />
RETURN<br />
-15VDC<br />
+15VDC<br />
HEATED<br />
AIR WIPE<br />
120VAC HI<br />
120VAC HI<br />
BW SHUTTER<br />
POWER COMMON<br />
+12VDC<br />
ASH FLAG<br />
GLOSS LAMP<br />
POWER<br />
SIGNAL COMMON<br />
SCANNING PLATFORM<br />
BACKPLANE POWER<br />
086086-053, SIDE 1, REV A<br />
Figure 4-22 Diagnostic Card: Backplane Power<br />
134 ABB Smart Processing Center (ASPC) Hardware<br />
3BUS 208 055 R1101
PROPRIETARY DATA: This document contains proprietary data of ABB Inc. No disclosure, distribution (electronic or otherwise),<br />
reproduction, or other means of dissemination may be made without written permission.<br />
The <strong>Scanning</strong> <strong>Platform</strong> Bottom Auxiliary Power card is to be used for diagnostics<br />
performed at the sensor only. Refer to Figure 4-23.<br />
1<br />
20<br />
ASH +15V<br />
-12 VDC<br />
SYSTEM<br />
ASH<br />
FILAMENT<br />
ABB®<br />
VOLTAGE<br />
RETURN<br />
19<br />
37<br />
21<br />
+12 VDC<br />
36<br />
22<br />
ASH COMMON<br />
ASH +28V<br />
35<br />
23<br />
ASH -15V<br />
120 VAC<br />
HI<br />
34<br />
24<br />
25<br />
LO<br />
WIPER<br />
ASH<br />
H.V.<br />
ADJUST<br />
ASH +28V<br />
RETURN<br />
120 VAC HI<br />
33<br />
32<br />
26<br />
-15 VDC<br />
31<br />
27<br />
SIGNAL<br />
COMMON<br />
SYSTEM<br />
30<br />
28<br />
+15 VDC<br />
SCANNING PLATFORM<br />
BOTTOM AUX POWER<br />
(ASH WITH REMOTE J-BOX ONLY)<br />
086086-053 SIDE 2, REV A<br />
Figure 4-23 Diagnostic Card: Bottom Auxiliary Power<br />
3BUS 208 055 R1101<br />
ABB Smart Processing Center (ASPC) Hardware<br />
135
PROPRIETARY DATA: This document contains proprietary data of ABB Inc. No disclosure, distribution (electronic or otherwise),<br />
reproduction, or other means of dissemination may be made without written permission.<br />
The <strong>Scanning</strong> <strong>Platform</strong> Detector Module card is to be used for diagnostics<br />
performed at the sensor only. Refer to Figure 4-24.<br />
1<br />
+12 VDC<br />
ABB®<br />
20<br />
PURGE SIGNAL HI<br />
19<br />
2<br />
21<br />
-12 VDC<br />
ELECTROMETER<br />
TEMP C/10<br />
HEATER LO<br />
CHASSIS GROUND<br />
37<br />
18<br />
3<br />
CHASSIS GROUND<br />
HEATER HI<br />
36<br />
22<br />
CAP THERMISTOR<br />
17<br />
4<br />
23<br />
5<br />
+15 VDC CHASSIS GROUND<br />
-15 VDC<br />
THERMISTOR<br />
+4.5V BIAS<br />
GAP SIGNAL LOW<br />
STLK11 AND STLP3 ONLY<br />
35<br />
16<br />
34<br />
24<br />
15<br />
6<br />
25<br />
7<br />
SIGNAL COMMON<br />
SIGNAL COMMON<br />
GAP BD TEMP C/10<br />
STLK11 AND STLP3 ONLY<br />
GAP SIGNAL HIGH<br />
STLK11 AND STLP3 ONLY<br />
ELECTROMETER TEST<br />
(TEST = LOW)<br />
33<br />
14<br />
32<br />
26<br />
13<br />
8<br />
31<br />
27<br />
ELECTROMETER<br />
LOW<br />
12<br />
9<br />
28<br />
10<br />
CHAMBER HV/100<br />
GAP OSCILLATOR<br />
STLK11 AND STLP3 ONLY<br />
ELECTROMETER<br />
HIGH<br />
30<br />
11<br />
29<br />
STLK-11, STLP-3, STLXR-3<br />
SENSOR DIAG. (TOP)<br />
086086-055, SIDE 1, REV B<br />
Figure 4-24 Detector Module Diagnostics Card<br />
136 ABB Smart Processing Center (ASPC) Hardware<br />
3BUS 208 055 R1101
PROPRIETARY DATA: This document contains proprietary data of ABB Inc. No disclosure, distribution (electronic or otherwise),<br />
reproduction, or other means of dissemination may be made without written permission.<br />
The <strong>Scanning</strong> <strong>Platform</strong> Source Module card is to be used for diagnostics performed<br />
at the sensor only. Refer to Figure 4-25.<br />
1<br />
20<br />
+12 VDC<br />
BW ALARM GRID<br />
(+12V)<br />
ABB®<br />
PURGE SIGNAL HI<br />
19<br />
2<br />
-12 VDC<br />
HEATER LO<br />
37<br />
21<br />
CHASSIS GROUND<br />
18<br />
3<br />
CHASSIS GROUND<br />
HEATER HI<br />
36<br />
22<br />
CAP THERMISTOR<br />
17<br />
4<br />
23<br />
CHASSIS GROUND<br />
THERMISTOR<br />
+4.5V BIAS<br />
35<br />
16<br />
5<br />
34<br />
24<br />
SHUTTER SWITCH<br />
NC (RED)<br />
15<br />
6<br />
33<br />
25<br />
7<br />
SHUTTER SWITCH<br />
NO (GREEN)<br />
ASH FILAMENT<br />
CURRENT<br />
14<br />
32<br />
26<br />
8<br />
27<br />
9<br />
SHUTTER<br />
+5V REFERENCE<br />
STLXR3<br />
CHECK SAMPLE<br />
ASH MONITOR<br />
COMMON<br />
ASH ANODE<br />
CURRENT<br />
13<br />
31<br />
12<br />
30<br />
28<br />
11<br />
10<br />
ASH X-RAY<br />
H.V./1000<br />
29<br />
STLK-11, STLP-3, STLXR-3<br />
SENSOR DIAG. (BOTTOM)<br />
086086-055, SIDE 2, REV. B<br />
Figure 4-25 Source Module Diagnostics Card<br />
3BUS 208 055 R1101<br />
ABB Smart Processing Center (ASPC) Hardware<br />
137
PROPRIETARY DATA: This document contains proprietary data of ABB Inc. No disclosure, distribution (electronic or otherwise),<br />
reproduction, or other means of dissemination may be made without written permission.<br />
Replacement Parts<br />
If the Test Cable assembly has disappeared, order the following parts:<br />
Test Card Kit 086086-003<br />
Test Board Kit 085126-002<br />
Overlays 086086-005<br />
086086-006 (TetraPak)<br />
138 ABB Smart Processing Center (ASPC) Hardware<br />
3BUS 208 055 R1101
PROPRIETARY DATA: This document contains proprietary data of ABB Inc. No disclosure, distribution (electronic or otherwise),<br />
reproduction, or other means of dissemination may be made without written permission.<br />
LED Interpretation<br />
Basic troubleshooting that can be done using the LEDs in the <strong>Scanning</strong> <strong>Platform</strong><br />
electronics cabinet.<br />
Power Supply LEDs<br />
The power supply LEDs are in the <strong>Scanning</strong> <strong>Platform</strong> electronics cabinet. Use the<br />
following table to assist you in troubleshooting the <strong>Scanning</strong> <strong>Platform</strong> electronics.<br />
Refer to Table 4-1 and Figure 4-26.<br />
Table 4-1 Interpretation of LEDs<br />
LEDs<br />
DC IN<br />
on ECPSR<br />
DISABLE<br />
+15 V<br />
-15 V<br />
+5 V<br />
DESCRIPTION<br />
This LED refers to the 24 VDC power<br />
supply for the <strong>Scanning</strong> <strong>Platform</strong><br />
electronics cabinet.<br />
When this LED is lit, the power supply<br />
is on but may not be within acceptable<br />
tolerance.<br />
This LED refers to the 24 VDC power<br />
supply for the <strong>Scanning</strong> <strong>Platform</strong><br />
Electronics cabinet.<br />
When this LED is lit, 24 volts is not<br />
within acceptable tolerance and the<br />
+5V and ± 15V power supply has been<br />
shut down.<br />
These LEDs refer to the presence of<br />
their respective voltages within the<br />
<strong>Scanning</strong> <strong>Platform</strong> electronics cabinet.<br />
When these LEDs are lit, the respective<br />
voltages are within acceptable<br />
tolerances.<br />
3BUS 208 055 R1101<br />
ABB Smart Processing Center (ASPC) Hardware<br />
139
PROPRIETARY DATA: This document contains proprietary data of ABB Inc. No disclosure, distribution (electronic or otherwise),<br />
reproduction, or other means of dissemination may be made without written permission.<br />
ECF, ECS, and ECC LEDs<br />
These LEDs are located on the ECF, ECS, and ECC boards in the <strong>Scanning</strong> <strong>Platform</strong><br />
electronics cabinet. Use the following table to assist you in troubleshooting. Refer<br />
to Table 4-2 and Figure 4-26.<br />
Table 4-2 ECF/ECS/ECC LED Interpretation.<br />
LEDs<br />
RTSA (green)<br />
ERROR (red)<br />
RUN (green)<br />
RTSB (green)<br />
DESCRIPTION<br />
The LED flashes when HDLC Port A<br />
has set its request to send and is<br />
attempting to transmit data.<br />
The intensity of the flashing depends<br />
on how much data is being transmitted.<br />
This LED indicates status of local<br />
diagnostics; it is under software control<br />
on a reset.<br />
If the LED stays on after reset, replace<br />
the SMI.<br />
If the LED is flashing, check the service<br />
console.<br />
If the LED is off and the RUN light is<br />
flashing, conditions are normal.<br />
If there are no LEDs lit, check to make<br />
certain there is power to the board.<br />
This LED is driven by the data strobe<br />
and indicates the level of 68332<br />
external bus activity.<br />
The intensity of the LED varies from<br />
dim to bright depending upon bus<br />
activity.<br />
This LED is not currently being used<br />
and should be off.<br />
ECF and ECC Boards (Only)<br />
LEDs<br />
RxA (ECC and ECF)<br />
RxB (ECC and ECF)<br />
RxC (ECF)<br />
RxD (ECF)<br />
RxE (ECF)<br />
RxF (ECF)<br />
DESCRIPTION<br />
These boards have serially connected<br />
devices attached to them. For the ECF<br />
board, it is one or more frame control<br />
modules. For the ECC board, it is one<br />
or two color sensor module pairs. In all<br />
cases, the green LED shows the level<br />
of activity on the serial line.<br />
140 ABB Smart Processing Center (ASPC) Hardware<br />
3BUS 208 055 R1101
PROPRIETARY DATA: This document contains proprietary data of ABB Inc. No disclosure, distribution (electronic or otherwise),<br />
reproduction, or other means of dissemination may be made without written permission.<br />
MPRC LEDs<br />
These LEDs are located on the MPRC board in the <strong>Scanning</strong> <strong>Platform</strong> electronics<br />
cabinet. Use the following table to assist you in troubleshooting. Refer to<br />
Table 4-3 and Figure 4-26.<br />
Table 4-3 086349-002 MPRC LED Interpretation<br />
LEDs<br />
ERROR (red)<br />
RUN (green)<br />
RX TERMINAL<br />
RX HOST<br />
DESCRIPTION<br />
This LED indicates status of local diagnostics; it is<br />
under software control on a reset.<br />
If the LED stays on for more than 30 seconds after<br />
reset, replace the MPRC board.<br />
If the LED is flashing, check the service console.<br />
During loading, it should be flashing.<br />
If the LED is off and the RUN light is flashing,<br />
conditions are normal.<br />
If there are no LEDs lit, check to make certain there<br />
is power to the board.<br />
This LED is driven by the data strobe and indicates<br />
the level of 68332 external bus activity.<br />
The intensity of the LED varies from dim to bright<br />
depending upon bus activity.<br />
When the LED is lit (flashing), there is a physical<br />
connection to the terminal.<br />
When the LED is not lit, the physical connection to<br />
the terminal is broken.<br />
When the LED is lit (flashing), there is a physical<br />
connection to the terminal.<br />
When the LED is not lit, the physical connection to<br />
the terminal is broken.<br />
3BUS 208 055 R1101<br />
ABB Smart Processing Center (ASPC) Hardware<br />
141
PROPRIETARY DATA: This document contains proprietary data of ABB Inc. No disclosure, distribution (electronic or otherwise),<br />
reproduction, or other means of dissemination may be made without written permission.<br />
Table 4-4 086444-001 MPRC LED Interpretation<br />
LEDs<br />
ERROR (red)<br />
RUN (green)<br />
NET TX_B (green)<br />
NET TX_A (green)<br />
RTS 0 (green)<br />
RTS 1 (green)<br />
RTS 2 (green)<br />
RTS 3 (green)<br />
RX TERMINAL<br />
(green)<br />
RX HOST (green)<br />
Description<br />
This LED indicates status of local diagnostics; it is under<br />
software control on a reset.<br />
If the LED stays on after reset, replace the MPRC.<br />
If the LED is flashing, check the service console.<br />
If the LED is off and the RUN light is flashing, conditions<br />
are normal.<br />
If the LEDs are not lit, check to make certain there is power<br />
to the board.<br />
This LED is driven by the “Transfer in Progress” and<br />
indicates the level of 68040 external bus activity.<br />
The intensity of the LED varies from dim to bright<br />
depending upon bus activity.<br />
When lit, the Ethernet port on J2 (Port B) is transmitting<br />
data.<br />
When lit, the Ethernet port on the ASPC Host Connector<br />
(Port A) is transmitting data.<br />
HDLC Port 0 is transmitting to the sensor microcontrollers.<br />
When lit, HDLC Port 1 is transmitting to the sensor<br />
microcontrollers.<br />
When lit, HDLC Port 2 is transmitting (unused in <strong>Scanning</strong><br />
<strong>Platform</strong>).<br />
When lit, HDLC Port 3 is transmitting (unused in <strong>Scanning</strong><br />
<strong>Platform</strong>).<br />
When the LED is lit or flashing, there is a physical<br />
connection to the terminal.<br />
When the LED is not lit, the physical connection to the<br />
terminal is broken.<br />
When the LED is lit or flashing, there is a physical<br />
connection to the host.<br />
When the LED is not lit, the physical connection to the host<br />
is broken.<br />
142 ABB Smart Processing Center (ASPC) Hardware<br />
3BUS 208 055 R1101
PROPRIETARY DATA: This document contains proprietary data of ABB Inc. No disclosure, distribution (electronic or otherwise),<br />
reproduction, or other means of dissemination may be made without written permission.<br />
Figure 4-26 Smart Plarform Electronics Cabinet (-003 Backplane)<br />
3BUS 208 055 R1101<br />
ABB Smart Processing Center (ASPC) Hardware<br />
143
PROPRIETARY DATA: This document contains proprietary data of ABB Inc. No disclosure, distribution (electronic or otherwise),<br />
reproduction, or other means of dissemination may be made without written permission.<br />
ERROR<br />
RUN<br />
RXA<br />
RXB<br />
RXC<br />
RXD<br />
RXE<br />
RXF<br />
RTSA<br />
ERROR<br />
RUN<br />
RTSB<br />
SMI<br />
Board<br />
RTSA<br />
ERROR<br />
RUN<br />
RTSB<br />
SMI<br />
Board<br />
START MODE<br />
EXTEN<br />
DIAG<br />
ECS<br />
ECF<br />
SHORT<br />
DIAG<br />
STOP/<br />
DEBUG<br />
BRAM<br />
Board<br />
RX HOST<br />
RESET<br />
MPRC<br />
Figure 4-27 Location of SMI and BRAM Boards<br />
144 ABB Smart Processing Center (ASPC) Hardware<br />
3BUS 208 055 R1101
PROPRIETARY DATA: This document contains proprietary data of ABB Inc. No disclosure, distribution (electronic or otherwise),<br />
reproduction, or other means of dissemination may be made without written permission.<br />
OPTIPAK<br />
GLOSS 1<br />
GLOSS 2<br />
Lights<br />
DISABLE<br />
DC IN<br />
Lights<br />
I J<br />
300V<br />
Side View<br />
+12V OUT<br />
-12V OUT<br />
Lights<br />
NOTE: If you pull the sled out and it tips down,<br />
the sled disconnects from the rails.<br />
Idler End<br />
Figure 4-28 Location of OSPS2 and EC24V (SP1200)<br />
3BUS 208 055 R1101<br />
ABB Smart Processing Center (ASPC) Hardware<br />
145
PROPRIETARY DATA: This document contains proprietary data of ABB Inc. No disclosure, distribution (electronic or otherwise),<br />
reproduction, or other means of dissemination may be made without written permission.<br />
Analog and Digital I/O Documentation<br />
The subsystem can document the channel assignments and configuration of the<br />
analog and digital input/output signals associated with the application. The<br />
information is presented in two different reports. The first one is a list of the channel<br />
assignments broken down by hardware device.<br />
The second report shows the logical groupings of the various inputs and gives the<br />
sampling rates associated with each.<br />
To print out these two reports, proceed as follows within the inspect utility:<br />
• For the I/O configuration:<br />
()[ucHardware printOnConsole]<br />
• For the logical grouping and sampling rate:<br />
()[lucGroup printOnConsole]<br />
at 0: ucHardware (UCSubsystem)<br />
SP Number<br />
ECF/ECS Slot Number<br />
at 0: ucFrame01 (UCFrame) [-->FRAME_UC hdlc_addr:0x1f<br />
Port Number<br />
at 0: ucFrame01_port00 (UCAnalogPort)<br />
Channel Number<br />
at 1: ucFrame01_port00_ch01 (UCAnalogChan)<br />
[-->framePurgeAirFlow01_ai]<br />
Figure 4-29 Example of Analog I/O Documentation<br />
146 ABB Smart Processing Center (ASPC) Hardware<br />
3BUS 208 055 R1101
PROPRIETARY DATA: This document contains proprietary data of ABB Inc. No disclosure, distribution (electronic or otherwise),<br />
reproduction, or other means of dissemination may be made without written permission.<br />
Power Down Analysis<br />
The <strong>Scanning</strong> <strong>Platform</strong> software monitors temperatures at various points in the<br />
system. Using pre–established limits, the user is advised when safety maintenance<br />
limits are violated, and also when a power shutdown is about to take place. There<br />
are two situations where the system will alert the workstation of a temperature<br />
condition which needs to be attended to. The first is a SAFETY LIMIT ALARM<br />
which warns of a temperature situation which needs attention. The second is a<br />
POWER DOWN ALERT which will output the power down report just before it<br />
trips the main power circuit breaker one minute after it has been announced. Just<br />
before turning off the breaker, the workstation will display a report of the various<br />
board and sensor temperatures in the AVOS window (if the workstation is<br />
connected). This report is also available for at least the first two minutes after the<br />
next restart by invoking the shell script “/ss01/clm/pwrdninf”. This section will<br />
discuss the safety interrupt alert message, the power down report, and the power<br />
history log of the micro-controllers.<br />
Safety Interrupt Alert<br />
The Electronics Health Page will report a safety maintenance condition if any of<br />
the board temperatures in the system exceed the associated maintenance alarm limit.<br />
The Safety Limit and Power Down limits are shown in Table 4-5. This maintenance<br />
level alarm will show on the ALARM PAGE (F2 key) as “A BOARD<br />
TEMPERATURE IS OUT OF LIMITS”. This notification is not sent to the host.<br />
When the temperature exceeds the Power Down limit, there is a notification given<br />
to the host as well as a screen message to the workstation. There is a delay of about<br />
one minute before the actual shutdown occurs. If the workstation screen is being<br />
monitored at the time of the shutdown event, the message to the screen will read:<br />
SETTING SAFETY INTERRUPT bit:x<br />
(safetyInterruptBits = y)!!<br />
Here is how to interpret this information:<br />
x = 0 - Ash Air Temp Safety<br />
1 - Basis Weight Air Temp Safety<br />
2 - Caliper Probe Temp Safety<br />
3 - Power Down Safety<br />
3BUS 208 055 R1101<br />
ABB Smart Processing Center (ASPC) Hardware<br />
147
PROPRIETARY DATA: This document contains proprietary data of ABB Inc. No disclosure, distribution (electronic or otherwise),<br />
reproduction, or other means of dissemination may be made without written permission.<br />
y = 0 - ECF board, UC slot 0 Temp<br />
1 - ECS board, UC slot 1 Temp<br />
2 - ECS board, UC slot 2 Temp<br />
3 - ECS board, UC slot 3 Temp<br />
4 - ECS board, UC slot 4 Temp<br />
5 - ECS board, UC slot 5 Temp<br />
6 - ECS board, UC slot 6 Temp<br />
7 - ECS board, UC slot 7 Temp<br />
8 - End Column Power Supply Temp<br />
9 - Power Shelf Temp<br />
10 - Motor Controller Temp<br />
11 - Beam Air Flow (di)<br />
12 - Chiller Flow (di)<br />
13 - Ash Air CAP/GAP Temp<br />
14 - BW Air CAP/GAP Temp<br />
15 - Caliper Probe Temp<br />
Table 4-5 Alarm Limits for Each Variable<br />
Temperature Categories<br />
Safety limit<br />
(°C)<br />
Power Down<br />
(°C)<br />
All ECS board and platform temperatures 50 65<br />
ECF Board Temperatures 59 69<br />
Basis Weight Temperatures with gap 100 125<br />
Basis Weight Temperatures without gap 130 148<br />
Ash Temperatures with gap 100 125<br />
Ash Temperatures without gap 90 125<br />
Caliper Temperatures 130 148<br />
148 ABB Smart Processing Center (ASPC) Hardware<br />
3BUS 208 055 R1101
PROPRIETARY DATA: This document contains proprietary data of ABB Inc. No disclosure, distribution (electronic or otherwise),<br />
reproduction, or other means of dissemination may be made without written permission.<br />
Power Down and DC Power Analysis<br />
If the system resets because of a power down condition, the cause can be determined<br />
by printing out an array of temperature and DC power data through a shell script.<br />
The temperature values within the system are monitored and checked against safety<br />
limits. When a safety limit is violated, the system will issue an alarm message and<br />
record, in a buffer, the current values of alll of the temperatures. When the power<br />
down limit is exceeded, the temperature data is again read into the buffer. This<br />
buffer is stored in the /ss01/history BRAM disk area so that it is available at the<br />
next startup. Upon startup, the file is read in and is available for display using a<br />
shell script command. While several variables may have exceeded their safety alarm<br />
limit, the file shows the snapshot of the data at the moment the safety limit or power<br />
down event occurs.<br />
The report is in two parts. The first part is the UCONTROLLER SUBSYSTEM<br />
TEMPERATURES WHERE safety interrupt temperatures are recorded. The<br />
second part of the report consists of a temperature and voltage log for each of the<br />
microcontrollers in the system. In the first report, all temperatures (boards and<br />
sensors) are presented and the offending temperatures is flagged by using up to<br />
three asterisks. A single asterisk (*) will be issued for a maintenance limit violation.<br />
If there is a second asterisk just adjackent to the first one, it means that the offending<br />
signal has created a SAFETY INTERRUPT which will force the head to come offsheet.<br />
A third asterisk position, in the next character position to the right, indicates<br />
that the signal is responsible for a power shutdown condition. it is possible to get<br />
the following combinations of asterisk markers:<br />
• * for safety<br />
• ** for taking head off-sheet<br />
• *b* (the “b” indicates a space) for forcing a power down<br />
There can be other entries in the table with 0.0 values reported. Since this is a report<br />
that supports a maximum configuration, these unavailable entries can be ignored.<br />
In general, the sensor temperatures associated within the head envelope are the ones<br />
which will take the head off-sheet if the safety limit is exceeded. Temperatures<br />
associated with the scanner structure and end column electronics, will take the<br />
power down. In the example shown in Figure 4-30, the topcolor_btmbrdTemp<br />
tamperature is flagged as being the offending temperature giving a safety limit<br />
alarm. This report can be obtained at any time, but will only contain data if an alarm<br />
limit is violated. Otherwise, the data is all 0.0.<br />
Table 4-7 on page 151 shown the subsystem temperature report. The information<br />
in italics is not printed, but is shown here to help decipher the somewhat cryptic<br />
labels.<br />
Table 4-6 on page 150 shows the associated alarm limits for each of the variables.<br />
3BUS 208 055 R1101<br />
ABB Smart Processing Center (ASPC) Hardware<br />
149
PROPRIETARY DATA: This document contains proprietary data of ABB Inc. No disclosure, distribution (electronic or otherwise),<br />
reproduction, or other means of dissemination may be made without written permission.<br />
Table 4-6 Alarm Limits for Each Variable<br />
Temperature Categories Safety Limit (°C) Power Down (°C)<br />
All board and platform temperatures 50 65<br />
Basis Weight Temperature with gap 100 125<br />
Basis Weight Temperature without Gap 130 148<br />
Ash Temperature with Gap 100 125<br />
Ash Temperature without Gap 90 125<br />
Caliper Temperature 130 148<br />
Color SCMM Temperature 65 70<br />
Color SBTM Temperature 65 70<br />
150 ABB Smart Processing Center (ASPC) Hardware<br />
3BUS 208 055 R1101
PROPRIETARY DATA: This document contains proprietary data of ABB Inc. No disclosure, distribution (electronic or otherwise),<br />
reproduction, or other means of dissemination may be made without written permission.<br />
Table 4-7 Subsystem Temperature Report<br />
UCONTROLLER SUBSYSTEM TEMPERATURES: 11-11-98 13:30:47<br />
brdTemp[ 0 ]: 26.92 -> (frame)*<br />
brdTemp[ 1 ]: 23.61 -> (basis weight)<br />
brdTemp[ 2 ]: 0.00 -> (IR Moisture)<br />
brdTemp[ 3 ]: 24.45 -> (caliper)<br />
brdTemp[ 4 ]: 0.00 -> (optipak/gloss)<br />
brdTemp[ 5 ]: 0.00 -> (gloss/top refl. IR)<br />
brdTemp[ 6 ]: 25.43 -> (ash/bot refl. IR)<br />
brdTemp[ 7 ]: 23.30 -> (general)<br />
ecpsTemp: 25.34 -><br />
(end column temperature)<br />
pshelfTemp: 22.36 -> (power supply shelf)<br />
mcTemp: 21.89 -> (motor controller)<br />
beamAirFlowAlm: (BOOL)0OK (beam air flow flag)<br />
chillFlowAlmA: (BOOL)0OK<br />
(LCU 1 flow)<br />
chillFlowAlmB: (BOOL)0OK<br />
(LCU 2 flow)<br />
spare: (BOOL)0 UNUSED<br />
ash_sct: 0.00 -> (smart ash source)<br />
ash_dct: 0.00 -> (smart ash detector)<br />
ash_sht: 0.00 -> (‘old’ ash source)<br />
beta_sct: 54.94 -> (smart weight source)<br />
beta_dct: 55.01 -> (smart weight detector)<br />
beta_sgt: 0.00 -> (‘old’ weight source gap)<br />
beta_dgt: 0.00 -> (‘old’ weight detector gap)<br />
beta_sht: 0.00 -> (‘old’ weight source head)<br />
beta_dht: 0.00 -> (‘old’ weight detector head)<br />
caliper_probTemp: 0.00 -><br />
(cont. caliper probe)<br />
topcolor_cmmt: 0.00 -> (top color SCMM head)<br />
topcolor_btmt: 50.00 -> (top color SBTM head)<br />
topcolor_btmbrdTemp:65.29 -><br />
(top color SBTM smi board)<br />
bottomcolor_cmmt: 0.00 -><br />
(bot color SCMM head)<br />
bottomcolor_cmmt: 0.00 -><br />
(bot color SBTM head)<br />
bottomcolor_btmbrdTemp: 0.00 -> (bot color SBTM smi board)<br />
* Text shown in this column in italics is shown for clarification and does not<br />
appear in the actual report.<br />
3BUS 208 055 R1101<br />
ABB Smart Processing Center (ASPC) Hardware<br />
151
PROPRIETARY DATA: This document contains proprietary data of ABB Inc. No disclosure, distribution (electronic or otherwise),<br />
reproduction, or other means of dissemination may be made without written permission.<br />
Micro-Controller DC Power Log<br />
Figure 4-30 shows an example of the historical trend of each microcontroller’s DC<br />
voltages. It is a rotating buffer of the last 20 updates. A snapshot update of all the<br />
DC power on the board is made each time a new high or low value for any of the<br />
DC levels is detected. If there has not been movement of a new high or low in a<br />
24-hour period, the system will take a snapshot of the current values (the actual<br />
interval is slightly more than 24 hours). The check for a high or low is made every<br />
minute. This data can be viewed on demand either by looking at the Electronics<br />
Health Report (pages 3 and on), or by executing the shell script. Reviewing this<br />
data is useful in determining trends in power supply drift. To print out both reports,<br />
at the AVOS shell ($$ prompt), type:<br />
. ∆ /ss01/clm/pwrdninf<br />
The system displays, on the screen and printer (if available), the Power Down report<br />
including the microcontroller temperature and the DC power history for each<br />
microcontroller in the system.<br />
The system displays, on the screen and printer (if available), the Power Down report<br />
including the microcontroller temperature and the DC power history for each<br />
microcontroller in the system.<br />
152 ABB Smart Processing Center (ASPC) Hardware<br />
3BUS 208 055 R1101
PROPRIETARY DATA: This document contains proprietary data of ABB Inc. No disclosure, distribution (electronic or otherwise),<br />
reproduction, or other means of dissemination may be made without written permission.<br />
Date Temp Vapos Vaneg Vref Vtref Vdig<br />
12-12-1991 11:19:56 33.90 15.10 -14.96 5.00 5.00 5.00<br />
12-12-1991 11:20:58 33.40 15.10 -14.96 5.00 5.00 5.00<br />
12-12-1991 11:25:01 33.90 15.02 -14.96 5.00 5.00 5.00<br />
12-12-1991 11:28:03 33.90 15.10 -14.96 5.00 5.00 5.00<br />
12-12-1991 11:36:07 33.90 15.10 -14.92 5.00 5.00 5.00<br />
12-12-1991 11:52:13 33.40 15.10 -14.96 5.00 5.00 4.96<br />
12-12-1991 13:56:14 32.90 15.10 -14.96 5.00 5.00 5.00<br />
12-12-1991 14:32:40 33.40 15.10 -14.96 5.00 5.00 5.04<br />
12-12-1991 14:40:48 33.40 15.10 -14.96 5.00 5.04 5.00<br />
12-12-1991 16:31:46 33.40 15.10 -14.96 4.96 4.96 5.00<br />
12-13-1991 08:31:33 32.90 15.10 -14.96 5.00 5.00 5.00<br />
12-13-1991 08:32:35 33.40 15.10 -14.96 5.00 5.00 5.00<br />
12-13-1991 08:34:38 33.40 15.10 -14.96 5.00 4.96 5.00<br />
12-13-1991 08:35:39 33.40 15.10 -14.92 5.00 5.00 5.00<br />
12-13-1991 08:36:40 33.40 15.02 -14.92 5.00 5.00 5.00<br />
12-13-1991 08:45:47 33.40 15.10 -14.96 5.00 5.00 4.96<br />
12-13-1991 08:47:49 33.90 15.10 -14.96 5.00 5.00 4.96<br />
12-13-1991 09:20:07 33.40 15.02 -14.96 5.00 4.92 5.00<br />
12-13-1991 10:06:07 33.40 15.10 -14.96 4.96 5.00 5.00<br />
12-13-1991 11:02:43 33.90 15.10 -14.96 5.00 5.04<br />
Figure 4-30 Historical Trend for Microcontroller DC Voltages<br />
Note the following definitions for Figure 4-30:<br />
Vref - is the A to D signal<br />
Vtref -<br />
is the thermistor reference<br />
Vdig - is the logic signal for the A/D test signal on the ECF<br />
board only<br />
3BUS 208 055 R1101<br />
ABB Smart Processing Center (ASPC) Hardware<br />
153
Blank Page
PROPRIETARY DATA: This document contains proprietary data of ABB Inc. No disclosure, distribution (electronic or otherwise),<br />
reproduction, or other means of dissemination may be made without written permission.<br />
5<br />
Software Diagnostic Tools<br />
This chapter is about using software to diagnose resource, application, and<br />
operations problems.<br />
This chapter contains the following major sections:<br />
Section ...............................................................................................Page<br />
Software Diagnosis ........................................................................................ 156<br />
Identifying Sensor Configuration ................................................................... 164<br />
Identifying Software Release Levels ............................................................. 165<br />
Signal/Measurement Processing Analysis and Reporting (smr) .................... 168<br />
Resource Checks ............................................................................................ 180<br />
How to Start the <strong>Scanning</strong> <strong>Platform</strong> .............................................................. 185<br />
Displaying Reports within inspect ................................................................. 187<br />
Preparing On–Site Documentation ................................................................ 190<br />
Operation of the Sensor Health Pages ............................................................ 191<br />
Off-Line Debug .............................................................................................. 195<br />
3BUS 208 055 R1101<br />
Software Diagnostic Tools<br />
155
PROPRIETARY DATA: This document contains proprietary data of ABB Inc. No disclosure, distribution (electronic or otherwise),<br />
reproduction, or other means of dissemination may be made without written permission.<br />
Software Diagnosis<br />
This section focuses on general software troubleshooting techniques rather than<br />
specific symptomatic procedures. The idea is to develop an understanding of the<br />
software environment and let the specific procedures evolve from that<br />
understanding. There is also a discussion of the various tools and utilities available<br />
to the user.<br />
General Software <strong>Troubleshooting</strong> Techniques<br />
While most people agree that system software troubleshooting can be an art,<br />
everyone’s skill on a <strong>Scanning</strong> <strong>Platform</strong> system can be increased by knowing how<br />
the tools available can be used to help solve problems. By showing what information<br />
can be gleaned from the existing utilities, it is hoped that problem analysis will<br />
become more efficient.<br />
<strong>Troubleshooting</strong> may fall into more than one category. The categories are resource,<br />
operating system, and applications. There are utilities that can be used to help with<br />
all of these areas.<br />
Resource<br />
When a system has been running for some time (hours, days, weeks), but then begins<br />
exhibiting strange behavior, such as new symptoms, large utilities no longer loading,<br />
it is conceivable that a resource is running low or is used up.<br />
One resource problem involves the allocation of memory. There are two main<br />
groupings of memory in the <strong>Scanning</strong> <strong>Platform</strong>, one for application usage (this<br />
comes from pool 15), and the other for operating system usage. The two buffer<br />
pools are allocated by adjusting the size of pool 15, with all other memory going to<br />
the other buffer pool, pool 31. The amount of memory available is determined by<br />
using the dfree utility. With the information from that utility in hand, the pools can<br />
be adjusted to give the most available memory to applications. Reserving about<br />
50K bytes for pool 31, modify the pool 15 command in the startup_01_0 script to<br />
give the rest of memory to applications.<br />
Sometimes running out of memory from pool 15 is a consequence of other problems,<br />
such as programs allocating buffers without returning them for reuse. This and<br />
other resource problems can be identified by using the monitor utility. The resource<br />
activity section of this utility will show the currently used number of buffers,<br />
processes, semaphores, and mailboxes, as well as the number allocated and de–<br />
allocated in the previous display period. If the resources do not settle out to a stable<br />
number, a software problem could be the culprit. This is not an easy problem to<br />
find and may require a specialist from ABB in Columbus, Ohio.<br />
156 Software Diagnostic Tools<br />
3BUS 208 055 R1101
PROPRIETARY DATA: This document contains proprietary data of ABB Inc. No disclosure, distribution (electronic or otherwise),<br />
reproduction, or other means of dissemination may be made without written permission.<br />
Operating System<br />
Operating system problems occur infrequently. Operating system problems initially<br />
appear as application problems. Some of the symptoms of an operating problem are:<br />
• An error from the derr display that cannot be explained from an application<br />
viewpoint.<br />
• An error resulting from an AVOS service call that should not have been returned.<br />
As an example, an AVOS error resulted when the software attempted to store to an<br />
object that did not allow storing. The object should have allowed storing.<br />
Whenever you suspect an operating system problem, attempt to find an application<br />
code reason for the problem.<br />
Any operating system problems should be referred to one of the program designers<br />
for resolution.<br />
Application<br />
Most problems, if they exist, are in this category. While there is not any road map<br />
to finding application problems, there are many techniques that can be applied to<br />
speed things along. First, print out both map -m and map -s to help identify which<br />
program has the error in it. Also, the information from a dproc printout is useful<br />
in associating a process id with a program name. The dproc printout indicates any<br />
processes that have been aborted. In the <strong>Scanning</strong> <strong>Platform</strong> system, this usually<br />
indicates that a bus error or an address error has caused the termination. This can<br />
be confirmed by a printout of derr.<br />
This leads to how to start a problem analysis session. Assuming the maps are already<br />
available, (map -s, map -m, and the dproc printout only need to be performed once<br />
after a release update and kept on hand until needed) the following commands<br />
should be executed at the system console. Refer to Table 5-1.<br />
Table 5-1 “First Step” Utilities to be Run<br />
Utility<br />
derr<br />
bfchk<br />
dfree<br />
monitor<br />
Description<br />
If there are any errors here, start troubleshooting from this report.<br />
This tells if the headers or trailers of any buffer have been damaged.<br />
Any printout here is cause for further investigation.<br />
This will indicate if buffers are being used up. If utilities cannot be<br />
executed, it is usually because there is a memory shortage already.<br />
This will indicate if all available real time is being used up, and if so,<br />
can be used to help find the process responsible.<br />
The preceding guidelines for problem analysis assume that the specific problem is<br />
not known. All these steps usually are not necessary if the reported problem is more<br />
specific. However, even when a better problem description is available, these<br />
commands convey an overall picture of the state of the software.<br />
3BUS 208 055 R1101<br />
Software Diagnostic Tools<br />
157
PROPRIETARY DATA: This document contains proprietary data of ABB Inc. No disclosure, distribution (electronic or otherwise),<br />
reproduction, or other means of dissemination may be made without written permission.<br />
AVOS and Application Utilities<br />
AVOS is the operating system for the <strong>Scanning</strong> <strong>Platform</strong>. The operating system<br />
interfaces the <strong>Scanning</strong> <strong>Platform</strong>’s scanning, measurement processing and other<br />
computing resources with the system hardware. AVOS also supports a console<br />
interface between the <strong>Scanning</strong> <strong>Platform</strong>’s computer hardware and technicians<br />
requiring access to the software for setup and troubleshooting.<br />
This section will describe some of the important utilities and procedures required<br />
to interact with the <strong>Scanning</strong> <strong>Platform</strong> through the Service Workstation.<br />
General AVOS Utilities<br />
As a reference, some commands are listed here with a description of the data they<br />
provide. Refer to Table 5-2.<br />
Utility<br />
aim<br />
bfchk<br />
derr<br />
dfree<br />
Table 5-2 Software Utility Descriptions<br />
Description<br />
This is a display of all the analog voltage entering the system with a one second refresh<br />
update. It is useful in establishing the actual presence of signals coming from sensors and<br />
the platform.<br />
This command checks the header and trailer of all buffers for damage. When this utility<br />
reports an error, serious, bizarre and/or unrepeatable symptoms may be the result.<br />
Errors reported by this command are usually of a serious nature. Bus errors and address<br />
errors cause a process to be terminated. Unless that error came about through the use of<br />
some other utility, it definitely should be identified. Utility errors can usually be identified<br />
by the process id which will be a 12 if the utility was executed from the normal AVOS shell.<br />
Operating from a sub-shell will result in a very high process id. These errors can be ignored<br />
as they are caused by the abnormal termination of the utility other than by CTRL-BRK.<br />
When a user’s stack has overflowed from an AVOS service being called, the process will<br />
be aborted and a stack overflow error will appear in the printout for this utility.<br />
By indicating a memory situation, this command can point out situations that may cause a<br />
system to crash. By using this utility periodically, it might be possible to anticipate an<br />
approaching error situation. Usually, however, this utility is most useful in deciding how<br />
best to allocate available memory for the buffer pools. After the system has been running a<br />
while (several days), dfree indicates how much memory has been used. With this<br />
information, buffer pool 15 allocation can be changed to hold the majority of free memory.<br />
Be sure to keep about 50K for pool 31 operating system usage.<br />
(continued on next page)<br />
158 Software Diagnostic Tools<br />
3BUS 208 055 R1101
PROPRIETARY DATA: This document contains proprietary data of ABB Inc. No disclosure, distribution (electronic or otherwise),<br />
reproduction, or other means of dissemination may be made without written permission.<br />
Utility<br />
dproc<br />
dim<br />
Table 5-2 (continued)<br />
Description<br />
This command is useful to help interpret derr information, specifically, the process<br />
number. Armed with the process number, dproc provides its running state, process name<br />
(if any), and name of the AVOS service currently being used by the process.<br />
This utility displays the current status of the digital inputs to the system. It is updated on<br />
a one second basis and also shows the status of the invert mask for each input.<br />
inspect While the use of the inspect utility is seen as too complicated for most users, it is useful<br />
in tracking down Objective-C errors. The :pm (print methods) command of inspect<br />
provides addresses of methods, and indicates which methods to which an object or class<br />
responds. Because messages can be sent through the inspect utility, interactive<br />
troubleshooting can be performed. (That is, if you want to find out the result of a method,<br />
send a message interactively to execute that method.) Additionally, the inspect utility<br />
provides the means to display and modify instance variables in Objective-C objects, which<br />
can also be used in troubleshooting problems.<br />
map<br />
md<br />
mf<br />
Both the -s and -m options are used to provide information needed to determine which<br />
routine or load module contains the code causing the error.<br />
Allows the display of memory in a variety of formats. Among others supported are hex<br />
and instruction disassembly. The format can be sophisticated enough to display data<br />
structures.<br />
The memory find utility provides a means to search a range of memory for a specific hex<br />
pattern or an ASCII string.<br />
mm The memory modify utility can be used to implement temporary modifications, or if in a<br />
script, a semi-permanent modification.<br />
monitor Of the wide range of information provided by the monitor, much of it is useful in<br />
troubleshooting activities. The resource activity portion shows the dynamics of mailboxes,<br />
semaphores, processes, and buffers. Periodic display of this information may point out<br />
problems of excessive resource consumption. The general time and process time portions<br />
of the utility may indicate real-time problems. If there is no available real time, it may<br />
indicate a looping problem. By using the process time pages to find which process number<br />
is responsible, the dproc printout will then identify the name of the process. The interrupt<br />
activity page of the utility may be helpful in tracking down too many or too few interrupts<br />
for a particular device. The miscellaneous page shows spurious interrupts, which may<br />
indicate a hardware problem.<br />
pe This utility records the most recent 100 events that have taken place application wise in<br />
the system. The messages are not problems, but indicate actions which have taken place<br />
as the result of some other problem. For example, if a major streak has caused the IR<br />
Moisture sensor to change the gain setting, this will be recorded. Other messages will<br />
include such things as sheet breaks and AEOS problems. This is very useful as a starting<br />
place to find out why heads have gone off-sheet.<br />
3BUS 208 055 R1101<br />
Software Diagnostic Tools<br />
159
PROPRIETARY DATA: This document contains proprietary data of ABB Inc. No disclosure, distribution (electronic or otherwise),<br />
reproduction, or other means of dissemination may be made without written permission.<br />
Using the software utilities assumes that the system can execute shell commands.<br />
If the system has gone into the panic mode (the OFFLINE_DEBUG prompt is<br />
displayed), there are two commands that may be of use. The e command displays<br />
the panic message, why the system is in panic. But the most useful command is x.<br />
This provides a derr type display of the error log. The oldest error is probably the<br />
one that will lead to the problem.<br />
If the system has halted without the system going into the panic mode, the system<br />
must be reset and the off-line debug routine will execute. This allows display of<br />
the error log (using the x command), possibly pointing to a problem. Unfortunately,<br />
the act of resetting the system will cause the exception vectors to be reset, so if<br />
destruction of these vectors caused the problem, it may be difficult to find.<br />
The inspect Utility<br />
The inspect utility allows examination and modification of instance variables<br />
contained in the <strong>Scanning</strong> <strong>Platform</strong> software. To use the inspect utility, it is<br />
necessary to know two things: the name of the object where the variable resides,<br />
and the name of the variable.<br />
The names of the objects which are accessible with the inspect utility are given in<br />
the :global printout. The names of the instance variables residing in any given<br />
object, can be listed by entering the object name while in the inspect utility.<br />
The following procedure illustrates how to run the utility and perform some basic<br />
operations.<br />
1. Place the desired Service Workstation in the inspect utility mode by typing<br />
inspect at the $$ prompt.<br />
The response is as follows if it is the first time inspect has been invoked since<br />
the last <strong>Scanning</strong> <strong>Platform</strong> restart or if class files need to be reloaded:<br />
inspect - @(#)inspect.c 1.1 - 88/10/05<br />
inspect:reading class files.<br />
I><br />
During normal operation only the I> will appear. The I> is the line prompt for<br />
the inspect utility.<br />
160 Software Diagnostic Tools<br />
3BUS 208 055 R1101
PROPRIETARY DATA: This document contains proprietary data of ABB Inc. No disclosure, distribution (electronic or otherwise),<br />
reproduction, or other means of dissemination may be made without written permission.<br />
2. Use the following format to enter the requested instance variable:<br />
To display an entire object list of instance variables:<br />
objectName<br />
To display a single instance variable and its value:<br />
objectName->instanceVariableName<br />
To change an instance variable’s value:<br />
objectName->instanceVariableName=value<br />
To list all available object names:<br />
:global<br />
Where:<br />
objectName is the name of the software object containing the desired instance<br />
variable.<br />
instanceVariableName is the instance variable name to be examined.<br />
Value is the new number to be added. It must be in the same format as defined<br />
in the instance variable list.<br />
3. For repeated display or value entry, simply enter a period (.) and press<br />
RETURN. The previously entered command will be repeated.<br />
4. For repeated display or value entry, simply enter a period, ., and return. The<br />
previously entered command will be repeated.<br />
5. If it is desired to take a snapshot of all of the Instance Variables in an object<br />
which can then be examined at leisure using the editor, then precede the Instance<br />
Variable command with:<br />
:out filePathName<br />
Where filePathName identifies the diskette location and file name to be used<br />
to store the requested data. An example of a filePathName might be /ss01/<br />
clm/test. This would create a file called “test” in the clm directory of AMS00x<br />
which has as its root directory /ss01.<br />
All inspect commands entered after :out is setup will go directly to the file<br />
instead of the screen. To restore the responses to the screen, simply type :out<br />
with no arguments.<br />
Instance Variables designated as coldstart will not necessarily respond in the<br />
system when changed. These must be implemented by restarting the <strong>Scanning</strong><br />
<strong>Platform</strong> system.<br />
3BUS 208 055 R1101<br />
Software Diagnostic Tools<br />
161
PROPRIETARY DATA: This document contains proprietary data of ABB Inc. No disclosure, distribution (electronic or otherwise),<br />
reproduction, or other means of dissemination may be made without written permission.<br />
The gstore Utility<br />
Modified coldstart instance variables must be stored in their respective .ini files<br />
located in BRAM.<br />
Use the following procedure to store modified instance variables.<br />
1. Make the desired value changes to the coldstart instance variables using the<br />
inspect or genrpt utilities.<br />
2. Make a disk copy of all the existing .ini files in the /clm directory using the<br />
backup procedure.<br />
This puts each .ini file onto diskette where it can be retrieved if something goes<br />
wrong with the subsequent gstore command later in this procedure.<br />
3. After all the changes have been made, write the information to the BRAM using<br />
the gstore utility in the AVOS shell at the $$ prompt:<br />
gstore<br />
The utility responds with a menu selection, see Figure 5-1. Use Table 5-3 to<br />
help make a selection. Answer all the interactive messages as required.<br />
When a selection has been made, the utility will offer the opportunity to<br />
overwrite the existing file, write to a new file, or quit without saving the file.<br />
$$ gstore<br />
Object Graph Storing Utility (imp200.002~)<br />
Selection Object Graph Head of Graph<br />
~~~~~~~~~ ~~~~~~~~~~~~ ~~~~~~~~~~~~~<br />
1 frame (scanner01)<br />
2 frameHI (fhi01)<br />
3 io (ucHardware)<br />
4 pmm (pmmInterface)<br />
5 appl (applGraphHead_01_0)<br />
ENTER selection or q to quit:<br />
Figure 5-1 gstore Menu Screen<br />
162 Software Diagnostic Tools<br />
3BUS 208 055 R1101
PROPRIETARY DATA: This document contains proprietary data of ABB Inc. No disclosure, distribution (electronic or otherwise),<br />
reproduction, or other means of dissemination may be made without written permission.<br />
Selection<br />
Table 5-3 gstore Menu Item Descriptions<br />
Object<br />
Graph<br />
Head of Graph<br />
Function<br />
(This section is not part of the<br />
actual menu)<br />
1 frame (scanner01) All coldstart variables associated<br />
with the <strong>Scanning</strong> <strong>Platform</strong><br />
scanning and sensors<br />
2 frameHI (fhi01) All coldstart variables associated<br />
with the push button assignments<br />
on the <strong>Scanning</strong> <strong>Platform</strong> control<br />
panel<br />
3 io (ucHardware) All coldstart variables associated<br />
with the analog and digital I/O<br />
4 pmm pmmInterface All coldstart variables associated<br />
with the HOST interface objects<br />
5 appl applGraphHead_01_0 Supplies parameters at start up<br />
which set in motion the order in<br />
which the configuration is linked<br />
into memory. Also contains<br />
information for the Health Pages<br />
relative to frame tuning and the<br />
release level<br />
Note:<br />
Object Graph refers to the file_name. Head of Graph refers to the<br />
object_name.<br />
3BUS 208 055 R1101<br />
Software Diagnostic Tools<br />
163
PROPRIETARY DATA: This document contains proprietary data of ABB Inc. No disclosure, distribution (electronic or otherwise),<br />
reproduction, or other means of dissemination may be made without written permission.<br />
Identifying Sensor Configuration<br />
To examine the current configuration of a scanner, follow the steps below.<br />
1. At the $$ prompt type: inspect.<br />
2. At the I> prompt type:<br />
( ) [scanner01 print] for the frame community<br />
or( ) [pmmInterface01 print] for the pmm community.<br />
3. You will receive a printout. See the examples below.<br />
The Scanner01 printout contains the following information.<br />
Example: scanner01 (Scanner1180M) : with AEOS<br />
sheetBrkDet01 (SheetBrkDet)<br />
Servo01 (Servo)<br />
head01 (Head)<br />
Real Sensors:<br />
BetaSensor01 (BetaSensor):with ATC<br />
IRSensor01 (IRSensor) : Type HEMI+<br />
Derived Sensors:<br />
CondWtSensor01 (CondWtSensor)<br />
Sensors Not In Operation:<br />
The pmmInterface0x printout contains the following information.<br />
Example: pmmInterface (PmmInterface)<br />
pmmDriver (PmmDriver):<br />
pmmFrames:<br />
pmmFrame01 (Pmm Frame)<br />
pmmSensors:<br />
pmmBeta01 (Pmm Beta)<br />
pmmCondWt01 (pmmCondWt)<br />
pmmIRSensor01 (pmmIRSensor)<br />
164 Software Diagnostic Tools<br />
3BUS 208 055 R1101
PROPRIETARY DATA: This document contains proprietary data of ABB Inc. No disclosure, distribution (electronic or otherwise),<br />
reproduction, or other means of dissemination may be made without written permission.<br />
Identifying Software Release Levels<br />
Finding System Release Levels<br />
The system software is made up of several subsystems all gathered under one system<br />
release identification. In any troubleshooting effort, it is important to know that the<br />
individual subsystem release levels are correct for the specified system release.<br />
This system release level is identified as SPxxx.x in the header portion of each<br />
Health Page. It can also be found by looking at the end of the system startup<br />
sequence, a little before the banner.<br />
Finding Subsystem Release Levels<br />
The various subsystem software release levels for a particular system release are<br />
listed in the release memo for that release.<br />
The major subsystem software areas are:<br />
• Application software<br />
• Microcontroller software<br />
• Lib01 library software<br />
• AVOS software<br />
The following procedure will result in a report which identifies the release level of<br />
each major area.<br />
1. Type the following command while in the AVOS ($$) shell:<br />
.∆/ss01/clm/revid<br />
2. The system will respond with a report. See the following example.<br />
3BUS 208 055 R1101<br />
Software Diagnostic Tools<br />
165
PROPRIETARY DATA: This document contains proprietary data of ABB Inc. No disclosure, distribution (electronic or otherwise),<br />
reproduction, or other means of dissemination may be made without written permission.<br />
revision level of the application libraries<br />
/appl/lib/p0_phyl.lc:<br />
p0_phyl.lib:120.1<br />
revision level of the micro–controller software<br />
smi_id.c 120.003 02/03/94 (c) Copyright 1991-1995<br />
ecc.id.c 120.003 02/10/94 ECC (c) Copyright 1993 by ABB Process Automation, Inc.<br />
revision level of LIB01 libraries<br />
/lib01/lib01rev:<br />
lib01_rev.c 300.041 Copyright 1993 by ABB Process Automation, Inc.<br />
revision level of AVOS software<br />
@(#)avos_rev.c 300.002<br />
revision level of the ACE2/GONZO software can be obtained by running REVID utility on<br />
ACE2 directory under DOS<br />
revision level of the Health Page Reports<br />
is found on top of each Health page<br />
The underlined portions shown above indicate the release level of the respective<br />
areas and will not be underlined in the actual report.<br />
Release Level Check of Diskettes<br />
With release SP270.3, an additional method of assessing the release level of the<br />
system software is available. The existing “revid” shell script which is used to<br />
identify the release levels of various major subsystems, is supplemented by a new<br />
utility called rev_hist. This utility will run at every startup and upon demand. Its<br />
purpose is to make sure that the different software subsystems are all from diskettes<br />
having compatible revision levels. Each diskette in the release contains a small file<br />
called “xxrev”, where “xx” is a two-character identifier of the particular diskette.<br />
166 Software Diagnostic Tools<br />
3BUS 208 055 R1101
PROPRIETARY DATA: This document contains proprietary data of ABB Inc. No disclosure, distribution (electronic or otherwise),<br />
reproduction, or other means of dissemination may be made without written permission.<br />
Table 5-4 rev_hist Utility ID Codes<br />
2-Digit Code<br />
ac<br />
av<br />
h1<br />
h2<br />
pr<br />
se<br />
a1<br />
a2<br />
sa<br />
sb<br />
ss<br />
Diskette<br />
ACE/GONZO<br />
AVOS<br />
HEALTH1<br />
HEALTH2<br />
PRODUCT<br />
SENSORS<br />
APPL1<br />
APPL2<br />
SCNA<br />
SCNB<br />
SS01 BACKUP<br />
This file specifies the release level of the system when the diskette was built and<br />
also contains the revision level of each diskette that makes up the SP system (there<br />
are 11). The revision files are downloaded (by the various scripts used to transfer<br />
images to the MPRC) to the “/appl/clm” directory for the PRODUCT, SENSORS,<br />
APPL1, and APPL2 diskettes and to the “/lib01” directory for the AVOS diskette.<br />
Every time “rev_hist” is executed, it will search through the five revision files<br />
mentioned above and determine the file with the latest system release. It then uses<br />
that revision file to determine if the other revision files are the correct ones. All<br />
discrepancies in the revision files are reported. If the tool finds a problem at startup<br />
time it will cause the system to go into “migration mode”. It will then be up to the<br />
user to get out of that mode (by following the instructions) and correct the condition.<br />
The revision files for the ACE, HEALTH1 and HEALTH2 diskettes are stored in<br />
the “ace2” directory when those diskettes are installed. They can be used to verify<br />
that the correct version of the diskettes were installed. The “xxrev” files for the<br />
SCNA, SCNB, and SS01 BACKUP are not used at this time.<br />
3BUS 208 055 R1101<br />
Software Diagnostic Tools<br />
167
PROPRIETARY DATA: This document contains proprietary data of ABB Inc. No disclosure, distribution (electronic or otherwise),<br />
reproduction, or other means of dissemination may be made without written permission.<br />
Signal/Measurement Processing Analysis and<br />
Reporting (smr)<br />
The smr utility is a data collection tool for the <strong>Scanning</strong> <strong>Platform</strong> system which<br />
interactively guides the user through its setup and activation. It is designed to<br />
provide both statistical and historical information on analog input signals and sensor<br />
measurements. In addition to data analysis, a flexible data triggering and capture<br />
capability is provided that uses both analog and digital signals internal to the system.<br />
The user will be able to compare other related data values to these over the same<br />
period. The smr utility is simple enough to set up for most elementary data<br />
collections and capable enough to handle sophisticated investigations.<br />
For example, the utility can be set up to examine statistical and historical data of<br />
the basis weight measurement every time the head position is within a certain set<br />
of limits and the moisture is greater than some limit and then print out data on the<br />
system printer. This would define a particular event configuration which could be<br />
reused.<br />
The utility allows the storage of these smr event configurations in XXX.e files<br />
located in the /ss01/clm directory.<br />
The number of different event configurations that can be stored is directly related<br />
to free space on the /bram1 disk area. However, smr will only process up to three<br />
events at a time. When you develop your event configuration, carefully consider<br />
the other uses your system may have for that memory space.<br />
Summary of smr Capabilities<br />
The following is a summary of smr capabilities:<br />
• Collects snapshot and statistical data on up to nine analog input or measurement<br />
output variables for each event.<br />
• Creates multiple trigger condition within an event, thereby creating a logical<br />
“AND” function to the data collection. For example, report basis weight<br />
measurement when the head position ID is between 100 inches and 120 inches;<br />
and the moisture is greater than 5 percent.<br />
• Multiple events (up to three) can be related to form an “OR” function. For<br />
example, report basis weight measurement whenever head position is either at<br />
100 inches, 150 inches or 175 inches.<br />
• Digital and analog signals can both be used as triggers in the setup of conditions.<br />
For example, report the moisture measurement when a sheet break occurs.<br />
• Automatic display to either the screen or ramdisk file of output data upon the<br />
occurrence of some event. The data is in ASCII format.<br />
• Wide selection of parameters surrounding the definition of triggers.<br />
• Coordinated initialization and report printing of multiple events making up an<br />
“OR” collection group.<br />
168 Software Diagnostic Tools<br />
3BUS 208 055 R1101
PROPRIETARY DATA: This document contains proprietary data of ABB Inc. No disclosure, distribution (electronic or otherwise),<br />
reproduction, or other means of dissemination may be made without written permission.<br />
Operation Overview<br />
Each smr session creates, modifies, or activates what will be called an Event. An<br />
Event describes all of the characteristics of both the data capture algorithm<br />
(triggering) and the data analysis outputs. Within this file, the data capture algorithm<br />
is known as the Trigger. The analyses are called Outputs. Each Trigger for each<br />
event is defined by a set of conditional tests on a specified input signal(s) or sensor<br />
measurement(s). These are called Conditions. The Trigger for each event may<br />
contain more than one Condition (within the limits of real–time and memory) and<br />
up to nine Outputs may be requested. Not only can there be multiple Conditions<br />
and Outputs, but duplication of signals within each is allowed. This duplication<br />
allows specification of a logical AND for conditions on the same signal. This<br />
duplication allows the user to narrow his (her) view to precisely the area of concern.<br />
Finally, more than one event may be created or activated at one time, thus allowing<br />
the use of a logical OR for complex Triggers. Figure 5-2 shows a hierarchical view<br />
of Events, Triggers, and Outputs.<br />
The smr utility is menu driven, allowing the user to set up any number of different<br />
data collection events by defining the output(s), the triggering event, and the display<br />
device. Figure 5-3 is a selection tree of the available menu items. It is left to the<br />
user to establish creative uses for this tool in troubleshooting and demonstrating<br />
system performance.<br />
smr<br />
Event A Event B Event C<br />
Trigger<br />
Output<br />
Condition 1 Condition n 1 9<br />
Figure 5-2 Hierarchical View of the smr Utility<br />
3BUS 208 055 R1101<br />
Software Diagnostic Tools<br />
169
170 Software Diagnostic Tools<br />
3BUS 208 055 R1101<br />
1<br />
Revise or Add<br />
To This Event<br />
1<br />
Add A<br />
Condition<br />
1<br />
Select An<br />
Analog Input<br />
For Triggering<br />
smr Menu Tree<br />
2<br />
Start/Stop<br />
Triggering<br />
1<br />
Edit A Condition<br />
2<br />
Remove A<br />
Condition<br />
2<br />
Select A Sensor<br />
Measurement<br />
For Triggering<br />
smr<br />
Select Global Print/Initialize Of Running Events<br />
3<br />
Display Data<br />
Collection Results<br />
3<br />
Review This<br />
Event’s Trigger<br />
Condition<br />
3<br />
Select A<br />
Digital I/O<br />
For Triggering<br />
Select New Or Existing Event<br />
4<br />
Review This Event’s<br />
5<br />
Save This<br />
Configuration<br />
Event<br />
1 Select An Output Device (screen/File)<br />
2 Display Current Statistical Data<br />
3 Display Current Historical Data<br />
4 Display All Current Data<br />
5 Display Operational Status Of This Data<br />
6 Initialize Statistical Data<br />
7 Initialize Trigger Conditions<br />
4<br />
Create a<br />
Timer For<br />
Triggering<br />
1<br />
Select An<br />
Analog For<br />
Analysis<br />
1<br />
Add An<br />
Output<br />
Figure 5-3 smr Menu Selection Tree<br />
2<br />
Edit An Output<br />
2<br />
Remove An<br />
Output<br />
6<br />
Quit<br />
smr<br />
2<br />
Select A Sensor<br />
Measurement For<br />
Analysis<br />
1 or q Retain this event on exit<br />
2 Kill This Event On Exit<br />
3<br />
Review All<br />
Available Signals<br />
3<br />
Review This<br />
Event’s Outputs<br />
4<br />
Setup Automatic<br />
Reporting &<br />
Retriggering<br />
PROPRIETARY DATA: This document contains proprietary data of ABB Inc. No disclosure, distribution (electronic or otherwise),<br />
reproduction, or other means of dissemination may be made without written permission.
PROPRIETARY DATA: This document contains proprietary data of ABB Inc. No disclosure, distribution (electronic or otherwise),<br />
reproduction, or other means of dissemination may be made without written permission.<br />
Triggers<br />
There is one Trigger per event. This Trigger is described by the logic contained in<br />
all of its conditions. There is no limit to the number of conditions which make up<br />
a Trigger. However, each condition will require as much as 2000 to 4000 bytes of<br />
memory and consumes real–time. A typical Event made up of one Condition and<br />
one Output will consume approximately 21,000 bytes of memory. The logical<br />
combination of Conditions is always additive (for example – Logical AND) within<br />
an Event. Up to three events may be defined for the same signals in order to provide<br />
a logical OR for the conditions. All configured analog input signals and all<br />
configured sensor output signals (measurements) as well as the associated digital<br />
signals, are available for Triggering. These can be identified by selecting the<br />
“Review all available signals” in the menu. The same signal may be referenced<br />
more than once within an event. Mutually exclusive Conditions within an event<br />
may result in failure of a Trigger.<br />
A Condition is either true or false. A Trigger will occur only when all of its<br />
conditions are true (logical AND). Each condition contributes its state to the<br />
combined state which represents the Trigger. The state of each condition is<br />
determined at the update frequency of the signal to which it refers. Therefore, a<br />
condition which refers to the basis weight measurement will be tested once per<br />
second (50 or 60 data points processed each second, depending on the region’s<br />
power frequency). The effective frequency of testing for the trigger will be the<br />
slowest frequency among all the Conditions which make up the Trigger. Each<br />
condition may be limited in its allowed duration or frequency based on its type. In<br />
each case, the limitation is in counts of the total number of true occurrences of that<br />
condition. There are five types of Condition responses:<br />
• WHILE – Collect data while true for n number of times<br />
• AFTER – Start data collection after n number of true groups<br />
• UNTIL – Collect data until n number of true groups<br />
• REPEAT – Collect data every nth true group<br />
• TIMER – Collect data until timer expires<br />
A WHILE type of condition will become true every time that its logic is true up to<br />
a limit of n times. Unlimited response may be requested by setting n to zero. By<br />
requesting unlimited response for all WHILE conditions in an Event, an automatic<br />
reporting of the Event can be obtained, either to a ramdisk file or the console screen.<br />
An AFTER type of condition will become true after its logic has been true n–times<br />
and will remain satisfied forever afterward.<br />
An UNTIL type of condition response remains true only until n–number of true<br />
occurrences of the conditions.<br />
A REPEAT type of condition will be satisfied cyclically every n–number of times<br />
that it is true.<br />
3BUS 208 055 R1101<br />
Software Diagnostic Tools<br />
171
PROPRIETARY DATA: This document contains proprietary data of ABB Inc. No disclosure, distribution (electronic or otherwise),<br />
reproduction, or other means of dissemination may be made without written permission.<br />
A TIMER type of condition is the duration of data collection in terms of minutes<br />
or seconds. The minimum collection time is 1 second; the maximum collection<br />
time is 255 minutes. Data collection will occur from the moment of initiation by<br />
the Trigger and cease at the expiration of the timer.<br />
Conditions can be configured for either analog signals, digital signals, or a timer.<br />
There are nine logical operations available for each analog Condition and five logical<br />
operations for each digital condition.<br />
Within each type of condition described above, there are six logical operations<br />
available as follows:<br />
Analog Conditions:<br />
GT<br />
greater than entered value<br />
LT<br />
less than entered value<br />
RANGE<br />
within an entered range of values<br />
NZERO<br />
a non-zero value<br />
ZERO<br />
equal to zero<br />
ANY<br />
any occurrence of the value<br />
PERCENT INVALID greater than x percent invalid out of the total samples<br />
VALIDITY<br />
occurrence of any valid or invalid value<br />
Point–to–Point consecutive data points that differ by more than x<br />
Each of the above value tests (GT, LT, RANGE) is provided with a value or set of<br />
values to compare against the measure value. Satisfaction of a configured logical<br />
operation is sufficient for the condition to be true.<br />
Digital Conditions:<br />
HIGH a digital state of 1<br />
LOW a digital state of 0<br />
TRANSITION any change of state<br />
TRANSITION TO LOW<br />
TRANSITION TO HIGH<br />
Timer Condition:<br />
1 Second to 255 Minutes<br />
172 Software Diagnostic Tools<br />
3BUS 208 055 R1101
PROPRIETARY DATA: This document contains proprietary data of ABB Inc. No disclosure, distribution (electronic or otherwise),<br />
reproduction, or other means of dissemination may be made without written permission.<br />
Outputs<br />
Up to nine outputs may be configured for analysis per event. Each output is available<br />
as an historical element ( the last seconds worth of data), and/or a statistical element.<br />
The statistical element is a summary of the high, low, and mean of the current signal<br />
group and the accummulated signal data. In addition, there is a report of the variance<br />
and 2-sigma of all the accummulated valid data values, and a count of all the invalid<br />
samples seen. The selected signals valid data group size is determined by whether<br />
it is part of the process measurement, or if it is a supporting analog. Those analog<br />
signals that are of a supporting nature, such as temperatures and pressures, are<br />
generally sampled at a rate of two per group. Other signals associated with the<br />
process measurements, such as sensor signal inputs and sensor measurements, have<br />
group sizes dependent on the number of data boxes being processed every second.<br />
This is the result of data box width and scan speed.<br />
A view of a historical output report would show 50 to 60 data positions (depending<br />
on if the system is a 50 hz or 60 hz system), however, only the first 10-20 entries<br />
will be used for valid data. Data elements within the packet seen here are a maximum<br />
of 0.1 second in duration. In some cases, where the data box size is large, it may<br />
take two or more data elements to make up a data box. All data points in the group<br />
that are beyond the number of valid data points may be ignored and are considered<br />
as non-participating data. All data in a group are sampled for statistical inclusion<br />
whenever the Trigger occurs.<br />
The historical element of the output is a snapshot of the most recent data group<br />
contents (typically one second of data). Comparison of data between signals within<br />
a history must be done by aligning the synchronization value for each signal (see<br />
Figure 5-4). This is a time stamp which is included in the data display for each<br />
measurement in the output. Historical data may be updated while being displayed<br />
and may result in non-contiguous data elements.<br />
3BUS 208 055 R1101<br />
Software Diagnostic Tools<br />
173
PROPRIETARY DATA: This document contains proprietary data of ABB Inc. No disclosure, distribution (electronic or otherwise),<br />
reproduction, or other means of dissemination may be made without written permission.<br />
DATA HISTORY FOR EVENT beta<br />
Column number 1 contains HeadPosition01<br />
Column number 2 contains BWMeasurement01<br />
1 2<br />
SYNCH VALUE INV SYNCH VALUE CD<br />
27471<br />
27491<br />
27511<br />
27531<br />
27551<br />
27571<br />
27591<br />
25.1<br />
25.8<br />
26.5<br />
27.1<br />
27.9<br />
28.6<br />
29.2<br />
0<br />
0<br />
0<br />
0<br />
0<br />
0<br />
0<br />
27471<br />
27491<br />
27511<br />
27531<br />
27551<br />
27671<br />
27591<br />
382.4<br />
382.4<br />
382.4<br />
380.4<br />
379.4<br />
378.4<br />
380.4<br />
25.1<br />
25.8<br />
26.5<br />
27.1<br />
27.9<br />
28.6<br />
29.2<br />
INV<br />
0<br />
0<br />
0<br />
0<br />
0<br />
0<br />
0<br />
ENTER r to re-display or q to return to menu: q<br />
Figure 5-4 Analog and Measurement Historical Data Display<br />
For digital signals, the historical output provides a line of data for each time the<br />
trigger definition occurs. There is no statistical report for digital signals. The history<br />
report (see Figure 5-5) will show the date, time, synch, state, and validity. The synch<br />
value allows multiple digital events to be accurately lined up with each other in time<br />
and space.<br />
DATA STATISTICS FOR EVENT dig_tst2<br />
DIGITAL EVENTS FOR SIGNAL IRDecreaseGain01 - 02-06-1992 13:41:20<br />
Log contains 13 most recent events;<br />
DATE TIME SYNCH STATE VALIDITY<br />
__________________________________________________________<br />
_<br />
02-06-1992<br />
02-06-1992<br />
02-06-1992<br />
02-06-1992<br />
02-06-1992<br />
02-06-1992<br />
02-06-1992<br />
02-06-1992<br />
02-06-1992<br />
02-06-1992<br />
02-06-1992<br />
02-06-1992<br />
02-06-1992<br />
13:41:06<br />
13:41:06<br />
13:41:05<br />
13:41:05<br />
13:41:05<br />
13:41:04<br />
13:41:04<br />
13:41:04<br />
13:41:03<br />
13:41:03<br />
13:41:03<br />
13:41:02<br />
13:41:02<br />
408.892<br />
408.672<br />
408.118<br />
407.881<br />
407.662<br />
407.082<br />
406.833<br />
406.618<br />
406.034<br />
405.790<br />
405.576<br />
405.017<br />
404.793<br />
LOW<br />
LOW<br />
LOW<br />
LOW<br />
LOW<br />
LOW<br />
LOW<br />
LOW<br />
LOW<br />
LOW<br />
LOW<br />
LOW<br />
LOW<br />
valid<br />
valid<br />
valid<br />
valid<br />
valid<br />
valid<br />
valid<br />
valid<br />
valid<br />
valid<br />
valid<br />
valid<br />
valid<br />
Figure 5-5 Digital Historical Data Display<br />
174 Software Diagnostic Tools<br />
3BUS 208 055 R1101
PROPRIETARY DATA: This document contains proprietary data of ABB Inc. No disclosure, distribution (electronic or otherwise),<br />
reproduction, or other means of dissemination may be made without written permission.<br />
STATISTICAL DATA FOR SIGNAL BWMeasurement01<br />
TIME OF LAST TRIGGER: 01-09-1991 09:09:22 SYNCH VALUE THIS GROUP: 658471<br />
SAMPLES THIS GROUP: 50 TOTAL SAMPLES: 250<br />
PERCENT INVALID THIS GROUP 0 TOTAL INVALID SAMPLES 0<br />
MEAN THIS GROUP: 381.87 CUMULATIVE MEAN: 381.86<br />
HI VALUE THIS GROUP: 384.41 CUMULATIVE HI VALUE: 384.41<br />
LO VALUE THIS GROUP: 378.41 CUMULATIVE LO VALUE: 378.41<br />
VARIANCE OF VALID SAMPLES: 1.7400<br />
2 SIGMA OF VALID SAMPLES: 3.7600<br />
ENTER r to re-display OR q to return to menu: q<br />
Figure 5-6 Statistical Data Display<br />
Display device selection is provided for the convenience of the user. See<br />
Figure 5-6 for an example. Display of Event Statistics or history is on demand<br />
except for AUTOMATIC REPORTING. Under normal circumstances, the output<br />
will probably be directed to the service workstation screen; however, an option is<br />
provided to output reports to the <strong>Scanning</strong> <strong>Platform</strong> ramdisk for future review and<br />
analysis. The ramdisk option is slightly faster than the console screen display and<br />
accumulates the reports as they occur, which means that a trend of group data points<br />
can be collected over time. Use this option with care since the output file will<br />
continue to grow as data is collected. If space is at a premium, this could result in<br />
lost data.<br />
Automatic Reporting and Retriggering<br />
The smr utility has the ability to automatically produce a hard copy report either<br />
to the screen or to a ramdisk file, upon the occurrence of a predefined Event. The<br />
Event and subsequent reports can be repeated a defined number of times by setting<br />
a re–trigger count value. This is done through the Setup selection in the Event<br />
REVISE/ADD sub–menu or by the START/STOP Triggering sub–menu. An entry<br />
is provided in each to select automatic reporting. This includes deciding if the<br />
report is to go to the screen or to a designated file.<br />
Automatic reporting provides a convenient event–wide counter to limit the number<br />
of reported occurrences for the Event in total in which all conditions are true. It<br />
only produces an output when all of the Events’ conditions are true at the same<br />
time, whereas the counters provided in each condition are specific to that condition.<br />
3BUS 208 055 R1101<br />
Software Diagnostic Tools<br />
175
PROPRIETARY DATA: This document contains proprietary data of ABB Inc. No disclosure, distribution (electronic or otherwise),<br />
reproduction, or other means of dissemination may be made without written permission.<br />
Global Access<br />
There is a global printing and retriggering capability which allows the user to control<br />
these functions for several Events running at the same time. This invoked by typing<br />
!!. This will bring up the following options for selection:<br />
ACTIVATE/INIT TRIGGER for each Event<br />
DEACTIVATE<br />
each active Event<br />
INITIALIZE TRIGGERS<br />
for all active Events<br />
INITIALIZE STATISTICS<br />
for all active Events<br />
PRINT RESULTS<br />
for all active Events<br />
For the first two, each Event is presented to the user to give either a “yes” or “no”<br />
answer, whereas the third and fourth options (initialization), perform for all<br />
configured Events.<br />
Starting and Stopping Data Collection<br />
Data collection action specific to this Event is controlled by activities available in<br />
the START/STOP triggering sub–menu (and the Global access method). Within<br />
this selection, it is possible to do the following:<br />
Activate Triggering<br />
Deactivate Triggering<br />
Initialize Trigger Conditions<br />
Initialize Statistical Data<br />
Setup Automatic Reporting<br />
The initialization activities are also available from the Display sub–menu.<br />
Overview of Menu Selection<br />
The smr utility is menu driven, allowing the user to set up any number of different<br />
data collection Events by defining the Outputs, the Triggering Event, and the Display<br />
device. Refer to Figure 5-3 for a tree diagram of the smr menu. The menu display<br />
during each session only shows those menu options which are available at that time.<br />
For example, during the definition of a new event, you will not see menus displayed<br />
for the “remove a condition” option.<br />
General Procedure<br />
1. Enter smr while in the AVOS shell on the system console.<br />
2. Either select an existing Event file, or enter a new file name to be created. Events<br />
which have been deleted are no longer available for reactivation or for new<br />
Event names.<br />
3. Start the desired menu sequence to either create a new Event, modify an existing<br />
Event, start or stop an Event, display an output, or display collected data.<br />
176 Software Diagnostic Tools<br />
3BUS 208 055 R1101
PROPRIETARY DATA: This document contains proprietary data of ABB Inc. No disclosure, distribution (electronic or otherwise),<br />
reproduction, or other means of dissemination may be made without written permission.<br />
4. Exit the utility when done. The Event can either be left running or terminated<br />
without saving upon leaving the utility. Upon leaving with the Event terminated<br />
and not saved, the configuration of the Event is summarized.<br />
There can only be three Events configured at one time whether they are active<br />
or inactive.<br />
Practical Application<br />
It is important to understand that the triggering and output functions of this utility<br />
are independent from each other. That is, a signal which causes a Trigger is not<br />
necessarily available for examination unless a corresponding Output has been<br />
configured for the same signal. Also, statistical analysis of outputs is only<br />
performed at each Trigger. This may significantly alter the statistical validity of<br />
the data. To capture a truly valid statistical snapshot of a signal, the Trigger should<br />
be set up to capture all of the signal updates.<br />
When a Trigger occurs, it is only guaranteed that the specified logical combinations<br />
of Conditions occurred somewhere within this data group, not necessarily on the<br />
same element. As a result, mutually exclusive conditions on the same signal may<br />
indeed Trigger since the entire group of data is examined independently for each<br />
Condition within the Event.<br />
Example<br />
Collect synchronized data on the head position, the basis weight input signal and<br />
measurement, and the IR moisture input signal and measurement under the<br />
following conditions:<br />
• Collect between head positions 420 cm to 425 cm.<br />
• Only collect after the head has passed the home edge once.<br />
• Collect only if caliper measurement is greater than 125 Microns.<br />
• Collect only if Basis Weight adjacent samples are more than 50 GSM apart.<br />
• Collect five occurrences of the trigger conditions being true.<br />
Trigger Setup<br />
Condition 1 = After head position exceeds 422 cm<br />
(PrepareToMeasurePosition)<br />
type = AFTER<br />
signal = groupAHeadPosition01<br />
logic = GT 422.0<br />
number of samples to start = 1<br />
number of samples to collect = 0 (unlimited)<br />
Condition 2 = Head Position between 420 cm and 425 cm<br />
type = WHILE<br />
signal = groupAHeadPosition01<br />
logic = RANGE 420.0 cm to 425.0 cm<br />
number of samples to trigger on = 0 (unlimited)<br />
3BUS 208 055 R1101<br />
Software Diagnostic Tools<br />
177
PROPRIETARY DATA: This document contains proprietary data of ABB Inc. No disclosure, distribution (electronic or otherwise),<br />
reproduction, or other means of dissemination may be made without written permission.<br />
Condition 3 = Caliper Measurement greater than 125 Microns<br />
type = WHILE<br />
signal = caliperMeasurement01<br />
logic = GT 125.0<br />
number of samples to trigger on = 0 (unlimited)<br />
Condition 4 = Basis weight measurement with adjacent points > 50 GSM<br />
type = WHILE<br />
signal = betaMeasurement01<br />
logic = RANGE 420.0 cm to 425.0 cm<br />
number of samples to trigger on = 0 (unlimited)<br />
Setup Auto Report Trigger for 5 reports (only 5 occurrences)<br />
Collect Data On:<br />
Output 1 = Head position<br />
signal = groupAHeadPosition01<br />
Output 2 = Basis Weight analog input<br />
signal = betaInputSignal01<br />
Output 3 = Basis Weight sensor measurement<br />
signal = BWMeasurement01<br />
Output 4 = IR Moisture absorption input signal<br />
signal = IRMoistureAbsorption01<br />
Output 5 = IR Moisture reference input signal<br />
signal = IRMoistureReference01<br />
Output 6 = IR Moisture measurement<br />
signal = IRMeasurement01<br />
smr Work Sheet<br />
Use the work sheet on the following page to design your event collection routine.<br />
178 Software Diagnostic Tools<br />
3BUS 208 055 R1101
PROPRIETARY DATA: This document contains proprietary data of ABB Inc. No disclosure, distribution (electronic or otherwise),<br />
reproduction, or other means of dissemination may be made without written permission.<br />
smr Work Sheet<br />
File Name: _________________<br />
Purpose:_______________________________________________________________<br />
_______<br />
______________________________________________________________________<br />
_______<br />
______________________________________________________________________<br />
_______<br />
Output Signals:<br />
_____________________________________________________________<br />
_____________________________________________________________<br />
______________________________________________________________<br />
Conditions For Triggering: (use additional sheets for multiple conditions)<br />
Condition Signal: ____________________________No.: _______<br />
Condition Type (circle one): WHILE/AFTER/UNTIL/REPETITIVELY/TIMER<br />
Condition Logic:<br />
Analog/Measurement<br />
Digital:<br />
GT ___________<br />
High<br />
LT ___________<br />
Low<br />
Average inside/outside low: ________high:______ Transition<br />
Range inside/outside low: ________high:______ High Transition<br />
Non–Zero<br />
Low Transition<br />
Zero<br />
Any<br />
% Invalid __________<br />
Validity invalid/valid<br />
Pt–To–Pt variation<br />
__________<br />
If WHILE: No. consecutive triggers (0=forever) __________<br />
No. additional samples (0=none)<br />
__________<br />
If AFTER:<br />
No. consecutive triggers to start (0=immediately) __________<br />
No. samples to collect (0=all)<br />
__________<br />
If UNTIL: No. consecutive triggers before stop (0=first) __________<br />
No. additional samples (0=none)<br />
__________<br />
If REPETITIVELY:<br />
No. consecutive triggers (0=all requests)<br />
__________<br />
If TIMER:SECONDS MINUTES (circle one)<br />
Number of units:<br />
__________<br />
3BUS 208 055 R1101<br />
Software Diagnostic Tools<br />
179
PROPRIETARY DATA: This document contains proprietary data of ABB Inc. No disclosure, distribution (electronic or otherwise),<br />
reproduction, or other means of dissemination may be made without written permission.<br />
Resource Checks<br />
After an upgrade to a new release, it is useful to establish the new level of resource<br />
usage by the software. The resources in question include such things as buffers,<br />
memory, and processes.<br />
Whenever this situation occurs, daily checks on these resources should be made<br />
over a five day period in order to determine two things. First, that the upgrade has<br />
not caused any creeping degradation which will manifest itself in a failure later, and<br />
second, to establish a resource usage base to assist in future troubleshooting activity.<br />
The daily checks involve using the following AVOS utilities. The first one, monitor,<br />
must be used by itself, the rest can be grouped into a shell script to expedite<br />
execution.<br />
• monitor - To check real time, buffer usage, process usage, mailbox usage, and<br />
semaphore usage<br />
• derr - Checks for system bus errors<br />
• bfchk - Checks for damaged buffers<br />
• dfree - Displays the memory usage and fragmentation<br />
Obtaining the monitor Report<br />
This is an interactive report in which entries do not require pressing the return key.<br />
Since it is refreshed on a five second basis, the automatic print should be turned off<br />
(Shift-F2) and the PRINT SCREEN key stroke on the console used to obtain a<br />
printout.<br />
Call up the monitor Command Menu (see Figure 5-7).<br />
$$ monitor (cr)<br />
REPORTS:<br />
a<br />
d<br />
i<br />
m<br />
r<br />
g<br />
p<br />
s<br />
AVOS Service Activity<br />
Driver Activity<br />
Interrupt Activity<br />
Misc Activity<br />
Resource Activity<br />
General Times<br />
Process Times<br />
AVOS Service Times<br />
COMMAND MENU plh - 220.1.1.1 06/19/89<br />
FUNCTIONS:<br />
A Turn Time Accumulation On/Off<br />
F Freeze/Unfreeze Screen<br />
G Turn Process Graphs On/Off<br />
P Set Sample Period<br />
R Reset Resource Activity Counts<br />
T Reset Time Counts<br />
! Escape To Shell<br />
! Next Page<br />
z Previous Page<br />
Command Menu<br />
Q<br />
Quit Monitor<br />
Figure 5-7 Monitor Command Menu<br />
180 Software Diagnostic Tools<br />
3BUS 208 055 R1101
PROPRIETARY DATA: This document contains proprietary data of ABB Inc. No disclosure, distribution (electronic or otherwise),<br />
reproduction, or other means of dissemination may be made without written permission.<br />
Enter an A to access turning time accumulation on. Answer y to the next two<br />
questions regarding turning on and resetting the time accumulations.<br />
Select general times by entering a g. This will result in a new display called general<br />
time. Let it run for several minutes, then do a print screen to record the data. See<br />
Figure 5-8. Accumulated idle times should not go below 20%.<br />
GENERAL TIME<br />
Time collection off.<br />
Application<br />
AVOS<br />
Interrupt<br />
MTDS<br />
Idle<br />
Total<br />
DELTA<br />
00.035 1%<br />
00.063 1%<br />
00.091 2%<br />
00.047 1%<br />
04.660 95%<br />
04.896 100%<br />
Accum<br />
00:00:00.035 1%<br />
00:00:00.064 1%<br />
00:00:00.091 2%<br />
00:00:00.047 1%<br />
00:00:04.660 95%<br />
00:00:04.905 100%<br />
Figure 5-8 Monitor General Time Display<br />
Enter a q to get back to the Command Menu.<br />
3BUS 208 055 R1101<br />
Software Diagnostic Tools<br />
181
PROPRIETARY DATA: This document contains proprietary data of ABB Inc. No disclosure, distribution (electronic or otherwise),<br />
reproduction, or other means of dissemination may be made without written permission.<br />
Enter an r to select the Resource Activity. This will result in another new display<br />
called Resource Activity (see Figure 5-9). Here there are several items to observe.<br />
RESOURCE ACTIVITY<br />
Mailbox:<br />
Semaphore:<br />
Process:<br />
Buffer:<br />
create<br />
return<br />
send<br />
receive<br />
create<br />
return<br />
reserve<br />
release<br />
create<br />
return<br />
start<br />
terminate<br />
allocate<br />
deallocate<br />
Delta<br />
0<br />
0<br />
6<br />
6<br />
0<br />
0<br />
7<br />
7<br />
6<br />
6<br />
6<br />
6<br />
29<br />
29<br />
Accum<br />
181<br />
88<br />
88457<br />
88455<br />
19<br />
4<br />
738149<br />
738149<br />
83213<br />
83116<br />
83382<br />
83289<br />
437051<br />
432443<br />
Allocations<br />
Mailbox<br />
Semaphore<br />
Process<br />
Current<br />
93<br />
15<br />
97<br />
Peak<br />
95<br />
15<br />
99<br />
Figure 5-9 monitor Resource Activity Display<br />
Under MailBox: Send and receive should be about equal and stable.<br />
Under Semaphore: Reserve and release should be about equal and stable.<br />
Under Process:<br />
Create and return, and start and terminate should be<br />
close and stable respectively.<br />
Under Buffer:<br />
Allocate and deallocate should be within several<br />
thousand with relatively small day to day<br />
variations.<br />
Under Peak Allocations: Process should not ever reach 256.<br />
Any deviations from the above acceptance criteria could be an indication of a serious<br />
operations problem and should be reported to a specialist at ABB in Columbus,<br />
Ohio for analysis and perhaps further examination.<br />
182 Software Diagnostic Tools<br />
3BUS 208 055 R1101
PROPRIETARY DATA: This document contains proprietary data of ABB Inc. No disclosure, distribution (electronic or otherwise),<br />
reproduction, or other means of dissemination may be made without written permission.<br />
Obtaining derr, bfchk, and dfree Data<br />
Figure 5-10 shows an example of the reports generated by exercising the derr,<br />
bfchk, and dfree AVOS utilities. The things to look for in these reports are listed<br />
below.<br />
[01_0] $$ derr<br />
derr: No exceptions logged.<br />
[01_0] $$ bfchk<br />
All buffers are OK.<br />
[01_0] $$ dfree<br />
LOCAL POOLS:<br />
Pool<br />
Number<br />
Pool<br />
Size<br />
Memory<br />
Available<br />
Largest<br />
Block<br />
Number of<br />
Fragments<br />
Peak<br />
Usage<br />
14<br />
15<br />
24<br />
25<br />
26<br />
27<br />
28<br />
29<br />
30<br />
31<br />
16<br />
17<br />
18<br />
19<br />
20<br />
21<br />
22<br />
23<br />
TOTAL<br />
10000 10000 10000<br />
2621440 1203064 1183968<br />
<br />
<br />
<br />
<br />
<br />
<br />
<br />
1214746 673962 672514<br />
<br />
<br />
<br />
<br />
<br />
<br />
<br />
<br />
3846186 1887026 1183968<br />
1<br />
14<br />
21<br />
36<br />
272<br />
1438936<br />
557072<br />
Figure 5-10 Example of the Use of derr, bfchk, and dfree<br />
3BUS 208 055 R1101<br />
Software Diagnostic Tools<br />
183
PROPRIETARY DATA: This document contains proprietary data of ABB Inc. No disclosure, distribution (electronic or otherwise),<br />
reproduction, or other means of dissemination may be made without written permission.<br />
Under derr:<br />
Under bfchk:<br />
Under dfree:<br />
Any reported error here can be serious. There can be<br />
reported errors if a utility has abnormally aborted during<br />
its use. While this will not necessarily affect normal system<br />
operation, it should also be reported to Columbus.<br />
Any reported errors here are serious. Report them to<br />
Columbus.<br />
The thing to watch here is the stability of the memory<br />
available, largest block, and number of fragments. After<br />
several days of running, these numbers should stabilize.<br />
Number of fragments should never reach 99 or close to it.<br />
Report all problems to ABB in Columbus, Ohio.<br />
184 Software Diagnostic Tools<br />
3BUS 208 055 R1101
PROPRIETARY DATA: This document contains proprietary data of ABB Inc. No disclosure, distribution (electronic or otherwise),<br />
reproduction, or other means of dissemination may be made without written permission.<br />
How to Start the <strong>Scanning</strong> <strong>Platform</strong><br />
You must startup the <strong>Scanning</strong> <strong>Platform</strong> independently from the Host computer.<br />
The <strong>Scanning</strong> <strong>Platform</strong> has its own startup process. Handshaking between the<br />
<strong>Scanning</strong> <strong>Platform</strong> and the Host computer can occur only after both computers are<br />
up and running. Follow the steps below to start the <strong>Scanning</strong> <strong>Platform</strong>.<br />
1. Momentarily press the RESET switch.<br />
The <strong>Scanning</strong> <strong>Platform</strong> will read files from its mass storage areas and load them<br />
into memory. It will then perform the linking and initializing processes. The<br />
following messages will appear after all the images have been loaded in. These<br />
messages are associated with the systems ability to complete certain tasks<br />
during the startup process. The purpose is to provide a diagnostic report which<br />
will show where the startup process stopped in case of failure. A successful<br />
startup will display all of the following data.<br />
[1]:APPL_INIT defining exception handlers<br />
[2]:APPL_INIT defining Network Object Dictionary<br />
[3]:APPL_INIT creating global object collection<br />
[4]:APPL_INIT creating error history<br />
[5]:APPL_INIT creating appl_start community<br />
If all of these messages do not appear during a startup, the startup activity will<br />
halt. Use a backup set of diskettes or call ABB in Columbus, Ohio for<br />
assistance.<br />
2. When the processor has completed Step 2, an instruction message will appear<br />
explaining the procedure for completing handshaking with the Host computer.<br />
The action you should take depends on the status of the Host computer at the<br />
time the <strong>Scanning</strong> <strong>Platform</strong> subsystem became functional. Until handshaking<br />
is established, the following message will be displayed at the Service<br />
Workstation:<br />
3. COMMUNICATIONS TIMEOUT<br />
4. If the Host computer is already running and on-line, go to the system console<br />
of the Host computer and request the reloading command for the <strong>Scanning</strong><br />
<strong>Platform</strong> system in question. When this is done, the Service Workstation<br />
responds with the following sequence of messages.<br />
pmmFrame0x: HOST TO AMS RELOAD IN PROGRESS<br />
pmmFrame0x: HOST TO AMS RELOAD COMPLETE<br />
pmmFrame0x: HOST COMMUNICATION ESTABLISHED<br />
3BUS 208 055 R1101<br />
Software Diagnostic Tools<br />
185
PROPRIETARY DATA: This document contains proprietary data of ABB Inc. No disclosure, distribution (electronic or otherwise),<br />
reproduction, or other means of dissemination may be made without written permission.<br />
5. If the Host computer has not yet completed its startup, then you do not need to<br />
take any further action. Handshaking automatically takes place after the Host<br />
Computer system is up (provided that the <strong>Scanning</strong> <strong>Platform</strong> subsystem is<br />
already up at that point).<br />
When a reload has been requested from the Host Computer, you will receive<br />
the following messages:<br />
pmmFrame0x: HOST TO AMS DOWNLOAD IN PROGRESS<br />
pmmFrame0x: HOST TO AMS DOWNLOAD COMPLETED<br />
pmmFrame0x: HOST TO COMMUNICATION ESTABLISHED<br />
6. When handshaking has been established, the selected host computer data file<br />
information will be sent to the <strong>Scanning</strong> <strong>Platform</strong> subsystem. At this point, the<br />
scanner can be placed ON SHEET at the scanner.<br />
7. The <strong>Platform</strong> will immediately go into the standardize mode of operation when<br />
ON SHEET has been enabled.<br />
8. After the <strong>Scanning</strong> <strong>Platform</strong> subsystem has completed the startup, it might be<br />
a good idea to clear out the error buffer of all the messages which accumulated<br />
during the startup. This will make it easier to distinguish between genuine<br />
operational messages and those occurring during a startup only. The startup<br />
error messages are only important if the subsystem fails to finish loading and<br />
initializing. Enter the following command to first print out the message, and<br />
then to clear the buffer:<br />
pe -a<br />
(will display all current messages on the workstation screen).<br />
pe -c<br />
(will clear the buffer).<br />
186 Software Diagnostic Tools<br />
3BUS 208 055 R1101
PROPRIETARY DATA: This document contains proprietary data of ABB Inc. No disclosure, distribution (electronic or otherwise),<br />
reproduction, or other means of dissemination may be made without written permission.<br />
Displaying Reports within inspect<br />
The Service Workstation can be used to view Standardize, Check Sample and<br />
Calibrate Sample reports. These reports contain the same information sent to the<br />
Host computer system, but the data is displayed differently.<br />
Standardize Report<br />
There are two report arrays associated with the Standardize results:<br />
stdzResultsPending and stdzResults. stdzResultsPending reports on the results<br />
of the last standardize whether the results are within limits or not. stdzResults<br />
reports the results of the last acceptable standardize.<br />
The procedure for displaying these reports is as follows:<br />
1. Access the inspect utility.<br />
2. Type: betaSensor01->stdzResultsPending (for example)<br />
The system will report back the address of that report.<br />
3. Type in the address of the report.<br />
The system will display the results of the last standardize. See Figure 5-11.<br />
I> betaSensor01->stdzResults<br />
stdzResults: 0x307bb2 (int *)<br />
I> 0x307662<br />
0x307bb2 (id)<br />
0x307bb2: ”0X307bb2” (STRUCT_PRIVATE)<br />
ISA: BWStdzRslts (STRUCT_SHARED *)<br />
mySelf: 0x307bb2 (long)<br />
problemList 0x30d72 (id)<br />
tempCompFlag 0 ’\0’ (char)<br />
zeroScaleInput 0.000338776 (double)<br />
zeroScaleInputSigma 7.21414e-09 (double)<br />
lastCleanStdz: 0x307bd0 (char [20])<br />
dirt: 0 (double)<br />
fullScaleTempRef: 0.800937 (double)<br />
fullScaleTempSigma: 1.2531e-09 (double)<br />
logRangeClean: 7.62371 (double)<br />
logVoltageRange: 7.62371 (double)<br />
voltageSigma: 3.70175e-05 (double)<br />
tClean 0 (long)<br />
Figure 5-11 Standardize Report<br />
To view the results of the last acceptable standardize, type in the variable<br />
stdzResults. When there are no standardize failures, the address of the stdzResults<br />
and stdzResultsPending will be the same. The system will respond with the address<br />
of that report. Type in the address and the system will display the report.<br />
3BUS 208 055 R1101<br />
Software Diagnostic Tools<br />
187
PROPRIETARY DATA: This document contains proprietary data of ABB Inc. No disclosure, distribution (electronic or otherwise),<br />
reproduction, or other means of dissemination may be made without written permission.<br />
If you want to know when the last clean standardize occurred, type in the address<br />
of the lastCleanStdz and the system will display the date and time of the last clean<br />
standardize.<br />
Sample Check Report<br />
The procedure for displaying the Sample Check report is as follows:<br />
1. Access the inspect utility.<br />
2. Type: betaSensor01->checkSampleResults (for example)<br />
3. The system will report back the address of that report.<br />
4. Type in the address of the report.<br />
The system will display the results of the last check sample. See Figure 5-12.<br />
|-------------------------------------------------------------------------------|<br />
| I> betaSensor01->checkSampleResults |<br />
| checkSampleResults: 0x30842a (int *) |<br />
| I> 0x30842a |<br />
| 0x30842a (id) |<br />
| |<br />
| 0x30842a: “0x30842a” (struct_PRIVATE) |<br />
| isa: BWChkSmRslt (struct_SHARED *) |<br />
| mySelf: 0x30842a (long) |<br />
| problemList: 0x30848a (id) |<br />
| name: 0x26b182 (id) |<br />
| transPPT: 1000.46 (double) |<br />
| mylarWt: -0.0277454 (double) |<br />
| slope: 1 (double) |<br />
| offset: 0 (double) |<br />
| tempCompFlag: 0 ’\0’ (char) |<br />
| tempComp: 0.80165 (double) |<br />
| wtTempComp: 0 (double) |<br />
| processBW: -0.0277454 (double) |<br />
|-------------------------------------------------------------------------------|<br />
Figure 5-12 Check Sample Report<br />
188 Software Diagnostic Tools<br />
3BUS 208 055 R1101
PROPRIETARY DATA: This document contains proprietary data of ABB Inc. No disclosure, distribution (electronic or otherwise),<br />
reproduction, or other means of dissemination may be made without written permission.<br />
Calibrate Sample Report<br />
The procedure for displaying the Sample Check report is as follows:<br />
1. Access the inspect utility.<br />
2. Type: betaSensor01->calibrateSampleResults (for example)<br />
The system will report back the address of that report.<br />
3. Type in the address of the report.<br />
The system will display the results of the last Calibrate Sample. See<br />
Figure 5-13.<br />
|--------------------------------------------------------------------------------|<br />
|I> betaSensor01->calibrateSampleResults |<br />
| calibrateSampleResults: 0x312c7a |<br />
|I> 0x312c7a |<br />
| 0x312c7a (id) |<br />
| |<br />
| 0x312c7a: “0x312c7a” (struct_PRIVATE) |<br />
| isa: BWCalSmRslt (struct_SHARED *) |<br />
| mySelf: 0x312c7a (long) |<br />
| problemList: 0x308b22 (id) |<br />
| name: 0x26b182 (id) |<br />
| headPosition: 64 (double) |<br />
| transPPT: 602.285 (double) |<br />
| mylarWt: 29.3038 (double) |<br />
| slope: 1 (double) |<br />
| offset: 0 (double) |<br />
| tempCompFlag: 0 ’\0’ (char) |<br />
| tempComp: 0.802075 (double) |<br />
| wtTempComp: 0 (double) |<br />
| processBW: 29.3038 (double) |<br />
|--------------------------------------------------------------------------------|<br />
Figure 5-13 Check Sample Report<br />
3BUS 208 055 R1101<br />
Software Diagnostic Tools<br />
189
PROPRIETARY DATA: This document contains proprietary data of ABB Inc. No disclosure, distribution (electronic or otherwise),<br />
reproduction, or other means of dissemination may be made without written permission.<br />
Preparing On–Site Documentation<br />
Each time the <strong>Scanning</strong> <strong>Platform</strong> subsystem is restarted, it dynamically recreates<br />
the various objects and their linkages. As a result, the absolute address of any object<br />
and their associated instance variables can change from startup to startup. Therefore,<br />
access to the various instance variables and objects is primarily done through ASCII<br />
names and tokens. These are used as arguments to the utility commands which in<br />
turn gives access to the data in memory.<br />
It is important to have available the lists of names and token numbers which are<br />
recognizable within the subsystem. This section identifies the activities which must<br />
be done to obtain these name and token lists. In some cases the list should be printed<br />
out each time the system is upgraded. This will insure that certain address locations<br />
can be accessed for troubleshooting purposes in case of processor halts. See<br />
Table 5-5.<br />
Table 5-5 Hardcopy Reports for On–Site Documentation<br />
Report Name Utility Command Printout<br />
Frequency<br />
System Processor Run<br />
List<br />
Sub-System<br />
Release Levels<br />
Purpose<br />
dproc First startup Gives a list of all of the<br />
processes that are<br />
running<br />
. ∆ /ss01/clm/revid First startup Gives a list of the release<br />
levels within the system<br />
Module Map map -m Each upgrade Provides the name, type,<br />
and stack size of each<br />
module in the order in<br />
which it was loaded<br />
inspect Utility Object<br />
Names<br />
Scanner and<br />
Sensor Instance<br />
Variable List<br />
inspect<br />
:global<br />
inspect<br />
<br />
(see partial list below)<br />
scanner01<br />
betaSensot01<br />
IRSensor01<br />
caliperSensor01<br />
ashSensor01<br />
optipakSensor01<br />
pmmFrame01<br />
First startup<br />
After<br />
calibration,<br />
tuning and<br />
setup for each<br />
scanner<br />
has been<br />
completed or<br />
changed<br />
Provides a list of module<br />
names which will be<br />
recognized by the<br />
inspect utility<br />
Provides a complete<br />
list of the instance<br />
variables, their names<br />
and current values, as a<br />
record of setup and<br />
calibration activity<br />
190 Software Diagnostic Tools<br />
3BUS 208 055 R1101
PROPRIETARY DATA: This document contains proprietary data of ABB Inc. No disclosure, distribution (electronic or otherwise),<br />
reproduction, or other means of dissemination may be made without written permission.<br />
Operation of the Sensor Health Pages<br />
1. Start up the Health Report by selecting the Health Page window from the<br />
DESQview open window menu.<br />
The first page to appear after the startup data is the Overview page (see Figure<br />
5-14). The Overview page shows the <strong>Scanning</strong> <strong>Platform</strong> status of each sensor,<br />
the Frame Control Panel (FCP) status, and the scanner graphic with numeric<br />
positions. Each sensor in the status display shows a key identifier in brackets.<br />
This is the key stroke which will give access to the sensor specific Health Pages.<br />
ABB<br />
[F]<br />
Frame<br />
OK<br />
<strong>Scanning</strong> <strong>Platform</strong> Health Overview<br />
FWS140.000<br />
<strong>Scanning</strong> <strong>Platform</strong> Status<br />
[E]<br />
ELECTRONICS<br />
SERVICE CHECK<br />
DEBUG<br />
[I]<br />
IR MOISTURE<br />
OK<br />
10–13-93 13:15:20<br />
RELEASE CHECKOUT SP Release: SP250.0 Page 1 of 1<br />
PM 1 Frame Ctrl From: END COLUMN Safety Intr: RESET<br />
REEL Head Command: OFFSHEET System Alarms: NEW<br />
[V]<br />
AIR COLUMN<br />
OK<br />
[C]<br />
CALIPER<br />
SERVICE CHECK<br />
[B]<br />
BASIS WEIGHT<br />
OK<br />
[A]<br />
ASH<br />
SERVICE CHECK<br />
Offsht<br />
*<br />
<strong>Manual</strong><br />
RevJog<br />
CalSmp<br />
FCP<br />
OnSht<br />
Comp<br />
*<br />
FwdJog<br />
ChkSmp<br />
ABB<br />
SCANNING PLATFORM<br />
SHUTTER<br />
ShtBrk<br />
BwtISB<br />
HstCom<br />
*<br />
BwtHTE<br />
Stdz<br />
Maint<br />
AshISB<br />
AshHTE<br />
Sngl Pt % Home Edge Head Pos<br />
Far Edge Sht Brk Ovr<br />
10.0 74.18 46.93 171.45 ON<br />
Esc<br />
F1 F2 F3 F4 F5 F6 F7 F8 F9<br />
PRTSC<br />
F10 PGUP PGDN<br />
Figure 5-14 Health Overview Page<br />
In the setup panel of each subsystem page, the TAB key will initially make the<br />
cursor visible. Subsequent pressing of the TAB key will toggle the cursor.<br />
In the interactive setup areas of each page the arrow keys move the cursor<br />
according to the following rules:Left and right arrows move the cursor<br />
horizontally within each setup panel, highlighting each entry area on that line.<br />
The up and down arrows move the cursor to other lines within the selected subpage.<br />
3BUS 208 055 R1101<br />
Software Diagnostic Tools<br />
191
PROPRIETARY DATA: This document contains proprietary data of ABB Inc. No disclosure, distribution (electronic or otherwise),<br />
reproduction, or other means of dissemination may be made without written permission.<br />
2. To change data, enter the new value and press RETURN.<br />
3. To select a panel use the F6 through F9 keys which correspond to SETUP,<br />
STDZ, SMPCK, AND CALIB.<br />
The SETUP selection provides one or more panels in sequence which may be<br />
used to enter tuning constants, standardize limits, and other setup parameters<br />
associated with the selected sensor.<br />
The STDZ selection provides pending and last passed Standardize Reports<br />
sequentially in the lower right-hand corner of the page.<br />
The CALIB selection provides the Calibrate Sample Report in the lower righthand<br />
corner of the page.<br />
The SMPCK selection provides the Sample Check Report in the lower righthand<br />
corner of the page.<br />
The PGUP/PRVPG and PGDN/NXTPG keys allow the selection of other sensor<br />
pages which may be available. Not all sensors have multiple pages.<br />
4. To return to the Overview Page, press the ESC key. New subsystem reports can<br />
be selected without going back to the Overview Page.<br />
5. To exit the Health Page Report, press the ESC key while on the Overview Page.<br />
A second prompt will appear to confirm the desire to exit and remind you to do<br />
a gstore if data has been changed.<br />
The F1 HELP key on the Overview Page gives more detailed information on<br />
the Health Report operation.<br />
Many of the functions that are performed using the inspect utility and the genrpt<br />
utility can also be performed using the health pages. For more information,<br />
access the health pages at the Service Workstation (see<br />
Figure 5-15 and Figure 5-16).<br />
192 Software Diagnostic Tools<br />
3BUS 208 055 R1101
PROPRIETARY DATA: This document contains proprietary data of ABB Inc. No disclosure, distribution (electronic or otherwise),<br />
reproduction, or other means of dissemination may be made without written permission.<br />
ABB Inc.<br />
Smart Paper Company<br />
Machine Number 1<br />
Reel Frame<br />
Basis Weight Health Report<br />
DEMO<br />
11-21-91 16:39:47<br />
SP Release: 200.000<br />
Frame Ctrl From: HOST<br />
Head Command: SCAN<br />
Page 1 of 2<br />
Safety Intr: RESET<br />
System Alarms:NO<br />
Sensor Type: STLK Sensor Command: FROM HEAD Active Alarms: NO<br />
APC: INACTIVE<br />
CALIBRATION<br />
CONSTANTS<br />
K0 0.0000<br />
K1 0.0000<br />
K2 0.0000<br />
K3 0.0000<br />
Air Column GSM 0.0000<br />
B<br />
W<br />
S<br />
e<br />
n<br />
s<br />
o<br />
r<br />
TUNING CONSTANTS<br />
Electrometer VDC 0.0000<br />
Alarm Grid INTACT<br />
Shutter State:<br />
Sensor I/O NOT CLOSED<br />
Frame I/O NOT CLOSED<br />
Electrometer Test<br />
Engage Int Ck Smpl<br />
Open The Shutter<br />
Gap WCC GRAMS 0.000<br />
Air Mass GSM/MICRON 0.000<br />
TUNING CONSTANTS<br />
SmpChk Avg TImeSec 0<br />
Stdz FS Avg TimeSec 0<br />
No. Stdz/Int SmpChk 0<br />
OFF<br />
NO<br />
TRUE<br />
C<br />
o<br />
m<br />
p<br />
u<br />
t<br />
e<br />
r<br />
AIS VDC<br />
NOMINAL<br />
0.0000<br />
AIZ VDC 0.0000<br />
Dirt GSM 0.000<br />
NOISE Z VDC<br />
NOISE F VDC<br />
NOISE T °C<br />
Range<br />
0.0000<br />
0.0000<br />
0.000<br />
0.0000<br />
0.0000<br />
0.0000<br />
Basis Wt GSM 0.000<br />
Basis Wt<br />
CU<br />
0.000<br />
Sample Check 6/07 8:09:55<br />
PROC WT GSM 0.000<br />
STD WT GSM 0.000<br />
SLOPE 0.000<br />
OFFSET GSM 0.00<br />
PPT 0<br />
TMPCGR GSM 0.000<br />
Src Temp °C 0.00<br />
Det Temp °C 0.00<br />
Gap Wt Corr GSM 0.0000<br />
Esc<br />
EXIT<br />
F1<br />
HELP<br />
F2<br />
ALARM<br />
F3<br />
DATA<br />
F4<br />
F5<br />
F6<br />
SETUP<br />
F7<br />
STDZ<br />
F8<br />
SMPCK<br />
F9<br />
CALIB<br />
F10<br />
PRTSC<br />
PGUP<br />
PRVPG<br />
PGDN<br />
NXTPG<br />
Figure 5-15 Basis Weight Health Report Showing Sample Check<br />
3BUS 208 055 R1101<br />
Software Diagnostic Tools<br />
193
PROPRIETARY DATA: This document contains proprietary data of ABB Inc. No disclosure, distribution (electronic or otherwise),<br />
reproduction, or other means of dissemination may be made without written permission.<br />
ABB Inc.<br />
Smart Paper Company<br />
Machine Number 1<br />
Reel Frame<br />
Sensor Type: STLK<br />
Basis Weight Health Report<br />
DEMO<br />
SP Release: 200.000<br />
Frame Ctrl From: HOST<br />
Head Command: SCAN<br />
Sensor Command: FROM HEAD<br />
11-21-91 16:39:47<br />
Page 1 of 2<br />
Safety Intr: RESET<br />
System Alarms: NO<br />
Active Alarms: NO<br />
APC: INACTIVE<br />
CALIBRATION<br />
CONSTANTS<br />
K0 0.0000<br />
K1 0.0000<br />
K2 0.0000<br />
K3 0.0000<br />
Temp Comp GSM 0.0000<br />
TUNING CONSTANTS<br />
Gap WCC GRAMS 0.000<br />
Air Mass GSM/MICRON 0.000<br />
MISCELLANEOUS SETUP<br />
SmpChk Avg TIme Sec 0<br />
Stdz FS Avg Time Sec 0<br />
No. Stdz/Int SmpChk 0<br />
AIS VDC<br />
NOMINAL<br />
0.0000<br />
AIZ VDC 0.0000<br />
Dirt GSM 0.000<br />
NOISE Z VDC<br />
NOISE F VDC<br />
NOISE T °C<br />
Range<br />
0.0000<br />
0.0000<br />
0.000<br />
0.0000<br />
0.0000<br />
0.0000<br />
Basis Wt GSM 0.000<br />
Basis Wt CU 0.000<br />
B<br />
W<br />
S<br />
e<br />
n<br />
s<br />
o<br />
r<br />
Electrometer VDC 0.0000<br />
Alarm Grid INTACT<br />
Shutter State:<br />
Sensor I/O NOT CLOSED<br />
Frame I/O NOT CLOSED<br />
Electrometer Test OFF<br />
Engage Int Ck Smpl NO<br />
Open The Shutter TRUE<br />
C<br />
o<br />
m<br />
p<br />
u<br />
t<br />
e<br />
r<br />
Calib Sample 10/11 12:13:55<br />
PROC WT GSM 0.000<br />
STD WT GSM 0.000<br />
SLOPE 0.000<br />
OFFSET GSM 0.00<br />
PPT 0<br />
TMPCOR GSM 0.000<br />
Src Temp °C 0.00<br />
Det Temp °C 0.00<br />
Cap Wt Corr GSM 0.0000<br />
Esc F1 F2 F3<br />
F4 F5 F6<br />
F7 F8 F9 F10 PGUP PGDN<br />
Figure 5-16 Basis Weight Health Page Showing Calibrate Sample<br />
194 Software Diagnostic Tools<br />
3BUS 208 055 R1101
PROPRIETARY DATA: This document contains proprietary data of ABB Inc. No disclosure, distribution (electronic or otherwise),<br />
reproduction, or other means of dissemination may be made without written permission.<br />
Off-Line Debug<br />
The OFFLINE DEBUG prompt is a mode of operation invoked when the AVOS<br />
Operating System is told to run a program called panic. This will happen on demand<br />
if the MPRC front panel diagnostic switch is in the DEBUG or down position when<br />
a reset is initiated. It will happen under normal operating conditions if the Operating<br />
System Software sees a condition it cannot resolve. Typically, that would result in<br />
a reset and startup of the system if the front panel diagnostic switch were in the<br />
SHORT DIAG (mid) or EXTEN DIAG (up) positions.<br />
There are a number of operations available to the user in the OFFLINE DEBUG<br />
mode. These functions are listed and explained in Table 5-6.<br />
Table 5-6 OFFLINE DEBUG Modes<br />
CMND Function Explanation<br />
d addr1 [addr2 or +disp] display memory Prints out in hex-dump<br />
format, the contents of the<br />
addresses from addr1 to<br />
addr2 or a displacement. If<br />
only addr1 is specified, then<br />
only one address is displayed.<br />
e display panic message This is a report of all the<br />
routines that complained to<br />
the panic program.<br />
g [code] startup using entered code This code is the means to tell<br />
the system to continue the<br />
restart operation. If no code<br />
is passed, the system will do a<br />
normal restart. If code is a 1,<br />
the system will do a short<br />
startup. If code is an f, the<br />
system will come up prepared<br />
to reblast the EEPROMs on<br />
the MPRC board.<br />
h display command summary A help function giving the<br />
information from the first two<br />
columns of this table.<br />
i [puid] display/modify processor id<br />
x display exception error log This is basically a summary of<br />
the buss errors as they would<br />
be found using the derr utility<br />
with the system running.<br />
3BUS 208 055 R1101<br />
Software Diagnostic Tools<br />
195
PROPRIETARY DATA: This document contains proprietary data of ABB Inc. No disclosure, distribution (electronic or otherwise),<br />
reproduction, or other means of dissemination may be made without written permission.<br />
If the system is experiencing frequent resetting, it will be helpful to determine if it<br />
is caused by power problems or from within the Operating System itself. If resets<br />
are occurring, place the diagnostic switch in the down position and wait for the next<br />
reset. At that time, the OFFLINE DEBUG prompt will appear.<br />
It would be helpful to have a printer connected in order to obtain a hardcopy of the<br />
data about to be dumped. If there is a problem in the Operating System, the data<br />
will have to be forwarded to Measurement Software Engineering in Columbus, Ohio<br />
for analysis and action.<br />
Under the conditions mentioned above, the two commands which should first be<br />
exercised are e and x. If the e and the x results show no exceptions occurred, then<br />
the resetting situation is probably due to a power problem in one of the DC power<br />
supplies or leads. If the results show some exception data, then continue and collect<br />
a memory dump of the first 100 locations. Do this by typing; d 1 100. Before<br />
sending the data to Columbus, there is a high probability that the problem is a<br />
hardware failure in the MPRC board. Install a new MPRC board to make this final<br />
verification.<br />
196 Software Diagnostic Tools<br />
3BUS 208 055 R1101
PROPRIETARY DATA: This document contains proprietary data of ABB Inc. No disclosure, distribution (electronic or otherwise),<br />
reproduction, or other means of dissemination may be made without written permission.<br />
6<br />
Sensor <strong>Troubleshooting</strong><br />
This chapter contains the following major sections:<br />
Section ...............................................................................................Page<br />
Sensor Compensation - Operation and Setup ................................................ 198<br />
Air Column Compensation for Smart Sensors ............................................... 202<br />
Changing the Measurement Resolution ......................................................... 203<br />
Sensor Measurement Validity Codes ............................................................. 205<br />
Sensor Local Modes of Operation ................................................................. 206<br />
Basis Weight Sensor (TLK, TLP, and TLS) ................................................... 209<br />
Infrared Moisture Sensor ............................................................................... 213<br />
Ash Sensors (TLXR) ...................................................................................... 239<br />
Air Bearing, Contacting, and Non-Contacting Caliper Sensors .................... 246<br />
The following sensors have detailed troubleshooting procedures given in their<br />
respective technical manuals.<br />
• Aseptic<br />
• Smart Ash (STLXR)<br />
• Smart Weight (STLK11, STLP3)<br />
• GT Caliper<br />
• Smart Color (scanning)<br />
• Gloss<br />
• Microwave<br />
• OptiPak<br />
• Sheet Temperature<br />
For other sensors, the troubleshooting procedures can be found in this section.<br />
3BUS 208 055 R1101<br />
Sensor <strong>Troubleshooting</strong><br />
197
PROPRIETARY DATA: This document contains proprietary data of ABB Inc. No disclosure, distribution (electronic or otherwise),<br />
reproduction, or other means of dissemination may be made without written permission.<br />
Sensor Compensation - Operation and Setup<br />
This section will describe the generic operational flow of applied compensations<br />
and how to set them up for different modes. These comments apply to the three<br />
sensors:<br />
• IR Moisture<br />
• Ash<br />
• Microwave<br />
Definition of Terms<br />
In the following table, the “xx” prefix associated with each variable, identifies the<br />
particular parameter being applied as compensation to the measurement. If<br />
moisture, “xx” is “mo”. If it is Basis Weight, it is “bw”. If it is ash, then “xx” is<br />
“ash”. For sheet temperature, “xx” is “temp”.<br />
Variable<br />
xxDefaultCompFlag<br />
xxCurrentCompFlag<br />
xxCompensation<br />
xxExternalCompensation<br />
Definition<br />
A coldstart variable which selects the normal measuring<br />
arrangement regarding the source of compensation to be<br />
used. The choices are a 0 to select the internally available<br />
measurement, or a 1 to select the externally available<br />
value.<br />
This is a dynamic flag which is set according to the<br />
measuring mode being executed. When it is a 0, it is<br />
directing the internal measurement to be used. When a 1,<br />
it is directing the external value to be used. In normal<br />
measure mode, this flag is the same as the<br />
xxDefaultCompFlag. In Sample Check Mode, the flag is<br />
able to change depending on the Mode selected. If,<br />
however, the xxDefaultCompFlag is already a 1 (external<br />
compensation), then internal compensation for Sample<br />
Check is not available and either external or default<br />
compensation will be selected for that sensor.<br />
This is the value of compensation being applied to the<br />
measurement at the current moment.<br />
This is the value of the compensation which is available<br />
from the external source, typically a product code or grade<br />
file from a host computer<br />
198 Sensor <strong>Troubleshooting</strong><br />
3BUS 208 055 R1101
PROPRIETARY DATA: This document contains proprietary data of ABB Inc. No disclosure, distribution (electronic or otherwise),<br />
reproduction, or other means of dissemination may be made without written permission.<br />
Variable<br />
xxDefaultCompensation<br />
checkSampleMode3yyyy<br />
Definition<br />
This is the value available within the <strong>Scanning</strong> <strong>Platform</strong><br />
sensor object whenever the external compensation value is<br />
0.0.<br />
This is the Sample Check Mode 3 value used for<br />
compensation. It is located in the sensor’s pmm interface<br />
object. The “yyyy” indicates the particular compensation<br />
parameter; i.e., Weight, Ash, Moisture, or Temperature.<br />
Operation<br />
Figure 6-1 is a flow diagram showing the logical paths followed when a<br />
compensation is selected by the measurement. This diagram is generic for all three<br />
sensors which have applied compensations; IR Moisture (bw and ash), Ash (bw<br />
and mo), and Microwave Moisture (bw and temp). Included is the logical functions<br />
associated with the Sample Check function showing the effect of mode selection.<br />
3BUS 208 055 R1101<br />
Sensor <strong>Troubleshooting</strong><br />
199
PROPRIETARY DATA: This document contains proprietary data of ABB Inc. No disclosure, distribution (electronic or otherwise),<br />
reproduction, or other means of dissemination may be made without written permission.<br />
axxDefaultCompFlag<br />
SC Mode 2<br />
Set the xxCurrentCompFlag<br />
to the desired configuration.<br />
SC Mode 1<br />
xxDefaultCompFlag<br />
SC Mode 1<br />
SC Mode 2<br />
xxCurrentCompFlag<br />
0001 11<br />
0100 10<br />
0010 01<br />
0101 11<br />
=0<br />
Is CurrentCompFlag<br />
set<br />
=1<br />
0=internal<br />
1=external<br />
Is Smp Chk<br />
Active<br />
NO<br />
1,2<br />
YES<br />
0<br />
What mode<br />
3<br />
BUCKET<br />
Set xxCompensation=<br />
checksSampleMode3yyyy<br />
YES<br />
Is internal compensation<br />
valid<br />
NO<br />
Is<br />
xxExternal Compensation<br />
0.0<br />
NO<br />
YES<br />
YES<br />
Set the xxCompensation=last packet of<br />
measurement.<br />
Set xxCompensation=<br />
xxDefaultCompensation.<br />
Set xxCompensation=<br />
xxExternalCompensation.<br />
Figure 6-1 Flow Diagram of Compensation Selection Logic<br />
200 Sensor <strong>Troubleshooting</strong><br />
3BUS 208 055 R1101
PROPRIETARY DATA: This document contains proprietary data of ABB Inc. No disclosure, distribution (electronic or otherwise),<br />
reproduction, or other means of dissemination may be made without written permission.<br />
Compensation Flag Setup<br />
The following are the variable names associated with each dependent sensor type.<br />
IRSensor01<br />
ashSensor01<br />
microwaveSensor01<br />
Table 6-1<br />
bwDefaultCompFlag<br />
ashDefaultCompFlag<br />
bwDefaultCompFlag<br />
moDefaultCompFlag<br />
bwDefaultCompFlag<br />
tempDefaultCompFlag<br />
1. Determine the compensation needs of the dependent sensor and identify if the<br />
required compensations are available internally. At initial build time, the<br />
compensations should be selected as internal if the sensor is available.<br />
2. Operating in the inspect mode, set the compensating default flag with the<br />
following command form:<br />
xxxxxSensor01->xxDefaultCompFlag=y (where “y” = 1 for external, =0 for<br />
internal)<br />
3. Exit the inspect utility and save the changes using the gstore utility. Save to<br />
the scanner community.<br />
4. Restart the <strong>Scanning</strong> <strong>Platform</strong> to activate the changes made.<br />
5. Make sure the Product Code Files or Grade Files located on the host computer<br />
have appropriate compensation values in place for all compensations, even<br />
those which are to be internal.<br />
Active compensations being used can be seen on a sensor’s Health Page display. It<br />
is located on the left center section of the page. On Smart Sensor types, the Air Col<br />
Comp value will be seen as X.XXX. This is correct as the actual value is currently<br />
unavailable for display.<br />
3BUS 208 055 R1101<br />
Sensor <strong>Troubleshooting</strong><br />
201
PROPRIETARY DATA: This document contains proprietary data of ABB Inc. No disclosure, distribution (electronic or otherwise),<br />
reproduction, or other means of dissemination may be made without written permission.<br />
Air Column Compensation for Smart Sensors<br />
Both the Smart Basis Weight and Smart Ash sensors are provided with air column<br />
compensation. This compensation is derived from a proximeter sensor physically<br />
located on the Smart Basis Weight module. Under normal conditions, the<br />
compensating signal is always present with the dependent weight and ash sensors<br />
set up to receive and use it. There are cases, however, where the gap proximeter<br />
has failed causing the Smart sensor measurements to go invalid. In these cases, if<br />
the platform is considered stable and without significant beam bending, it is<br />
appropriate to change the setup to the Smart sensors so that they will no longer<br />
require the air column deviation signal to process their measurement.<br />
Procedure to Disable Gap Compensation<br />
1. Using the inspect utility, change the instance variable gapCompDesired in each<br />
Smart sensor object. The command lines are:<br />
betaSensor01 -> gapCompDesired=0<br />
ashSensor01 -> gapCompDesired=0<br />
2. Exit the inspect utility. Save the changes using the gstore utility. This makes<br />
changes continue after any future restart.<br />
3. Run the Air Profile Display routine from the host to determine if the Basis<br />
Weight profile is sufficiently flat in the absence of gap compensation. If there<br />
is deemed too much bending in the profile, it might be wise to not use the Smart<br />
measurement for control purposes.<br />
202 Sensor <strong>Troubleshooting</strong><br />
3BUS 208 055 R1101
PROPRIETARY DATA: This document contains proprietary data of ABB Inc. No disclosure, distribution (electronic or otherwise),<br />
reproduction, or other means of dissemination may be made without written permission.<br />
Changing the Measurement Resolution<br />
Except for AccuRay Direct interfaces which use floating point data transfers to the<br />
host computer, all profile measurement data transfers to a host are done using scaled<br />
integer. The <strong>Scanning</strong> <strong>Platform</strong> acts as the controlling influence as far as how the<br />
scaling is set up. There is a flag in the pmmFrame01 object called<br />
altMeasurementScaleFactorFlag. The host computer looks at the status of this<br />
flag to determine what descaling it needs to apply to measurements from the various<br />
sensors. On the <strong>Scanning</strong> <strong>Platform</strong> side, each sensor interface object (i.e.<br />
pmmBeta01, etc.) looks at the flag to determine which of two measurement scale<br />
factors it should use for the measurement. For some sensors, both the standard and<br />
the alternate scale factor are the same, for example in IR Moisture, they are both<br />
set to 100. Sensors which can benefit from increased resolution are Basis Weight<br />
and Caliper. In both cases, however, it depends on the maximum measurement to<br />
be encountered as the process is measured.<br />
Note:<br />
Calibrate Sample and Check Sample data is also sent up to the host<br />
as scaled integer, but they have a separate scaling factor assigned.<br />
This discussion is only for the profile data.<br />
The two scale factors for these two sensors are 10 (std) and 100 (alt). Table 6-2<br />
shows the limitations of when the resolution can be increased. The limitation is<br />
because with certain customer units defined, it will be possible to saturate the integer<br />
format with a large measurement reading.<br />
Table 6-2<br />
Sensor<br />
Customer Units<br />
Largest Value<br />
with STD<br />
Largest Value<br />
with Alt<br />
Basis Weight (all) Reams 3276.7 lbs. 327.67 lbs.<br />
GSM 3276.7 GSM 327.67 GSM<br />
Caliper (all) Mils 3276.7 Mils 327.67 Mils<br />
Microns 3276.7 Microns 327.67 Microns<br />
3BUS 208 055 R1101<br />
Sensor <strong>Troubleshooting</strong><br />
203
PROPRIETARY DATA: This document contains proprietary data of ABB Inc. No disclosure, distribution (electronic or otherwise),<br />
reproduction, or other means of dissemination may be made without written permission.<br />
It is possible to further increase resolution on those applications where the<br />
measurement value is small and it is desirable to see smaller degrees of variation.<br />
In those cases where an increased resolution will not saturate the scaled integer, the<br />
alternate scale factor may be changed for the sensor in question to 1000. This<br />
requires a comparable descaling change in the host. In this case, a caliper<br />
measurement in Mils would have a maximum reading range of 32.762 mils.<br />
It should be noted that when the alternate scale factor flag is selected, it is selected<br />
for all sensors in the head package. The standard (std) and alternate (alt) scale<br />
factors for each sensor can be found in each interface sensor object (i.e.<br />
pmmBeta01) with the names stdMeasurementScaleFactor and<br />
altMeasurementScaleFactor respectively. Note that for most measurements, the<br />
two factors are the same.<br />
204 Sensor <strong>Troubleshooting</strong><br />
3BUS 208 055 R1101
PROPRIETARY DATA: This document contains proprietary data of ABB Inc. No disclosure, distribution (electronic or otherwise),<br />
reproduction, or other means of dissemination may be made without written permission.<br />
Sensor Measurement Validity Codes<br />
The validity of various sensor measurements can be answered by examining the<br />
outputSignal instance variable array for each sensor object. The array contains<br />
the most recent batch of measurement signals processed, giving the value, the<br />
associated cross-machine head position, the machine direction position (not used<br />
at present), the validity code, and the synch code. Each measurement point in the<br />
batch has the following format:<br />
V1: meas. value (double)<br />
V2: CD Head position (double)<br />
V3: MD position (double)<br />
V4: dec. validity hex validity (short)<br />
V5: synch code (long)<br />
The validity codes are interpreted using the hex presentation in the array. The hex<br />
value is preceded by a 0x prefix. It is a four digit code with each position having<br />
an example of its interpretation revealed in Table 6-3. See Health Report HELP<br />
Pages (F1 key) for each sensor to get correct interpretation.<br />
To examine the validity codes, use the inspect utility in the long display mode.<br />
Request the array using the following command format:<br />
sensorObject->outputSignal<br />
sensorObject is the name listed in :global; for example, betaSensor01.<br />
Table 6-3 Validity Codes (Basis Weight Shown)<br />
Validity Code<br />
Meaning<br />
0x0001 Analog Input failure<br />
0x0002 No initial standardize<br />
0x0004 In diagnostic mode<br />
0x0008 Cross direction unsynchronized<br />
0x0010 Cross direction measurement invalid<br />
0x0020 Machine direction unsynchronized<br />
0x0040 Shutter closed<br />
0x0080 Measuring air profile<br />
0x0100 Standardize<br />
0x0200 Check Sample<br />
0x0400 Unsynchronized sensor data<br />
0x0800 Invalid Compensation<br />
0x1000 Sensor input out of range<br />
0x2000 Loss of vacuum or sensor changing gain<br />
0x4000 Sensor not measuring<br />
3BUS 208 055 R1101<br />
Sensor <strong>Troubleshooting</strong><br />
205
PROPRIETARY DATA: This document contains proprietary data of ABB Inc. No disclosure, distribution (electronic or otherwise),<br />
reproduction, or other means of dissemination may be made without written permission.<br />
Sensor Local Modes of Operation<br />
Each sensor can be individually placed in one of several modes of operation, apart<br />
from what is being called for by either the Host or Health Pages. While in one of<br />
these local modes, the sensor measurement is kept invalid so as not to adversely<br />
affect any process control activitiy. These local modes of operation can be useful<br />
in diagnosing problems within a sensor while the system is otherwise providing<br />
measurements in other areas.<br />
Placing a sensor in one of the local modes can be done either from the Host or by<br />
using the Health Page Sensor Command input. The table below provides a<br />
description of the various local modes for all sensors except for the <strong>Scanning</strong> Color<br />
sensor. The color sensor has a unique set of modes which are covered in the Smart<br />
Color Sensor <strong>Manual</strong>, 3BUS 208 130 RXX01.<br />
Function<br />
Exit Local<br />
Mode<br />
Sensor to<br />
Sleep<br />
Health Page<br />
Name<br />
Host Code<br />
& Number<br />
Description & Use<br />
From Head 0 All Sensors:<br />
Takes the sensor out of local mode<br />
and makes it available for normal<br />
operation. If the system is already in<br />
a measure mode with other sensors,<br />
it will be necessary to force the<br />
system to cycle through a prepare to<br />
measure sequence to get the<br />
reawakened sensor to start normal<br />
measurement.<br />
Sleep 7 Basis Weight and Ash Sensors:<br />
Closes the shutter and clamps (“old”<br />
weight & ash) the electrometer.<br />
All IR Transmission Sensors:<br />
Sets the gain to the standardize<br />
value.<br />
All IR Reflection Sensors:<br />
Keeps the flag disengaged.<br />
Caliper Sensors:<br />
Lifts the probes, turns on the<br />
pressure, turns off any vacuum or<br />
purge.<br />
OptiPak and Gloss:<br />
Leaves the signals unclamped.<br />
206 Sensor <strong>Troubleshooting</strong><br />
3BUS 208 055 R1101
PROPRIETARY DATA: This document contains proprietary data of ABB Inc. No disclosure, distribution (electronic or otherwise),<br />
reproduction, or other means of dissemination may be made without written permission.<br />
Function<br />
Clean<br />
Standardize<br />
Health Page<br />
Name<br />
Diag Clean<br />
Stdz<br />
Host Code<br />
& Number<br />
Description & Use<br />
2 All Sensors:<br />
Sends a CLEAN standardize request<br />
to the sensor creating new values in<br />
the standardize reports, both to the<br />
Health Pages and the Host interface.<br />
If the standardize results are valid,<br />
they will be used to update the<br />
current standardize parameters.<br />
Dirty Window<br />
Standardize<br />
Diag Stdz 1 All Sensors:<br />
Sends a DIRTY standardize request<br />
to the sensor. The sensor will then<br />
perform the standardize function as<br />
defined by its defaultStdzMode<br />
flag, creating new values in the<br />
standardize reports, both to the<br />
Health Pages and the Host interface.<br />
If the standardize results are valid,<br />
they will be used to update the<br />
current standardize parameters.<br />
Note that only the Basis Weight,<br />
Caliper, and OptiPak sensors have<br />
unique functions under a DIRTY<br />
standardize request.<br />
Sample Check<br />
Diag Sample<br />
Chk<br />
4 All Sensors:<br />
If the scanner head is off-sheet at the<br />
Frame Control Panel, and the Host is<br />
in Sample Check Mode (1190 is<br />
always in Sample Check mode when<br />
off-sheet), then a Sample Check<br />
routine will be exercised for the<br />
sensor in question and a new report<br />
will be generated to both the Health<br />
Pages and the Host interface.<br />
3BUS 208 055 R1101<br />
Sensor <strong>Troubleshooting</strong><br />
207
PROPRIETARY DATA: This document contains proprietary data of ABB Inc. No disclosure, distribution (electronic or otherwise),<br />
reproduction, or other means of dissemination may be made without written permission.<br />
Function<br />
Calibrate<br />
Sample<br />
Normal<br />
Measurement<br />
Prepare To<br />
Move<br />
Health Page<br />
Name<br />
Diag Calib<br />
Smpl<br />
Diag<br />
Measure<br />
Diag Prep<br />
Move<br />
Host Code<br />
& Number<br />
Description & Use<br />
5 All Sensors:<br />
The local Normal Measure mode<br />
(Mode 8) must first be selected if the<br />
scanner head is off-sheet. When the<br />
local Calibrate Sample mode is<br />
selected, a Calibrate Sample routine<br />
with a collection time based on the<br />
minimum collection time, will be<br />
exercised for the sensor in question<br />
and a new report will be generated to<br />
both the Health Pages and the Host<br />
interface.<br />
8 All Sensors:<br />
This mode performs the various<br />
prepare to measure routines, then<br />
runs through the normal measuring<br />
routines, allowing the measured<br />
values to be observed on the Health<br />
Page or in the outputsignal instance<br />
variable of the sensor object. The<br />
sensor’s measurement to the Host<br />
will remain invalid.<br />
81 All Sensors:<br />
This mode performs the various<br />
prepare to move routines on the<br />
sensor. The net effect of this mode<br />
is to put the sensor to sleep, making<br />
this mode redundant with the Sensor<br />
to Sleep mode.<br />
208 Sensor <strong>Troubleshooting</strong><br />
3BUS 208 055 R1101
PROPRIETARY DATA: This document contains proprietary data of ABB Inc. No disclosure, distribution (electronic or otherwise),<br />
reproduction, or other means of dissemination may be made without written permission.<br />
Basis Weight Sensor (TLK, TLP, and TLS)<br />
<strong>Troubleshooting</strong> Flow Chart<br />
<strong>Troubleshooting</strong> the Basis Weight sensor is facilitated by using the flow chart, with<br />
its directives, on the next page.<br />
3BUS 208 055 R1101<br />
Sensor <strong>Troubleshooting</strong><br />
209
PROPRIETARY DATA: This document contains proprietary data of ABB Inc. No disclosure, distribution (electronic or otherwise),<br />
reproduction, or other means of dissemination may be made without written permission.<br />
Basis<br />
Weight Sensor<br />
Has<br />
Sensor<br />
Verification Been<br />
Done<br />
NO<br />
Perform Sensor<br />
Verification.<br />
YES<br />
Does<br />
Operator’s Station<br />
Standardize<br />
Lamp<br />
Go Off<br />
NO<br />
Does<br />
Gauge<br />
Standardize<br />
Get Sensor Alarm<br />
Status.<br />
YES<br />
Get Sensor Alarm<br />
Status.<br />
YES<br />
Is<br />
Data Valid<br />
During<br />
Scan<br />
YES<br />
NO<br />
Check for Invalid Scan Due<br />
to Normal Occurrences<br />
Such As: Calibrate Sample,<br />
Air Profile Collection, Sensor<br />
in Local, Adjusting Scan<br />
Limits.<br />
Perform One Complete Scan<br />
to Clear Errors.<br />
Is<br />
Standardize<br />
Data Stable<br />
and Noise<br />
Free<br />
NO<br />
Perform sensor verification to<br />
resolve stability problems.<br />
YES<br />
Perform Sensor<br />
Verification Section.<br />
NO<br />
Check<br />
Samples OK<br />
(Basis Weight<br />
and PPT)<br />
Calibrate<br />
Sample<br />
OK<br />
YES<br />
YES<br />
Perform sensor<br />
verification to<br />
resolve stability<br />
problems.<br />
NO<br />
Check for Invalid Scan Due to<br />
Normal Occurrences Such As:<br />
Calibrate Sample, Air Profile<br />
Collection, Sensor in Local,<br />
Adjusting Scan Limits.<br />
Perform One Complete Scan to<br />
Clear Errors.<br />
Check for Overflow.<br />
Repeat Calibrate Sample<br />
Except with Shorter<br />
Collection Time.<br />
Get Sensor Alarm<br />
Status.<br />
Figure 6-2 Basis Weight <strong>Troubleshooting</strong> Flow Chart<br />
210 Sensor <strong>Troubleshooting</strong><br />
3BUS 208 055 R1101
PROPRIETARY DATA: This document contains proprietary data of ABB Inc. No disclosure, distribution (electronic or otherwise),<br />
reproduction, or other means of dissemination may be made without written permission.<br />
Basis Weight Hardware Diagnostics<br />
The inspect utility will be used to exercise the Electrometer Clamp and the Shutter<br />
will provide a test of on-line hardware performance. These on-line tests utilize the<br />
<strong>Scanning</strong> <strong>Platform</strong> software in initiating several combinations of Clamp and Shutter<br />
operation.<br />
1. Place the Basis Weight sensor in the off-sheet position from the operator station.<br />
2. The initial condition will be Electrometer Clamped and Shutter Closed. Using<br />
the inspect utility commands given below, execute the conditions shown in the<br />
matrix of Table 6-4.<br />
To Open or Close Shutter:<br />
()[betaSensor01 private$openShutter] (to open)<br />
()[betaSensor01 private$closeShutter] (to close)<br />
To Unclamp or Clamp Electrometer<br />
()[betaSensor01 private$clampElectrometer] (to clamp)<br />
()[betaSensor01 private$unclampElectrometer] (to unclamp)<br />
Table 6-4 Electrometer Responses to Shutter/Clamp Commands<br />
Command Given Clamp Unclamp<br />
Shutter Open 0 mv ± 6 mv 7.2 to 9.2 vdc*<br />
Shutter Closed 0 mv ± 6 mv 0 mv ± 6 mv<br />
*TLP geometries may be as low as 5.0 vdc.<br />
3. Before leaving the tests, restore the Basis Weight sensor to having a clamped<br />
Electrometer with the Shutter Closed.<br />
Table 6-5 on the next page gives a summary of the fault conditions and actions to<br />
be taken.<br />
3BUS 208 055 R1101<br />
Sensor <strong>Troubleshooting</strong><br />
211
PROPRIETARY DATA: This document contains proprietary data of ABB Inc. No disclosure, distribution (electronic or otherwise),<br />
reproduction, or other means of dissemination may be made without written permission.<br />
Table 6-5 Basis Weight Electrometer Hardware Diagnostics<br />
Condition Possible Cause Action to Take<br />
Never Clamped Bad electrometer Replace the electrometer.<br />
Always Clamped<br />
Watch source open/close lamps, listen<br />
for shutter or check shutter with a geiger<br />
counter. If shutter is inoperative,<br />
complete the following:<br />
1. Check circuit breaker.<br />
2. Check point-to-point wiring.<br />
3. Check alarm grid relay.<br />
4. Check interlocks.<br />
5. Check thermal fuse.<br />
Bad electrometer<br />
zero circuit<br />
Shutter always open<br />
Loss of Signal<br />
Bad electrometer<br />
1. Poor wiring<br />
2. Bad power supply<br />
3. Bad electrometer<br />
If shutter is operative, complete the<br />
following:<br />
1. Check power supplies.<br />
2. Check high voltage supply.<br />
3. Replace electrometer.<br />
Replace the electrometer.<br />
Watch source open/close lamps, listen<br />
for shutter or check shutter with a<br />
Geiger counter. If shutter is inoperative,<br />
complete the following:<br />
1. Check circuit breaker.<br />
2. Check point-to-point wiring.<br />
3. Check alarm grid relay.<br />
4. Check interlocks.<br />
5. Check thermal fuse.<br />
If shutter is operative, complete the<br />
following:<br />
1. Check power supplies.<br />
2. Check high voltage supply.<br />
1. Check point-to-point wiring.<br />
2. Check power supplies.<br />
• Check 900V power supply<br />
at the output test points.<br />
• Check ± 15V supply.<br />
• Check voltage in head.<br />
3. Replace the electrometer.<br />
212 Sensor <strong>Troubleshooting</strong><br />
3BUS 208 055 R1101
PROPRIETARY DATA: This document contains proprietary data of ABB Inc. No disclosure, distribution (electronic or otherwise),<br />
reproduction, or other means of dissemination may be made without written permission.<br />
Infrared Moisture Sensor<br />
This section describes methods and hints to use when troubleshooting the Infrared<br />
measurement subsystem. It assumes the user is familiar with how the sensor works<br />
and the Standardize and Sample Check procedures.<br />
The Infrared sensor is considered to be the basic replacement unit. This means that<br />
the sensor is not repairable on site except for lamp replacement.<br />
This troubleshooting procedure is used to decide if you have a System, <strong>Platform</strong><br />
and Sensor, or Process related problem. The decision is based on analysis of error<br />
codes and the use of an oscilloscope to observe the sensor signals. These three<br />
areas are defined as follows:<br />
1. System related problems are concerned with that part of the measurement<br />
subsystem from the junction box to the Host.<br />
The problem may relate to system hardware or software. The solution may be:<br />
a. Changing some software limit check, calibration constant.<br />
b. Replacing a circuit board such as MPRC or ECS.<br />
2. <strong>Platform</strong> and Sensor problems can occur within the moisture measurement<br />
subsystem from the ABB Smart Processing Center (ASPC) to the sensor<br />
module. The solution may be to change wiring or connectors on the <strong>Platform</strong><br />
or change the sensor module itself.<br />
3. Process problems are related to some change in the process which has adversely<br />
affected the accuracy of the Infrared moisture measurement subsystem. These<br />
problems may find solution in picking a different sensor model less affected by<br />
the variability, or by compensating for the process change (if the change is<br />
predictable or measurable). The process effect may be related to dust, dirt,<br />
temperature, sheet composition, or others.<br />
Steps may be taken to reduce or eliminate these types of interference.<br />
Problems with the Infrared Moisture measurement subsystem are generally noticed<br />
in two ways. The first is the failure of some limit test causing a sensor alarm code<br />
and sensor data invalid to appear. The second is bad correlation between the<br />
processed measurement output and a lab reading without any particular error<br />
message.<br />
Sensor Alarm Codes<br />
When Sensor Data Invalid alarm occurs, determine the alarm number associated<br />
with that failure. The alarm number will point the direction for the next step which<br />
may be the use of the sensor health pages for Infrared Moisture Measurements or<br />
an oscilloscope to observe sensor signals.<br />
A list of the error codes is provided in Figure 6-7.<br />
3BUS 208 055 R1101<br />
Sensor <strong>Troubleshooting</strong><br />
213
PROPRIETARY DATA: This document contains proprietary data of ABB Inc. No disclosure, distribution (electronic or otherwise),<br />
reproduction, or other means of dissemination may be made without written permission.<br />
Table 6-6 Infrared Moisture Alarms<br />
Alarm Number<br />
Description<br />
4600/4700 Sequence error other than standardize<br />
4601/4701 Standardize okay - no ‘soft’ errors<br />
4602/4702 AGC failure other than standardize<br />
4603/4703 A or R raw signal out of range<br />
4606/4706 Basis weight at limit (for Infrared)<br />
4608/4708 Calculation over range<br />
4609/4709 A/D failure other than standardize<br />
4611/4711 A signal A/D offset out of range<br />
4613/4713 R signal A/D offset out of range<br />
4615/4715 A signal out of range - air gap<br />
4617/4717 R signal out of range - air gap<br />
4619/4719 A/R ratio out of range (KC or KS) out of range<br />
4621/4721 AGC standardize gain out of range<br />
4622/4722 AGC failure during standardize<br />
4624/4724 A/R ratio noise (SIGMIR) out of limit<br />
4670/4770 Sequence error during standardize<br />
4678/4778 Standardize not completed<br />
4679/4779 A/D failure during standardize<br />
To view these alarms, access the Health Page Report at the Service Workstation or<br />
the alarm report at the Host.<br />
• In the pe report, the full alarm number and mnemonic are displayed.<br />
• In the Health Page alarm overlay, only the mnemonic is displayed.<br />
• At the Host, only the last two digits of the alarm code are displayed.<br />
Alarms 4619/4719 and 4624/4724<br />
This is a typical problem and may be accompanied by measurement correlation<br />
problems or a noticeable DRIFT in the TREND after the sensor has been off-sheet<br />
for a while. The symptom is failure to standardize that may clear on a second or<br />
third standardize and the failure was due to KC ratio being out of limits. Water on<br />
windows will reduce the value of KC. Also coupled with this failure will be a high<br />
SIGMIR reading which may be high enough to cause a failure of that limit. If the<br />
signals look normal and there is no excessive jumping of the signals, then look for<br />
condensation on the outside of the sensor windows.<br />
214 Sensor <strong>Troubleshooting</strong><br />
3BUS 208 055 R1101
PROPRIETARY DATA: This document contains proprietary data of ABB Inc. No disclosure, distribution (electronic or otherwise),<br />
reproduction, or other means of dissemination may be made without written permission.<br />
The condensation occurs due to the large temperature change between off-sheet<br />
and on-sheet positions. If the condensation is on the sensor windows it may be<br />
eliminated by proper adjustment of the air wipes. In extreme cases of condensation,<br />
a heated air wipe or window heater may be required to correct the problem.<br />
The condensation may be occurring inside the sensor. Since it is difficult to observe<br />
the condensation inside the sensor, the best action is to replace the sensor after<br />
determining the condensation is not on the outside of the sensor window.<br />
In some HemiPlus sensors, unusually high values of the head constant, KF1 or KF2,<br />
may force this error to occur. The expected ratio should be changed to a value equal<br />
to KF1 divided by 512 (or KF2 divided by 512). If KF1 equals 595, then the expected<br />
standardize ratio should be changed to 1.16.<br />
Alarms 4615/4715, 4616/4716, 4617/4717, 4618/4718, & 4622/4722<br />
This is generally the indication if the sensor is “dead.” First, verify if the Infrared<br />
source lamp is on by looking at the following signals available on the Infrared Sensor<br />
Health Page.<br />
Lamp Current (Lamp Curr) 7.2 to 7.7 VDC<br />
Lamp Volts<br />
10 to 14 VDC<br />
Head Revolutions (Hd Revolutions) 50 or 60 rpm<br />
If there is no lamp or voltage, but there are head revolutions, then cycle the circuit<br />
breaker on the Infrared lamp supply in the <strong>Scanning</strong> <strong>Platform</strong>. Watch to see if any<br />
of the signals on the Sensor Health Page return. If the lamp signals return, then the<br />
sensor was shut down due to an overtemperature. Check the liquid cooling unit and<br />
be sure there is good water flow to the sensor. If the lamp signals do not return,<br />
change the lamp.<br />
If there are no head revolutions displayed on the Sensor Health Page, then there<br />
may be a problem with the 120 VAC power or the -15 VDC supply to the sensor.<br />
Refer to the functional diagram for the infrared sensor and the diagnostic card to<br />
examine these signals for measurement. An oscilloscope is needed to examine the<br />
logic pulse. Logic signals from the sensor must be present or the lamp current will<br />
not turn on. Refer to Figure 6-3.<br />
If the above signals are correct, examine the head pulses from the detector head.<br />
Use an oscilloscope and the diagnostic card to compare the pulse train to the pulse<br />
train shown in Figure 6-3. If there is no pulse train, the problem is probably a bad<br />
detector head. If the pulse train is correct, the problem may be in the Infrared ECS<br />
board. For HemiPlus sensors, you should also be able to move the pulses up and<br />
down using the increase and decrease commands on the Infrared Sensor Health<br />
report.<br />
The key point in these procedures is deciding if the problem is in the <strong>Platform</strong>,<br />
sensor or in the system. If the sensor signals are present but saturated, the system<br />
is either not setting the gain (HemiPlus) or the system does not recognize the signals.<br />
3BUS 208 055 R1101<br />
Sensor <strong>Troubleshooting</strong><br />
215
PROPRIETARY DATA: This document contains proprietary data of ABB Inc. No disclosure, distribution (electronic or otherwise),<br />
reproduction, or other means of dissemination may be made without written permission.<br />
Alarm 4603/4703<br />
Figure 6-3 Sensor Head Signals<br />
Since the pre-amp gain is adjusted every 45 seconds, occasional 4603/4703 alarms<br />
may be seen on a very wide process where there is either a very heavy or very light<br />
weight streak in the process. The software has the capability of coping with a certain<br />
amount of these. The variables which affect this are called<br />
saturatedSignalCounterLimit and smallSignalCounterLimit, and are located in<br />
the IRGmodule. This is the number of 0.125 second readings which are out of<br />
specification (too large or too small) that are allowed per scan. Increasing these<br />
numbers will allow a certain amount of bad data to be processed, so be aware of<br />
how this may affect trends, averages, and Short Term Machine Direction Variability<br />
calculations.<br />
Use the pulse monitor on the Infrared Health Page Report to determine how bad the<br />
problem is, and if it is due to heavy or light weight spots. The problem can also be<br />
due to intermittent wires in the <strong>Platform</strong>.<br />
Changing the IRGModule coldstart variables highMeanSignalLimit and<br />
lowMeanSignalLimit can affect the frequency of occurrence of 03 alarms if they<br />
are caused by wild process variations. highMeanSignalLimit and<br />
lowMeanSignalLimit define the window that the system attempts to keep the “R”<br />
pulse within. These values may be increased or decreased to keep the signals larger<br />
or smaller but be sure to keep highMeanSignalLimit 1.5 to 1.9 times larger than<br />
lowMeanSignalLimit and less than maxsignalLimit 1.4.<br />
216 Sensor <strong>Troubleshooting</strong><br />
3BUS 208 055 R1101
PROPRIETARY DATA: This document contains proprietary data of ABB Inc. No disclosure, distribution (electronic or otherwise),<br />
reproduction, or other means of dissemination may be made without written permission.<br />
Alarm 4608/4708<br />
This alarm is generally the result of a wildly varying process. If the<br />
smallSignalCounterLimit number has been made large, then this alarm may occur<br />
by trying to take the ratio (R/A) when “A” is a very small value or 0. Changing<br />
highMeanSignalLimit and lowMeanSignalLimit may reduce the frequency of<br />
these alarms. Use the oscilloscope to determine just why the alarm may be<br />
occurring. Often, intermittent <strong>Platform</strong> wiring problems will cause 4603/4703 or<br />
4608/4708 alarms. These will be noticed on the oscilloscope while jogging the<br />
<strong>Platform</strong> around a suspect point. The problem may be the result of AC interference<br />
to the head signals caused by either improper grounds or optical interference in the<br />
detector sensor.<br />
Alarm 4602/4702<br />
Air Gap Conditioner failure other than at standardize may be caused by several<br />
different problems. Using the oscilloscope and calibrate sample reports, determine<br />
if the AGC is being correctly set. Occasionally, circuit card failures inside the sensor<br />
will cause this alarm even if the sensor signals look correct when examined in the<br />
Junction Box.<br />
If the problem persists with a new sensor and the sensor signals look good not<br />
excessively noisy, the failure may be due to the system trying to step the gain below<br />
-3 db, the lower pre-amp limit. Try increasing the highMeanSignalLimit and the<br />
lowMeanSignalLimit as high as possible to get the gain up one more step.<br />
Increasing the chiller temperature to 115° F may decrease the detector signal enough<br />
to make the gain increase one more step.<br />
Alarm 4621/4721<br />
Usually this is the alarm if the sensor is “dead”. On some systems, the<br />
values for airAbsorptionNominal, airAbsorptionRange, airReferenceNominal,<br />
airReferenceRange, normalizationFactorNominal,<br />
normalizationFactorRange, stdzGainNominal, and stdzGainRange may be<br />
inappropriate and cause this alarm. Using the Infrared Sensor Health Page Report<br />
and changing these values may solve this problem.<br />
Alarms 4609/4709, 4611/4711, 4612/4712, 4613/4713, 4614/4714,<br />
and 4679/4779<br />
These alarms are caused by two things. If the logic stream from the sensor is not<br />
getting to the ECS board, this error may be generated. This error may also be caused<br />
by failure of the ECS card. The most usual cause is a bad ECS card.<br />
3BUS 208 055 R1101<br />
Sensor <strong>Troubleshooting</strong><br />
217
PROPRIETARY DATA: This document contains proprietary data of ABB Inc. No disclosure, distribution (electronic or otherwise),<br />
reproduction, or other means of dissemination may be made without written permission.<br />
Correlation Problems<br />
Correlation problems are disagreements between the indicated sensor moisture and<br />
a lab moisture determination. It is still a good practice to observe the signals on an<br />
oscilloscope to be sure that there is no intermittent noise or other interference<br />
problems. Bright lights or infrared heaters can cause a type of interference which<br />
may be noticed as a calibration shift. On the oscilloscope, the problem would be<br />
noticed as 60 or 120 (50 or 100) Hz interference superimposed on the sensor signals.<br />
Bad grounding will have the same effect.<br />
If the correlation technique is in question, refer to ASTP-10 and ASTP-11.<br />
General Correlation Scatter<br />
After establishing that the sensor signals are interference free, the first area to<br />
examine in correlation problems is the data taking and lab technique. Tests should<br />
be constructed to evaluate the accuracy of the procedure being used. Also, glass or<br />
bagged process samples should be read on the sensor to ascertain the stability of<br />
the measurement subsystem. Off-line bag sample correlation methods are always<br />
preferred; sometimes however, dynamic analysis is required to verify the off-line<br />
data. Some of the following subjects may affect the sensor readings and should be<br />
evaluated if measurement errors are suspected.<br />
Rewet<br />
If rewet showers are used just prior to the measurement, errors may be experienced<br />
in correlation. The best prevention is to have the shower at least 0.5 seconds from<br />
the measurement. There has been some indication that when “hot” water is used<br />
for the rewet, the problem will be less. If a cold water shower is 0.25 seconds from<br />
the measurement, only 60 percent of the added water will be measured. The problem<br />
is due to a transparent layer of water lying on the surface of the sheet. If the water<br />
is “in” the sheet, the problem should not be severe. The problem will always be<br />
more severe for reflection type scanners.<br />
Dirt Buildup on the Sensor Window<br />
The geometry has been designed to be very insensitive to dust on the window. The<br />
only material known to have a noticeable effect on the measurement is a “black”<br />
buildup caused by a graphite, or other oily substances on the sensor windows. This<br />
will cause a lower than normal reading. This problem has been successfully<br />
addressed by using heated air wipes on the sensor. The heated air keeps<br />
hydrocarbons from condensing on the cooler sensor windows. This problem is<br />
more severe on light weight sheets (below 60 g/m 2 ). The size of this problem<br />
will always be less severe for HemiPlus sensors.<br />
218 Sensor <strong>Troubleshooting</strong><br />
3BUS 208 055 R1101
PROPRIETARY DATA: This document contains proprietary data of ABB Inc. No disclosure, distribution (electronic or otherwise),<br />
reproduction, or other means of dissemination may be made without written permission.<br />
Step-Outs in the Trend<br />
If step-outs or “drifts” are noticed after the sensor has been off-sheet for a while,<br />
the problem is probably condensation. If the condensation is on the sensor windows,<br />
then air wipe adjustment may cure the problem. If the condensation is internal,<br />
then the sensors must be changed. Heated air wipes are a solution for these<br />
problems. Heated air wipes also keep condensate from dripping from the heads<br />
onto the process.<br />
Step-outs which occur during measurement should be examined using the<br />
oscilloscope. It is easier to observe the effects while scanning a constant sample.<br />
Sometimes synchronous noises may get into the Infrared sensor signals due to<br />
grounding problems. The problems may come and go with different gain settings.<br />
Composition Effects on Infrared Sensors<br />
The HemiPlus Infrared sensors have been designed to have low sensitivity to sheet<br />
composition. However, the sensitivity with the 2 Filter option to composition is<br />
not zero. Typical changes in specific scatter coefficient of less than 20 cm 2 /g will<br />
cause errors of less than 0.2% moisture. Changes in specific scatter coefficient in<br />
grade are typically less than 20 cm 2 /g.<br />
Any additive which contains a broadband absorber such as carbon black, iron oxide,<br />
or black liquor will cause a substantial error on these sensors. Specific values for<br />
error are discussed in the ASTP-11 for the appropriate sensor. The direction of the<br />
error is always negative, which means that the sensor reads too low. Carbon black<br />
in the form of recycled newsprint is a major source of error. When the pulp is deinked,<br />
recycle errors are much less. However, depending on the efficiency of the<br />
de-inking process, there may be some problem with correlation in all 2Filter Infrared<br />
sensors.<br />
The HemiPlus sensor has practically no sensitivity to either specific scatter<br />
coefficient or carbon black. The only requirement is that the Infrared signals be<br />
able to penetrate the sheet. This sensor will always give better results compared to<br />
other 2Filter sensors on any readable paper grade.<br />
Operation at Design Limits<br />
On some applications, the sensor has to operate near to or exceed design limits<br />
when it comes to basis weight, moisture, or sheet attenuation levels. It is useful to<br />
know that on the low end (for example, thin capacitor paper), the Infrared signal<br />
changes very little due to moisture, and extreme freedom from noise and good<br />
stability is required to read out accurate moisture.<br />
On the high end, the sensitivity gets very high, and a high moisture content can<br />
cause a very large pulse ratio on a transmission gauge, where alarm conditions can<br />
occur. It is a good practice on heavy weight applications to test the sensor at a little<br />
higher weight than usual in scan mode. This can be done by taping an extra sheet<br />
of paper over the bottom heads (basis weight/moisture) and scanning the process.<br />
3BUS 208 055 R1101<br />
Sensor <strong>Troubleshooting</strong><br />
219
PROPRIETARY DATA: This document contains proprietary data of ABB Inc. No disclosure, distribution (electronic or otherwise),<br />
reproduction, or other means of dissemination may be made without written permission.<br />
Insufficient Cooling<br />
At some sites with very hot sheet temperatures and low chiller flow rates, the water<br />
to the heads changes in temperature. If nothing standard can be made to cure the<br />
problem, there is a modification that can be made to increase chiller flow rate.<br />
Contact a Measurement Specialist for further details.<br />
<strong>Troubleshooting</strong> Flow Charts<br />
Use the following flow charts to correct poor sensor performance. These tests will<br />
completely examine the sensor hardware and software. No special tools are<br />
required. The time required to complete this procedure depends on the condition<br />
of the sensor at the time of examinations.<br />
Note:<br />
The alarm numbers referred to in these flow charts are the last two<br />
digits of the full alarm number, as they would appear at the Host<br />
computer.<br />
220 Sensor <strong>Troubleshooting</strong><br />
3BUS 208 055 R1101
PROPRIETARY DATA: This document contains proprietary data of ABB Inc. No disclosure, distribution (electronic or otherwise),<br />
reproduction, or other means of dissemination may be made without written permission.<br />
1<br />
NO<br />
Does the sensor<br />
standardize<br />
3<br />
YES<br />
Is the standardize<br />
alarm 01 (OK)<br />
NO<br />
YES<br />
5<br />
Change alarm<br />
limits to alarm<br />
on bad data.<br />
NO<br />
Is the standardize<br />
data reasonable<br />
YES<br />
Does sample check<br />
work<br />
NO<br />
YES<br />
9<br />
NO<br />
Is the status 00 (OK)<br />
4<br />
YES<br />
Is the standardize<br />
data reasonable<br />
NO<br />
YES<br />
10<br />
NO<br />
Does calibrate<br />
sample work<br />
11<br />
YES<br />
Is the status 00 (OK)<br />
NO<br />
YES<br />
4<br />
NO<br />
Is the calibrate sample<br />
data reasonable<br />
12<br />
2<br />
Figure 6-4 <strong>Troubleshooting</strong> Flow Chart 1<br />
3BUS 208 055 R1101<br />
Sensor <strong>Troubleshooting</strong><br />
221
PROPRIETARY DATA: This document contains proprietary data of ABB Inc. No disclosure, distribution (electronic or otherwise),<br />
reproduction, or other means of dissemination may be made without written permission.<br />
2<br />
NO<br />
Does the sensor<br />
measure<br />
13<br />
YES<br />
Is the measurement<br />
data valid<br />
NO<br />
YES<br />
4<br />
NO<br />
Is the scan average<br />
reasonable<br />
14<br />
YES<br />
Is the moisture<br />
profile reasonable<br />
NO<br />
YES<br />
15<br />
NO<br />
Is the correlation<br />
reasonable<br />
16<br />
YES<br />
Quit! You have<br />
done a nice job!<br />
Figure 6-5 <strong>Troubleshooting</strong> Flow Chart 2<br />
222 Sensor <strong>Troubleshooting</strong><br />
3BUS 208 055 R1101
PROPRIETARY DATA: This document contains proprietary data of ABB Inc. No disclosure, distribution (electronic or otherwise),<br />
reproduction, or other means of dissemination may be made without written permission.<br />
3<br />
Does the standardize<br />
light go off<br />
Get sensor alarm status<br />
from Channel Code 100.<br />
4<br />
Is the <strong>Platform</strong><br />
in local<br />
Is there a sheet<br />
break<br />
YES<br />
Put gauge on sheet<br />
at <strong>Platform</strong>.<br />
Wait for sheet up or<br />
set sheetbreak<br />
override.<br />
Look at PC (position complete)<br />
in PmmFrame0->fddo<br />
(in:long mode).<br />
PC = 0<br />
YES<br />
Troubleshoot <strong>Platform</strong><br />
positioning problem.<br />
PC = 1<br />
Check other <strong>Platform</strong>.<br />
Look at smode in<br />
PmmFrame0x->fddo<br />
(in:long mode).<br />
Smode < 02<br />
Smode < 03<br />
Troubleshoot faulty sensor<br />
or put it to sleep.<br />
Figure 6-6 <strong>Troubleshooting</strong> Flow Chart 3<br />
3BUS 208 055 R1101<br />
Sensor <strong>Troubleshooting</strong><br />
223
PROPRIETARY DATA: This document contains proprietary data of ABB Inc. No disclosure, distribution (electronic or otherwise),<br />
reproduction, or other means of dissemination may be made without written permission.<br />
4<br />
Soft error<br />
Code 01<br />
YES<br />
Make a valid scan. Error<br />
may be due to calibrate<br />
sample, adjust scan limits, or<br />
air profile setup.<br />
Hard error<br />
Code 02<br />
YES<br />
Make a valid standardize.<br />
Code 04<br />
YES<br />
Sensor in local<br />
Return to system control.<br />
Code 10<br />
YES<br />
Troubleshoot basis weight.<br />
Bais weight invalid<br />
Code 30<br />
YES<br />
Provide valid compensation.<br />
Compensation defaulted<br />
to product code file<br />
Air profile in process<br />
Code 80<br />
Return<br />
YES<br />
Complete air profile<br />
procedures.<br />
Note:<br />
These alarms are determined in the sequence shown so that when<br />
an alarm is encountered each previous alarm condition has passed.<br />
Therefore, some judgement is needed to determine the error.<br />
Figure 6-7 <strong>Troubleshooting</strong> Flow Chart 4<br />
224 Sensor <strong>Troubleshooting</strong><br />
3BUS 208 055 R1101
PROPRIETARY DATA: This document contains proprietary data of ABB Inc. No disclosure, distribution (electronic or otherwise),<br />
reproduction, or other means of dissemination may be made without written permission.<br />
5<br />
Standardize alarm is not 01 (ok)<br />
Standardize not completed.<br />
Alarm 78<br />
Re-standardize<br />
NO<br />
A/D failure<br />
standardize.<br />
Alarm 79<br />
YES<br />
Change the IRPC board<br />
first, then the AI32 board.<br />
Average a signal OFSA<br />
with head pulses clamped<br />
is greater than<br />
absorptionOffsetNominal<br />
+<br />
absorptionOffsetRange.<br />
NO<br />
Alarm 11<br />
NO<br />
YES<br />
Average a signal OFSA<br />
with head pulses clamped<br />
is less than<br />
absorptionOffsetNominal<br />
+<br />
absorptionOffsetRange.<br />
Alarm 12<br />
NO<br />
Alarm 13<br />
YES<br />
YES<br />
Average a signal OFSA<br />
with head pulses clamped<br />
is greater than<br />
referenceOffsetNominal<br />
+ referenceOffsetRange.<br />
NO<br />
Alarm 14<br />
YES<br />
Average a signal OFSA<br />
with head pulses clamped is less<br />
than<br />
referenceOffsetNominal -<br />
referenceOffsetRange.<br />
Air gap IR gain which set<br />
R signal at mid A/D<br />
range is outside of limits.<br />
NO<br />
Alarm 22<br />
NO<br />
Alarm 21<br />
YES<br />
YES<br />
7<br />
Check for dust or oil on<br />
window. Check chiller<br />
for flow and temperature.<br />
Check that the StdzGain<br />
is within the<br />
StdzGainNormal + the<br />
StdzGainRange.<br />
Also check the StdzLow<br />
SignalLimit and the<br />
StdzHighSignalLimit.<br />
NO<br />
Air gap IR gain is less than<br />
1 or greater than 31.<br />
6<br />
7<br />
Figure 6-8 <strong>Troubleshooting</strong> Flow Chart 5<br />
3BUS 208 055 R1101<br />
Sensor <strong>Troubleshooting</strong><br />
225
PROPRIETARY DATA: This document contains proprietary data of ABB Inc. No disclosure, distribution (electronic or otherwise),<br />
reproduction, or other means of dissemination may be made without written permission.<br />
6<br />
Standardize alarm is not 01 (ok)<br />
Average a signal AAIR<br />
with air gap is greater<br />
than air<br />
absorptionnominal +<br />
airAbsorption Range.<br />
Average a signal AAIR<br />
with air gap is less than<br />
airAbsorptionNorminal<br />
-airAbsorptionRange.<br />
Average R signal RAIR<br />
with air gap is greater<br />
than<br />
referenceNominal<br />
+ airReferenceRange.<br />
Alarm 15<br />
NO<br />
Alarm 16<br />
NO<br />
Alarm 17<br />
YES<br />
YES<br />
YES<br />
Average R signal RAIR<br />
with air gap is less than<br />
airReferenceNominal<br />
- airReferenceRange.<br />
Alarm 18<br />
NO<br />
YES<br />
Air gap ratio (KS) of AAIR/<br />
RAIR exceeds<br />
normalizationFactorNominal<br />
+<br />
normalizationFactorRange.<br />
NO<br />
Alarm 19<br />
YES<br />
7<br />
Air gap ratio (KS) of AAIR/<br />
RAIR exceeds<br />
normalizationFactorNominal -<br />
normalizationFactorRange.<br />
NO<br />
Alarm 20<br />
YES<br />
Check for dust or oil on<br />
window. Check chiller<br />
for flow and temperature.<br />
Air gap noise (variation in KS)<br />
exceeds<br />
normalizationFactorNominal<br />
+ normalizationFactorRange.<br />
Alarm 24<br />
NO<br />
7<br />
YES<br />
Check for intermittent cable, ground noise,<br />
steam in gap, or unusual ambient light source<br />
near the gap. Verify coldstart values<br />
in IR module, IRG module, and IRS sensor.<br />
Figure 6-9 <strong>Troubleshooting</strong> Flow Chart 6<br />
226 Sensor <strong>Troubleshooting</strong><br />
3BUS 208 055 R1101
PROPRIETARY DATA: This document contains proprietary data of ABB Inc. No disclosure, distribution (electronic or otherwise),<br />
reproduction, or other means of dissemination may be made without written permission.<br />
Run hardware test using the Infrared<br />
Sensor Health Page Pulse Monitor.<br />
7<br />
IR sensor measurement is not correct<br />
-15VDC test<br />
reading between -14.5<br />
and -15.5<br />
NO<br />
Check -15VDC power supply<br />
and replace if required.<br />
YES<br />
+15VDC test<br />
reading between 14.5<br />
and 15.5<br />
NO<br />
Check +15VDC power supply<br />
and replace if required.<br />
YES<br />
Is lamp current<br />
between 7.2<br />
and 7.7 AMPS<br />
YES<br />
NO<br />
Turn lamp off and then back<br />
on. Replace if bad.<br />
Check both 6.3VAC<br />
transformers, motor rotation,<br />
safety switch, and cabling.<br />
Run hardware pulse tests with the<br />
Infrared sensor Health Page Pulse<br />
Monitor at min gain, max gain, and<br />
mid range with the lamp on and off.<br />
Head pulse reading<br />
with lamp on:<br />
MIN = 0 to 0.5<br />
MAX = 9 to 10<br />
MID = 4.8 to 5.4<br />
NO<br />
YES<br />
Head pulse reading<br />
with lamp on:<br />
0 to 0.5<br />
NO<br />
8<br />
YES<br />
Replace head pulse tests and monitor with the<br />
Infrared Sensor Health Page Pulse Monitor.<br />
Check voltages at the sensor. Replace the<br />
heads.<br />
Figure 6-10 <strong>Troubleshooting</strong> Flow Chart 7<br />
3BUS 208 055 R1101<br />
Sensor <strong>Troubleshooting</strong><br />
227
PROPRIETARY DATA: This document contains proprietary data of ABB Inc. No disclosure, distribution (electronic or otherwise),<br />
reproduction, or other means of dissemination may be made without written permission.<br />
Run hardware pulse tests in the gain<br />
monitor (GM) position with the<br />
Infrared Sensor Health Page Pulse<br />
Monitor at min gain, max gain, and<br />
mid range with the lamp on.<br />
8<br />
IR sensor measurement is not correct<br />
Hd Revolutions reading<br />
with lamp on: 50 or 60<br />
NO<br />
Run logic pulse tests at the Infrared<br />
Sensor Health Page Pulse Monitor<br />
with the motor on and then off.<br />
YES<br />
Replace head pulse tests and monitor<br />
pulses from the Infrared Sensor Health<br />
Page Pulse Monitor. Check voltages at<br />
the sensor. Replace the heads.<br />
Check for intermittent cabling and<br />
connectors. Replace the IRPC<br />
board.<br />
Figure 6-11 <strong>Troubleshooting</strong> Flow Chart 8<br />
228 Sensor <strong>Troubleshooting</strong><br />
3BUS 208 055 R1101
PROPRIETARY DATA: This document contains proprietary data of ABB Inc. No disclosure, distribution (electronic or otherwise),<br />
reproduction, or other means of dissemination may be made without written permission.<br />
9<br />
Is the <strong>Platform</strong><br />
in local<br />
NO<br />
YES<br />
YES<br />
Has the wrong<br />
mode been entered<br />
Put gauge on sheet<br />
at <strong>Platform</strong>.<br />
Enter correct mode in from<br />
the Host.<br />
NO<br />
Look at PC (position complete)<br />
in PmmFrame0x->fddo<br />
(in:long mode).<br />
PC = 0<br />
YES<br />
NO<br />
Troubleshoot <strong>Platform</strong><br />
positioning problem.<br />
PC = 1<br />
YES<br />
Look at smode in<br />
PmmFrame0x->fddo<br />
(in:long mode).<br />
YES<br />
Smode < 04<br />
Check other <strong>Platform</strong>.<br />
NO<br />
Smode < 05<br />
Troubleshoot faulty sensor<br />
or put it to sleep.<br />
Figure 6-12 <strong>Troubleshooting</strong> Flow Chart 9<br />
3BUS 208 055 R1101<br />
Sensor <strong>Troubleshooting</strong><br />
229
PROPRIETARY DATA: This document contains proprietary data of ABB Inc. No disclosure, distribution (electronic or otherwise),<br />
reproduction, or other means of dissemination may be made without written permission.<br />
10<br />
Sample Check Data<br />
is not Reasonable<br />
Was the wrong<br />
mode entered<br />
NO<br />
Is the compensation<br />
wrong<br />
YES<br />
YES<br />
Enter the correct check<br />
sample mode.<br />
NO<br />
Enter the correct compensation.<br />
Are the conversion<br />
factors wrong<br />
NO<br />
Is the slope or<br />
offset wrong<br />
NO<br />
Was the wrong<br />
sample used<br />
NO<br />
Has the sample<br />
changed<br />
NO<br />
YES<br />
YES<br />
YES<br />
YES<br />
Enter the correct conversion<br />
factors in the data files.<br />
Enter the correct slope and<br />
offset up in the data files.<br />
Use correct sample.<br />
Obtain new sample.<br />
Re-standardize and<br />
check another sample.<br />
Figure 6-13 <strong>Troubleshooting</strong> Flow Chart 10<br />
230 Sensor <strong>Troubleshooting</strong><br />
3BUS 208 055 R1101
PROPRIETARY DATA: This document contains proprietary data of ABB Inc. No disclosure, distribution (electronic or otherwise),<br />
reproduction, or other means of dissemination may be made without written permission.<br />
11<br />
YES<br />
Is the <strong>Platform</strong><br />
in local<br />
Put gauge on sheet<br />
at the <strong>Platform</strong>.<br />
NO<br />
Is the <strong>Platform</strong> in scan<br />
or single point<br />
NO<br />
YES<br />
YES<br />
Is the <strong>Platform</strong> in<br />
single point<br />
Select on sheet and<br />
scan or single point.<br />
Let heads make one<br />
complete scan and<br />
try again.<br />
YES<br />
Look at PC (position complete)<br />
in PmmFrame0x->fddo<br />
(in:long mode).<br />
PC = 0<br />
YES<br />
YES<br />
PC = 1<br />
NO<br />
Troubleshoot <strong>Platform</strong><br />
positioning problem.<br />
Troubleshoot calibrate<br />
sample push button and<br />
setup problems.<br />
YES<br />
Look at smode in<br />
PmmFrame0x->fddo<br />
(in:long mode).<br />
Smode > 49<br />
NO<br />
Smode > 50<br />
Troubleshoot faulty sensor<br />
or put it to sleep.<br />
Figure 6-14 <strong>Troubleshooting</strong> Flow Chart 11<br />
3BUS 208 055 R1101<br />
Sensor <strong>Troubleshooting</strong><br />
231
PROPRIETARY DATA: This document contains proprietary data of ABB Inc. No disclosure, distribution (electronic or otherwise),<br />
reproduction, or other means of dissemination may be made without written permission.<br />
12<br />
Calibrate sample data is not reasonable<br />
Was the button<br />
not pressed<br />
long enough<br />
NO<br />
YES<br />
Press the push button for a<br />
minimum of 5 seconds.<br />
Is the compensation<br />
wrong<br />
NO<br />
YES<br />
Use the correct compensation.<br />
Are the conversion<br />
factors wrong<br />
NO<br />
Is the slope or<br />
offset wrong<br />
NO<br />
Was the wrong<br />
product code used<br />
NO<br />
Is the data<br />
repeatable<br />
YES<br />
YES<br />
YES<br />
YES<br />
YES<br />
Enter the correct conversion<br />
factors in the data files.<br />
Enter the correct slope and<br />
offset up in the data files.<br />
Use correct product code.<br />
Determine if unusual additives<br />
or conditions exist.<br />
Is the lab data<br />
repeatable<br />
YES<br />
Review calibration and correlation<br />
procedures.<br />
Figure 6-15 <strong>Troubleshooting</strong> Flow Chart 12<br />
232 Sensor <strong>Troubleshooting</strong><br />
3BUS 208 055 R1101
PROPRIETARY DATA: This document contains proprietary data of ABB Inc. No disclosure, distribution (electronic or otherwise),<br />
reproduction, or other means of dissemination may be made without written permission.<br />
The following alarms are determined in the sequence shown so when an alarm is<br />
encountered, each previous alarm condition has passed. Some judgement is needed<br />
to determine the probable cause of the error.<br />
13<br />
Sensor will not measure<br />
NO<br />
A/D failure other<br />
than standardize.<br />
Alarm 09<br />
YES<br />
Change the ECS board.<br />
NO<br />
Air gap IR gain which<br />
set R signal at mid A/D<br />
range is outside of limits.<br />
Alarm 08<br />
YES<br />
Check scale factors<br />
in IR sensor.<br />
NO<br />
Air gap IR gain less<br />
than 1 or greater<br />
than 31.<br />
Alarm 02<br />
Alarm 21<br />
NO<br />
NO<br />
YES<br />
YES<br />
Check for dust or oil on<br />
window. Check chiller<br />
for flow and temperature.<br />
Check that the StdzGain<br />
is within the<br />
StdzGainNormal + the<br />
StdzGainRange.<br />
Also check the<br />
StdzLowSignalLimit and<br />
the StdzHighSignalLimit.<br />
Check for moisture streaks and<br />
process upsets. Check for<br />
intermittent cable, ground noise<br />
stream in gap, or unusual<br />
ambient light source near the<br />
gap.<br />
Figure 6-16 <strong>Troubleshooting</strong> Flow Chart 13<br />
3BUS 208 055 R1101<br />
Sensor <strong>Troubleshooting</strong><br />
233
PROPRIETARY DATA: This document contains proprietary data of ABB Inc. No disclosure, distribution (electronic or otherwise),<br />
reproduction, or other means of dissemination may be made without written permission.<br />
14<br />
Scan average is not reasonable<br />
Has a clean standardize<br />
been performed recently<br />
NO<br />
YES<br />
Clean the window, then<br />
restandardize.<br />
Is the compensation<br />
wrong<br />
YES<br />
NO<br />
Use the correct compensation.<br />
Is the slope or<br />
offset wrong<br />
NO<br />
Was the wrong<br />
product code used<br />
YES<br />
Enter the correct slope and offset<br />
up in the data files.<br />
YES<br />
NO<br />
Is the data<br />
repeatable<br />
YES<br />
Is the lab data<br />
repeatable.<br />
NO<br />
NO<br />
Use the correct product code.<br />
Determine if unusual additives<br />
or conditions exist.<br />
YES<br />
Perform sample check. Review<br />
calibration and correlation<br />
procedures.<br />
Figure 6-17 <strong>Troubleshooting</strong> Flow Chart 14<br />
234 Sensor <strong>Troubleshooting</strong><br />
3BUS 208 055 R1101
PROPRIETARY DATA: This document contains proprietary data of ABB Inc. No disclosure, distribution (electronic or otherwise),<br />
reproduction, or other means of dissemination may be made without written permission.<br />
15<br />
Moisture profile is not reasonable<br />
Is IR gain change<br />
excessive<br />
NO<br />
YES<br />
Clean HighGainSignalLimit,<br />
LowGainSignalLimit, and the<br />
counter limits in the IRGModule.<br />
Check for moisture streaks or<br />
process upsets.<br />
Does moisture go<br />
to 0 or excessive<br />
NO<br />
YES<br />
Check for intermittent cabling.<br />
Is the profile of the<br />
compensation erratic<br />
YES<br />
NO<br />
Is the profile<br />
repeatable<br />
NO<br />
Troubleshoot sensor<br />
or compensation variable.<br />
YES<br />
Take dynamic samples for lab. Review<br />
calibration and correlation procedures.<br />
Check for stream, ambient<br />
light, and broke, in cross<br />
machine path.<br />
Figure 6-18 <strong>Troubleshooting</strong> Flow Chart 15<br />
3BUS 208 055 R1101<br />
Sensor <strong>Troubleshooting</strong><br />
235
PROPRIETARY DATA: This document contains proprietary data of ABB Inc. No disclosure, distribution (electronic or otherwise),<br />
reproduction, or other means of dissemination may be made without written permission.<br />
16<br />
Correlation is not reasonable<br />
Are long term standardize<br />
results stable<br />
NO<br />
YES<br />
Determine and correct<br />
source of instability.<br />
Are long term check<br />
sample results repeatable<br />
NO<br />
YES<br />
Determine and correct<br />
source of instability.<br />
Is the on-line<br />
measurement<br />
repeatable<br />
NO<br />
NO<br />
Review lab measurement<br />
and sampling procedures.<br />
Check for rewet too close to sensor,<br />
dirt buildup on window, oil from air<br />
wipe, stream or light in gap, voltage fluctuations,<br />
head alignment, process<br />
additives, insufficient cooling, operation<br />
at design limits.<br />
Figure 6-19 <strong>Troubleshooting</strong> Flow Chart 16<br />
236 Sensor <strong>Troubleshooting</strong><br />
3BUS 208 055 R1101
PROPRIETARY DATA: This document contains proprietary data of ABB Inc. No disclosure, distribution (electronic or otherwise),<br />
reproduction, or other means of dissemination may be made without written permission.<br />
Exercising the Gain Using Software Commands<br />
You can use either the Infrared Sensor Health Page Pulse Monitor or the inspect<br />
utility to set the gain.<br />
Using inspect<br />
Use the following procedures to set the gain with the inspect utility commands.<br />
To increment the gain one step<br />
()[IRGModule0x private$causeGainTo:1]<br />
To decrement the gain one step<br />
()[IRGModule0x private$causeGainTo:2]<br />
To set the gain to the mid-range<br />
()[IRGModule0x private$causeGainTo:3]<br />
Increasing or decreasing the signal to the amplifier in the head will then increase<br />
or decrease the pulse coming out of the head amplifier.<br />
If the output signal responds to the increase or decrease in the gain signal, you have<br />
integrity from the output of the ECS board to the sensor gain amplifier in the sensor<br />
head.<br />
Using the Health Page Pulse Monitor<br />
Access page 2 of the IR Health Page. Page two has a section called<br />
IRGAIN Select (+/-/=)<br />
Press the Tab key and use the Arrow keys to position the cursor over the data entry<br />
point for the IRGAIN Select variable.<br />
To increase the gain by one step, press +(cr).<br />
To decrease the gain by one step, press -(cr).<br />
To set the gain at the mid-range, press =(cr).<br />
Exercising the Reflection IR Flag<br />
Insert and remove the Reflection IR flag using the following inspect utility<br />
commands.<br />
To insert the flag:<br />
()[IRSensor01 private$insertReflector]<br />
To remove the flag:<br />
()[IRSensor01 private$removeReflector]<br />
Monitor the Absorption Moisture pulse on the IR Health Page Pulse Monitor before<br />
and after exercising the flag. An increase in voltage indicates the Reflection IR<br />
flag is in place. A decrease in voltage indicates the Reflection IR flag is not in<br />
place. If the flag does not respond, one of the following could be the cause:<br />
• The sensor is not functioning.<br />
• The ECS board is not functioning.<br />
• The software is not sending the signal.<br />
3BUS 208 055 R1101<br />
Sensor <strong>Troubleshooting</strong><br />
237
PROPRIETARY DATA: This document contains proprietary data of ABB Inc. No disclosure, distribution (electronic or otherwise),<br />
reproduction, or other means of dissemination may be made without written permission.<br />
Discontinuity Counter<br />
Each IR Sensor and its modules contain a discontinuity counter. This counter<br />
increments whenever a gap occurs in the stream of output data from the sensor or<br />
module. Setting the AVOS shell to run at a very high priority level (>100) may<br />
cause the discontinuities to occur. This parity level is controlled by the nice<br />
command, which should always be at 10 under normal operating conditions.<br />
The discontinuities counters may have a few counts occur during a reset, however,<br />
they should either remain constant from that point on or perhaps increment by one<br />
or two at the edge of sheet during scanning. If it goes up rapidly, then there is a loss<br />
of data occurring. These gaps would show up as invalid data in the profile. Before<br />
viewing the counters, make sure the AVOS parameter nice is set to 10. View the<br />
counters using the following inspect utility commands:<br />
I> IRSensor01->discontinuities<br />
I>0xModuleAddress->discontinuities<br />
Where: ModuleAddress is the address found by examining the myModules<br />
instance variable in IRSensor01<br />
Normally there are no message reports in the pe event log indicating that there are<br />
counts accummulating. If there is a suspicion that invalid data is occurring within<br />
the moisture profile, then the reporting function may be turned on by setting a flag.<br />
This will cause a warning to be logged in the pe utility whenever a discontinuity<br />
occurs. This warning indicates a difference in time between any two batches of<br />
moisture data signals. To set the enabling flag, proceed as follows:<br />
1. In the AVOS window, enter the following command:<br />
$$ mm log_discontinuity.s<br />
2. When the response showing the current status returns, enter a 1.<br />
3. To turn off the reporting, repeat step 1 and enter a 0.<br />
238 Sensor <strong>Troubleshooting</strong><br />
3BUS 208 055 R1101
PROPRIETARY DATA: This document contains proprietary data of ABB Inc. No disclosure, distribution (electronic or otherwise),<br />
reproduction, or other means of dissemination may be made without written permission.<br />
Ash Sensors (TLXR)<br />
Ash Sensor<br />
Has Sensor<br />
Verification<br />
Been Done<br />
NO<br />
Perform Sensor Verification.<br />
YES<br />
Does<br />
Operator Station<br />
Standardize<br />
Lamp Go<br />
Off<br />
NO<br />
Does<br />
Gauge<br />
Standardize<br />
Get Sensor Alarm Status<br />
YES<br />
Get Sensor<br />
Alarm Status.<br />
YES<br />
Is<br />
Data Valid<br />
During Scan<br />
NO<br />
Check For Invalid Scan Due To<br />
Normal Occurrences Such As:<br />
Air Profile Collection<br />
Sensor In Local<br />
Adjusting Scan Limits<br />
Perform One Complete Scan<br />
To Clear Errors<br />
YES<br />
Is<br />
Standardize Data<br />
Stable And<br />
Noise Free<br />
NO<br />
Verify Measurement Stability.<br />
YES<br />
Perform Sensor<br />
Verification.<br />
NO<br />
Check<br />
Samples OK<br />
(Ash And PPT).<br />
YES<br />
Calibrate<br />
Sample<br />
OK<br />
YES<br />
Verify sensor accuracy.<br />
NO<br />
Check For Invalid Calibrate Sample<br />
Data Due To Normal Occurrences<br />
Such As:<br />
Air Profile Collection<br />
Sensor In Local<br />
Adjusting Scan Limits<br />
Perform One Complete Scan<br />
To Clear Errors<br />
Get Sensor Alarm Status.<br />
Figure 6-20 Ash Sensor <strong>Troubleshooting</strong> Flow Chart<br />
3BUS 208 055 R1101<br />
Sensor <strong>Troubleshooting</strong><br />
239
PROPRIETARY DATA: This document contains proprietary data of ABB Inc. No disclosure, distribution (electronic or otherwise),<br />
reproduction, or other means of dissemination may be made without written permission.<br />
Refer to Table 6-7 for a summary of Standardize Lamp Failure possible causes and<br />
recommended action.<br />
Table 6-7 Possible Causes of Ash Standardize Light Not Going Off<br />
Symptom Possible Cause Recommended Action<br />
Standardize lamp<br />
does not go off<br />
<strong>Platform</strong> in Local<br />
Sheet Break<br />
Position Incomplete<br />
Defective Sensor<br />
Check the video alarm page for the message,<br />
<strong>Platform</strong> In Local. At the <strong>Platform</strong>, take the gauge<br />
out of local.<br />
Wait for the sheet to be up or override sheet break<br />
detector by jumpering or inserting the sheet break<br />
override flag.<br />
Check to see if position is complete for each<br />
<strong>Platform</strong> not in local by locating pc using the<br />
inspect utility. It can be found in the array<br />
instruction pmmFrame->fddo. If the pc=1, position<br />
is complete. If pc = 0, troubleshoot the <strong>Platform</strong>.<br />
Check the sensor mode for each <strong>Platform</strong> by<br />
locating smode using the inspect utility. It can be<br />
found in the array instruction pmmFrame->fddo.<br />
If smode = 01 or 02, check other <strong>Platform</strong>s.<br />
If smode = 01 or 02, (still trying to standardize), put<br />
faulty sensor to sleep.<br />
Ash Sensor Standardize Results<br />
In addition to the systems standardize report and the sensor correlation report,<br />
information may also be obtained by examining the stdResultsPending table within<br />
the ash object itself. The information available includes a problem list tree and the<br />
current standardize results.<br />
To see whether or not the <strong>Scanning</strong> <strong>Platform</strong> subsystem is currently operating with<br />
a good standardize, examine the stdzResults and stdzResultsPending instance<br />
variables using the inspect utility. If the 0x address pointers are qualified, then the<br />
subsystem has performed what it believes to be a good standardize. If the Host<br />
disagrees, then there is a problem in the transferring of the standardize data from<br />
the <strong>Scanning</strong> <strong>Platform</strong> to the Host.<br />
If the address pointers are different, then the stdzResultsPending report must be<br />
examined to see what actually failed. This can be done by first putting the inspect<br />
utility in the :long mode and then typing in the entire 0x display given. The resulting<br />
display will contain the address pointer to the problem list string, and the results of<br />
the last attempted standardize. The information which should be examined is the<br />
following:<br />
tempCompFlag:<br />
Indicates if temperature compensation was active during the standardize.<br />
A 1 is On, 0 is Off.<br />
240 Sensor <strong>Troubleshooting</strong><br />
3BUS 208 055 R1101
PROPRIETARY DATA: This document contains proprietary data of ABB Inc. No disclosure, distribution (electronic or otherwise),<br />
reproduction, or other means of dissemination may be made without written permission.<br />
zeroScaleInput:<br />
The signal with the electrometer clamped should be about 0 V.<br />
zeroScaleInputSigma:<br />
This is the statistical noise calculation of the zero signal. Should be less than 10 -5<br />
Volts.<br />
fullScaleTempRef:<br />
This is a two-variable array of the temperature compensation applied during<br />
standardize giving the results for both flag in and flag out. If there is no temperature<br />
compensation, they will be 0.<br />
fullScaleTempSigma:<br />
This is a two variable array of the temperature compensation statistical noise during<br />
standardize giving the results for both flag out and flag in. If there is no temperature<br />
compensation, they will be 0.<br />
logVoltageRange:<br />
This is a two variable array giving the computed log value of the voltage range for<br />
the flag out and the flag in.<br />
voltageRange:<br />
This is a two variable array giving the maximum electrometer signal for the flag<br />
out and the flag in.<br />
voltageSigma:<br />
This is a two variable array giving the statistical noise of the maximum voltage for<br />
the flag in and the flag out. It should be less than 10 -5 Volts.<br />
The problemList data can be examined by sending a message in the inspect mode<br />
to the pmmSensor object as follows:<br />
()[pmmFrame01 stdzErrors]<br />
3BUS 208 055 R1101<br />
Sensor <strong>Troubleshooting</strong><br />
241
PROPRIETARY DATA: This document contains proprietary data of ABB Inc. No disclosure, distribution (electronic or otherwise),<br />
reproduction, or other means of dissemination may be made without written permission.<br />
Ash Sensor Hardware Diagnostics<br />
The inspect utility will be used to exercise the Electrometer Clamp and the Shutter<br />
providing a test of hardware performance on-line. These tests utilize the <strong>Scanning</strong><br />
<strong>Platform</strong> software to initiate several combinations of clamp and shutter operation.<br />
1. Place the <strong>Scanning</strong> <strong>Platform</strong> console window for the Ash sensor in question,<br />
into the inspect utility mode.<br />
2. Monitor the electrometer output voltage.<br />
3. Place the Ash sensor in the off-sheet position from the operator station.<br />
The initial condition will be Electrometer Clamped and Shutter Closed. Use the<br />
commands given below to execute the conditions shown in the matrix of Table 6-8.<br />
To Open or Close Shutter<br />
()[ashSensor01 $private$openShutter]<br />
()[ashSensor01 $private$closeShutter]<br />
Table 6-8 Electrometer Responses to Shutter/Clamp Commands<br />
Command Given Clamp Unclamp<br />
Shutter Open 0 mv ±±± 10 mv 7.2 to 9.2 VDC<br />
Shutter Closed 0 mv ±
PROPRIETARY DATA: This document contains proprietary data of ABB Inc. No disclosure, distribution (electronic or otherwise),<br />
reproduction, or other means of dissemination may be made without written permission.<br />
Table 6-9 Ash Electrometer Hardware Diagnostics<br />
Condition Possible Cause Action To Take<br />
Never Clamped Bad electrometer Replace electrometer.<br />
Always Clamped<br />
Watch source open/close lamps, listen<br />
for shutter or check shutter with a<br />
Geiger counter. If shutter is inoperative,<br />
complete the following:<br />
1. Check circuit breaker.<br />
2. Check point-to-point<br />
wiring.<br />
3. Check interlocks.<br />
Shutter Always Open<br />
Loss of Signal<br />
1. Poor wiring<br />
2. Bad power supply<br />
3. Bad electrometer<br />
If shutter is inoperative, complete the<br />
following:<br />
1. Check power supplies.<br />
2. Check high voltage<br />
supply.<br />
3. Replace electrometer.<br />
Watch source open/close lamps, listen<br />
for shutter or check shutter with a<br />
Geiger counter. If shutter is inoperative,<br />
complete the following:<br />
1. Check circuit breaker.<br />
2. Check point-to-point<br />
wiring.<br />
3. Check interlocks.<br />
If shutter is inoperative, complete the<br />
following:<br />
1. Check power supplies.<br />
2. Check high voltage<br />
supply.<br />
1. Check point-to-point the<br />
wiring.<br />
2. Check power supplies:<br />
• Check 900 Volts power<br />
supply at the output test<br />
points.<br />
• Check +/- 15 Volts supply.<br />
• Check voltage in head.<br />
3BUS 208 055 R1101<br />
Sensor <strong>Troubleshooting</strong><br />
243
PROPRIETARY DATA: This document contains proprietary data of ABB Inc. No disclosure, distribution (electronic or otherwise),<br />
reproduction, or other means of dissemination may be made without written permission.<br />
Ash Correlation Problems<br />
Use the following as an aid in troubleshooting for correlation problems.<br />
1. Multiple tuning required on product code basis<br />
The Ash HV or the X-Ray tube is suspected to be incorrectly set and<br />
should be properly set to remove ash compensation sensitivity.<br />
2. Calibration shifts from off-sheet to on-sheet positions over a period<br />
of minutes:<br />
This is Frequently, temperature related. The repair method is to assure that the<br />
sensor temperature is above the highest on-sheet temperature and if this is not<br />
sufficient, add temperature-controlled heated air wipes to control the air gap<br />
temperature to a constant value. If this is not possible, turn On air temperature<br />
compensation from the basis weight into the ash process. The previous listing<br />
order is the presently understood priority rating to solving temperature<br />
problems with ashgauges. The maximum ambient temperature should be less<br />
than 85°C for an Ash gauge from a component survivability viewpoint.<br />
3. Measurements shifts and anode HV or current shifts observed:<br />
Sensor temperatures should be higher than the highest temperature<br />
on-sheet. The X-Ray tube HV supply voltage must be constant to<br />
+/- 2 millivolts of the monitor voltage, which will occur with a good<br />
supply if it is held at a constant temperature.<br />
4. Tuning required for some products but not for others:<br />
Product composition may be suspected for an ingredient for which the<br />
gauge is not calibrated. For 2C operation, if a clay/Ti0 2 gauge is<br />
on-site and an occasional product which has chalk in it is run, the Ash<br />
gauge will show large errors (a +1.5% Ash per +1% chalk addition),<br />
and so on for other high atomic number Ash additives.<br />
5. Ash gauge measures check samples but does not measure customer<br />
product without large tuning changes:<br />
The laboratory ashing procedure must correspond to that given in the<br />
calibration report or be proven to be equivalent in results. Some Ash<br />
materials break down into gases at improperly high ashing<br />
temperatures.<br />
6. Signal is reading lower or higher than normal:<br />
The measurement flag may not be working properly. If the value is<br />
reading 30% lower when the flag is not in the measurement beam, then<br />
the flag is probably stuck and is in the beam. If it is reading higher<br />
than normal with the flag in the beam, then the flag is probably stuck<br />
open and is not in the beam.<br />
See Figure 6-21 for troubleshooting the correlation problems for Ash sensor.<br />
244 Sensor <strong>Troubleshooting</strong><br />
3BUS 208 055 R1101
PROPRIETARY DATA: This document contains proprietary data of ABB Inc. No disclosure, distribution (electronic or otherwise),<br />
reproduction, or other means of dissemination may be made without written permission.<br />
1. Measure MYLAR check<br />
samples.<br />
N<br />
2. Do Indicated PPT values agrees<br />
with calibration report<br />
N<br />
Adjust anode High Voltage.<br />
N<br />
Y<br />
Y<br />
3. Do indicated Basis Weight<br />
Mesurement values agree<br />
with calibration report<br />
N<br />
Change calibration constants to agree<br />
with calibration report.<br />
N<br />
4. Do indicate % ash values<br />
agree with calibration report<br />
Y<br />
N<br />
Y<br />
Change calibration constants to agree<br />
with calibration report.<br />
N<br />
See a Regional<br />
Measurement<br />
Specialist.<br />
Y<br />
Y<br />
5. Check the process for<br />
composition stability and<br />
check if sensor temperature<br />
greater than on-sheet<br />
temperature.<br />
N<br />
Adjust sensor temperature to customer<br />
composition.<br />
Y<br />
N<br />
Y<br />
6. Examine profile with check<br />
sample for <strong>Platform</strong> alignment<br />
check.<br />
N<br />
Explore results with Measurement<br />
Specialist.<br />
Review the Check Sample<br />
Readings<br />
Figure 6-21 Ash Correlation <strong>Troubleshooting</strong> Flow Chart<br />
3BUS 208 055 R1101<br />
Sensor <strong>Troubleshooting</strong><br />
245
PROPRIETARY DATA: This document contains proprietary data of ABB Inc. No disclosure, distribution (electronic or otherwise),<br />
reproduction, or other means of dissemination may be made without written permission.<br />
Air Bearing, Contacting, and Non-Contacting<br />
Caliper Sensors<br />
These troubleshooting aids and charts can be used to isolate Caliper sensor<br />
malfunctions. Caliper sensor malfunctions are usually indicated by alarm messages,<br />
by observing the standardize sequence and its resultant report, or noting changes in<br />
performance. When troubleshooting, refer to the Caliper Functional Drawings.<br />
<strong>Troubleshooting</strong> the Caliper sensor and measurement centers around interpreting<br />
the various alarm codes and exercising the mechanical operations of the sensor.<br />
Exercising the Caliper Sensor<br />
The caliper head can be opened or closed by using the following inspect utility<br />
message command. The vacuum and pressure valves can be turned On or Off by<br />
using the same inspect utility message command.<br />
I> ()[caliperSensor0x private$setupCaliperHardware:n pressure:n vacuum:n]<br />
Where n is:<br />
Caliper<br />
Hardware Pressure Vacuum<br />
0 open head On On<br />
1 closed head Off Off<br />
246 Sensor <strong>Troubleshooting</strong><br />
3BUS 208 055 R1101
PROPRIETARY DATA: This document contains proprietary data of ABB Inc. No disclosure, distribution (electronic or otherwise),<br />
reproduction, or other means of dissemination may be made without written permission.<br />
<strong>Troubleshooting</strong> Alarms<br />
Code Alarm Message<br />
Text<br />
5010 Proximitor Signal<br />
Failure<br />
5011 Pressure Signal<br />
Failure<br />
5012 Vacuum Signal<br />
Failure<br />
5030 Caliper Proximitor<br />
Output Fail: STDZ<br />
5031 Caliper Electronic<br />
Noise Fail: STDZ<br />
5032 Caliper Zero (Sensor<br />
Zero) Fail: STDZ<br />
5033 Caliper Pressure Fail:<br />
STDZ<br />
5034 Bearing Height Fail:<br />
STDZ<br />
5035 Caliper Air Bearing<br />
Noise Fail: STDZ<br />
5036 Caliper Vacuum Fail:<br />
STDZ<br />
5039 Caliper Lift-Off Fail:<br />
STDZ<br />
5040 Check Proximitor<br />
Output<br />
Table 6-10 <strong>Troubleshooting</strong> Alarms and Codes<br />
Probable Cause(s)<br />
- Bad Analog Input Circuit<br />
- Proximeter Assembly Defective<br />
- Bad Analog Input Circuit<br />
- Pressure Transducer Defective<br />
- Bad Analog Input Circuit<br />
- Vacuum Transducer Defective<br />
- Proximeter Assembly Defective<br />
- FTI Power Supply Bad<br />
- Temperature Compensation<br />
- Probe Drift<br />
- Unstable Proximeter<br />
- Probe Unstable<br />
- FTI Power Supply<br />
- Target not Making Contact with<br />
The Measure Head<br />
- Low Pressure to Top Head<br />
- Defective Transducer<br />
- Faulty Wiring<br />
- Defective Sensor Cap Assembly<br />
- Defective Press Regulator<br />
- Wobbly Sensor Cap<br />
- Dirty Sensor Cap Assembly<br />
Paper in Gap<br />
- Head Closed at STDZ<br />
- Defective Proximeter<br />
- Proximeter Assembly Defective<br />
- FTI Power Supply Bad<br />
(Continued on next page)<br />
Corrective Action(s)<br />
Check the analog circuit paths.<br />
Check the ABC4 PWA and the<br />
AI32 PWA.<br />
Replace Proximeter.<br />
Replace the Pressure<br />
Transducer.<br />
Replace the Vacuum<br />
Transducer.<br />
Replace the Proximeter.<br />
Replace the FTI.<br />
Replace the Proximeter Probe.<br />
Replace the FTI.<br />
Check the Lift-Off Assembly<br />
Operation.<br />
Restore Pressure.<br />
Replace the Transducer.<br />
Replace the Sensor Cap.<br />
Replace the Sensor Cap.<br />
Clean the Sensor Cap.<br />
Remove paper from the gap.<br />
Check the Proximeter Output.<br />
Replace the Proximeter.<br />
Check Lift-Off Mechanism.<br />
Replace the Proximeter.<br />
Replace the FTI.<br />
3BUS 208 055 R1101<br />
Sensor <strong>Troubleshooting</strong><br />
247
PROPRIETARY DATA: This document contains proprietary data of ABB Inc. No disclosure, distribution (electronic or otherwise),<br />
reproduction, or other means of dissemination may be made without written permission.<br />
Code Alarm Message<br />
Text<br />
5041 Check Electronic<br />
Noise<br />
Table 6-10 (Continued)<br />
Probable Cause(s)<br />
- Noisy Proximeter<br />
- Poor Grounding<br />
- Probe Drift<br />
5042 Clean Caliper Head Air Bearing:<br />
- Dirt Buildup on Contact Head<br />
- Dirt Buildup on Filtering Head<br />
Contacting:<br />
- Dirt Buildup on Either Contacting<br />
Head<br />
5043 Check Caliper<br />
Pressure<br />
5044 Check Air Bearing<br />
Height<br />
5045 Check Air Bearing<br />
Noise<br />
5046 Check Caliper<br />
Vacuum<br />
(Continued on next page)<br />
Corrective Action(s)<br />
Replace the Proximeter.<br />
Check System Grounds<br />
Clean the Head.<br />
Perform a Clean Standardize.<br />
- Air Pressure Drifting Check the Main Air Supply.<br />
Check the Regulator Output.<br />
- Dirty Target Clean the Target.<br />
Air Bearing:<br />
- Floating Head Is Dirty<br />
Contacting:<br />
- Low Air Pressure to Bottom Head<br />
- Analog Missing<br />
- Low Air Pressure to Bottom Head<br />
- Analog Missing<br />
5047 None - Head has been off-sheet for a period of<br />
time and allowed to cool down<br />
5050 Caliper Proximeter<br />
Output Fail: Measure<br />
5053 Caliper Vacuum Fail:<br />
Measure<br />
5056 Caliper Vacuum Fail:<br />
Measure<br />
5057 Product Code<br />
Slope < 0.9 Or > 1.1<br />
5058 Air Profile<br />
Compensation Too<br />
Large: Measure<br />
- Proximeter Assembly Defective<br />
- FTI Defective<br />
Clean the Floating Head.<br />
Restore Pressure<br />
Check the wiring.<br />
Gauge should automatically<br />
standardize and clear alarm.<br />
Replace the Proximeter<br />
Assembly.<br />
Replace FTI.<br />
- Air Pressure Too Low or High Restore Air Pressure.<br />
- Nothing in Gap<br />
- Pressure to Low<br />
Scan Process or Sample.<br />
Restore Pressure.<br />
- Wrong Entry for Slope in PCF Correct Entry.<br />
- <strong>Platform</strong> Badly Misaligned<br />
- Paper in Gap<br />
Realign the <strong>Platform</strong>.<br />
Remove the paper.<br />
248 Sensor <strong>Troubleshooting</strong><br />
3BUS 208 055 R1101
PROPRIETARY DATA: This document contains proprietary data of ABB Inc. No disclosure, distribution (electronic or otherwise),<br />
reproduction, or other means of dissemination may be made without written permission.<br />
Code Alarm Message<br />
Text<br />
5059 Caliper Lift-Off Fail:<br />
Measure<br />
5058 Air Profile<br />
Compensation Too<br />
Large: Measure<br />
5059 Caliper Lift-Off Fail:<br />
Measure<br />
5078 Standardize Not<br />
Finished<br />
Table 6-10 (Continued)<br />
Probable Cause(s)<br />
- Proximeter Output Out of Range.<br />
- Head Closed<br />
- <strong>Platform</strong> Badly Misaligned<br />
- Paper in Gap<br />
- Proximeter Output Out of Range<br />
- Head Closed<br />
Corrective Action(s)<br />
Check the Proximeter Output.<br />
Repair Lift-Off.<br />
Realign the <strong>Platform</strong>.<br />
Remove the paper.<br />
Check the Proximeter Output.<br />
Repair Lift-Off<br />
- Standardize Sequence Interrupted Repeat the Standardize<br />
procedure.<br />
Alarm Code Classification<br />
The Alarm Codes can be classified into four general categories. Refer to<br />
Table 6-11 for that classification.<br />
Table 6-11 Alarm Code Classification<br />
Alarm Codes (Last two digits only)<br />
Classification<br />
10, 11, 12 Analog Input Alarms<br />
30, 31, 32, 33, 34, 35, 36, 37, 38, 39 Standardize Failure Alarms<br />
40, 41, 42, 43, 44, 45, 46, 47 Maintenance Alarms:<br />
These represent a warning of<br />
potential problems.<br />
50, 53, 56, 57, 58, 59, 78 Failure Alarms in Measure Mode<br />
To view these alarms, access the Health Page Report at the Service Workstation or<br />
the alarm report at the Host.<br />
• In the pe report, the full alarm number and mnemonic are displayed.<br />
• In the Health Page alarm overlay, only the mnemonic is displayed.<br />
• At the Host, only the last two digits of the alarm code are displayed.<br />
3BUS 208 055 R1101<br />
Sensor <strong>Troubleshooting</strong><br />
249
PROPRIETARY DATA: This document contains proprietary data of ABB Inc. No disclosure, distribution (electronic or otherwise),<br />
reproduction, or other means of dissemination may be made without written permission.<br />
Sensor Validity Codes<br />
Caliper sensor validity codes can be located by printing out the contents of the<br />
outputSignal instance variable. While in the inspect utility, obtain the address of<br />
the outputSignal. When the 0x address is typed on the console, the resulting<br />
printout will include, at the end, a collection of data blocks. Each block is made up<br />
of five entries which are the results of processing each data sample in the<br />
measurement. The entries are described in Table 6-12.<br />
Table 6-12 Definitions of Data Found in outPutSignal Structure<br />
Type Name Description<br />
double (value) This is the value of the sheet property<br />
being measured.<br />
double (cd) This is the cross direction location at<br />
which the property was measured.<br />
double (md) This is the machine direction location<br />
at which the property was measured<br />
(Not Used).<br />
short (invalid) This is the validity code for this sample.<br />
long (synch) This is the synch code (time stamp) for<br />
this sample.<br />
Table 6-13 will help you interpret the validity code.<br />
Table 6-13 Definitions of outPutSignal Validity Codes<br />
Code<br />
Meaning<br />
1 Invalid driver data<br />
2 No initial standardize<br />
8 Cross direction unsynchronized<br />
10 Cross direction position invalid<br />
20 Machine direction position invalid<br />
80 Measuring air profile<br />
100 Sensor standardizing<br />
200 Sensor in sample check mode<br />
400 Unsynchronized sensor data<br />
1000 Invalid sensor data<br />
2000 Untuned sensor data<br />
4000 Sensor not measuring<br />
250 Sensor <strong>Troubleshooting</strong><br />
3BUS 208 055 R1101
PROPRIETARY DATA: This document contains proprietary data of ABB Inc. No disclosure, distribution (electronic or otherwise),<br />
reproduction, or other means of dissemination may be made without written permission.<br />
A<br />
Appendix A:<br />
Quick Reference Guide<br />
This chapter contains the following major sections:<br />
Section ...............................................................................................Page<br />
<strong>Scanning</strong> <strong>Platform</strong> Utilities ............................................................................ 252<br />
Utility Commands .......................................................................................... 253<br />
Performing a gstore ........................................................................................ 254<br />
Object Inspector ............................................................................................. 255<br />
Function Keys ................................................................................................ 259<br />
DESQview Operations ................................................................................... 260<br />
Off-Line Debug .............................................................................................. 263<br />
Inspect Messages ........................................................................................... 264<br />
Application Tools ........................................................................................... 265<br />
3BUS 208 055 R1101<br />
251
PROPRIETARY DATA: This document contains proprietary data of ABB Inc. No disclosure, distribution (electronic or otherwise),<br />
reproduction, or other means of dissemination may be made without written permission.<br />
<strong>Scanning</strong> <strong>Platform</strong> Utilities<br />
Line Prompts<br />
$$ - Primary line prompt, AVOS Shell<br />
$! - Secondary line prompt, AVOS Shell<br />
I> - Object Inspector prompt<br />
: - Editor Prompt<br />
Special Functions<br />
If the system prints “abnormal termination of utility,” then type:<br />
shift, Ctrl, |<br />
or<br />
shift, Ctrl, - (European keyboards)<br />
If the system shows the $! prompt, then you are in the sub-shell. You can exit to<br />
the sub-shell while in the inspect utility if you type::!<br />
Type: exit (cr) to return to the inspect utility (I>)<br />
Utility Command Response to a File<br />
command > /pathname/filename - creates a file overwriting any<br />
existing file of the same name<br />
command >> /pathname/filename - concatenates to existing file of the<br />
same name<br />
252 3BUS 208 055 R1101
PROPRIETARY DATA: This document contains proprietary data of ABB Inc. No disclosure, distribution (electronic or otherwise),<br />
reproduction, or other means of dissemination may be made without written permission.<br />
Utility Commands<br />
File Commands<br />
$$cat /pathname/filename - Concatenate and print files<br />
$$more /pathname/filename - Display paged file<br />
$$rm /pathname/filename - Remove file<br />
$$cp /pathname/filename - Copy file<br />
$$mv /pathname/filename - Move file<br />
Maintenance and Debugging<br />
$$derr - Display error history<br />
$$dfree - Display memory free space<br />
$$dobj - Display object list<br />
$$dproc - Display processor<br />
$$droot - Display root directory<br />
$$df /bram1 - Free space check<br />
$$fsck /bram1 - File system consistencies check and<br />
interactive repair<br />
$$date 11-21-91-1991 11:10 - Enter current date and time<br />
$$df /bram1 - List free space<br />
3BUS 208 055 R1101<br />
253
PROPRIETARY DATA: This document contains proprietary data of ABB Inc. No disclosure, distribution (electronic or otherwise),<br />
reproduction, or other means of dissemination may be made without written permission.<br />
Performing a gstore<br />
$$gstore (cr)<br />
Type: 1 To save all scanner, servo, and sensor setup data to the frame.ini<br />
configuration file.<br />
Type: 2 To save changes made to the fhi01 object; i.e., Frame Control Panel<br />
changes.<br />
Type: 3 To save all changes made to the I/O portion of the system to the<br />
io.ini file. This includes digital invert masks, analog temperature<br />
limits, and such.<br />
Type: 4 To save all changes made in the host interface objects to the<br />
pmm.ini configuration file.<br />
Type: 5 To save customer site identification data used on the Health Pages<br />
to the appl.ini configuration file.<br />
254 3BUS 208 055 R1101
PROPRIETARY DATA: This document contains proprietary data of ABB Inc. No disclosure, distribution (electronic or otherwise),<br />
reproduction, or other means of dissemination may be made without written permission.<br />
Object Inspector<br />
$$inspect<br />
I>:h - Help prints a list of inspector commands<br />
I>:glob(al) - Print a global list of object names<br />
I>:pa off - pa(ge) off<br />
I>:pa on - pa(ge) on<br />
Typing a q, while in pa(ge) on, when<br />
displaying an object will cause the return to the I><br />
I>:a L abbrev - To set up a single keystroke abbreviation to substitute for<br />
a repeated command string to be used within the current<br />
use of the inspect utility. This abbreviation is not saved<br />
when inspect is exited.<br />
I>:a - To display currently active and available abbreviations<br />
I>:dec - To display integer values in decimal<br />
I>:hex - To display integer values in hexadecimal<br />
I>:long - To display objects in their expanded mode showing the<br />
contents of embedded arrays and structures<br />
I>:short - To display objects with arrays and structures not expanded.<br />
This is the default mode.<br />
I>:out [path] - To route all inspect responses (except from messages) to<br />
a named file.<br />
I>:pa n - To define how many (n) lines are to be displayed when<br />
paging is turned on.<br />
Display Object<br />
I>objectName<br />
I>0xaddress<br />
If the system responds with a 0x address that is an (id):<br />
Type (space bar) (cr) to display the variable data list.<br />
Note:<br />
The ~ key character has been reassigned on European keyboards.<br />
You may have to experiment with the keys until you get the right one.<br />
3BUS 208 055 R1101<br />
255
PROPRIETARY DATA: This document contains proprietary data of ABB Inc. No disclosure, distribution (electronic or otherwise),<br />
reproduction, or other means of dissemination may be made without written permission.<br />
Modify Object<br />
I>objectName->variableName=value<br />
I>0xaddress->variableName=value<br />
I>0xaddress->NDXVAR[X]->V1=value<br />
X = variable number<br />
I>:pm objectName - print method; lists all the methods an object can<br />
execute via the message command.<br />
I>:! - go to sub-shell for utility operations. Type exit<br />
exit (cr) at $! prompt, will return to I>.<br />
I>. - Repeat the last Inspect instruction.<br />
I>:q - quit, c-files resident<br />
256 3BUS 208 055 R1101
PROPRIETARY DATA: This document contains proprietary data of ABB Inc. No disclosure, distribution (electronic or otherwise),<br />
reproduction, or other means of dissemination may be made without written permission.<br />
Special Characters<br />
’ - Literal string<br />
\ - Delimiter<br />
: - Delimiter between arguments<br />
CTRL BREAK - Terminate command<br />
CTRL C - Terminate command<br />
CTRL U - Delete line<br />
If the system prints the “entering migration mode” message type:<br />
shift, Ctrl, |<br />
or<br />
shift, Ctrl, - (European keyboards)<br />
Type to restore the AVOS prompt.<br />
If the system shows the $! prompt, you are in the sub-shell. Typing :! while in the<br />
inspect utility causes this. Type exit (cr) to return to I> prompt.<br />
Inspect Messages<br />
Command Format<br />
I>(format)[objectName command:argument] (cr)<br />
Format determines the presentation of the response to the message. If left empty,<br />
the default is hex.<br />
Format<br />
char<br />
int<br />
short<br />
long<br />
Double<br />
DDB<br />
bool<br />
id<br />
hid<br />
objectName<br />
command<br />
argument<br />
Description<br />
A one byte character string using typographic symbols such as<br />
A, &, and +.<br />
A signed integer number taking two bytes.<br />
A signed integer number taking two bytes.<br />
A signed integer number taking four bytes.<br />
A double precision (eight bytes) floating point number.<br />
A Double Decimal Byte format used in the PPM emulator.<br />
Used to designate a Boolean logic function. It can either be a<br />
long or a char.<br />
Identifies an object ID address. It is a long size.<br />
The same as an ID but not part of the initialization activity at<br />
startup.<br />
Select from the names printed on the global list.<br />
Selected from the list produced by :pm (print method).<br />
Arguments are used to pass information to an object.<br />
3BUS 208 055 R1101<br />
257
PROPRIETARY DATA: This document contains proprietary data of ABB Inc. No disclosure, distribution (electronic or otherwise),<br />
reproduction, or other means of dissemination may be made without written permission.<br />
Examples:<br />
I>()[pmmFrame01 stdzErrors] (cr)<br />
I>()[betaSensor01 stdzFor:0 mode:0] (cr)<br />
mode:0 = dirty standardize<br />
mode:1 = clean standardize<br />
Using the Editor<br />
Enter Editor<br />
$$ed /pathname/file.name<br />
Load the editor and read file contents to the editor buffer.<br />
: Editor Prompt.<br />
Use editor commands to modify a file.<br />
Editor Commands<br />
a - append<br />
c - change<br />
d - delete<br />
i - insert<br />
p - print<br />
q - quit text editor<br />
r - read<br />
u - undo<br />
w - write file to ram disk<br />
s - substitute<br />
/ - search delimiter<br />
. - terminate for a, c, i<br />
Editor Example<br />
: r /ss01/clm/startup Read startup into the editor buffer.<br />
: 1,$p Print the contents of the buffer.<br />
: 35s/19200/9600 Change the value 19200 on line 35 to 9600<br />
and print the contents of the buffer to verify the<br />
change.<br />
: w /ss01/clm/startup Write startup file back to ram disk.<br />
258 3BUS 208 055 R1101
PROPRIETARY DATA: This document contains proprietary data of ABB Inc. No disclosure, distribution (electronic or otherwise),<br />
reproduction, or other means of dissemination may be made without written permission.<br />
Function Keys<br />
F1 - Help Menu<br />
F2 - Turn on Print Logging<br />
F3 - Turn on Disk Logging<br />
SHIFT F2 - Turn off Print Logging<br />
SHIFT F3 - Turn off Disk Logging<br />
F4 - Change or Display Configuration<br />
F5 - Terminate task & close ACE window<br />
F6 - Run GONZO (default is +9200 baud)<br />
F7 - Run Health Page Software<br />
ESC - Exit this help screen<br />
CTRL-SHIFT-DEL - Abort, the equivalent of the three finger<br />
crash<br />
CTRL-ALT-DEL - Close active window (but not port)<br />
SHIFT 1 - Close Port, used to reopen a window after Ctrl,<br />
Alt, Del<br />
In the event of lost Serial Communication to the Service Workstation, try:<br />
Ctrl c<br />
Ctrl u<br />
Ctrl Break<br />
Close window and reopen.<br />
Close DESQview and reactivate.<br />
Restart PC.<br />
Restart SP.<br />
3BUS 208 055 R1101<br />
259
PROPRIETARY DATA: This document contains proprietary data of ABB Inc. No disclosure, distribution (electronic or otherwise),<br />
reproduction, or other means of dissemination may be made without written permission.<br />
DESQview Operations<br />
ALT<br />
Select Main Menu<br />
o<br />
Open Window<br />
s<br />
Switch Window<br />
c<br />
Close Window<br />
r<br />
Rearrange Window<br />
z<br />
Zoom<br />
m<br />
Mark, Transfer, Scissors<br />
Open Window<br />
<strong>Scanning</strong> <strong>Platform</strong> CONSOLE W1<br />
DOS (128K)<br />
D1<br />
REMOTE ACCESS MGR RA<br />
Close Window<br />
Are you sure<br />
Yes<br />
Y<br />
No<br />
N<br />
Switch Window<br />
DOS Window<br />
D1<br />
Health Pages Terminal W1<br />
Remote Access Manager W4<br />
Rearrange<br />
Move<br />
M<br />
Resize<br />
R<br />
Position 123456789<br />
Scroll<br />
S<br />
Freeze<br />
F<br />
Hide<br />
H<br />
Put Aside<br />
(not shown on this menu)<br />
Change Colors<br />
(not shown on this menu)<br />
Video Options<br />
(not shown on this menu)<br />
260 3BUS 208 055 R1101
PROPRIETARY DATA: This document contains proprietary data of ABB Inc. No disclosure, distribution (electronic or otherwise),<br />
reproduction, or other means of dissemination may be made without written permission.<br />
Move<br />
Done<br />
(cr)<br />
Move<br />
Resize<br />
Resize<br />
Done<br />
Move<br />
Resize<br />
(cr)<br />
Creating a Hot Key<br />
DO NOT select any key already used by ACE or DESQview. Ctrl s and Ctrl q are<br />
used by Unix to control scrolling. Do not use Ctrl c or Ctrl Break.<br />
Hot Keys are only active in the window in which they are created.<br />
1. Position the cursor in the window, where the script is to be activated.<br />
2. Select the LEARN menu.<br />
Hold shift, tap Alt.<br />
The console will display the LEARN Menu.<br />
3. Select Start Script (cr).<br />
4. The console will respond with Press The Key You Want To Redefine. DO<br />
NOT select any key previously used by console function. Use a combination<br />
of Shift, Alt, Ctrl and a Function Key or letter.<br />
Example:<br />
CTRL, f12<br />
5. The console will display the key selected and ask for a script name. Type a<br />
script name that means something to you, preferably the same as the script.<br />
3BUS 208 055 R1101<br />
261
PROPRIETARY DATA: This document contains proprietary data of ABB Inc. No disclosure, distribution (electronic or otherwise),<br />
reproduction, or other means of dissemination may be made without written permission.<br />
6. Type the script.<br />
Example:<br />
scanner01-><br />
CAUTION<br />
Do not type a carriage return (cr). This will become part<br />
of the script. You can put the Service Workstation in an<br />
endless loop, if you do.<br />
7. Select the LEARN menu.<br />
Hold shift, tap Alt.<br />
The console will display the LEARN Menu.<br />
8. Select Finish Script (cr).<br />
9. Try the script, by pressing the new hot key, to see if it works.<br />
10. Select the LEARN menu.<br />
Hold shift, tap Alt.<br />
The console will display the LEARN Menu.<br />
11. Select Save Script (cr).<br />
Note:<br />
The S(ave) option is only present when an unsaved script exists in<br />
the system.<br />
Display Scripts<br />
1. Select the LEARN menu.<br />
Hold shift, tap Alt.<br />
The console will display the LEARN Menu.<br />
2. Select Display Script (cr).<br />
The console will display a list of scripts already in the system.<br />
3. Press Shift, PrtSc to print a copy of the scripts.<br />
262 3BUS 208 055 R1101
PROPRIETARY DATA: This document contains proprietary data of ABB Inc. No disclosure, distribution (electronic or otherwise),<br />
reproduction, or other means of dissemination may be made without written permission.<br />
Off-Line Debug<br />
Type e to print the fault condition message.<br />
Type x to print the exception message log.<br />
Type d 1 100 to display the first 100 memory locations.<br />
Offline debug only appears whens the MPRC start mode switch is in the down<br />
position and a reset has been executed. The purpose is to provide access to error<br />
conditions which occurred after the last restart, but the cause(s) of which became<br />
inaccessible due to a system lock up. In some cases an offline debug restart using<br />
the e, x, and d commands used, may uncover the cause.<br />
The g command will continue the startup process after the diagnostic data has been<br />
collected.<br />
3BUS 208 055 R1101<br />
263
PROPRIETARY DATA: This document contains proprietary data of ABB Inc. No disclosure, distribution (electronic or otherwise),<br />
reproduction, or other means of dissemination may be made without written permission.<br />
Inspect Messages<br />
Prints the sensor configuration for the indicated scanner, showing real sensors,<br />
dependent sensors, and sensors which are asleep.<br />
I>()[scanner01 print]<br />
Prints the last standardize condition for each sensor on the scanner. For sensors<br />
which have failed standardize, it gives all the failed parameters. For individual<br />
sensors, use the pmm name, such as pmmBeta01.<br />
I>()[pmmFrame01 stdzErrors]<br />
Prints out the current I/O Configuration.<br />
I>()[ucHardware printOnConsole]<br />
Exercising the Basis Weight Shutter:<br />
I>()[betaSensor01 private$openShutter]<br />
I>()[betaSensor01 private$closeShutter]<br />
Exercising the Basis Weight Electrometer Clamp:<br />
I>()[betaSensor01 private$clampElectrometer]<br />
I>()[betaSensor01 private$unclampElectrometer]<br />
Exercising the Reflection IR Flag:<br />
I>()[IRSensor01 private$insertReflector]<br />
I>()[IRSensor01 private$removeReflector]<br />
Exercising the Ash Shutter:<br />
I>()[ashSensor01 private$openShutter]<br />
I>()[ashSensor01 private$closeShutter]<br />
Exercising the Ash Electrometer Clamp:<br />
I>()[ashSensor01 private$clampElectrometer]<br />
I>()[ashSensor01 private$unclampElectrometer]<br />
Exercising the Caliper head/pressure/vacuum:<br />
I>()[caliperSensor01 private$setupCaliperHardware:n pressure:n Vacuum:n]<br />
CaliperHardware Pressure Vacuum<br />
Where n is: 0 open head on on<br />
1 close head off off<br />
Exercising the OptiPak clamp/vacuum:<br />
I>()[optipakSensor01 private$setupOptipakHardware:n Vacuum:n]<br />
OptipakHardware Vacuum<br />
Where n is 0 unclamp on<br />
1 clamp off<br />
264 3BUS 208 055 R1101
PROPRIETARY DATA: This document contains proprietary data of ABB Inc. No disclosure, distribution (electronic or otherwise),<br />
reproduction, or other means of dissemination may be made without written permission.<br />
Application Tools<br />
$$ft - <strong>Platform</strong> tuning tool<br />
$$aim - Analog Input Monitor Utility<br />
$$dim - Display or modify Digital I/O status<br />
$$monitor - Real Time Monitor<br />
$$pe -a - Print error all system messages<br />
$$smr - Signal Monitor Report<br />
$$uc_heat (mc id) - Microcontroller temperature setup<br />
$$ gstore - Save configuration change to ram disk<br />
$$tbmcu - Examine contents of tbm arrays<br />
$$sentest - Collect scan and single point data for performance testing<br />
3BUS 208 055 R1101<br />
265
Blank Page
PROPRIETARY DATA: This document contains proprietary data of ABB Inc. No disclosure, distribution (electronic or otherwise),<br />
reproduction, or other means of dissemination may be made without written permission.<br />
Index<br />
A<br />
ABB Smart Processing Center (ASPC) Hardware,<br />
113<br />
analog and digital (I/O) documentation, 146<br />
analog input monitor utility, 121<br />
aim main menu, 121<br />
examples of aim reports, 122<br />
AI channel gains report, 124<br />
AI channel slopes and offsets report,<br />
124<br />
AI signal report (statistics), 123<br />
I/O device selection report, 122<br />
procedure for using the aim utility, 121<br />
analog input signal verification and tracing,<br />
125<br />
digital I/O utility, 118<br />
dim main menu, 118<br />
examples of dim reports, 119<br />
I/O selection, 119<br />
printout of I/O configuration, 119<br />
procedure for using the dim utility, 118<br />
digital input/output signal verification and tracing,<br />
120<br />
host/workstation interface to the ASPC, 114<br />
inspecting and repairing BRAM, 116<br />
procedure to repair BRAM, 116<br />
LED interpretation, 139<br />
ECF, ECS, and ECC LEDs, 140<br />
ECF and ECC boards (only), 140<br />
MPRC LEDs, 141<br />
power supply LEDs, 139<br />
micro-controller DC power log, 152<br />
power down analysis, 147<br />
power down reason (reason for shutdown),<br />
149<br />
safety interrupt alert, 147<br />
using the diagnostic card adapter, 126<br />
diagnostic cards, 130<br />
replacement parts, 138<br />
Accel, 100<br />
ACCELERATION Phase Operation, 9<br />
Accessing 1180 MICRO Profile Data Inside the<br />
<strong>Scanning</strong> <strong>Platform</strong>, 42<br />
advdb, 99<br />
aim utility<br />
Main Menu, 121<br />
using, 121<br />
Air Bearing, Contacting, and Non-Contacting Caliper<br />
Sensors, 246<br />
Air Column Compensation for Smart Sensors, 202<br />
Al Channel Gains Report, 124<br />
Al Channel Slopes and Offsets Report, 124<br />
Al Signal Report (Statistics), 123<br />
Alarm<br />
4602/4702, 217<br />
4603/4703, 216<br />
4608/4708, 217<br />
4609/4709, 217<br />
4611/4712, 217<br />
4613/4713, 217<br />
4614/4714, 217<br />
4615/4715, 215<br />
4616/4716, 215<br />
4617/4717, 215<br />
4618/4718, 215<br />
4619/4719 and 4624/4724, 214<br />
4621/4721, 217<br />
4622/4722, 215<br />
4679/4779, 217<br />
code classification, 249<br />
troubleshooting, 247<br />
Analog and Digital I/O Documentation, 146<br />
Analog Input Monitor Utility, 121<br />
Analog Input Signal Verification and Tracing, 125<br />
Application, 157<br />
tools, 265<br />
Ash<br />
correlation problems, 244<br />
hardware diagnostics, 242<br />
standardize results, 240<br />
TLXR troubleshooting, 239<br />
Auto Edge-of-Sheet (AEOS), 3<br />
autoEOS, 103<br />
Automatic Reporting and Retriggering, 175<br />
avdb, 99<br />
3BUS 208 055 R1101<br />
Index<br />
267
PROPRIETARY DATA: This document contains proprietary data of ABB Inc. No disclosure, distribution (electronic or otherwise),<br />
reproduction, or other means of dissemination may be made without written permission.<br />
B<br />
Basis Weight<br />
hardware diagnostics, 211<br />
TLK, TLP, and TLS troubleshooting, 209<br />
biasn, 101<br />
biasp, 101<br />
BRAM<br />
repairing, 116<br />
Broken Grid Alarm, 86<br />
C<br />
Calibrate Sample Report, 189<br />
Caliper<br />
exercising the sensor, 246<br />
Changing the Host/SP BAUD Rate and the Station<br />
ID, 85<br />
Close Window, 260<br />
Collect Data On, 178<br />
Command Format, 257<br />
Comments About the Motor Controller, 95<br />
Compensation, 50<br />
Compensation Flag Setup, 201<br />
Composition Effects on Infrared Sensors, 219<br />
Conversion, 50<br />
Converting tbmcu files for spreadsheet analysis, 32<br />
Correction, 50<br />
Correlation Problems, 218<br />
Creating a Hot Key, 261<br />
CRUISING Phase Operation, 9<br />
D<br />
Data Box Collection Calculation, 47<br />
Data Collection<br />
starting and stopping, 176<br />
Data Required for Problem Escalation, 60<br />
dbAvgTime, 102<br />
dbWidth, 102<br />
ddcExcessiveErrorPercent, 100<br />
ddcRestrictedMotionPercent, 100<br />
DECELERATION Phase Operation, 10<br />
Definition of Terms, 198<br />
DESQview operations, 260<br />
close window, 260<br />
creating a hot key, 261<br />
display scripts, 262<br />
move, 261<br />
open window, 260<br />
rearrange, 260<br />
resize, 261<br />
switch window, 260<br />
Diagnosis of <strong>Platform</strong> and Servo Problems, 96<br />
Diagnostics<br />
cards, 130<br />
software, 155<br />
Digital I/O<br />
signal verification and tracing, 120<br />
utility, 118<br />
dim Utility<br />
Main Menu, 118<br />
reports, 119<br />
using, 118<br />
Dirt Buildup on the Sensor Window, 218<br />
Discontinuity Counter, 238<br />
Display Object, 255<br />
Display Scripts, 262<br />
Displaying Reports within inspect, 187<br />
duration(3), 102<br />
E<br />
ECF, ECS, and ECC LEDs, 140<br />
editor commands, 258<br />
Enter Editor, 258<br />
Examining Floating Point TBM Arrays, 34<br />
Exercising the Gain Using Software Commands,<br />
237<br />
F<br />
farEdge, 102<br />
farEOS unknown/homeEOSunknown, 103<br />
File Commands, 253<br />
Filtering, 49<br />
Fine Tuning, 50<br />
Flow Charts<br />
troubleshooting, 63, 220<br />
ash (TLXR), 239<br />
ash correlation, 245<br />
basis weight, 209<br />
Frame Tuning and Diagnostic Tool, ft, 110<br />
Function Keys, 259<br />
G<br />
Gap Compensation<br />
disable, 202<br />
General AVOS Utilities, 158<br />
General Correlation Scatter, 218<br />
General Procedure, 176<br />
General Software <strong>Troubleshooting</strong> Techniques, 156<br />
General <strong>Troubleshooting</strong> Instructions, 59<br />
changing the host/SP BAUD rate and the station<br />
ID, 85<br />
data required for problem escalation, 60<br />
host computer coldstart data file overview, 76<br />
268 Index 3BUS 208 055 R1101
PROPRIETARY DATA: This document contains proprietary data of ABB Inc. No disclosure, distribution (electronic or otherwise),<br />
reproduction, or other means of dissemination may be made without written permission.<br />
radiological safety features and alarms, 86<br />
broken grid alarm, 86<br />
head tracking error, 87<br />
inherent sheet break (ISB) alarm, 86<br />
invalid shutter open alarm, 87<br />
shutter closed during prepare to move, 87<br />
shutter closed when host computer is<br />
down, 87<br />
startup messages, 77<br />
troubleshooting flow charts, 63<br />
Global Access, 176<br />
gstore, 254<br />
gstore Utility, 162<br />
H<br />
Hang Up Problems, 96<br />
Head Package Dimensions<br />
definitions, 4<br />
setup, 3<br />
Head Tracking Error, 87<br />
healthRequest, 103<br />
homeEdge, 102<br />
HOMING Phase Operation, 11<br />
homingError, 102<br />
Host Computer Coldstart Data File Overview, 76<br />
Host/Workstation Interface to the ASPC, 114<br />
How Head Position is Determined, 5<br />
How to Start the <strong>Scanning</strong> <strong>Platform</strong>, 185<br />
I<br />
I/O Configuration<br />
printout, 119<br />
I/O Device Selection Report, 122<br />
I/O Selection, 119<br />
Identifying Sensor Configuration, 164<br />
increment(3), 101<br />
Infrared Moisture Sensor, 213<br />
Inherent Sheet Break (ISB) Alarm, 86<br />
Inspect Messages, 257, 264<br />
inspect Utility, 160<br />
Inspecting and Repairing BRAM, 116<br />
Insufficient Cooling, 220<br />
Interface<br />
host/workstation to ASPC, 114<br />
Intraframe/Interframe Compensation, 18<br />
inTransit, 103<br />
Introductory Comments, 27<br />
Invalid Shutter Open Alarm, 87<br />
Ki, 101<br />
Kp, 100<br />
K<br />
L<br />
LED Interpretation, 139<br />
Line Prompts, 252<br />
Linearization, 50<br />
Logical Zone Calculations, 48<br />
M<br />
Maintenance and Debugging, 253<br />
maxEdgeChange, 102<br />
maxSpeed, 103<br />
Measurement Analysis<br />
using on-line utilities, 27<br />
using sentest Utility, 35<br />
using tbmcu utility, 27<br />
Mechanical Influence on Motion Problems, 94<br />
Messages<br />
inspect, 264<br />
startup, 77<br />
Micro-Controller DC Power Log, 152<br />
Miscellaneous, 98<br />
Modify Object, 256<br />
Motion Control Theory, 12<br />
Motion Theory, 7<br />
Motor Controller Slope and Offset Too Large, 98<br />
Motor Controller Slope Too Small, 97<br />
Move, 261<br />
MPRC LEDs, 141<br />
N<br />
Normalization, 49<br />
O<br />
Object Inspector, 255<br />
display object, 255<br />
inspect messages, 257<br />
command format, 257<br />
modify object, 256<br />
special characters, 257<br />
using the editor, 258<br />
editor commands, 258<br />
enter editor, 258<br />
Obtaining derr, bfchk, and dfree Data, 183<br />
Obtaining the monitor Report, 180<br />
Off-Line Debug, 195, 263<br />
offSheetTimer, 104<br />
3BUS 208 055 R1101<br />
Index<br />
269
PROPRIETARY DATA: This document contains proprietary data of ABB Inc. No disclosure, distribution (electronic or otherwise),<br />
reproduction, or other means of dissemination may be made without written permission.<br />
onSheetTimer, 104<br />
Open Window, 260<br />
Operating System, 157<br />
Operation, 199<br />
Operation at Design Limits, 219<br />
Operation of the Sensor Health Pages, 191<br />
Operation Overview, 169<br />
Outputs, 173<br />
Overcontrol Problems, 97<br />
diagnosis of platform and servo problems<br />
overcontrol problems, 97<br />
Overview of Menu Selection, 176<br />
P<br />
Performing a gstore, 254<br />
Position and Motion Problems, 89<br />
comments about the motor controller, 95<br />
diagnosis of platform and servo problems, 96<br />
hang up problems, 96<br />
motor controller slope too small, 97<br />
servo01 request complete, 97<br />
vmin too small, 96<br />
overcontrol problems<br />
miscellaneous, 98<br />
motor controller slope and offset too<br />
large, 98<br />
vmin too large (or activeVmin), 97<br />
xdb too small, 98<br />
Frame Tuning and Diagnostic Tool, ft, 110<br />
mechanical influence on motion problems, 94<br />
preliminary troubleshooting activity, 90<br />
servo and scanner diagnostic instance variables,<br />
99<br />
scanner01 object, 102<br />
autoEOS, 103<br />
dbAvgTime, 102<br />
dbWidth, 102<br />
farEOS<br />
unknown/homeEOSUnknown,<br />
103<br />
healthRequest, 103<br />
inTransit, 103<br />
maxEdgeChange, 102<br />
maxSpeed, 103<br />
offSheetTimer, 104<br />
onSheetTimer, 104<br />
positioningSafetyMargin, 103<br />
scanning, 103<br />
sheetBreakPresent, 104<br />
stdzPending, 104<br />
target, 103<br />
servo01 object, 99<br />
Accel, 100<br />
advdb, 99<br />
avdb, 99<br />
biasn, 101<br />
biasp, 101<br />
ddcExcessiveErrorPercent, 100<br />
ddcRestrictedMotionPercent, 100<br />
duration(3), 102<br />
farEdge, 102<br />
homeEdge, 102<br />
homingError, 102<br />
increment(3), 101<br />
Ki, 101<br />
Kp, 100<br />
sampleInterval, 101<br />
slopen, 101<br />
slopep, 101<br />
vdb, 99<br />
vfinal(3), 101<br />
vmax, 100<br />
vmin/active vmin, 99<br />
vminFilterFactor, 100<br />
vminTune, 101<br />
xdb, 99<br />
xfinal(3), 101<br />
Positioning System Overview, 2<br />
positioningSafetyMargin, 103<br />
Power Down Analysis, 147<br />
Power Down Reason (reason for shutdown), 149<br />
Power Supply LEDs, 139<br />
Practical Application, 177<br />
Preliminary <strong>Troubleshooting</strong> Activity, 90<br />
Preparing On-Site Documentation, 190<br />
Printout<br />
I/O configuration, 119<br />
Profile Data, 36<br />
Profile Development<br />
1180 host computer, 46<br />
1180 systems, 38<br />
1190 host computer, 26<br />
1190 systems, 19<br />
<strong>Scanning</strong> <strong>Platform</strong>, 21, 39<br />
Profile Transmission<br />
1180, 38<br />
1180 host computer, 44<br />
<strong>Scanning</strong> <strong>Platform</strong>, 25<br />
Q<br />
Quick Reference Guide, 251<br />
R<br />
Radiological Safety Features and Alarms, 86<br />
Rearrange, 260<br />
270 Index 3BUS 208 055 R1101
PROPRIETARY DATA: This document contains proprietary data of ABB Inc. No disclosure, distribution (electronic or otherwise),<br />
reproduction, or other means of dissemination may be made without written permission.<br />
Reflection IR<br />
exercising the flag, 237<br />
Release Levels<br />
check of diskettes, 166<br />
Finding, 165<br />
Replacement Parts, 138<br />
Reports<br />
AI channel gains, 124<br />
AI channel slopes and offsets, 124<br />
AI signal statistics, 123<br />
aim, 122<br />
calibrate sample, 189<br />
dim, 119<br />
I/O device selection, 122<br />
monitor, 180<br />
sample check, 188<br />
standardize, 187<br />
Resize, 261<br />
Resource, 156<br />
Resource Checks, 180<br />
Rewet, 218<br />
S<br />
Safety Interrupt Alert, 147<br />
Sample Check Report, 188<br />
sampleInterval, 101<br />
scanner01 object, 102<br />
scanning, 103<br />
<strong>Scanning</strong> <strong>Platform</strong> Software Diagnostic Tools<br />
disiplaying reports within inspect<br />
calibrate sample report, 189<br />
displaying reports within inspect, 187<br />
sample check report, 188<br />
standardize report, 187<br />
how to start the <strong>Scanning</strong> <strong>Platform</strong>, 185<br />
identifying sensor configuration, 164<br />
identifying software release levels<br />
finding subsystem release levels, 165<br />
finding system release levels, 165<br />
release level check of diskettes, 166<br />
obtaining the monitoring report<br />
obtaining derr, bfchk, and dfree data, 183<br />
off-line debug, 195<br />
operation of the sensor health pages, 191<br />
preparing on-site documentation, 190<br />
resource checks, 180<br />
obtaining the monitor report, 180<br />
signal/measurement processing analysis and reporting<br />
(smr), 168<br />
automatic reporting and retriggering, 175<br />
global access, 176<br />
operation overview, 169<br />
outputs, 173<br />
overview of menu selection, 176<br />
collect data on, 178<br />
example, 177<br />
general procedure, 176<br />
practical application, 177<br />
trigger setup, 177<br />
smr Work Sheet, 178<br />
starting and stopping data collection, 176<br />
summary of smr capabilities, 168<br />
triggers, 171<br />
software diagnosis, 156<br />
application, 157<br />
AVOS and application utilities, 158<br />
general AVOS utilities, 158<br />
general software troubleshooting techniques,<br />
156<br />
gstore utility, 162<br />
operating system, 157<br />
resource, 156<br />
the inspect utility, 160<br />
software release levels, 165<br />
<strong>Scanning</strong> <strong>Platform</strong> Utilities, 252<br />
line prompts, 252<br />
special functions, 252<br />
utility command response to a file, 252<br />
Selected Theories of Operation, 1<br />
head package dimensions setup, 3<br />
auto edge-of-sheet turned off, 3<br />
auto edge-of-sheet turned on, 3<br />
how head position is determined, 5<br />
measurement analysis using on-line utilities,<br />
27<br />
1190 measurement analysis using sentest<br />
utility, 35<br />
1190 measurement analysis using the<br />
sentest utility<br />
profile data, 36<br />
single point drift data, 37<br />
converting tbmcu files for spreadsheet<br />
analysis, 32<br />
examining floating point TBM arrays, 34<br />
introductory comments, 27<br />
measurement analysis using tbmcu utility,<br />
27<br />
using tbmcu utility in standalone, 31<br />
motion theory, 7<br />
motion control theory, 12<br />
servo theory of operation, 7<br />
ACCELERATION phase operation, 9<br />
CRUISING phase operation, 9<br />
DECELERATION phase operation,<br />
10<br />
HOMING phase operation, 11<br />
3BUS 208 055 R1101<br />
Index<br />
271
PROPRIETARY DATA: This document contains proprietary data of ABB Inc. No disclosure, distribution (electronic or otherwise),<br />
reproduction, or other means of dissemination may be made without written permission.<br />
system response to some position parameters,<br />
13<br />
intraframe/interframe compensation,<br />
18<br />
positioning system overview, 2<br />
definition of head package dimensions, 4<br />
profile development for 1180 systems, 38<br />
accessing 1180 MICRO profile data inside<br />
the <strong>Scanning</strong> <strong>Platform</strong>, 42<br />
logical zone calculations, 48<br />
profile development in the <strong>Scanning</strong> <strong>Platform</strong>,<br />
39<br />
profile development within the host computer,<br />
46<br />
profile transmission and development, 38<br />
profile transmission to a host computer, 44<br />
data box collection calculation, 47<br />
profile development for 1190 systems, 19<br />
profile development in the 1190 host computer,<br />
26<br />
profile development in the <strong>Scanning</strong> <strong>Platform</strong>,<br />
21<br />
profile transmission to the host computer,<br />
25<br />
time based measurement, 19<br />
sensor theory, 49<br />
sensor input signal processing, 51<br />
sensor output signal processing, 55<br />
sensor processing overview, 49<br />
compensation, 50<br />
conversion, 50<br />
correction, 50<br />
filtering, 49<br />
fine tuning, 50<br />
linearization, 50<br />
normalization, 49<br />
Sensor Alarm Codes, 213<br />
Sensor Compensation - Operation and Setup, 198<br />
Sensor Input Signal Processing, 51<br />
Sensor Local Modes of Operation, 206<br />
Sensor Output Signal Processing, 55<br />
Sensor Processing Overview, 49<br />
Sensor Theory, 49<br />
Sensor <strong>Troubleshooting</strong>, 197<br />
air bearing, contacting, and non-contacting caliper<br />
sensors, 246<br />
alarm code classification, 249<br />
exercising the caliper sensor, 246<br />
sensor validity codes, 250<br />
troubleshooting alarms, 247<br />
air column compensation for Smart sensors,<br />
202<br />
disable gap compensation, 202<br />
ash sensors (TLXR), 239<br />
ash correlation problems, 244<br />
ash sensor hardware diagnostics, 242<br />
to open or close shutter, 242<br />
to unclamp or clamp the electrometer,<br />
242<br />
ash sensor standardize results, 240<br />
basis weight sensor (TLK, TLP, and TLS), 209<br />
basis weight hardware diagnostics, 211<br />
to open and close shutter, 211<br />
troubleshooting flow chart, 209<br />
infrared moisture sensor, 213<br />
correlation problems, 218<br />
composition effects on infrared sensors,<br />
219<br />
dirt buildup on the sensor window,<br />
218<br />
general correlation scatter, 218<br />
insufficient cooling, 220<br />
operation at design limits, 219<br />
rewet, 218<br />
step-outs in the trend, 219<br />
discontinuity counter, 238<br />
exercising the gain using software commands,<br />
237<br />
using inspect, 237<br />
using the health page pulse monitor<br />
, 237<br />
exercising the reflection IR flag, 237, 238<br />
sensor alarm codes, 213<br />
alarm 4602/4702, 217<br />
alarm 4603/4703, 216<br />
alarm 4608/4708, 217<br />
alarm 4621/4721, 217<br />
alarms 4609/4709, 4611/4711, 4612/<br />
4712, 4613/4713, 4614/4714,<br />
and 4679/4779, 217<br />
alarms 4615/4715, 4616/4716, 4617/<br />
4717, 4618/4718, and 4622/<br />
4722, 215<br />
alarms 4619/4719 and 4624/4724,<br />
214<br />
troubleshooting flow charts, 220<br />
sensor compensation - operation and setup, 198<br />
compensation flag setup, 201<br />
definition of terms, 198<br />
operation, 199<br />
sensor local modes of operation, 206<br />
Sensor Validity Codes, 250<br />
Servo and Scanner Diagnostic Instance Variables,<br />
99<br />
Servo Theory of Operation, 7<br />
servo01 object, 99<br />
servo01 Request Complete, 97<br />
sheetBreakPresent, 104<br />
272 Index 3BUS 208 055 R1101
PROPRIETARY DATA: This document contains proprietary data of ABB Inc. No disclosure, distribution (electronic or otherwise),<br />
reproduction, or other means of dissemination may be made without written permission.<br />
Shutter Closed During Prepare to Move, 87<br />
Shutter Closed When Host Computer is Down, 87<br />
Signal/Measurement Processing Analysis and Reporting<br />
(smr), 168<br />
Single Point Drift Data, 37<br />
slopen, 101<br />
slopep, 101<br />
smr Work Sheet, 178<br />
Software Diagnosis, 156<br />
Software Diagnostic Tools, 155<br />
Special Characters, 257<br />
Special Functions, 252<br />
Standardize Report, 187<br />
Starting and Stopping Data Collection, 176<br />
Startup Messages, 77<br />
stdzPending, 104<br />
Step-outs in the Trend, 219<br />
Summary of smr Capabilities, 168<br />
Switch Window, 260<br />
System Response to Some Position Parameters, 13<br />
T<br />
target, 103<br />
Time Based Measurement, 19<br />
To Open or Close Shutter, 211, 242<br />
To Unclamp or Clamp the Electrometer, 242<br />
Tools<br />
application, 265<br />
Triggers, 171<br />
setup, 177<br />
<strong>Troubleshooting</strong><br />
alarms, 247<br />
flow charts, 63, 209, 220<br />
U<br />
Using inspect, 237<br />
Using tbmcu Utility in Stand-Alone, 31<br />
Using the Diagnostic Card Adapter, 126<br />
Using the Editor, 258<br />
Using the Health Page Pulse Monitor, 237<br />
Utilities<br />
aim, 121<br />
dim, 118<br />
gstore, 162<br />
inspect, 160<br />
Utility Command Response to a File, 252<br />
Utility Commands, 253<br />
file commands, 253<br />
maintenance and debugging, 253<br />
V<br />
vdb, 99<br />
vfinal(3), 101<br />
vmax, 100<br />
vmin Too Large (or activeVmin), 97<br />
vmin Too Small, 96<br />
vmin/activeVmin, 99<br />
vminFilterFactor, 100<br />
vminTune, 101<br />
X<br />
xdb, 99<br />
xdb Too Small, 98<br />
xfinal(3), 101<br />
3BUS 208 055 R1101<br />
Index<br />
273
Blank Page
PROPRIETARY DATA: This document contains proprietary data of ABB Inc. No disclosure, distribution (electronic or otherwise),<br />
reproduction, or other means of dissemination may be made without written permission.<br />
User Comments Request Form<br />
We appreciate your comments on this manual.<br />
Please call or send comments to:<br />
ABB Inc.<br />
Attention: Documentation<br />
650 Ackerman Road<br />
P.O. Box 82650<br />
Columbus, Ohio 43202-0650<br />
(614) 261-2000<br />
Comments can also be sent via FAX to:<br />
Documentation<br />
(614) 261-2113<br />
3BUS 208 055 R1101<br />
Measure IT <strong>Scanning</strong> <strong>Platform</strong> <strong>Troubleshooting</strong> <strong>Procedures</strong> <strong>Manual</strong>