Annual report 2008 - Munters
Annual report 2008 - Munters
Annual report 2008 - Munters

Create successful ePaper yourself
Turn your PDF publications into a flip-book with our unique Google optimized e-Paper software.
Moisture Control Services (MCS) division<br />
27<br />
“During 2009, major changes will take place in how we work<br />
within MCS. We will become even better at understanding<br />
the needs of our selected customer segments and more<br />
effective in how employees work in the field. The focus is on<br />
the gross margin, and we will leave markets in which we are<br />
not profitable to focus on growth in markets that have the<br />
best potential. We will continue work to gradually introduce<br />
professional key account management, improved processes<br />
and work methods for increased productivity and the introduction<br />
of a mobile IT system.”<br />
Morten Andreasen, Division President<br />
Developments during <strong>2008</strong><br />
• Continued favorable order intake and sales in most<br />
markets<br />
• Underlying earnings on par with preceding year<br />
• Non-recurring costs of SEK 100 M, of which SEK 55 M<br />
in MEP 2<br />
• Field.Link introduced in five countries during the<br />
fourth quarter<br />
• Ongoing efficiency measures due to the launch<br />
of Field.Link.<br />
The MCS division experienced favorable growth throughout the<br />
year. Strong earnings were noted, particularly in US operations,<br />
where the hurricane season and other weather-related events<br />
KEY DATA <strong>2008</strong><br />
resulted in good business volumes. In large parts of Europe, market<br />
shares continued to increase. Earnings were affected, however, by<br />
continued inflationary pressure in salaries and fuel, although some<br />
relief was noted toward the end of the year. The trend in which<br />
insurance companies increasingly sign framework agreements<br />
with the major restoration companies continued. The MCS division<br />
signed SEK M two framework agreements during the second half of SEK the M<br />
year 3,000with insurance companies in the US and Australia. In addition, 300<br />
the global partnership with AXA was expanded with a new contract<br />
2,500<br />
250<br />
in the UK. Investments within the framework of the MEP 2 program<br />
amounted 2,000 to SEK 55 M. Non-recurring costs were charged against 200<br />
earnings in an amount of SEK 45 M, primarily attributable to preparations<br />
for the phase out of certain operations, closure of operations<br />
1,500<br />
150<br />
in 1,000 New Zealand and three depots in Australia and the merger of 100<br />
the French and Belgian business units. These costs also included<br />
preparations 500 for the phasing out of certain operations.<br />
50<br />
0<br />
2003<br />
2004<br />
2005<br />
2006<br />
2007<br />
<strong>2008</strong><br />
0<br />
3 000<br />
2 500<br />
2 000<br />
1 500<br />
1 000<br />
500<br />
Adjusted<br />
<strong>2008</strong> 2007 Change, % change, % 1<br />
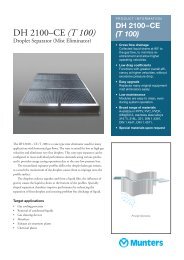
Order intake, SEK M 2,770 2,630 5 5<br />
Net sales, SEK M 2,809 2,624 7 7<br />
Operating earnings<br />
(EBITA), SEK M<br />
48 129 –63<br />
Operating margin, % 1.7 4.9<br />
Return on operating<br />
capital, % 5.5 15.5<br />
Capital turnover rate,<br />
multiple 3.2 3.2<br />
No. of employees, Dec 31 1,944 1,918 1<br />
No. of service depots 301 321<br />
1<br />
Preceding year translated to this year’s exchange rates and adjusted for acquisitions.<br />
SEK M<br />
SEK M<br />
3,000<br />
300<br />
2,500<br />
250<br />
2,000<br />
200<br />
1,500<br />
150<br />
1,000<br />
100<br />
500<br />
50<br />
0<br />
0<br />
2003 2004 2005 2006 2007 <strong>2008</strong><br />
Order intake Net sales Operating earnings<br />
SEK M<br />
SEK M<br />
3,000<br />
300<br />
2,500<br />
250<br />
0<br />
3000<br />
2500<br />
2000<br />
1500<br />
1000<br />
500<br />
0<br />
3000<br />
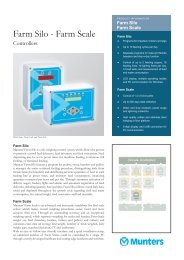
Share of consolidated<br />
Net sales by geographic Share of consolidated 2,000<br />
Customer segments<br />
Share of Group employees 200<br />
net sales<br />
region<br />
operating earnings<br />
1,500<br />
150<br />
43% Asia 7%<br />
Americas 14%<br />
12%<br />
1,000<br />
Other 3%<br />
Temporary<br />
47%<br />
100<br />
500<br />
climate<br />
control 11%<br />
50<br />
Recon-<br />
Europe 79%<br />
struction 18%<br />
0<br />
Fire damage<br />
0<br />
2003 restoration 2004 22% 2005<br />
Water damage<br />
restoration 46%<br />
2006 2007 <strong>2008</strong><br />
2500<br />
2000<br />
1500<br />
1000<br />
500<br />
0<br />
<strong>Munters</strong> <strong>Annual</strong> Report <strong>2008</strong>