Annual report 2008 - Munters
Annual report 2008 - Munters
Annual report 2008 - Munters

You also want an ePaper? Increase the reach of your titles
YUMPU automatically turns print PDFs into web optimized ePapers that Google loves.
HumiCool division<br />
21<br />
“After a strong first half of the year for most business areas,<br />
HumiCool was affected by a sharply weakened market as<br />
a direct result of turmoil in the credit markets that quickly<br />
resulted in reduced volumes. During the second half of <strong>2008</strong>,<br />
the division implemented forceful measures to adapt the<br />
cost structure to the lower market activity. This work will<br />
continue during 2009. Our market position remains favorable,<br />
and I expect that the implemented measures will further<br />
strengthen the division so that we will achieve a rapid recovery<br />
when the market rebounds.”<br />
Per Segerström, Division President<br />
SEK M<br />
3,000<br />
2,500<br />
SEK M<br />
300<br />
250<br />
3 000<br />
2,000<br />
200<br />
2 500<br />
Developments during <strong>2008</strong><br />
• Favorable sales for most business areas during the<br />
first half of the year with the exception of HVAC<br />
• Sharply weakened market prospects after the<br />
summer<br />
• Rationalization measures in the production structure<br />
and substaintial reduction of the workforce.<br />
During the first half of the year, market growth was strong for all<br />
business areas except HVAC, which experienced weak demand<br />
for mobile heaters after a mild winter. Mist Elimination showed a<br />
favorable earnings trend aided by a solid order backlog, but order<br />
intake declined significantly due to low demand among coal-fired<br />
power plants in the US. After the summer, all business areas were<br />
strongly affected by the turmoil in the global credit markets, which<br />
resulted in distributors experiencing difficulty with short-term<br />
financing and thus reducing inventories. A dramatic decline in the<br />
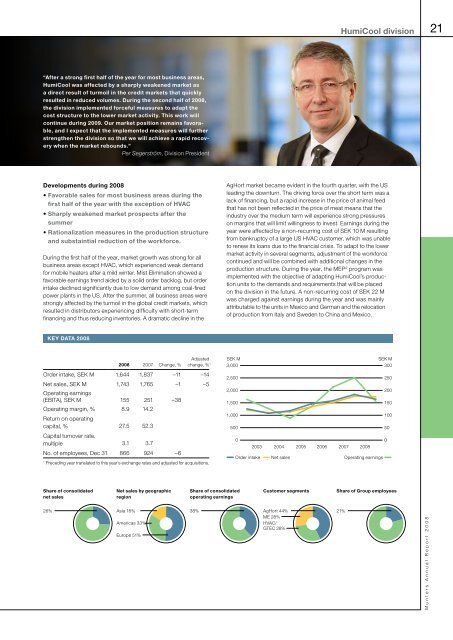
KEY DATA <strong>2008</strong><br />
AgHort 1,500 market became evident in the fourth quarter, with the US 150<br />
leading the downturn. The driving force over the short term was a<br />
1,000<br />
100<br />
lack of financing, but a rapid increase in the price of animal feed<br />
that 500has not been reflected in the price of meat means that the 50<br />
industry over the medium term will experience strong pressures<br />
on margins 0 that will limit willingness to invest. Earnings during the 0<br />
2003 2004 2005 2006 2007 <strong>2008</strong><br />
year were affected by a non-recurring cost of SEK 10 M resulting<br />
from bankruptcy of a large US HVAC customer, which was unable<br />
to SEK renew M its loans due to the financial crisis. To adapt to the lower SEK M<br />
3,000 market activity in several segments, adjustment of the workforce 300<br />
continued and will be combined with additional changes in the<br />
2,500<br />
production structure. During the year, the MEP 2 250<br />
program was<br />
implemented 2,000 with the objective of adapting HumiCool’s produc20tion<br />
units to the demands and requirements that will be placed<br />
on 1,500 the division in the future. A non-recurring cost of SEK 22 M 150<br />
was charged against earnings during the year and was mainly<br />
1,000<br />
100<br />
attributable to the units in Mexico and German and the relocation<br />
of 500 production from Italy and Sweden to China and Mexico. 50<br />
0<br />
2003<br />
2004<br />
2005<br />
2006<br />
2007<br />
<strong>2008</strong><br />
0<br />
2 000<br />
1 500<br />
1 000<br />
500<br />
0<br />
3000<br />
2500<br />
2000<br />
1500<br />
1000<br />
500<br />
Adjusted<br />
<strong>2008</strong> 2007 Change, % change, % 1<br />
Order intake, SEK M 1,644 1,837 –11 –14<br />
Net sales, SEK M 1,743 1,765 –1 –5<br />
Operating earnings<br />
(EBITA), SEK M 155 251 –38<br />
Operating margin, % 8.9 14.2<br />
Return on operating<br />
capital, % 27.5 52.3<br />
Capital turnover rate,<br />
multiple 3.1 3.7<br />
No. of employees, Dec 31 866 924 –6<br />
1<br />
Preceding year translated to this year’s exchange rates and adjusted for acquisitions.<br />
SEK M<br />
SEK M<br />
3,000<br />
300<br />
2,500<br />
250<br />
2,000<br />
200<br />
1,500<br />
150<br />
1,000<br />
100<br />
500<br />
50<br />
0<br />
0<br />
2003 2004 2005 2006 2007 <strong>2008</strong><br />
Order intake Net sales Operating earnings<br />
0<br />
3000<br />
2500<br />
2000<br />
1500<br />
1000<br />
500<br />
0<br />
Share of consolidated<br />
net sales<br />
Net sales by geographic<br />
region<br />
Share of consolidated<br />
operating earnings<br />
Customer segments<br />
Share of Group employees<br />
26% Asia 16%<br />
Americas 33%<br />
38% AgHort 44%<br />
ME 28%<br />
HVAC/<br />
GTEC 28%<br />
21%<br />
Europe 51%<br />
<strong>Munters</strong> <strong>Annual</strong> Report <strong>2008</strong>