Newton's Second Law - Vernier Software & Technology
Newton's Second Law - Vernier Software & Technology
Newton's Second Law - Vernier Software & Technology

You also want an ePaper? Increase the reach of your titles
YUMPU automatically turns print PDFs into web optimized ePapers that Google loves.
Newton’s <strong>Second</strong> <strong>Law</strong><br />
Experiment<br />
4<br />
INTRODUCTION<br />
In your discussion of Newton’s first law, you learned that when the sum of the forces acting on<br />
an object is zero, its velocity does not change. However, when a net force acts on the object, it<br />
accelerates. In this experiment, you will determine the relationship between the net force acting<br />
on an object and its acceleration.<br />
OBJECTIVES<br />
In this experiment, you will<br />
• Identify the forces acting on an object both when its change in velocity, Δv, is zero and<br />
when it is accelerating.<br />
• Collect force, velocity, and time data as a cart is accelerated on a track.<br />
• Use graphical methods to determine the acceleration of the cart.<br />
• Determine the relationship between the cart’s acceleration and the net force applied to it.<br />
• Determine the effect of the mass on the relationship between acceleration and force.<br />
MATERIALS<br />
<strong>Vernier</strong> data-collection interface<br />
Logger Pro or LabQuest App<br />
Dual-Range Force Sensor or<br />
Wireless Dynamic Sensor System<br />
<strong>Vernier</strong> Photogate and Bracket and<br />
Cart Picket Fence, or<br />
Motion Detector<br />
PRE-LAB INVESTIGATION<br />
Your instructor will show you the apparatus for this experiment. It<br />
is called a “modified Atwood’s machine.” A weight is connected to<br />
a cart by a string over a pulley. When the weight is allowed to fall,<br />
observe the motion of the cart. A force sensor mounted on the cart<br />
enables you to measure the force acting on the cart when it is<br />
moving. Discuss how you could determine the acceleration of the<br />
cart. Then, consider how the acceleration varies as the force applied<br />
to the cart increases. On the axes to the right, draw a sketch of the<br />
acceleration vs. net force graph based on your observations.<br />
standard hooked or slotted lab masses<br />
<strong>Vernier</strong> Dynamics Track<br />
standard cart<br />
Ultra Pulley and Pulley Bracket<br />
lightweight mass hanger<br />
Evaluation copy<br />
Advanced Physics with <strong>Vernier</strong> – Mechanics ©<strong>Vernier</strong> <strong>Software</strong> & <strong>Technology</strong> 4 - 1
Experiment 4<br />
PROCEDURE<br />
There are three methods one can use to collect velocity vs. time data and determine the<br />
acceleration of the cart. Choose the method that matches the apparatus you are using.<br />
Method 1 Timing with a Photogate and Picket Fence<br />
1. Attach an Ultra Pulley to the Pulley Bracket; attach this assembly to one end of the<br />
Dynamics Track. Make sure that you have adjusted the track to make frictional forces<br />
negligible.<br />
2. Connect the Dual-Range Force Sensor (DFS) and a Photogate to the interface; then start the<br />
data-collection program. You will need only graphs of force vs. time and velocity vs. time, so<br />
you can delete others and then re-size graphs to make them easier to see. LabQuest App<br />
users can do this in the Graph Options menu.<br />
3. Place the Cart Picket Fence in the slot on the cart so that the alternating dark and clear bands<br />
are on the top. Now place the force sensor on the cart.<br />
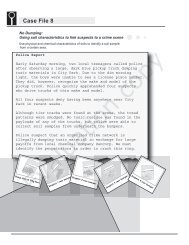
4. Position the photogate (using a support rod and clamp) so that the alternating dark and clear<br />
bands on the picket fence will interrupt the beam, as shown in Figure 1.<br />
Figure 1<br />
5. Discuss with your instructor what range of masses to use to apply the force that will<br />
accelerate the cart. Determine the total mass of your cart, force sensor, and any additional<br />
mass you may be instructed to use.<br />
6. Set up data collection.<br />
Using Logger Pro<br />
a. Choose Set Up Sensors ► Show All Interfaces from the Experiment menu.<br />
b. Click the image of the Photogate, select Set Distance or Length, then select Cart<br />
Picket Fence from the list of devices.<br />
c. Choose Data Collection from the Experiment menu. In the Mode list, click Digital<br />
Events. End collection after 20 Events.<br />
Using LabQuest as a standalone device<br />
• Data collection defaults to Photogate Timing mode. Tap Mode, select User defined,<br />
and set the length to 0.01 m.<br />
4 - 2 Advanced Physics with <strong>Vernier</strong> - Mechanics
Newton’s <strong>Second</strong> <strong>Law</strong><br />
7. Disconnect the hanging mass from the force sensor, then zero the sensor.<br />
8. Re-connect the hanging mass to the Force Sensor. Position the Photogate so that the cart and<br />
picket fence pass through the photogate while the cart is accelerating (before the hanging<br />
mass stops moving). Use something to cushion the hanging weight when it strikes the floor.<br />
9. Start data collection, then release the cart.<br />
10. To determine the force acting on the cart, select the portion of the force vs. time graph<br />
corresponding to the interval during which the cart’s velocity was changing smoothly. Find<br />
the statistics for this interval. Manual scaling of your graph is more helpful for doing this<br />
than Autoscaling.<br />
11. To determine the acceleration of the cart, perform a linear fit on the velocity vs. time graph.<br />
Be sure to record the values of force and acceleration for this hanging mass in your lab<br />
notebook.<br />
12. Repeat Steps 9–11 until you have three pairs of force vs. acceleration data that are reasonably<br />
consistent for that mass.<br />
13. Increase the hanging mass and continue until you have acceleration vs. force data for at least<br />
five different hanging masses.<br />
Method 2 Timing with a Photogate and Ultra Pulley<br />
1. Attach an Ultra Pulley to the Pulley Bracket; attach this assembly to one end of the<br />
Dynamics Track. Make sure that you have adjusted the track to make frictional forces<br />
negligible.<br />
2. Connect the Dual-Range Force Sensor (DFS) and a Photogate to the interface; then start the<br />
data-collection program. You will need only graphs of force vs. time and velocity vs. time, so<br />
you can delete others and then re-size graphs to make them easier to see. LabQuest App<br />
users can do this in the Graph Options menu.<br />
3. Attach the force sensor to the cart.<br />
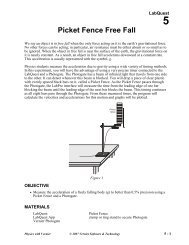
4. Attach the photogate to the track using a bracket so that the spokes on the pulley interrupt the<br />
beam, as shown in Figure 2.<br />
Figure 2<br />
Advanced Physics with <strong>Vernier</strong> - Mechanics 4 - 3
Experiment 4<br />
5. Discuss with your instructor what range of masses to use to apply the force that will<br />
accelerate the cart. Determine the total mass of your cart, force sensor, and any additional<br />
mass you may be instructed to use.<br />
6. Set up data collection.<br />
Using Logger Pro<br />
a. Choose Set Up Sensors ► Show All Interfaces from the Experiment menu.<br />
b. Click the image of the Photogate, select Set Distance or Length, then select Ultra<br />
Pulley (10 Spoke) Inside from the list of devices.<br />
Using LabQuest as a standalone device<br />
• Data collection defaults to Photogate Timing mode. Tap Mode and select Pulley<br />
(10 spoke) ► inside edge.<br />
7. Disconnect the hanging mass from the force sensor, then zero the sensor.<br />
8. Re-connect the hanging mass to the force sensor. Position the cart so that the hanger has<br />
about 30 cm to fall. Use something to cushion the hanging weight when it strikes the floor.<br />
9. Begin collecting data, then release the cart. Stop data collection after the weight hits the<br />
cushion on the floor.<br />
10. To determine the force acting on the cart, select the portion of the force vs. time graph<br />
corresponding to the interval during which the cart’s velocity was changing smoothly. Find<br />
the statistics for this interval. Manual scaling of your graph is more helpful for doing this<br />
than Autoscaling.<br />
11. To determine the acceleration of the cart, perform a linear fit on the portion of the velocitytime<br />
graph during which the velocity is changing smoothly. Be sure to record the values of<br />
force and acceleration for this hanging mass in your lab notebook.<br />
12. Repeat Steps 9–11 until you have three pairs of force vs. acceleration data that are reasonably<br />
consistent for that mass.<br />
13. Increase the hanging mass and continue until you have acceleration-force data for at least<br />
five different hanging masses.<br />
Method 3 Timing with a Motion Detector<br />
1. Attach an Ultra Pulley to the Pulley Bracket; attach this assembly to one end of the<br />
Dynamics Track. Make sure that you have adjusted the track to make frictional forces<br />
negligible.<br />
2. Connect the Dual-Range Force Sensor (DFS) and a Motion Detector to the interface; then<br />
start the data-collection program. You will need only graphs of force vs. time and velocity vs.<br />
time, so you can delete others and then re-size graphs to make them easier to see. LabQuest<br />
App users can do this in the Graph Options menu.<br />
3. Attach the force sensor to the cart. Mount the motion detector at the end of<br />
the track opposite the pulley. If your motion detector has a switch, set it to<br />
Track.<br />
4 - 4 Advanced Physics with <strong>Vernier</strong> - Mechanics
Newton’s <strong>Second</strong> <strong>Law</strong><br />
4. Discuss with your instructor what range of masses to use to apply the force that will<br />
accelerate the cart. Determine the total mass of your cart, force sensor, and any additional<br />
mass you may be instructed to use.<br />
5. Set up data collection.<br />
Using Logger Pro<br />
a. Choose Data Collection from the Experiment menu.<br />
b. Reduce the length of time to 3 seconds.<br />
Using LabQuest as a standalone device<br />
a. Tap Length and change the length of data collection to 3 seconds.<br />
b. Change the time to 3 seconds on the x-axis column using Graph Options in the graph<br />
tab.<br />
6. Position the cart so that the hanging mass is approximately 30 cm from the floor, disconnect<br />
the hanging mass from the force sensor, then zero both sensors. Make sure the starting<br />
position of the cart is at least 20 cm from the motion detector. 1<br />
7. Re-connect the hanging mass, begin collecting data, then release the cart. Catch the hanging<br />
mass before it strikes the floor.<br />
8. To determine the force acting on the cart, select the portion of the force vs. time graph<br />
corresponding to the interval during which the cart’s velocity was changing smoothly. Find<br />
the statistics for this interval. Manual scaling of your graph is more helpful for doing this<br />
than Autoscaling.<br />
9. To determine the acceleration of the cart, perform a linear fit on the portion of the velocity<br />
vs. time graph during which the velocity is changing smoothly.<br />
Be sure to record the values of force and acceleration for this hanging mass in your lab<br />
notebook.<br />
10. Repeat Steps 7–9 until you have three pairs of force vs. acceleration data that are reasonably<br />
consistent for that mass.<br />
11. Increase the hanging mass and continue until you have acceleration vs. force data for at least<br />
five different hanging masses.<br />
1 If you are using an older Motion Detector without a position switch, the cart needs to be at least 45 cm from the<br />
detector.<br />
Advanced Physics with <strong>Vernier</strong> - Mechanics 4 - 5
Experiment 4<br />
EVALUATION OF DATA<br />
1. To evaluate the relationship between acceleration and force, disconnect the sensors and<br />
choose New from the File menu.<br />
2. Even though you investigated how acceleration responded to changes in the force, in order to<br />
facilitate your analysis of data, plot a graph of force vs. acceleration.<br />
3. If the relationship between force and acceleration appears to be linear, fit a straight line to<br />
your data. If possible, print a copy of your data table and graph.<br />
4. Write the equation that represents the relationship between the force, F , acting on the cart and<br />
the cart’s acceleration, a. Be sure to record the value of the mass of the cart, sensor and any<br />
additional masses you used.<br />
5. Write a statement that describes the relationship between the force acting on the cart and the<br />
cart’s acceleration.<br />
6. Compare your results to those obtained by others in class. What relationship appears to exist<br />
between the slope of the graph of F vs. a and the mass that was accelerated<br />
7. Assuming that the conclusion you reached in Step 6 is correct, express the SI unit of force,<br />
N, in terms of the fundamental units of mass, length and time.<br />
8. Write a general equation that expresses the relationship between the force, mass and<br />
acceleration.<br />
EXTENSION<br />
Examine the force vs. time graph for one of your trials. Explain why the force reading decreases<br />
as the cart is released and accelerates.<br />
Suppose that you had kept the net force acting on the cart the same, but varied the mass instead.<br />
Predict the shape of the graph of acceleration vs. mass. Your answer to the question above<br />
should suggest why it would be very difficult to perform an experiment to test your prediction.<br />
Explain.<br />
4 - 6 Advanced Physics with <strong>Vernier</strong> - Mechanics
<strong>Vernier</strong> Lab Safety Instructions Disclaimer<br />
THIS IS AN EVALUATION COPY OF THE VERNIER STUDENT LAB.<br />
This copy does not include:<br />
• Essential instructor information including discussions on how to lead students<br />
to a successful activity<br />
• Sample data<br />
• Important tips for successfully doing these labs<br />
• Answers to questions and extensions<br />
The complete Advanced Physics with <strong>Vernier</strong> – Mechanics lab manual includes 4 Introductory<br />
Activities and 19 experiments, as well as essential teacher information. The full lab book is<br />
available for purchase at: http://www.vernier.com/cmat/phys-am.html<br />
<strong>Vernier</strong> <strong>Software</strong> & <strong>Technology</strong><br />
13979 S.W. Millikan Way • Beaverton, OR 97005-2886<br />
Toll Free (888) 837-6437 • (503) 277-2299 • FAX (503) 277-2440<br />
info@vernier.com • www.vernier.com