Punch Taverns plc 2011 Annual Report
Punch Taverns plc 2011 Annual Report
Punch Taverns plc 2011 Annual Report
Create successful ePaper yourself
Turn your PDF publications into a flip-book with our unique Google optimized e-Paper software.
20<br />
<strong>Punch</strong> <strong>Taverns</strong> <strong>plc</strong><br />
<strong>Annual</strong> <strong>Report</strong> and Financial Statements <strong>2011</strong><br />
Financial review<br />
Group results have continued to<br />
be impacted by the challenging<br />
market conditions faced across<br />
the sector.<br />
Results for the 52 weeks ended 20 August <strong>2011</strong>:<br />
Underlying results<br />
<strong>2011</strong><br />
£m<br />
2010<br />
£m<br />
Revenue 521.7 559.0<br />
Operating costs (268.0) (271.7)<br />
Share of post-tax profit from joint venture 4.0 3.5<br />
EBITDA 257.7 290.8<br />
Depreciation and amortisation (16.5) (18.7)<br />
Net finance costs (164.9) (182.3)<br />
Profit before taxation 76.3 89.8<br />
Tax (21.3) (26.5)<br />
Net earnings 55.0 63.3<br />
Basic EPS 8.6p 9.9p<br />
The results of the demerged Spirit business for the 49-week<br />
period to 31 July <strong>2011</strong> have been separately disclosed within<br />
the Financial Statements under non-underlying items. Prior year<br />
comparatives have been restated throughout the accounts for<br />
this presentation.<br />
The underlying financial results have been impacted by the<br />
decline in on-trade drinks volumes and the ongoing strategic<br />
disposal programme. Despite the challenging UK consumer<br />
environment and pressure on discretionary spending from<br />
tax rises and inflationary cost pressures, average net income<br />
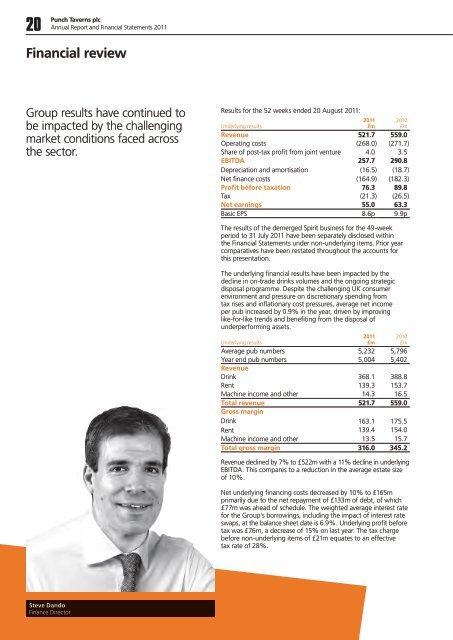
per pub increased by 0.9% in the year, driven by improving<br />
like-for-like trends and benefiting from the disposal of<br />
underperforming assets.<br />
<strong>2011</strong><br />
£m<br />
2010<br />
£m<br />
Underlying results<br />
Average pub numbers 5,232 5,796<br />
Year end pub numbers 5,004 5,402<br />
Revenue<br />
Drink 368.1 388.8<br />
Rent 139.3 153.7<br />
Machine income and other 14.3 16.5<br />
Total revenue 521.7 559.0<br />
Gross margin<br />
Drink 163.1 175.5<br />
Rent 139.4 154.0<br />
Machine income and other 13.5 15.7<br />
Total gross margin 316.0 345.2<br />
Revenue declined by 7% to £522m with a 11% decline in underlying<br />
EBITDA. This compares to a reduction in the average estate size<br />
of 10%.<br />
Net underlying financing costs decreased by 10% to £165m<br />
primarily due to the net repayment of £133m of debt, of which<br />
£77m was ahead of schedule. The weighted average interest rate<br />
for the Group’s borrowings, including the impact of interest rate<br />
swaps, at the balance sheet date is 6.9%. Underlying profit before<br />
tax was £76m, a decrease of 15% on last year. The tax charge<br />
before non-underlying items of £21m equates to an effective<br />
tax rate of 28%.<br />
Steve Dando<br />
Finance Director


