full edition - Academy of Knowledge Process - Webs
full edition - Academy of Knowledge Process - Webs
full edition - Academy of Knowledge Process - Webs

Create successful ePaper yourself
Turn your PDF publications into a flip-book with our unique Google optimized e-Paper software.
International Journal <strong>of</strong> Contemporary Business Studies<br />
Vol: 4, No: 1. January, 2013 ISSN 2156-7506<br />
Available online at http://www.akpinsight.webs.com<br />
IJCBS<br />
VOLUME 4 I NUMBER 1 I JANUARY, 2013<br />
ISSN 2156-7506<br />
International Journal <strong>of</strong><br />
Contemporary Business Studies<br />
In This Issue:<br />
Determinants <strong>of</strong> Manufacturer’s Selection <strong>of</strong> Distributors: A case from Pharmaceutical and Electronic<br />
Appliance Industry<br />
Ahmad Nabeel Siddiquei, Muhammad Ahmad Raza, Pr<strong>of</strong>. Dr. Hayat M. Awan,Khurram Shehzad Bukhari<br />
Women’s Justification <strong>of</strong> White-Collar Crime<br />
Petter Gottschalk<br />
Service Quality Measurement and its evaluation <strong>of</strong> leading Private Banks <strong>of</strong> India in Delhi and NCR<br />
Region: An analytical study<br />
Dr. Saroj Kumar Dash,Dr. Asif Parwez,Mr. Firoz Parwez<br />
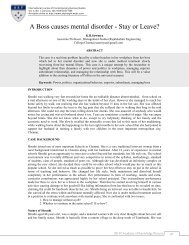
A Boss causes mental disorder - Stay or Leave<br />
K.R.Sowmya<br />
An International Journal Published by<br />
<strong>Academy</strong> <strong>of</strong> <strong>Knowledge</strong> <strong>Process</strong><br />
www.akpinsight.webs.com<br />
2013©<strong>Academy</strong> <strong>of</strong> <strong>Knowledge</strong> <strong>Process</strong><br />
Copyright © 2013 IJCBS<br />
1
International Journal <strong>of</strong> Contemporary Business Studies<br />
Vol: 4, No: 1. January, 2013 ISSN 2156-7506<br />
Available online at http://www.akpinsight.webs.com<br />
Enrich <strong>Knowledge</strong> through Quality Research<br />
International journal <strong>of</strong> Contemporary Business Studies<br />
o<br />
o<br />
o<br />
o<br />
o<br />
publish monthly (one volume per year) fast publication<br />
is open access to the <strong>full</strong> text<br />
has the editorial board & reviewers comprise <strong>of</strong> renowned scholars across the<br />
globe,<br />
has the quality policy includes indexing according to APA manual and its current<br />
status is international.<br />
is indexed & listed in:<br />
One <strong>of</strong> the largest Research Databases <strong>of</strong> world<br />
Indexed in Proquest<br />
Indexed in CABELL-USA<br />
Open Access Policy<br />
This journal provides immediate open access to its content on the principle that making research<br />
freely available to the public supports a greater global exchange <strong>of</strong> knowledge.<br />
Language<br />
Please write your text in good English (American or British usage is accepted, but not a mixture <strong>of</strong><br />
these). Authors who feel their English language manuscript may require editing to eliminate<br />
possible grammatical or spelling errors and to conform to correct scientific English may wish to use<br />
the English Language Editing service<br />
Submissions to this journal proceeds totally online and please submit your article<br />
via:editorijcbs@ohio.usa.com<br />
Copyright © IJCBS<br />
To protect the copyright <strong>of</strong> the journal enable, IJCBS and the Publisher, authors must assign<br />
copyright in their manuscripts to IJCBS. Authors should make sure on submission that the article is<br />
original, is not under consideration for publication by another journal, has not previously been<br />
published elsewhere and that its content has not been anticipated by previous publication.<br />
www.akpinsight.webs.com<br />
2013©<strong>Academy</strong> <strong>of</strong> <strong>Knowledge</strong> <strong>Process</strong><br />
2
International Journal <strong>of</strong> Contemporary Business Studies<br />
Vol: 4, No: 1. January, 2013 ISSN 2156-7506<br />
Available online at http://www.akpinsight.webs.com<br />
Enrich <strong>Knowledge</strong> through Quality Research<br />
International journal <strong>of</strong> Contemporary Business Studies<br />
A journal <strong>of</strong> <strong>Academy</strong> <strong>of</strong> <strong>Knowledge</strong> <strong>Process</strong><br />
Saddal H.A<br />
Editor-in-Chief<br />
Editorial Board<br />
www.akpinsight.webs.com<br />
2013©<strong>Academy</strong> <strong>of</strong> <strong>Knowledge</strong> <strong>Process</strong><br />
3
International Journal <strong>of</strong> Contemporary Business Studies<br />
Vol: 4, No: 1. January, 2013 ISSN 2156-7506<br />
Available online at http://www.akpinsight.webs.com<br />
Enrich <strong>Knowledge</strong> through Quality Research<br />
DR.V.MAHALAKSHMI M.L,MBA,Ph.D<br />
7A, CID Quarters, V.K.Iyer Road,<br />
Mandaveli<br />
www.akpinsight.webs.com<br />
2013©<strong>Academy</strong> <strong>of</strong> <strong>Knowledge</strong> <strong>Process</strong><br />
4
International Journal <strong>of</strong> Contemporary Business Studies<br />
Vol: 4, No: 1. January, 2013 ISSN 2156-7506<br />
Available online at http://www.akpinsight.webs.com<br />
Enrich <strong>Knowledge</strong> through Quality Research<br />
VOLUME 4, NUMBER 1<br />
January, 2013<br />
Contents:<br />
Determinants <strong>of</strong> Manufacturer’s Selection <strong>of</strong> Distributors: A case from Pharmaceutical and Electronic<br />
Appliance Industry<br />
Ahmad Nabeel Siddiquei, Muhammad Ahmad Raza, Pr<strong>of</strong>. Dr. Hayat M. Awan,Khurram Shehzad Bukhari…………………………6<br />
Women’s Justification <strong>of</strong> White-Collar Crime<br />
Petter Gottschalk………………………………………………………………………………………………………………………………………..24<br />
Service Quality Measurement and its evaluation <strong>of</strong> leading Private Banks <strong>of</strong> India in Delhi and NCR<br />
Region: An analytical study<br />
Dr. Saroj Kumar Dash,Dr. Asif Parwez,Mr. Firoz Parwez………………………………………………………………………………….………33<br />
A Boss causes mental disorder - Stay or Leave<br />
K.R.Sowmya…………………………………………………………………………………………………………………………………….……….47<br />
www.akpinsight.webs.com<br />
2013©<strong>Academy</strong> <strong>of</strong> <strong>Knowledge</strong> <strong>Process</strong><br />
5
International Journal <strong>of</strong> Contemporary Business Studies<br />
Vol: 4, No: 1. January, 2013 ISSN 2156-7506<br />
Available online at http://www.akpinsight.webs.com<br />
Determinants <strong>of</strong> Manufacturer’s Selection <strong>of</strong><br />
Distributors:<br />
A case from Pharmaceutical and Electronic Appliance Industry<br />
Ahmad Nabeel Siddiquei a , Muhammad Ahmad Raza b , Pr<strong>of</strong>. Dr. Hayat M. Awan c and<br />
Khurram Shehzad Bukhari d<br />
a,d<br />
Air University Multan Campus, b,d Bahauddin Zakariya University, Multan-Pakistan<br />
ABSTRACT<br />
This case explores the determinants which are considered most important for the<br />
selection <strong>of</strong> Distributors in Pharmaceutical and Electronic Home Appliance Industry. In<br />
today’s competitive market, selecting an appropriate distribution network is considered to<br />
be an essential ingredient <strong>of</strong> success. And Channel management is a key strategic issue<br />
which is concerned with the delivery <strong>of</strong> goods and services to the final consumers. How<br />
manufacturers select distributors who can contribute to distribution efficiency has<br />
become an important issue for channel management. While the last decade has seen large<br />
shifts in manufacturing and distribution practices, there has been very little empirical<br />
research investigating manufacturers’ selection <strong>of</strong> distributors. So recruiting and selecting<br />
a distributor for any company is a key decision that has to be made by a manufacturer in<br />
order to excel in market. This case would discuss all concerned determinants that are<br />
important for the selection <strong>of</strong> Distributor in both <strong>of</strong> the above mentioned industries. They<br />
would be discussed in the form <strong>of</strong> five key constructs which are composed <strong>of</strong> several<br />
other related variables. Then a broad framework would be developed that would lead<br />
towards the selection <strong>of</strong> distributor. A selected candidate must match with the proposed<br />
framework in order to become a channel partner for the company. Importantly, the case is<br />
the first <strong>of</strong> its type that would segregate all important determinants <strong>of</strong> selection on the<br />
basis <strong>of</strong> its criticality.<br />
Keywords: Channel member selection, Distributor, Evaluation criteria, Supply Chain<br />
Management<br />
1. INTRODUCTION<br />
Physical distribution is a collective term for the series <strong>of</strong> inter-related function (principally transport, stock,<br />
storage, goods handling and order processing) involved in physical transfer <strong>of</strong> goods from producer to<br />
consumers. It is only recently that <strong>full</strong> importance has been given to physical distribution in industrial and<br />
business circles. Over the past 30 years, however, managerial attitude towards distribution has been<br />
transformed. Today, distribution is considered to be a major cost center, an important marketing tool and<br />
critical determinant <strong>of</strong> pr<strong>of</strong>itability and competitive advantage. There is much greater acceptance <strong>of</strong> the fact<br />
that ‘processes <strong>of</strong> manufacturing and distribution are complementary’ and that an unsold product, however<br />
produced efficiently, represents a waste <strong>of</strong> resources (Edward, 1982).<br />
Selecting appropriate distributors as a channel partner has been an important prerequisite <strong>of</strong> effective<br />
channel performance. In this era where the concepts <strong>of</strong> supply chain have really emerged, a strong<br />
distribution network is considered to be a key strategic advantage. Except for those with extraordinary<br />
reputation and prestige, manufacturer cannot expect numerous quality distributors to vie for their business.<br />
Manufacturers normally have to seek and recruit distributors by evaluating potential candidates with an<br />
emphasis on performance (Lin & Chen,2008).<br />
2013©<strong>Academy</strong> <strong>of</strong> <strong>Knowledge</strong> <strong>Process</strong><br />
6
International Journal <strong>of</strong> Contemporary Business Studies<br />
Vol: 4, No: 1. January, 2013 ISSN 2156-7506<br />
Available online at http://www.akpinsight.webs.com<br />
The evaluation tasks typically consists <strong>of</strong> identifying the attributes, criteria or factors relevant to the<br />
decision and then measuring or rating eligible distributors on each factor. The manufacturers’ evaluation<br />
reflects an assessment <strong>of</strong> the values/rewards, cost and benefit analysis and risks inherent in the selection<br />
(Lin & Chen, 2008).<br />
In the past, pharmaceutical companies did not adopt supply chain management concepts. However, now<br />
several factors are pressing pharmaceutical companies to change their traditional manners <strong>of</strong> conducting<br />
business (Ahmad, Awan, Raouf, & Sparks, 2009). At the same time Electronic home appliance industry is<br />
one <strong>of</strong> the growing sectors <strong>of</strong> Pakistan economy. This industry has also been <strong>full</strong> <strong>of</strong> stiff competition and<br />
quality standards innovation. (Pearson & Ellram, 1995) worked on Supply Chain <strong>of</strong> Electronic Home<br />
Appliance industry and have argued that the quality <strong>of</strong> Supply chain <strong>of</strong> this industry has been as important<br />
as the quality <strong>of</strong> product. Product availability, capturing strong and reputed distributor and enlarged supply<br />
network has been at the core <strong>of</strong> this industry’s supply chain. So our focus would be to explore and<br />
evaluate all factors that are important in the selection <strong>of</strong> distributors subjected to Pharmaceutical and<br />
Electronic Home Appliance Industry. Finally, recruiting and selecting a reputed distribution is another area<br />
<strong>of</strong> concern and the factors affecting the selection <strong>of</strong> distributor would be discussed. Since it is an area<br />
where there is a lack <strong>of</strong> research and visible research gap.<br />
2. RESEARCH FRAMEWORK<br />
Distributor selection can be studied in terms <strong>of</strong> five Broad constructs. It includes Firm infrastructure,<br />
Marketing Capabilities, Relationship Intensity, Logistic Capabilities and Strategic Issues. The evaluation<br />
task that takes place is to rate each Distributor on above mentioned factors. Whenever the company is<br />
looking to extend its delivery network or if in other case they are required to recruit and select a distributor<br />
to enhance their channel distribution efficiency, these factors come into play before the final decision has<br />
been made. At the same time, each determinant would be identified and segregated based on its criticality<br />
or importance to be present in a potential candidate. There have been few determinants identified by<br />
various researchers in Manufacturer-Distributor relationship like communication, Power, trust and<br />
dependence (Goodman & Dion, 2001). But all such variables explained the importance <strong>of</strong> marketing and<br />
behavioral variables and provide the separation between both <strong>of</strong> them that is somewhat artificial.<br />
(Goodman & Dion, 2001) Also suggests that the trend now-a-days is to provide support to distributor as<br />
their efficiency has been increased with growing market. The decision to make any organization the partner<br />
should be based on the performance <strong>of</strong> entire channel that would be achieved in the future (Cavusgil, Yeoh,<br />
& Mitri, 1995), (Rosenbloom, 2004). A <strong>full</strong>-fledged eligibility and selection criterion has to be drawn by<br />
the manufacturer prior to their selection. Irrespective <strong>of</strong> how much control and efficiency a manufacturer<br />
has in selection decision, yet they have to involve selection criterion in order to build positive synergy and<br />
collaboration between respective entities (Merritt & Newell, 2001), (Rosenbloom, 2004).<br />
2.1 Firm Infrastructure<br />
The benefits <strong>of</strong> distributor would also be increased through overall channel performance increase<br />
(Cavusgil, Deligonul, & Zhang, 2004), (Kalafatis, 2000). This extent <strong>of</strong> inter-dependability between<br />
channel members gives the idea about the importance <strong>of</strong> recruiting capable and competent distributor in a<br />
particular market (Merritt & Newell, 2001) in countries like Pakistan, where the product availability could<br />
turn out to be critical in the final purchase decision <strong>of</strong> the consumer.<br />
The business situation <strong>of</strong> potential supply/channel chain member determines the possible match between<br />
manufacturer and potential candidate (Braglia & Petroni, 2000);(Mummalaneni, Dubas, & Chao, 1996).<br />
Recently there is an immense revolution in science and technological field which has affected the<br />
pharmaceutical industry to a greatest extent. So this demand adjustment in their supply chain as well (Ricci<br />
& Fraser, 2006). Due to discovery and introduction <strong>of</strong> various pharmacy products, there is all together new<br />
introduction <strong>of</strong> different market and consumers which caused the supply networks to adjust as well. Prior to<br />
selecting a distributor, a manufacturer takes a reasonable time to inquire about the potential distributor and<br />
this inquiry could be from the past and present customers, its operational market or even from the<br />
competitors (Cavusgil, Yeoh, & Mitri, 1995). So it has to be a point <strong>of</strong> strong focus for the manufacturer<br />
before the selection decision. Derived from previous channel and supply chain member selection literature,<br />
2013©<strong>Academy</strong> <strong>of</strong> <strong>Knowledge</strong> <strong>Process</strong><br />
7
International Journal <strong>of</strong> Contemporary Business Studies<br />
Vol: 4, No: 1. January, 2013 ISSN 2156-7506<br />
Available online at http://www.akpinsight.webs.com<br />
the firm infrastructure variables included in this research are: “management ability, financial strength,<br />
physical facilities and experiences.” (Lin & Chen, 2008).<br />
The management ability <strong>of</strong> a potential distributor is considered to be very critical for the selection <strong>of</strong><br />
distributor by manufacturer (Cavusgil, Yeoh, & Mitri, 1995), (Rosenbloom, 2004). Management ability<br />
relates to quality <strong>of</strong> management and its core competencies regarding its market, managerial and strategic<br />
operations. (Braglia & Petroni, 2000), (Rosenbloom, 2004) believes that a channel/supply chain member<br />
chosen by the manufacturer should only be considered if its management capabilities are strong enough. A<br />
number <strong>of</strong> researchers are <strong>of</strong> the view that financial strength <strong>of</strong> the distributor is also very important in<br />
selecting a channel/supply partner (Braglia & Petroni, 2000), (Sink & Langley, 1997), (Yeoh & Calantone,<br />
1995). Financial strength provides evidence <strong>of</strong> the prospective channel member’s overall abilities, in<br />
addition to information concerning specific channel functions (Rosenbloom, 2004). The published figures<br />
could be an important source to attain financial figures <strong>of</strong> distributors yet the information could also be<br />
obtained by frequent visits to their business setup and from third party opinion (Cavusgil, Yeoh, & Mitri,<br />
1995).<br />
If the distributor has an experience in the market or in the same industry its competitive position would be<br />
increased to a great extent (Kaleka, 2002), knowledge/information management, uncertainty reduction, and<br />
resource mobilization are the benefits achieved through useful past experience (Shankar, 1999). This is the<br />
reason numerous researchers proved that the past experience is an important factor in selecting a<br />
manufacturers’ channel partner (Abratt & Pitt, 1989), (Braglia & Petroni, 2000), (Fram, 1992). Number <strong>of</strong><br />
researches suggested that the physical facilities employed by the distributor in Electronic Home Appliance<br />
Industry greatly affect Channel member selection decision (Abratt & Pitt, 1989), (Braglia & Petroni, 2000),<br />
(Cavusgil, Yeoh, & Mitri, 1995). Physical facilities adopted by the distributors include Management<br />
Information Systems, Hi-tech equipments and logistic support gives a strong indication that the firm is<br />
capable enough to carry out Supply/Channel tasks (Braglia & Petroni, 2000), (Kaleka, 2002). Empirical<br />
evidence shows that manufacturers across South Asia and Middle East strongly emphasize on the physical<br />
facilities while they are selecting a distributor (Abratt & Pitt, 1989). Based on the academic work presented<br />
above there is a strong indication that the Firm’s Infrastructure is very valuable while selecting a<br />
distributor.<br />
2.2 Marketing Capabilities<br />
Manufacturers are increasingly relying on the distributors for the various channel and marketing activities<br />
like Promos and Merchandising (Merritt & Newell, 2001) in order to stay focused on core competencies<br />
and resource mobilization (Sink & Langley, 1997). In this way the distributors also act as a marketing<br />
partner for the firm as it provides important marketing information and trends needed to be understood by<br />
the manufacturer as they are supposed to remain vigilant towards the changing customer requirement<br />
(Paun, 1997) while achieving satisfaction <strong>of</strong> customers(Mudambi & Aggarwal, 2003).<br />
The high percentage <strong>of</strong> firms’ overall sale has been done by the distributor and for this the support from the<br />
manufacturing company has been increased now-a-days (Goodman & Dion, 2001). Marketing capabilities<br />
is the collective ability <strong>of</strong> the firm to apply the skills, knowledge, resources and capital to the market<br />
related need <strong>of</strong> the businesses in order to capture highest market share (Weerawardena & O’Cass, 2004).<br />
Distributor/manufacturer relationships are governed by contract which stipulates the distributor margin and<br />
requires the distributor to implement various trade and consumer promotional activities for the<br />
manufacturer (Aman & Hopkinson, 2010). The core <strong>of</strong> this capability lies in the accuracy to reach the<br />
target market efficiently and at the right time (Vorhies & Harker, 2000). The target market scenario is<br />
important as the customers must be those to whom the product is meant for. (Shipley, Cook, & Barnett,<br />
1989), (Weerawardena & O’Cass, 2004) argues that in order to have this the behavior <strong>of</strong> the distributor<br />
must be such that they are willing to understand the customers and market needs prior to their competitors.<br />
According to channel member selection literature, “marketing capabilities generally include sales strength,<br />
market coverage, and product compatibility.” (Lin & Chen, 2008).<br />
High majority <strong>of</strong> firms considers selling ability <strong>of</strong> the distributor as their highest priority because at the end<br />
<strong>of</strong> it is the selling and capturing market share that matters (Cavusgil, Yeoh, & Mitri, 1995), (Yeoh &<br />
2013©<strong>Academy</strong> <strong>of</strong> <strong>Knowledge</strong> <strong>Process</strong><br />
8
International Journal <strong>of</strong> Contemporary Business Studies<br />
Vol: 4, No: 1. January, 2013 ISSN 2156-7506<br />
Available online at http://www.akpinsight.webs.com<br />
Calantone, 1995). A manufacturer will observe detailed sales performance information from a prospective<br />
channel member to get a firsthand view <strong>of</strong> its effectiveness (Mummalaneni, Dubas, & Chao, 1996),<br />
(Rosenbloom, 2004).<br />
Goodman & Dion (2001) provides us with the evidence that highly devoted distributor comes with the<br />
market intelligence based on the strength in their relationship. Even more the willingness <strong>of</strong> distributor in<br />
distributing only one manufacturers’ family <strong>of</strong> product depends on the commitment <strong>of</strong> manufacturer in<br />
distributor’s organization and its benefits (Goodman & Dion, 2001).<br />
Marketing competence is also thought <strong>of</strong> as a distributors’ ability to cover the maximum geographical<br />
territory (Braglia & Petroni, 2000), (Stern, El-Ansary, & Coughlan, 1996). It would help in achieving high<br />
volume <strong>of</strong> sales, gaining market share, economies <strong>of</strong> scale and scope, market penetration, high product<br />
availability and finally attaining high brand reputation as far as the network and availability is concerned<br />
(Cavusgil, Yeoh, & Mitri, 1995), (Rosenbloom, 2004), (Yeoh & Calantone, 1995).<br />
Marketing capabilities is also measured by the fact that how the manufacturer is evaluating the product line<br />
<strong>of</strong> distributor (Cavusgil, Yeoh, & Mitri, 1995). If the distributor is carrying similar products or the products<br />
having the same distribution mechanism than it would be a great plus for the distributor. This concept has<br />
also been endorsed by various other researchers. The distributor has the responsibility to sale and delivers<br />
the goods to all economically feasible outlets in the agreed locality/market. “In return, the distributor<br />
receives the manufacturer goods exclusively in a particular area. This exclusivity renders the manufacturer<br />
highly dependent upon the efforts <strong>of</strong> distributors to maximize sales. This dependence is mitigated, however,<br />
by contractual terms and the manufacturer’s brand power. In turn distributors accept control which is<br />
mitigated by exclusive access to a geographic market with respect to popular and well supported brands”<br />
(Aman & Hopkinson, 2010).<br />
Mentioning the fact that manufacturers’ prefer the distributors who are experienced enough in carrying<br />
complementary and compatible products instead the substitute (Fram, 1992), (Rosenbloom, 2004), (Yeoh<br />
& Calantone, 1995). Summing up the idea, the manufacturer would give importance to the distributor<br />
having a strong market competence and this fact is also been supported by (Berman, 1999).<br />
2.3 Relationship intensity<br />
The impact <strong>of</strong> commitment, trust and relationships has a meaningful impact on the strong and long-term<br />
relationship between channel partners (Frazier, 1999). Channel management research has now been<br />
emphasizing a lot on managing the relationships between people, firms and organizations performing<br />
distribution functions, it would help in creating value for the customers providing the product at right time<br />
and place (Weitz & Jap, 1995). ). There have been few determinants identified by various researchers in<br />
Manufacturer-Distributor relationship like communication, Power, trust and dependence (Goodman &<br />
Dion, 2001). The development <strong>of</strong> a manufacturer’s relationship with its channel members greatly affects<br />
channel cooperation, channel efficiency and the manufacturer’s competitive advantage (Kaleka, 2002).<br />
However this concept is growing with the growing concept <strong>of</strong> relationship marketing where even the<br />
exchanges are nominated as relationship exchange (Weitz & Jap, 1995). Therefore, manufacturers will<br />
evaluate relationship factors care<strong>full</strong>y when selecting channel/supply chain members (Mummalaneni,<br />
Dubas, & Chao, 1996), (Min, 1993). However, these relationship-related factors, within the context <strong>of</strong><br />
channel member selection, are not sufficiently discussed in the current literature.<br />
Extant research has used terms such as relationship strength, relationship quality, relationship intensity, and<br />
relationship magnitude when describing inter-firm relationships (Bove & Johnson, 2001), (Golicic, Foggin,<br />
& Mentzer, 2003), (Rindfleisch & Moorman, 2001). A positive link between relationship intensity and<br />
channel outcomes has also been supported (Santoro, 2000). Following on these findings, we propose that<br />
the construct “relationship intensity” is an important factor for a manufacturer’s selection <strong>of</strong> distributors.<br />
This construct includes the distributor’s enthusiasm to build a relationship, commitment, and willingness to<br />
share information as well as the manufacturer’s familiarity with the distributor. At the same time one could<br />
really argue that a good distributor turns out to be a critical success factor for the manufacturer. (Goodman<br />
2013©<strong>Academy</strong> <strong>of</strong> <strong>Knowledge</strong> <strong>Process</strong><br />
9
International Journal <strong>of</strong> Contemporary Business Studies<br />
Vol: 4, No: 1. January, 2013 ISSN 2156-7506<br />
Available online at http://www.akpinsight.webs.com<br />
& Dion, 2001) argues that securing distributor commitment is a difficult task as they act as an independent<br />
business entity. Each distributor is an independent, appointed intermediary who performs the responsibility<br />
<strong>of</strong> purchasing goods from the manufacturers, selling and delivering to wholesalers and also to some<br />
retailers, most notably urban retailers in case <strong>of</strong> Pakistan(Aman & Hopkinson, 2010).<br />
Scholars suggested that firms should seek distributors who show enthusiasm for the contract and who are<br />
hungry for success (Anderson & Weitz, 1991), (Yeoh & Calantone, 1995), (Rosenbloom, 2004),<br />
(Coughlan, Anderson, Stern, & El-A, 2001) also emphasize the value <strong>of</strong> a prospective channel member’s<br />
enthusiasm and aggressiveness, which is believed to be closely related to long-term success in handling the<br />
manufacturer’s products. Therefore, manufacturers would prefer distributors who are enthusiastic to<br />
cooperate.<br />
Commitment is considered crucial to the long-term success <strong>of</strong> a business relationship, providing the basis<br />
for a cooperative spirit in marketing channel relationships, leading to an overall stronger partnership<br />
(Andaleeb, 1996). A manufacturer’s acquaintance/familiarity with the prospective distributor is considered<br />
important; as such familiarity can be positively related to its expectation <strong>of</strong> future coordination with the<br />
distributor in a channel relationship (Celly & Frazier, 1996). Manufacturers are more likely to choose<br />
distributors with whom they are familiar or who are recommended by channel customers (Shipley, Egan, &<br />
Edgett, 1991). Likelihood <strong>of</strong> a successful partnership increases as the above qualities enhance mutual<br />
communication and relationship maintenance.<br />
2.4 Logistic Capabilities<br />
A good distribution network considers Logistics as a source <strong>of</strong> core strategic advantage (Novack, Rinehart,<br />
& Langley, 1994), (Fawcett, Stanley, & Smith, 1997), (Zhao, Dro ¨ge, & Stank, 2001). A well-managed<br />
logistic services handled by a distributor not only brings financial advantage (Cost Saving) but also the<br />
operational efficiency, flexibility and value <strong>of</strong> the entire supply channel (Fuller, O’Conor, & Rawlinson,<br />
1993). A well-managed channel requires that its members be equipped with good logistics capabilities.<br />
(Bowersox, Closs, & Stank, 1999), (Day, 1994), (Desarbo, Benedetto, Song, & Sinha, 2005), (Lynch,<br />
Keller, & Ozment, 2000) created a strong relationship between Firms’ logistics capabilities and its<br />
performance from the literature <strong>of</strong> marketing, logistics and Supply Chain.<br />
There is a diverse academic research available on logistic capability and firms’ performance. “Derived<br />
from (Fawcett, Stanley, & Smith, 1997), (Morash, Droge, & Vickery, 1996) and (Zhao, Dro ¨ge, & Stank,<br />
2001), inventory management, delivery efficiency, flexibility, innovation, logistics cost, and customer<br />
service are included in this research”.<br />
For any distributor the primary operational responsibility is to manage its inventory providing the highest<br />
service level and minimum inventory holding cost(Lambert, Cooper, & Pagh, 1998), and it is <strong>of</strong>ten<br />
considered to be the foremost and fundamental factor <strong>of</strong> firms’ logistic capability (Looman, Ruffni, & de<br />
Boer, 2002), (Svensson, 2003). Researchers studied the efficiency to deliver products as another important<br />
aspect <strong>of</strong> firms’ logistic capability (Daugherty, Stank, & Ellinger, 1998), (Fawcett, Stanley, & Smith,<br />
1997), (Morash, Droge, & Vickery, 1996). Whenever we talk about delivery efficiency it means the time<br />
between order taking and product delivery must be minimized and order quantity must be accurate and<br />
precise (Morash, Droge, & Vickery, 1996), and these capabilities are important for supply chain member<br />
selection (Cavusgil, Yeoh, & Mitri, 1995), (Da Silva, Davies, & Naude ´, 2002). (Fawcett, Stanley, &<br />
Smith, 1997), (Vickery, Calantone, & Dro ¨ge, 1999) cited that ” logistics system’s ability to accommodate<br />
special or non-routine requests and provide rapid response to customer requests, indicates a firm’s<br />
competence to respond to the needs <strong>of</strong> markets, and is regarded as an important sign <strong>of</strong> logistics<br />
performance.” Manufacturers’ value flexibility, when selecting channel/supply chain members (Da Silva,<br />
Davies, & Naude ,2002), (Sink & Langley, 1997). Organizations’ success lies in the level <strong>of</strong> its innovation<br />
(Calantone, Cavusgil, & Zhao, 2002), (Mone, McKinley, & Barker, 1998) and the effective performance <strong>of</strong><br />
its logistics (Chapman, Soosay, & Kandampully, 2003), (Fawcett, Stanley, & Smith, 1997), (Flint, Larsson,<br />
Gammelgaard, & Mentzer, 2005).<br />
2013©<strong>Academy</strong> <strong>of</strong> <strong>Knowledge</strong> <strong>Process</strong><br />
10
International Journal <strong>of</strong> Contemporary Business Studies<br />
Vol: 4, No: 1. January, 2013 ISSN 2156-7506<br />
Available online at http://www.akpinsight.webs.com<br />
A distributor must be willing to enhance the value-added content <strong>of</strong> its logistic services and it would be a<br />
source <strong>of</strong> competitive advantage for the organization (Fawcett, Stanley, & Smith, 1997), (Flint, Larsson,<br />
Gammelgaard, & Mentzer, 2005), (Morash, Droge, & Vickery, 1996). So the innovation becomes the<br />
important factor for the selection <strong>of</strong> distributor (Fawcett, Stanley, & Smith, 1997). Customer service is<br />
another aspect <strong>of</strong> logistic capability <strong>of</strong> the firm(Fawcett, Stanley, & Smith, 1997), (Mentzer, Flint, & Hult,<br />
2001), (Morash, Droge, & Vickery, 1996) and channel member selection (Min, 1993), provided that the<br />
organization considers the high quality <strong>of</strong> customer service as a core responsibility <strong>of</strong> their distribution<br />
network, given the tendency to view customer service orientation as a principal determinant <strong>of</strong> channel<br />
activities and the heightened attention to the importance <strong>of</strong> service quality in many supply chain practices<br />
(Katsikeas, Paparoidamis, & Katsikeas, 2004).<br />
2.5 Strategic Issues<br />
Various practitioners believe that the distributor to be selected must have a strategic importance for the<br />
manufacturer. A manufacturer has interests associated with the distributor prior to the selection. It could be<br />
in the form <strong>of</strong> achieving high market share, to counter any strategy <strong>of</strong> the competitor or making a high<br />
pr<strong>of</strong>ile organization as their channel partner. The interests could vary but these issues are in their mind and<br />
they become cautious and analytical in their approach. Sometimes a cultural match is important between<br />
both parties. So it becomes easier to carry out business between them. A positive synergy usually develops<br />
if a culture is being matched.<br />
3. CONCEPTUAL FRAMEWORK<br />
Figure 1 presents the research framework delineating the four determinant constructs that influence<br />
manufacturers’ distributor selection. The constructs are drawn from the literature as well as from the insight<br />
<strong>of</strong> practitioners.<br />
Firm Infrastructure<br />
Marketing<br />
Capabilities<br />
Relationship Intensity<br />
Logistics Capabilities<br />
Determinants <strong>of</strong> Manufacturers’<br />
Selection <strong>of</strong> Distributor<br />
Strategic Issues<br />
Figure 1: The Conceptual Framework<br />
(Adapted from Lin and Chen, 2001)<br />
2013©<strong>Academy</strong> <strong>of</strong> <strong>Knowledge</strong> <strong>Process</strong><br />
11
International Journal <strong>of</strong> Contemporary Business Studies<br />
Vol: 4, No: 1. January, 2013 ISSN 2156-7506<br />
Available online at http://www.akpinsight.webs.com<br />
4. RESEARCH METHODOLOGY<br />
Measure development<br />
And pretest<br />
Item Generation from literature<br />
Expert Opinions<br />
Pre-Test<br />
Two stages main<br />
Survey procedure<br />
Survey for Exploratory Analysis Exploratory<br />
Analysis<br />
Survey for Confirmatory Analysis<br />
Confirmatory Analysis<br />
Source: Hsu, Kannan, Leong and Tan, 2006;”Supplier Selection Construct: Instrument development and validation”<br />
The figure shows two steps procedure that is used to develop survey instrument and to test the distributor<br />
selection constructs. The first step, measure development and pretest, was used to develop and validate the<br />
survey instrument, while the second step two stages main survey procedure, was used to test and validate<br />
the research construct Items generation was meant to identify the factors that are important for the selection<br />
<strong>of</strong> distributor from the literature <strong>of</strong> Marketing, Supply Chain management and Logistics. Expert opinions<br />
were taken from three managers <strong>of</strong> pharmaceutical distribution center <strong>of</strong> three different companies and<br />
three managers from three different companies <strong>of</strong> electronic home appliances industry. Pretesting would be<br />
done from another five managers <strong>of</strong> respective industries .Surveys for exploratory and confirmatory<br />
analysis would involve data collection from the final sample <strong>of</strong> five different companies <strong>of</strong> respective<br />
industries to confirm and test the validity <strong>of</strong> research construct across the industry. The data was collection<br />
through the questionnaire using deductive and inductive approach, based on the literature and insights<br />
drawn from the experts’ opinion.<br />
Sampling was done based on the organizations’ performance and its current market share relevant to both<br />
industries. So, all the ten manufacturers’ in the sample are the leading organizations <strong>of</strong> their industries thus<br />
making the research findings more valid, relevant and authentic.<br />
The sampling frame consisted <strong>of</strong> 10 manufacturers representing five from each industry. The sample<br />
represented both national and international organizations <strong>of</strong> both industries. Two Local and three foreign<br />
manufacturers were picked for the sample from pharmaceutical industry. Similarly, two Local and three<br />
foreign invested companies were chosen for the same in Electronic home appliance industry.<br />
5. ELECTRONIC HOME APPLIANCE INDUSTRY ANALYSIS<br />
Our empirical findings are quite supportive <strong>of</strong> the conceptual framework to explore dimensions <strong>of</strong><br />
distributors’’ selection. The five key constructs in our model all have positive and crucial for the selection<br />
<strong>of</strong> distributor. As shown above, are the factors that are extracted from the literature and validated through<br />
the factor analysis. It extracted five constructs. As explained earlier the factor weight <strong>of</strong> 0.60 has been as a<br />
minimum cut-<strong>of</strong>f value which makes the criteria more strict and valid. The prior research that been done<br />
related to this topic set the criteria <strong>of</strong> 0.50 (Chris and Len, 2008) making our research results even more<br />
authentic.<br />
For the first construct i.e. Firm Infrastructure we have four items that must be present in a potential<br />
distributor in order to get selected as a channel/supply partner. The first item in it refers to the management<br />
capability <strong>of</strong> the firm. So we could safely say that the management quality in terms <strong>of</strong> their personnel<br />
2013©<strong>Academy</strong> <strong>of</strong> <strong>Knowledge</strong> <strong>Process</strong><br />
12
International Journal <strong>of</strong> Contemporary Business Studies<br />
Vol: 4, No: 1. January, 2013 ISSN 2156-7506<br />
Available online at http://www.akpinsight.webs.com<br />
repute, vision and market standing has been considered very important from the manufacturer’s view point.<br />
The operational competency also lies in the same item and has been given the same response therefore. As<br />
we found in previous literatures that supply chain quality in Electronic home Appliance Industry is as<br />
important as the product quality. Therefore, we found a valid result to strengthen our argument. The second<br />
construct correspond to the marketing capabilities <strong>of</strong> the distributor. The firms’ reputation in the market,<br />
the ability to sale goods and the geographical coverage are considered to be the most important for the<br />
selection criteria <strong>of</strong> distributor. Obviously, it is the sale that matters for the manufacturer because ultimately<br />
it would lead towards the highest gain <strong>of</strong> market share. Therefore, these industry manufacturers’ prefer<br />
those distributor whom they think are gutsy enough to increase their sale graphs. The third construct that<br />
was explored in the literature and proposed by this research is about the Relationship intensity between<br />
both channels partner both business and strategic relations are a part <strong>of</strong> it. They are measured through<br />
information sharing, enthusiasm to build relations, commitment to sales, ordering and payments, and finally<br />
the familiarity <strong>of</strong> both parties. All the factors are critical to selection decision except for familiarity and<br />
information sharing which has been proved by this research. The results would lead us to explain that even<br />
if the firms’ are in business relation with each other for the first time, it does not matter. Rather the<br />
relationship would progress in a positive way if commitments related to sales, ordering and payments are<br />
fulfilled and at the same time, there must be a strong willingness to build relationship for a longer period <strong>of</strong><br />
time. As it would, uplift the trust between both channel members.<br />
The fourth construct was related to the Logistic capabilities <strong>of</strong> the distributor. Inventory management,<br />
efficient delivery and accommodation on non-routine orders are first three items comprising this factor. The<br />
remaining are the increasing value-added services and logistics cost reduction. All the factors related to this<br />
constructed derived from the literature has been proved in this research. It shows very high priority given to<br />
the Logistic abilities <strong>of</strong> distributor. The findings <strong>of</strong> this construct complemented the fact that the valueadded<br />
by one channel member would increase the value <strong>of</strong> entire supply channel. Similarly, the efforts to<br />
reduce the cost <strong>of</strong> distribution by the distributor does have a positive influence on the selection decisions <strong>of</strong><br />
manufacturer’s <strong>of</strong> this industry. There has been enough evidence to say that the Electronic home appliance<br />
industry manufacturer’s focuses on the distributor logistic power. Because the supply chain value could be<br />
increased dramatically if the distributor has the mentioned capabilities in him.<br />
Items<br />
INF1<br />
INF2<br />
INF3<br />
INF4<br />
MKT1<br />
MKT2<br />
MKT3<br />
REL1<br />
REL2<br />
REL3<br />
LOG1<br />
LOG2<br />
LOG3<br />
LOG4<br />
LOG5<br />
STR1<br />
Firm<br />
Infrastructure<br />
.674<br />
.947<br />
.992<br />
.806<br />
Table 1 Rotated factor loadings for the final 16-items instrument<br />
Market<br />
Capabilities<br />
.830<br />
.806<br />
.977<br />
Relationship<br />
Intensity<br />
STR2<br />
Extraction Method: Principal Component Analysis<br />
Rotation Method: Varimax with Kaiser Normalization<br />
Logistic<br />
Capabilities<br />
Strategic<br />
Issues<br />
Cronbach’s<br />
Alpha<br />
.90<br />
.88<br />
.885<br />
.706<br />
.889 .83<br />
.888<br />
.745<br />
.967<br />
.780<br />
.885<br />
.89<br />
.953<br />
.889 .90<br />
2013©<strong>Academy</strong> <strong>of</strong> <strong>Knowledge</strong> <strong>Process</strong><br />
13
International Journal <strong>of</strong> Contemporary Business Studies<br />
Vol: 4, No: 1. January, 2013 ISSN 2156-7506<br />
Available online at http://www.akpinsight.webs.com<br />
This case provides us with another dimension <strong>of</strong> distributor selection and that is the Strategic issue<br />
concerning the selection <strong>of</strong> distributor. Although this construct has been included in Supplier selection<br />
researches but for the very first time it is the part <strong>of</strong> distributor selection research. It has also been proven<br />
that any distributor who is considered to be strategically important for a manufacturer in a particular market<br />
does have every possibility to be selected as channel member. It is so because the manufacturer could gain<br />
the competitive advantage through its supply network.<br />
The proposed framework comprised <strong>of</strong> five constructs i.e. firm infrastructure, marketing capabilities,<br />
relationship intensity, logistics capabilities and strategic issues hence been significantly supported by the<br />
manufacturers’ <strong>of</strong> electronic home appliance industry.<br />
Multivariate Analysis has been applied to judge the relation <strong>of</strong> Manufacturer’s firm size and Nationality<br />
(foreign invested or domestic) with the selection decision.<br />
Table 2 Multivariate Analysis<br />
Source Dependent Variable Type III Sum <strong>of</strong> Squares df Mean Square F Sig.<br />
Firm_size mkt_capa 3.654 1 3.654 .442 .626<br />
Firm_infra 1.520 1 1.520 6.955 .231<br />
Log_cap_str .013 1 .013 .006 .950<br />
relation_int 1.864 1 1.864 .448 .625<br />
Sal_turn mkt_capa 2.421 1 2.421 .293 .684<br />
Firm_infra 6.380 1 6.380 29.197 .116<br />
Log_cap_str .048 1 .048 .022 .906<br />
relation_int .177 1 .177 .042 .871<br />
Man_nat mkt_capa .262 1 .262 .032 .888<br />
Firm_infra_str .472 1 .472 2.161 .380<br />
Log_cap 5.554 1 5.554 2.563 .355<br />
relation_int 6.547 1 6.547 1.573 .429<br />
It was found to have no significant impact on distributor selection decision. This indicates us that there is<br />
no difference between manufacturers’ <strong>of</strong> different sizes and nationalities for the distributor selection. The<br />
result is reinforcing the cross-national comparative results <strong>of</strong> (Shipley D. , 1984) and (Abratt & Pitt, 1989).<br />
5.1 Critical Selection Factor Structure<br />
Table 3 below shows the critical selection factor structure comprising the 21 factors, sorted in descending<br />
order <strong>of</strong> criticality and stratified into three tiers representing stages <strong>of</strong> priorities emphasis. Tier I consists <strong>of</strong><br />
the 5 factors and their presence in a potential distributor are most critical to its selection. Tier II consists <strong>of</strong><br />
11 factors which plays a supporting role in manufacturers’ choice <strong>of</strong> distributor. Whereas, Tier III<br />
constitutes <strong>of</strong> 6 factors and are described as the maintaining factors to the selection <strong>of</strong> distributor. It is<br />
important here to describe the Critical, Supporting and Maintaining factors as to their level <strong>of</strong> importance to<br />
a successful selection <strong>of</strong> distributor by the manufacturer approach devised by Thiagarajan and Zairi (1998)<br />
and again validated by Awan and Bukhari (2008):<br />
• Critical: Factors those are critical and absolutely essential. There is a good chance that an organization<br />
will not be selected as a Channel partner if the Manufacturer does not find these factors in potential<br />
Distribution candidate.<br />
• Supporting: Factors those are important but not absolutely essential. There will be a chance that an<br />
organization may be selected as a channel partner in spite <strong>of</strong> the absence <strong>of</strong> such factors, but the potential<br />
distributor candidate may have to address these issues in future in order to maintain the efficient supply<br />
chain process.<br />
2013©<strong>Academy</strong> <strong>of</strong> <strong>Knowledge</strong> <strong>Process</strong><br />
14
International Journal <strong>of</strong> Contemporary Business Studies<br />
Vol: 4, No: 1. January, 2013 ISSN 2156-7506<br />
Available online at http://www.akpinsight.webs.com<br />
• Maintaining: Factors are <strong>of</strong> minor importance. These factors will not seriously affect the distributor<br />
selection decision process.<br />
The critical quality factor structure suggests that in Tier-I there are factors related to the reputation <strong>of</strong> the<br />
potential distributor in the market as well as its commitment to ordering and payment procedures. Both<br />
these variables refer to the factor <strong>of</strong> relationship intensity between the manufacturer and the distributor. In<br />
addition to this Tier-I also presents the importance <strong>of</strong> value added logistic services considered by the<br />
manufacturer and the cultural match that has to be made between both the organizations. So, this tier<br />
validating the constructs <strong>of</strong> relationship intensity and logistic capabilities founded through literature.<br />
Table 3 Critical Indices <strong>of</strong> selection Factors in Electronic Home Appliance Sector<br />
Index Values<br />
Selection Factors<br />
Tier I<br />
0.233333333<br />
0.233333333<br />
0.233333333<br />
0.233333333<br />
0.233333333<br />
Tier II<br />
0.466666667<br />
0.466666667<br />
0.466666667<br />
0.466666667<br />
0.466666667<br />
0.466666667<br />
0.466666667<br />
0.466666667<br />
0.466666667<br />
0.466666667<br />
0.466666667<br />
Tier III<br />
0.700000000<br />
0.700000000<br />
0.700000000<br />
0.700000000<br />
0.700000000<br />
Critical<br />
The distributor has good reputation in market<br />
The distributor is committed to ordering and payment procedure<br />
You company is familiar with the distributor<br />
The distributor is aggressive in increasing the value added contents <strong>of</strong> logistics<br />
The distributor has cultural match with the company<br />
Supporting<br />
The distributor has good management capabilities<br />
The distributor is in good financial position<br />
The distributor is equipment with good physical facilities<br />
The distributor covers the markets that your company wants to reach<br />
The distributor carries product that do not directly compete with your products<br />
The distributor is enthusiastic to build a relationship with your company<br />
The distributor is committed to minimum sales quota<br />
The distributor is willing to share information with company<br />
The distributor is able to accommodate special/non-routine request<br />
The distributor is able to minimize logistics costs<br />
The distributor provides good customer service<br />
Maintaining<br />
The distributor is experienced in distributing electronics related product<br />
The distributor has good sales competence<br />
The distributor manages inventory well<br />
The distributor delivers goods efficiently<br />
The distributor has strategic importance to firm<br />
The electronic home appliance manufacturer in Pakistan considers that the presences <strong>of</strong> these factors are<br />
extremely important to be present in the potential distributor in order to become the permanent supply<br />
chain partner. Tier II presents the highest number <strong>of</strong> factors that must be present in a distributor in order to<br />
be selected as supply member. The managerial capabilities, financial strength, market coverage and<br />
physical facilities owned by the distributor are important for its selection. Manufacturers consider that that<br />
the management must be operationally competent and quality oriented.<br />
In the same way, the financial strength gives us the overall idea about the prospective member in terms <strong>of</strong><br />
its Business pr<strong>of</strong>ile and assets owned by them. So both these factors are complementing each other.<br />
Manufacturers’ <strong>of</strong> electronics do consider the importance <strong>of</strong> enthusiasm present in potential distributor to<br />
build strong and long-term relationship. So they consider a need to share information about market and<br />
future strategies. Tier-II also involves the commitment <strong>of</strong> distributor to meet sales targets. This is very<br />
2013©<strong>Academy</strong> <strong>of</strong> <strong>Knowledge</strong> <strong>Process</strong><br />
15
International Journal <strong>of</strong> Contemporary Business Studies<br />
Vol: 4, No: 1. January, 2013 ISSN 2156-7506<br />
Available online at http://www.akpinsight.webs.com<br />
much evident even from the literature that the manufacturer would favor that party whose has the ability to<br />
increases the sales figures, accommodating non-routine requests and ability to minimize the logistic cost.<br />
Tier-III consists <strong>of</strong> 5 determinants that are considered as maintaining factors for the selection <strong>of</strong> distributor.<br />
It involves the experience in carrying related products, the inventory management, sales competence,<br />
product delivery and strategic importance.<br />
6. PHARMACEUTICAL INDUSTRY ANALYSIS<br />
A scientific and technological revolution is sweeping the pharmaceutical industry that enables drug makers<br />
to produce pr<strong>of</strong>itable new medicines. But revolutions demand adjustments, and this revolution requires the<br />
supply chains to adjust with it. The pharmaceutical companies who have long been considered the laggards<br />
in supply chain management. Therefore, the findings determined from this industry would be very<br />
interesting. The pharmaceutical manufacturers’ in Pakistan considers the importance <strong>of</strong> strong Firm<br />
Infrastructure in their channel members. Prior to selection, a potential candidate is evaluated on the<br />
parameters <strong>of</strong> its Managerial capabilities, financial strength, Experience and availability <strong>of</strong> physical<br />
facilities which is in complete accordance with our proposed framework and hence validated through the<br />
extraction <strong>of</strong> factor analysis.<br />
Table 4 Rotated factor loadings for the final 16-items instrument<br />
Item<br />
Firm<br />
Infrastructure<br />
Marketing<br />
Capabilities<br />
Relationship<br />
Intensity<br />
Logistic<br />
Capabilities<br />
Cronbachs’<br />
Alpha<br />
INF1<br />
INF2<br />
INF3<br />
INF4<br />
.940<br />
.918<br />
.944<br />
.971<br />
.95<br />
MKT1<br />
MKT2<br />
MKT3<br />
.991<br />
.988<br />
.885<br />
.96<br />
REL2<br />
REL3<br />
REL4<br />
REL5<br />
.931<br />
.901<br />
.940<br />
.724<br />
.85<br />
LOG2<br />
LOG3<br />
LOG4<br />
LOG5<br />
LOG6<br />
.956<br />
.655<br />
.873<br />
.888<br />
.788<br />
.90<br />
Extraction Method: Principal Component Analysis<br />
Rotation Method: Varimax with Kaiser Normalization<br />
In this way, our first proposed construct has been validated. The financial strength gives the added<br />
advantage that the distributor can sold as many products as manufacturer expected. Since this industry is<br />
one <strong>of</strong> the highly competitive ones and the options <strong>of</strong> substitute products for whole sellers, retailers and<br />
consumers are very large. So the experience <strong>of</strong> the distributor and its operational competency would come<br />
into play. Making this construct a logical parameter to be considered and also having the support <strong>of</strong><br />
literature.<br />
2013©<strong>Academy</strong> <strong>of</strong> <strong>Knowledge</strong> <strong>Process</strong><br />
16
International Journal <strong>of</strong> Contemporary Business Studies<br />
Vol: 4, No: 1. January, 2013 ISSN 2156-7506<br />
Available online at http://www.akpinsight.webs.com<br />
The next one is the Marketing capabilities held by the distributor. This is the second construct proposed in<br />
the framework and has been proved by the survey. For any distributor, the ultimate purpose is to sale the<br />
product by meeting targets set by the manufacturer. If the distributor has got enough resources and will to<br />
cover those areas asked by the manufacturer so it would have the positive influence and more are the<br />
chances that the distributor gets selected as channel partner. The most among point that a manufacturer<br />
considers here is that the distributor must not be carrying the competitors’ product in their product line. The<br />
reason behind that are the high product alternatives available to channel members <strong>of</strong> this industry. So the<br />
manufacturer would want to keep themselves on the safer side by demanding their distributor to be<br />
exclusive as far their product line is considered so that the focus could also be increased. The manufacturer<br />
would prefer those distributors that fulfill these conditions as they consider them to be critical for the<br />
channel success.<br />
Relationship intensity between two channel members is important in supply chain because critical may<br />
involve the coordination <strong>of</strong> both parties. They may not consider the enthusiasm found in their potential<br />
distributor rather the fulfillment <strong>of</strong> commitments shown by the candidate is important. The manufacturers’<br />
base their insight on the more realistic terms. Commitments to ordering and payment procedures are critical<br />
to them and hence ranked important by the respondents <strong>of</strong> this research. The agreed terms on sales quote<br />
must also be regarded and fulfilled by the distributor. As this industry has been growing and technology has<br />
revolutionized it to a greatest extent. So it demands the supply chain members to share each every<br />
information related to market, product and consumers. The manufacturers’ would prefer those distributors<br />
who are willing to share the information with their manufacturers’. Our responding manufacturers’ showed<br />
the importance <strong>of</strong> this in their responses. Similarly, one has enough evidence with this to say that the nature<br />
<strong>of</strong> Pharmaceutical industry requires them to provide feedback continuously in order to stay ahead <strong>of</strong> the<br />
competitors.<br />
The distributors’ efficiency in product delivery, reducing lead time and precise order delivery considered to<br />
be very important for the selection decision by manufacturer. Pharmaceutical manufacturers’ are <strong>of</strong> the<br />
view that the rate <strong>of</strong> special/non-routine requests is very high in this industry. This uncertainty is a courtesy<br />
<strong>of</strong> several varying factors. But the point to understand is the distributor must be vigilant enough every time<br />
to entertain such demands. One could consider the fact that medicines have limited lives and they tend to<br />
expire after that. So delivery must be efficient to negate this issue otherwise it’s a waste <strong>of</strong> a resource. It<br />
requires them to provided value added logistic services and remaining cost efficient at the same time. The<br />
pharmaceutical manufacturers argue that the distributor must be thinking all the time and has all the<br />
knowledge to sort out transportation and logistics issues. The variables <strong>of</strong> logistic capabilities explored at<br />
the initial stage <strong>of</strong> this research are been supported by the manufacturers as well. We could safely say that<br />
the constructs explored through the literature that are comprised <strong>of</strong> Firm Infrastructure, Marketing<br />
Capabilities, Relationship Intensity and Logistic capabilities are hence been significantly proved and<br />
validating the framework.<br />
Multivariate Analysis has been applied to judge the relation <strong>of</strong> Manufacturer’s firm size and Nationality<br />
(foreign invested or domestic) with the selection decision. It was found to have no significant impact on<br />
distributor selection decision. This indicates us that there is no difference between manufacturers’ <strong>of</strong><br />
different sizes and nationalities for the distributor selection. Our result is also reinforcing the cross-national<br />
comparative results <strong>of</strong> (Shipley D. , 1984) and (Abratt & Pitt, 1989).<br />
2013©<strong>Academy</strong> <strong>of</strong> <strong>Knowledge</strong> <strong>Process</strong><br />
17
International Journal <strong>of</strong> Contemporary Business Studies<br />
Vol: 4, No: 1. January, 2013 ISSN 2156-7506<br />
Available online at http://www.akpinsight.webs.com<br />
Table 4 Multivarite Analysis<br />
Source Dependent Variable Type III Sum <strong>of</strong> Squares df Mean Square F Sig.<br />
Firm_size Firm_infra .095 1 .095 24.212 .128<br />
makt_capa 3.184 1 3.184 13768.839 .212<br />
log_cap 4.246 1 4.246 2.908 .338<br />
Log_capa 6.101 1 6.101 8.405 .211<br />
sal_turn Firm_infra 3.251 1 3.251 826.554 .022<br />
makt_capa 6.532 1 6.532 28250.020 .548<br />
log_cap 4.544 1 4.544 3.112 .328<br />
Log_capa 2.608 1 2.608 3.593 .309<br />
Man_nat Firm_infra .614 1 .614 156.138 .051<br />
makt_capa 4.974 1 4.974 21510.133 .616<br />
log_cap 1.314 1 1.314 .900 .517<br />
Log_capa 2.551 1 2.551 3.514 .312<br />
6.1 Critical Selection Factor Structure<br />
The critical indices for Pharmaceutical Industry consist <strong>of</strong> 18 factors which are also divided into three tiers<br />
namely Critical, Supporting and maintaining respectively. The critical factors <strong>of</strong> Tier-I involves three<br />
critical elements which are financial position <strong>of</strong> the company, its experience in the distribution and the<br />
commitment to minimum sales quota. The manufacturers’ <strong>of</strong> pharmaceutical industry considers that the<br />
financial standing <strong>of</strong> distributor and the assets owned by them gives the overall picture <strong>of</strong> their business<br />
pr<strong>of</strong>ile. They must be experienced enough and must be committed to sales quotas. These are the most<br />
essential factors that are considered in Pharmaceutical distributor selection decision. And we are confident<br />
to say that the distributor lacking in these dimensions has a very rare chance to be selected as a channel<br />
partner.<br />
Tier-II involves eight elements comprising <strong>of</strong> the managerial capabilities, physical facilities, reputation <strong>of</strong><br />
potential channel member, familiarity between both entities and manufacturer-distributor relationship are<br />
few <strong>of</strong> the variables that provides the supporting role for the selection decision made by the manufacturer.<br />
Index<br />
Value<br />
Tier I<br />
0.466666667<br />
0.466666667<br />
0.466666667<br />
Tier II<br />
0.700000000<br />
0.700000000<br />
0.700000000<br />
0.700000000<br />
0.700000000<br />
0.700000000<br />
0.700000000<br />
0.700000000<br />
Table 6 Critical Indices <strong>of</strong> selection Factors in Pharmaceutical Sector<br />
Selection Factors<br />
Critical<br />
The distributor is in good financial position<br />
The distributor is experienced in distributing Pharmacy related product<br />
The distributor is committed to minimum sales quota.<br />
Supporting<br />
The distributor has good management capabilities.<br />
The distributor is equipment with good physical facilities.<br />
The distributor has good reputation in market.<br />
The distributor has good sales competence.<br />
The distributor is enthusiastic to build a relationship with your company.<br />
The distributor is committed to ordering and payment procedure.<br />
You company is familiar with the distributor.<br />
The distributor delivers goods efficiently.<br />
2013©<strong>Academy</strong> <strong>of</strong> <strong>Knowledge</strong> <strong>Process</strong><br />
18
International Journal <strong>of</strong> Contemporary Business Studies<br />
Vol: 4, No: 1. January, 2013 ISSN 2156-7506<br />
Available online at http://www.akpinsight.webs.com<br />
Tier III<br />
0.933333333<br />
0.933333333<br />
0.933333333<br />
0.933333333<br />
0.933333333<br />
0.933333333<br />
0.933333333<br />
Maintaining<br />
The distributor covers the markets that your company wants to reach.<br />
The distributor carries product that do not directly compete with your products<br />
The distributor manages inventory well.<br />
The distributor is able to accommodate special/non-routine request.<br />
The distributor is aggressive in increasing the value added contents <strong>of</strong> logistics<br />
The distributor is able to minimize logistics costs.<br />
The distributor provides good customer service.<br />
The manufacturers <strong>of</strong> this industry consider that the familiarity must be high between both channel<br />
members and the distributor must be enthusiastic to share the information with the manufacturer. The<br />
delivery <strong>of</strong> goods made by the distributor to the market is also important element that needs to be<br />
considered before the selection decision. The distributor must be efficient in product delivery, building<br />
relationships and must posses’ strong managerial competency in order to be selected as a Supply chain<br />
member.<br />
Tier-III constitutes <strong>of</strong> seven maintaining elements which may not be mandatory but their presence in any<br />
potential distributor would give an extra advantage for the organization to be selected as a channel partner.<br />
The market coverage, inventory management, value added logistics contents, customer service are few <strong>of</strong><br />
them. Distributor carrying the alternative products, non-routine order handling and minimizing logistics<br />
costs is the few other maintaining elements. The manufacturers thus give less priority to them as compared<br />
to the critical and supporting ones.<br />
7. SUMMARY OF FINDINGS<br />
The multi-criteria decision to select distributors is one <strong>of</strong> the most important issues in channel management<br />
for manufacturers. Our empirical findings are quite supportive <strong>of</strong> the conceptual framework to explore<br />
dimensions <strong>of</strong> distributor selection. The five key factors in our model all have positive and significant<br />
effects on manufacturers’ selection <strong>of</strong> distributors in Electronic Home appliance industry and four in<br />
Pharmaceutical industry. This indicates that manufacturers, when selecting distributors, pay attention to not<br />
only distributors’ firm infrastructure and marketing capabilities emphasized by most previous research, but<br />
also on distributors’ relationship intensity and logistics capabilities. In addition considering Strategic Issues<br />
is also another fact that must be evaluated. There exists no significant difference between large and small or<br />
domestic and foreign-invested firms in the distributor selection, indicating that the all <strong>of</strong> the factors may be<br />
applied to firms <strong>of</strong> different sizes and nationalities. This study fills an important research gap and improves<br />
our knowledge <strong>of</strong> distributor selection by proposing and empirically testing a framework to serve as a<br />
foundation for examining manufacturers’ distributor selection. It also identified that how critical one single<br />
factor could be for the selection. Distributors performing well with respect to the four factors will build<br />
their competitive advantage. In addition to this, it also shows us the fact that how individual industries<br />
prefer different factors based on the criticality. It shows us the fact that selection criteria varies with the<br />
industry and both have separate priorities.<br />
The case provides us solid implications for both manufacturers and distributors. In an era <strong>of</strong> low margins,<br />
manufacturers must not only maximize their manufacturing and internal operation, but also cope with the<br />
growing importance <strong>of</strong> distributors in marketing/distribution efficiency, customer satisfaction, and cost<br />
savings. Recruiting good distributors in marketing channels can improve a manufacturer’s performance,<br />
and even increase its competitive advantage. Selection <strong>of</strong> distributors is a multi criteria assessment <strong>of</strong> both<br />
tangible and intangible factors, and is as critical to the success <strong>of</strong> a firm as the selection <strong>of</strong> good employees.<br />
From candidate distributors, manufacturers must select those that are most able to sell the products and<br />
serve the needs <strong>of</strong> target markets in order to achieve better firm performance (e.g. pr<strong>of</strong>itability). Therefore,<br />
finding competent distributors is an important issue for manufacturers, especially for many medium and<br />
small-sized firms that might lack sufficient knowledge and information to select distributors.<br />
2013©<strong>Academy</strong> <strong>of</strong> <strong>Knowledge</strong> <strong>Process</strong><br />
19
International Journal <strong>of</strong> Contemporary Business Studies<br />
Vol: 4, No: 1. January, 2013 ISSN 2156-7506<br />
Available online at http://www.akpinsight.webs.com<br />
8. CONCLUSION<br />
Manufacturers must realize that superior distribution support can help differentiate products and services in<br />
the marketplace, add value and amplify pr<strong>of</strong>itability. Since distributors can be used to enhance a<br />
manufacturer’s competitive position in the marketing channel, distributor selection will continue to be an<br />
important issue for the foreseeable future. If we collective analyze the research findings from both <strong>of</strong> the<br />
industries it would be clear that the majority <strong>of</strong> items considered by both <strong>of</strong> the industry’s manufacturers<br />
are same. Still there are some practices which appears to be different relevant to both industries.<br />
• Willingness to share the information and the distributors’ familiarity with manufacturers’ have not<br />
been considered important by the Electronic Home appliance Industry. While at the same time,<br />
there are considered very valuable factors by the Pharmaceutical manufacturers. The reason<br />
probably lies in the fact that Information Sharing is important in Pharmaceutical industry because<br />
<strong>of</strong> the nature <strong>of</strong> their products. It may require solid description for the distributor to understand<br />
what they are actually distributing relevant to the technical aspect <strong>of</strong> the product. At the same<br />
time, the reverse flow <strong>of</strong> feedback from consumers to manufacturers makes it more important for<br />
the distributor to be more knowledgeable and stay aware <strong>of</strong> the product and supply chain issues.<br />
• Inventory management has been considered very important by the Electronic Home appliance<br />
Industry and inverse is the situation with the Pharmaceutical industry. The reason behind is that<br />
the Electronic appliance captures more space, are delicate and needed to be placed at a safe and<br />
secure warehouse. To achieve that purpose any candidate distributor must possess a good facility<br />
<strong>of</strong> warehouse or go-down. Therefore, the manufacturer gives preference to this fact. And the<br />
pharmaceutical medicines could not be stored for a longer period <strong>of</strong> time and delivery lead time is<br />
very low in their scenario. Above all, large number <strong>of</strong> medicines could be stored even in a small<br />
space. That is why we have got different views from both <strong>of</strong> the industries.<br />
• Pharmaceutical supply chain needs to provide high standard <strong>of</strong> service quality and this has been<br />
suggested by various scholars. In the same way, it has been proved with this research that the<br />
customer service standards must be higher but the other industry’s manufacturers think differently<br />
about it.<br />
• The critical selection factors in electronic home appliance industry are reputation in market,<br />
Commitment to sales and ordering, Familiarity between both parties, value-added content <strong>of</strong><br />
logistics and cultural match are the most critical individual items <strong>of</strong> selection prevailing in the<br />
industry.<br />
• The industry practice does shows that among individual factors financial position, Experience and<br />
Commitment to sales quota are most critical factors that are considered. Any potential distributor<br />
who is lacking in any <strong>of</strong> these factors would not be selected as a channel partner.<br />
REFERENCE<br />
Abratt, R., & Pitt, L. (1989). Selection and motivation <strong>of</strong> industrial distributors: a comparative analysis.<br />
European Journal <strong>of</strong> Marketing , 23 (2), 144-53.<br />
Ahmad, N., Awan, M. U., Raouf, A., & Sparks, L. (2009). Development <strong>of</strong> a service quality scale for<br />
pharmaceutical supply chains. International Journal <strong>of</strong> Pharmaceutical and Healthcare Marketing<br />
, 3 (1), 26-45.<br />
Aman, A., & Hopkinson, G. (2010). The changing structure <strong>of</strong> distribution channels in Pakistan.<br />
International Journal <strong>of</strong> Retail & Distribution Management , 38 (5), 341-359.<br />
Andaleeb, S. (1996). An experimental investigation <strong>of</strong> satisfaction and commitment in marketing channels:<br />
the role <strong>of</strong> trust and dependence. Journal <strong>of</strong> Retailing , 72 (1), 77-93.<br />
Anderson, E., & Weitz, B. (1991). Forging a strategic distribution alliance. Chief Executive , 10, 70-3.<br />
Anderson, E., & Weitz, B. (1992). The use <strong>of</strong> pledges to build and sustain commitment in distribution<br />
channels. Journal <strong>of</strong> Marketing Research , 29 (1), 18-34.<br />
Berman, B. (1999). Marketing Channels. New York: John Wiley & Sons.<br />
Bove, L., & Johnson, L. (2001). Customer relationships with service personnel: do we measure closeness,<br />
quality or strength Journal <strong>of</strong> Business Research , 54 (3), 189-97.<br />
2013©<strong>Academy</strong> <strong>of</strong> <strong>Knowledge</strong> <strong>Process</strong><br />
20
International Journal <strong>of</strong> Contemporary Business Studies<br />
Vol: 4, No: 1. January, 2013 ISSN 2156-7506<br />
Available online at http://www.akpinsight.webs.com<br />
Bowersox, D., Closs, D., & Stank, T. (1999). 21st Century Logistics: Making Supply Chain Integration a<br />
Reality. Council <strong>of</strong> Logistics Management (CLM) , 264.<br />
Braglia, M., & Petroni, A. (2000). A quality assurance-oriented methodology for handling trade-<strong>of</strong>fs in<br />
supplier selection. International Journal <strong>of</strong> Physical Distribution & Logistics Management , 30<br />
(2), 96-111.<br />
Calantone, R., Cavusgil, S., & Zhao, Y. (2002). Learning orientation, firm innovation capability, and firm<br />
performance. Industrial Marketing Management , 31 (6), 515-24.<br />
Cavusgil, S., Deligonul, S., & Zhang, C. (2004). Curbing foreign distributor opportunism: an examination<br />
<strong>of</strong> trust, contracts, and the legal environment in international channel relationships. Journal <strong>of</strong><br />
International Marketing , 12 (2), 7-27.<br />
Cavusgil, S., Yeoh, P., & Mitri, M. (1995). Selecting foreign distributors: an expert systems approach.<br />
Industrial Marketing Management , 24 (4), 297-304.<br />
Celly, K., & Frazier, G. (1996). Outcome-based and behavior-based coordination efforts in channel<br />
relationships. Journal <strong>of</strong> Marketing Research , 33 (2), 200-10.<br />
Chapman, R., Soosay, C., & Kandampully, J. (2003). Innovation in logistics services and the new business<br />
model. International Journal <strong>of</strong> Physical Distribution & Logistics Management , 33 (7), 630-50.<br />
Churchill, G. (1979). A paradigm for developing better measures <strong>of</strong> marketing constructs. Journal <strong>of</strong><br />
Marketing Research , 16 (1), 64-73.<br />
Coughlan, A., Anderson, E., Stern, L., & El-A. (2001). Marketing Channels,, . Englewood Cliffs, NJ:<br />
Prentice-Hall.<br />
Da Silva, R., Davies, G., & Naude ´, P. (2002). Assessing customer orientation in the context <strong>of</strong><br />
buyer/supplier relationships using judgemental modeling. Industrial Marketing Management , 31<br />
(31), 241-52.<br />
Daugherty, P., Stank, T., & Ellinger, A. (1998). Leveraging logistics/distribution capabilities: the effect <strong>of</strong><br />
logistics service on market share. Journal <strong>of</strong> Business Logistics , 19 (2), 35-51.<br />
Day, G. (1994). The capabilities <strong>of</strong> the market-driven organization. Journal <strong>of</strong> Marketing , 58 (4), 37-51.<br />
Desarbo, W., Benedetto, C., Song, M., & Sinha, I. (2005). Revisiting the Miles and Snow strategic<br />
framework: uncovering interrelationships between strategic types, capabilities, environmental<br />
uncertainty, and firm performance. Strategic Management Journal , 26 (1), 47-74.<br />
Fawcett, S., Stanley, L., & Smith, S. (1997). Developing a logistics capability to improve the performance<br />
<strong>of</strong> international operations. Journal <strong>of</strong> Business Logistics , 18 (2), 101-27.<br />
Flint, D., Larsson, E., Gammelgaard, B., & Mentzer, J. (2005). Logistics innovation: a customer valueoriented<br />
social process. Journal <strong>of</strong> Business Logistics , 26 (1), 113-47.<br />
Fram, E. (1992). We can do a better job <strong>of</strong> selecting international distributors. Journal <strong>of</strong> Business &<br />
Industrial Marketing , 7 (2), 61-70.<br />
Frans, A., Bosch, V., Volbedra, H., & Boer, M. (1999). Coevolution <strong>of</strong> firm absorptive capacity and<br />
knowledge environment: organizational forms and combinative capabilities. Organization Science<br />
, 10 (5), 551–568.<br />
Frazier, G. L. (1999). Organizing and Managing Channels <strong>of</strong> Distribution. Jouranal <strong>of</strong> the <strong>Academy</strong> <strong>of</strong><br />
Marketing Sciences , 27 (2), 226-240.<br />
Fuller, J., O’Conor, J., & Rawlinson, R. (1993). Tailored logistics: the next advantage. Harvard Business<br />
Review , 71 (3), 87-98.<br />
Gerbing, D., & Anderson, J. (1988). An updated paradigm for scale development incorporating<br />
unidimensionality and its assessment. Journal <strong>of</strong> Marketing Research , 25 (2), 186-92.<br />
Golicic, S., Foggin, J., & Mentzer, J. (2003). Relationship magnitude and its role in interorganizational<br />
relationship structure. Journal <strong>of</strong> Business Logistics , 24 (1), 57-75.<br />
Goodman, L., & Dion, P. (2001). The determinants <strong>of</strong> commitment in the distributor-manufacturer<br />
relationship. Industrial Marketing Management , 30 (3), 287-300.<br />
Hair, J., Anderson, R., Tatham, R., & Black, W. (1998). Multivariate Data Analysis (5th Ed. ed.). New<br />
York: Macmillan,Prentice-Hall.<br />
Hinkin, T. (1998). A brief tutorial on development <strong>of</strong> measure for use in survey questionnaires.<br />
Organizational Research Methods , 1 (1), 104-21.<br />
Kalafatis, S. (2000). Buyer-seller relationships along channels <strong>of</strong> distribution. Industrial Marketing<br />
Management , 31 (3), 215-28.<br />
Kaleka, A. (2002). Resources and capabilities driving competitive advantage in export markets: guidelines<br />
for industrial exporters. Industrial Marketing Management , 31 (4), 273-83.<br />
2013©<strong>Academy</strong> <strong>of</strong> <strong>Knowledge</strong> <strong>Process</strong><br />
21
International Journal <strong>of</strong> Contemporary Business Studies<br />
Vol: 4, No: 1. January, 2013 ISSN 2156-7506<br />
Available online at http://www.akpinsight.webs.com<br />
Katsikeas, C., Paparoidamis, N., & Katsikeas, E. (2004). Supply source selection criteria: the impact <strong>of</strong><br />
supplier performance on distributor performance. Industrial Marketing Management , 33 (8), 755-<br />
64.<br />
Lambert, D., Cooper, M., & Pagh, J. (1998). Supply chain management: implementation issues and<br />
research opportunities. International Journal <strong>of</strong> Logistics Management , 9 (2), 1-19.<br />
Lin, J.-S. C., & Chen, C.-R. (2008). Determinants <strong>of</strong> manufacturers’ selection <strong>of</strong> distributors. Supply Chain<br />
Management , 13 (5), 356–365.<br />
Looman, A., Ruffni, F., & de Boer, F. (2002). Designing ordering and inventory management<br />
methodologies for purchased parts. Journal <strong>of</strong> Supply Chain Management , 38 (2), 22-9.<br />
Lynch, D., Keller, S., & Ozment, J. (2000). The effects <strong>of</strong> logistics capabilities and strategy on firm<br />
performance. Journal <strong>of</strong> Business Logistics , 21 (2), 47-67.<br />
Mentzer, J., Flint, D., & Hult, G. (2001). Logistics service quality as a segment-customized process.<br />
Journal <strong>of</strong> Marketing , 65 (4), 82-104.<br />
Mentzer, J., Flint, D., & Kent, J. (1999). Developing a logistics service quality scale. Journal <strong>of</strong> Business<br />
Logistics , 20 (1), 9-32.<br />
Merritt, N., & Newell, S. (2001). The extent and formality <strong>of</strong> sales agency evaluations <strong>of</strong> principals.<br />
Industrial Marketing Management , 30 (1), 37-49.<br />
Min, H. (1993). International supplier selection: a multi-attribute utility approach. International Journal <strong>of</strong><br />
Physical Distribution & Logistics Management , 24 (5), 24-33.<br />
Mone, M., McKinley, W., & Barker, V. (1998). Organizaional decline and innovation: a contingency<br />
framework. <strong>Academy</strong> <strong>of</strong> Management Review , 23 (1), 115-32.<br />
Morash, E., Droge, C., & Vickery, S. (1996). Strategic logistics capabilities for competitive advantage and<br />
firm success. Journal <strong>of</strong> Business Logistics , 17 (1), 1-22.<br />
Mudambi, S., & Aggarwal, R. (2003). Industrial distributors: can they survive in the new economy<br />
Industrial Marketing Management , 32 (4), 317-25.<br />
Mummalaneni, V., Dubas, K., & Chao, C. (1996). Chinese purchasing managers’ preferences and trade<strong>of</strong>fs<br />
in supplier selection and performance evaluation. Industrial Marketing Management , 25 (2),<br />
115-24.<br />
Novack, R., Rinehart, L., & Langley, C. J. (1994). An internal assessment <strong>of</strong> logistics value. Journal <strong>of</strong><br />
Business Logistics , 15 (1), 113-55.<br />
Nunnally, J., & Bernstein, I. (1994). Psychometric Theory. New York: McGraw-Hill.<br />
O’Connell, J., & Argyris, C. (1997). Blackwell Encyclopedic Dictionary <strong>of</strong> International Management.<br />
Blackwel Publishers, Oxford.<br />
Patton, W. (1996). Use <strong>of</strong> human judgment models in industrial buyers’ vendor selection decisions.<br />
Industrial Marketing Management , 25 (2), 135-49.<br />
Paun, D. (1997). A study <strong>of</strong> best versus average buyer-seller relationships. Journal <strong>of</strong> Business Research ,<br />
17 (2), 13-21.<br />
Pearson, J., & Ellram, L. (1995). Supplier selection and evaluation in small versus large electronics firms.<br />
Journal <strong>of</strong> Small Business Management , 33 (4), 53-65.<br />
Ricci, M., & Fraser, H. (2006). Revolution in the pharmaceutical supply chain. Retrieved December 6,<br />
2008, from www.dddmag.com/revolution-in-the-pharmaceutical.aspx<br />
Rindfleisch, A., & Moorman, C. (2001). The acquisition and utilization <strong>of</strong> information in new product<br />
alliances: a strength <strong>of</strong> ties perspective. Journal <strong>of</strong> Marketing , 65 (2), 1-18.<br />
Rosenbloom, B. (2004). Marketing Channels: A Management View (Vol. 7th ed). South-Western,<br />
Cincinnati, OH.<br />
Santoro, M. (2000). Success breeds success: the linkage between relationship intensity and tangible<br />
outcomes in industry-university collaborative ventures. The Journal <strong>of</strong> High Technology<br />
Management Research , 11 (2), 255-73.<br />
Shankar, V. (1999). New product introduction and incumbent response strategies: their inter-relationship<br />
and the role <strong>of</strong> multimarket contact. Journal <strong>of</strong> Marketing Research , 3, 327-44.<br />
Shipley, D. (1984). Selection and motivation <strong>of</strong> distribution intermediaries. Industrial Marketing<br />
Management , 13 (4), 249-56.<br />
Shipley, D., & Jobber, D. (1994). Size effects on sales management practices <strong>of</strong> small firms: a study <strong>of</strong><br />
industrial distributors. Journal <strong>of</strong> Personal Selling & Sales Management , 14 (1), 31-43.<br />
Shipley, D., Cook, D., & Barnett, E. (1989). Recruitment, motivation, training and evaluation <strong>of</strong> overseas<br />
distributors. European Journal <strong>of</strong> Marketing , 23 (2), 79-93.<br />
2013©<strong>Academy</strong> <strong>of</strong> <strong>Knowledge</strong> <strong>Process</strong><br />
22
International Journal <strong>of</strong> Contemporary Business Studies<br />
Vol: 4, No: 1. January, 2013 ISSN 2156-7506<br />
Available online at http://www.akpinsight.webs.com<br />
Shipley, D., Egan, C., & Edgett, S. (1991). Meeting source selection criteria: direct versus distributor<br />
channels. Industrial Marketing Management , 20 (4), 297-303.<br />
Sink, H., & Langley, C. J. (1997). A managerial framework for the acquisition <strong>of</strong> third-party logistics<br />
services. Journal <strong>of</strong> Business Logistics , 18 (2), 163-89.<br />
Stern, L., El-Ansary, A., & Coughlan, A. (1996). Marketing Channels, Prentice-Hall, Upper Saddle River,<br />
NJ.<br />
Svensson, G. (2003). The principle <strong>of</strong> balance between companies’ inventories and disturbances in logistics<br />
flows: empirical illustration and conceptualization. International Journal <strong>of</strong> Physical Distribution<br />
& Logistics Management , 33 (9), 765-84.<br />
Vickery, S., Calantone, R., & Dro ¨ge, C. (1999). Supply chain flexibility: an empirical study”, Journal <strong>of</strong><br />
Supply Chain Management. A Global Review <strong>of</strong> Purchasing & Supply , 35 (3), 16-24.<br />
Vorhies, D., & Harker, M. (2000). The capabilities and performance advantage <strong>of</strong> market-driven firms: an<br />
empirical investigation. Australian Journal <strong>of</strong> Management , 25 (2), 145-72.<br />
Weerawardena, J., & O’Cass, A. (2004). Exploring the characteristics <strong>of</strong> the market-driven firms and<br />
antecedents to sustained competitive advantage. Industrial Marketing Management , 33 (5), 419-<br />
28.<br />
Weitz, B. A., & Jap, S. D. (1995). Relationship Marketing and Distribution Channels. Journal <strong>of</strong> the<br />
<strong>Academy</strong> <strong>of</strong> Marketing Science , 23 (4), 305-320.<br />
Yeoh, P., & Calantone, R. (1995). An application <strong>of</strong> the analytical hierarchy process to international<br />
marketing: selection <strong>of</strong> a foreign distributor. Journal <strong>of</strong> Global Marketing , 8 (3-4), 39-65.<br />
Zhao, M., Dro ¨ge, C., & Stank, T. (2001). The effects <strong>of</strong> logistics capabilities on firm performance:<br />
customer-focused versus information-focused capabilities. Journal <strong>of</strong> Business Logistics , 22 (2),<br />
91-107.<br />
2013©<strong>Academy</strong> <strong>of</strong> <strong>Knowledge</strong> <strong>Process</strong><br />
23
International Journal <strong>of</strong> Contemporary Business Studies<br />
Vol: 4, No: 1. January, 2013 ISSN 2156-7506<br />
Available online at http://www.akpinsight.webs.com<br />
Women’s Justification <strong>of</strong> White-Collar Crime<br />
Petter Gottschalk<br />
BI Norwegian Business School<br />
Nydalsveien 37<br />
0484 Oslo<br />
Norway<br />
ABSTRACT<br />
In an empirical study <strong>of</strong> white-collar criminals in Norway, only 8 % out <strong>of</strong> 255 convicted<br />
criminals in recent years were women. There are many potential explanations for the low<br />
female share <strong>of</strong> crime. This paper concentrates on women’s lack <strong>of</strong> rationalization and<br />
justification <strong>of</strong> the criminal act. Several arguments lead us to believe that the justification<br />
to commit financial crime is less prominent among women. Examples include female fear<br />
<strong>of</strong> being caught, where women perceive a greater subjective risk, and where the<br />
consequences <strong>of</strong> imprisonment are perceived worse by women than men.<br />
Keywords: Financial crime; empirical study; neutralization theory; theory <strong>of</strong> self-control,<br />
white-collar crime.<br />
INTRODUCTION<br />
White-collar crime is financial crime committed by trusted persons in important business positions.<br />
Research on white-collar crime is <strong>of</strong>ten based on anecdotal evidence, where famous white-collar criminals<br />
serve as examples for case studies (Baird and Zelin, 2009; Bookman, 2008; Bucy et al., 2008; Dodge,<br />
2009; Fleet and Fleet, 2006; Friedrichs, 2009; Garoupa, 2007; Hansen, 2009; Heath, 2008; Messerschmidt,<br />
1997; Perri and Brodi, 2011; Simpson, 2011). While being relevant and interesting cases, the extent <strong>of</strong><br />
generalization from such studies is questionable. What seems to be needed is a larger sample <strong>of</strong> whitecollar<br />
criminals that can be studied in terms <strong>of</strong> average values as well as variation in criminal<br />
characteristics.<br />
With a larger sample, we can study white-collar convicts using statistical techniques to identify and study<br />
groups <strong>of</strong> white-collar criminals. Therefore, this article is based on an empirical sample <strong>of</strong> 255 white-collar<br />
criminals in Norway, convicted in the period from 2009 to 2012. The article is concerned with the<br />
following research question: How can justification theory explain the gender gap in white-collar crime<br />
SAMPLE CRIMINALS<br />
To identify a substantial sample <strong>of</strong> white-collar criminals and to collect relevant information about each<br />
criminal, there are several options available. However, in a small country like Norway with a population <strong>of</strong><br />
only five million people, there are limits to available sample size. One available option would be to study<br />
court cases involving white-collar criminals. A challenge here would be to identify relevant laws and<br />
sentences that cover our definition not only <strong>of</strong> white-collar crime, but also required characteristics <strong>of</strong> whitecollar<br />
criminals. Another available option is to study newspaper articles, where the journalists already have<br />
conducted some kind <strong>of</strong> selection <strong>of</strong> upper class, white-collar individuals convicted in court because <strong>of</strong><br />
financial crime. An advantage <strong>of</strong> this approach is that the cases are publicly known, which makes it more<br />
acceptable to identify cases by individual white-collar names. The selective and otherwise filtered<br />
information in newspapers might be a problem to other kinds <strong>of</strong> studies, but is considered an advantage in<br />
this study. Therefore, the latter option was chosen in this research.<br />
Based on this decision, our sample has the following characteristics as applied by newspapers when<br />
presenting news: famous individuals, famous companies, surprising stories, important events, substantial<br />
2013©<strong>Academy</strong> <strong>of</strong> <strong>Knowledge</strong> <strong>Process</strong><br />
24
International Journal <strong>of</strong> Contemporary Business Studies<br />
Vol: 4, No: 1. January, 2013 ISSN 2156-7506<br />
Available online at http://www.akpinsight.webs.com<br />
consequences, matters <strong>of</strong> principles and significant public interest. The sample consists <strong>of</strong> high pr<strong>of</strong>ile and<br />
large yield <strong>of</strong>fenses. This is in line with research by Schnatterly (2003) who searched the Wall Street<br />
Journal for several years in her study <strong>of</strong> white-collar crime published in the Strategic Management Journal.<br />
As suggested by Barak (2007), newsmaking criminology refers to the conscious efforts and activities <strong>of</strong><br />
criminologists to interpret, influence or shape the representation <strong>of</strong> newsworthy items about crime and<br />
justice. Newsmaking criminology as a perspective on the theory, practice and representations <strong>of</strong> crime and<br />
justice is an important approach for understanding white-collar crime. However, Barak’s work focused on<br />
how the media constructs images <strong>of</strong> crime. In this research, the media is used as a source <strong>of</strong> potentially<br />
objective information, where factual information in terms <strong>of</strong> quantitative numbers is collected from<br />
newspaper accounts.<br />
We make no distinction between prison and jail in this study. A prison or jail in Norway is a place in which<br />
people are physically confined and deprived <strong>of</strong> a range <strong>of</strong> personal freedoms. Imprisonment is a legal<br />
penalty that is imposed by the state for commission <strong>of</strong> a crime judged in court. In the United States, the<br />
difference between jail and prison is primarily a function <strong>of</strong> imprisonment length, where the use <strong>of</strong> prison<br />
over jail implies a more serious punishment.<br />
Our operational definition <strong>of</strong> white-collar crime restricts the sample to those who receive jail time as<br />
punishment. This restriction excludes cases <strong>of</strong> fines as penal response, which is quite common. This sample<br />
restriction enables us to only study serious white-collar crime cases. Our intention is not to identify whitecollar<br />
crime in reference to the law, but mainly with respect to the reporting <strong>of</strong> these <strong>of</strong>fenses resulting in<br />
imprisonment. If the sample would be selected as references by the law, then a number <strong>of</strong> <strong>of</strong>fenses would<br />
be defined in non-criminal statutes. Non-criminal statutes cannot, by their definition, result in jail time,<br />
only in civil remedies. Thus, by taking this view, we have essentially omitted most white-collar crime cases<br />
<strong>of</strong> fines from our study, since their severity is <strong>of</strong> a minor extent. Research articles edited by Gerber and<br />
Jensen (2006) suggest that only the most serious white-collar crime <strong>of</strong>fenders end up in prison.<br />
CRIMINAL CHARACTERISTICS<br />
Criminal characteristics collected for each person included gender, age when convicted, age when<br />
committing crime, number <strong>of</strong> years in prison, court level, amount <strong>of</strong> money involved in crime, number <strong>of</strong><br />
persons involved in crime, crime type, position level, personal income, person tax, personal wealth<br />
according to income statement, organization revenue, organization employees, private versus public sector,<br />
internal versus external detection, source <strong>of</strong> detection, corporate versus occupational crime, leader versus<br />
follower, and rotten apple versus rotten apple barrel.<br />
Most white-collar criminals are men. This is confirmed in the sample <strong>of</strong> 255 persons, which included only<br />
20 female criminals and 235 male criminals. Thus, less than 8 percent <strong>of</strong> the white-collar crime sample<br />
from newspaper articles was women – sometimes labeled pink-collar criminals.The youngest white-collar<br />
criminal in Norway was 21 years and the oldest was 77 years old. A distinction is made between age when<br />
convicted and age when committing crime. On average, a person was convicted 5 years after the crime,<br />
thus the average age when committing crime is 43 years old since the average age when convicted was 48<br />
years old.<br />
Most anecdotal cases, such as Rajaratman and Schilling, were men in their 50-ties or older. This is<br />
confirmed in our sample where the average age is 48 years old when convicted in court. These average<br />
numbers are similar to a study by Blickle et al. (2006) <strong>of</strong> 76 convicted German white-collar criminals. In<br />
their responding sample, there were 6 female criminals and 70 male criminals. The mean age <strong>of</strong> the<br />
<strong>of</strong>fenders in Germany was 47 years. In a study reported by Benson and Simpson (2009), the average age <strong>of</strong><br />
common criminals was 30 years, while the average age for white-collar criminals was 40 years. It is unclear<br />
whether the age <strong>of</strong> 40 years can be compared to the age <strong>of</strong> 48 years when convicted, or to the age <strong>of</strong> 43<br />
years when committing the crime in Norway.<br />
The average jail sentence for 255 convicted white-collar criminals in Norwegian courts was 2.2 years, with<br />
a maximum <strong>of</strong> 10 years and a minimum <strong>of</strong> 15 days. The longest jail sentence <strong>of</strong> 10 years was given to a<br />
person involved in bank fraud, where millions were transferred from a rich widow’s account in Norway to<br />
2013©<strong>Academy</strong> <strong>of</strong> <strong>Knowledge</strong> <strong>Process</strong><br />
25
International Journal <strong>of</strong> Contemporary Business Studies<br />
Vol: 4, No: 1. January, 2013 ISSN 2156-7506<br />
Available online at http://www.akpinsight.webs.com<br />
a friend’s account in Dubai. Since the convicted criminal was operating in a group <strong>of</strong> criminals, he was<br />
convicted <strong>of</strong> organized crime, which in Norwegian law causes the jail sentence for a criminal act to be<br />
extended from a more normal level, say six years, to ten years in his case.<br />
All persons in the sample received a jail sentence for white-collar crime. Compared to famous US cases<br />
mentioned above, these sentences are quite modest. However, in a Norwegian context these jail sentences<br />
are quite substantial, only passed by organized crime and murder. Also, when comparing to the sample<br />
used by Blickle et al. (2006) <strong>of</strong> white-collar criminals in Germany, there is no substantial difference, as the<br />
average was 3.9 years imprisonment in Germany in their sample <strong>of</strong> 76 convicts. In a US study <strong>of</strong> several<br />
thousand white-collar crime cases, the average prison sentence was only 11 months (Schanzenbach and<br />
Yaeger, 2006).In the Norwegian court system, there are three levels: district courts, courts <strong>of</strong> appeal and<br />
Supreme Court. Out <strong>of</strong> 255 cases, 143 were decided final in district courts, 101 were decided final in courts<br />
<strong>of</strong> appeal, while 11 cases were decided final in Supreme Court. The average amount involved in each<br />
financial crime case by white-collar criminals was 57 million Norwegian kroner. Since one US dollar is<br />
approximately six Norwegian kroner, this means on average 10 million US dollars. The smallest crime<br />
amount was less than 1 million, and the largest was 1200 million kroner.<br />
57 white-collar criminals operated on their own when committing criminal acts. Most criminals involved<br />
others in the crime. On average, 4 persons were involved with each other in the white-collar crime cases<br />
studied. The maximum number involved in a case was 200 persons, where an accounting firm had been<br />
fixing 200 taxi owners’ accounts so that they paid less tax. To avoid bias in statistics towards this case, only<br />
four persons from this taxi fraud scandal were included in our sample as white-collar criminals: the<br />
accounting responsible, the computer programmer, and two head taxi owners.<br />
We define four main financial crime categories by white-collar <strong>of</strong>fenders: fraud, theft, manipulation, and<br />
corruption. Fraud can be defined as intentional perversion <strong>of</strong> truth for the purpose <strong>of</strong> inducing another in<br />
reliance upon it to part with some valuable thing belonging to him or to surrender a legal right (Henning,<br />
2009). Theft can be defined as the illegal taking <strong>of</strong> another person’s, group’s or organization’s property<br />
without victim’s consent (Hill, 2008). Manipulation can be defined as a means <strong>of</strong> gaining illegal control or<br />
influence over others’ activities, means and results such as tax evasion (Malkawi and Haloush, 2008).<br />
Corruption can be defined as the giving, requesting, receiving or accepting <strong>of</strong> an improper advantage<br />
related to a position, <strong>of</strong>fice or assignment (Kayrak, 2008). In our sample <strong>of</strong> 255 convicted white-collar<br />
criminals, we find 131 cases <strong>of</strong> fraud, 12 cases <strong>of</strong> theft, 62 cases <strong>of</strong> manipulation, and 50 cases <strong>of</strong><br />
corruption.<br />
Consulting firm KPMG (2011) tried to identify characteristics <strong>of</strong> white-collar criminals who commit fraud.<br />
They found the following characteristics <strong>of</strong> the typical fraudster: Male, 36 to 45 years old, commits fraud<br />
against his own employer, works in the finance function or in a finance-related role, holds a senior<br />
management position, employed by the company for more than 10 years, and works in collusion with<br />
another perpetrator. These characteristics are based on 348 actual fraud investigations conducted by KPMG<br />
member firms in 69 countries.<br />
We define three white-collar levels. The first level is owners <strong>of</strong> companies, board members <strong>of</strong> companies,<br />
and chief executive <strong>of</strong>ficers <strong>of</strong> companies. The second level is lawyers, consultants, investors, and brokers.<br />
The third level is middle managers, independent contractors and single-working individuals. In our sample<br />
<strong>of</strong> 255 convicted white-collar criminals, we find 76 individuals (30%) at level 1, 106 individuals (41%) at<br />
level 2, and 73 individuals (29%) at level 3.<br />
Income figures for all taxable income are published annually by Norwegian tax authorities. Almost all 255<br />
convicted white-collar criminals were found on the list for the year 2009. The average personal income was<br />
327 000 kroner (approximately 54 000 US dollars), tax was 135 000 kroner (approximately 22 000 US<br />
dollars), and personal fortune was 6 million kroner (approximately 1 million US dollars).<br />
White-collar <strong>of</strong>fenders worked in an organization with revenues <strong>of</strong> 200 million kroner and 124 employees<br />
on average. 232 criminals worked in private sector organizations, while 23 criminals worked in public<br />
sector organizations.<br />
2013©<strong>Academy</strong> <strong>of</strong> <strong>Knowledge</strong> <strong>Process</strong><br />
26
International Journal <strong>of</strong> Contemporary Business Studies<br />
Vol: 4, No: 1. January, 2013 ISSN 2156-7506<br />
Available online at http://www.akpinsight.webs.com<br />
The financial damage <strong>of</strong> 57 million Norwegian kroner was in most cases occurring outside the organization<br />
where the criminal worked. The victim <strong>of</strong> crime was typically another organization: 201 criminals caused<br />
damage to another organization or outside individual, while only 54 caused financial damage to his or her<br />
own organization. It is interesting to note that very few (23 criminals) worked in the public sector, while<br />
the victim <strong>of</strong> crime was very <strong>of</strong>ten found in the public sector.<br />
How was crime detected Who detected crime In this research, we searched the source <strong>of</strong> detection and<br />
found that journalists in the media investigated and revealed a total <strong>of</strong> 62 out <strong>of</strong> 255 white-collar criminals.<br />
This represents 24 percent, which means that one fourth <strong>of</strong> all white-collar crime was revealed by the press.<br />
However, there is a bias in our sample towards media sources, as only cases presented in the media are<br />
included. Nevertheless, it may seem surprising that journalists make such a significant contribution. After<br />
journalists we find victims <strong>of</strong> crime, who revealed 45 criminals (18%):<br />
1. Journalists: 62 criminals (24%)<br />
2. Victims: 45 criminals (18%)<br />
3. Bankruptcy lawyers: 24 (9%)<br />
4. Internal controls: 22 criminals (9%)<br />
5. Auditors: 18 criminals (7%)<br />
6. Tax authorities: 17 criminals (7%)<br />
7. Banks: 14 criminals (5%)<br />
8. Police: 10 criminals (4%)<br />
9. Stock exchange: 5 criminals (2%)<br />
10. Others: 38 criminals (15%).<br />
While it may seem surprising that journalists detected as many as 62 criminals (24%), it may seem<br />
surprising as well that the police only detected 10 criminals (4%).<br />
FEMALE CRIMINALS<br />
A total <strong>of</strong> 255 white-collar criminals were convicted and received jail sentences in Norwegian courts from<br />
2009 to 2012. As suggested in the research literature, most white-collar criminals are men. This is<br />
confirmed in the sample <strong>of</strong> 255 persons, which included only 20 female criminals and 235 male criminals.<br />
Thus, only 7.8 percent <strong>of</strong> the white-collar crime totals from newspaper articles were women.<br />
Total 255 criminals<br />
235 Male<br />
Criminals<br />
20 Female<br />
Criminals<br />
T-statistic for<br />
difference<br />
Significance <strong>of</strong><br />
t-statistic<br />
Average age convicted 48 years 46 years .896 .380<br />
Average age crime 43 years 41 years .900 .378<br />
Years in prison 2.2 years 1.8 years 1.252 .222<br />
Crime amount 61 million 18 million 2.847 .005<br />
Personal income 341 000 kroner 163 000 kroner 2.835 .007<br />
Personal tax 141 000 kroner 62 000 kroner 3.150 .003<br />
Personal wealth 1.5 million 0 million 3.619 .000<br />
Involved persons 4.1 persons 4.5 persons -.552 .585<br />
Business revenue 207 million 116 million 1.374 .181<br />
Business employees 127 persons 92 persons .574 .571<br />
Comparison <strong>of</strong> male versus female white-collar criminals<br />
There are some empirical differences between convicted men and women. First, the money amount<br />
involved in the crime was significantly larger for male criminals. Furthermore, according to income<br />
statistics, male criminals had larger personal income, paid more taxes and had a larger personal wealth.<br />
Justification Theory<br />
In criminology, justification is <strong>of</strong>ten mentioned as one <strong>of</strong> three pillars to explain criminal acts. The other<br />
pillars are opportunity to carry out the act, and motivation for the act. These three pillars must work<br />
together before the criminal act can take place (Aguilera and Vedera, 2008).<br />
2013©<strong>Academy</strong> <strong>of</strong> <strong>Knowledge</strong> <strong>Process</strong><br />
27
International Journal <strong>of</strong> Contemporary Business Studies<br />
Vol: 4, No: 1. January, 2013 ISSN 2156-7506<br />
Available online at http://www.akpinsight.webs.com<br />
In the fraud triangle, these pillars are explained as (Ilter, 2009):<br />
• Opportunity to commit crime: Women are in a position to commit white-collar crime.<br />
• Motivation in terms <strong>of</strong> incentives or pressures to commit crime: Women want to or have to<br />
commit white-collar crime.<br />
• Acceptance <strong>of</strong> crime: Women find justification for white-collar crime.<br />
Risk for fraud is thus a combination <strong>of</strong> opportunity and possibility, incentives and pressures, and<br />
rationalization and justification. Several arguments in the following lead us to believe that the extent <strong>of</strong><br />
rationalization and justification is less prominent among women. It is the female fear <strong>of</strong> being caught,<br />
where women perceive a greater subjective risk than men, and where the consequences <strong>of</strong> imprisonment<br />
are perceived worse by women than men, mainly because <strong>of</strong> social collapse that follows after time in<br />
prison. Campbell et al. (2001) argue that women have a lower level <strong>of</strong> acceptable fear than men. It means<br />
that women generally experience more fear than men when they are exposed to the same objective risk.<br />
The level <strong>of</strong> acceptable fear, combined with perceived risk – which is subjective – has an impact on actions<br />
(Gass and Seiter, 2011), where women with more fear at higher risk will avoid criminal activities.<br />
In an experiment with boys and girls, differences were found in risk willingness. They participated in a<br />
lottery. When buying a ticket, there was a 50 percent chance <strong>of</strong> winning 100 dollars and a 50 percent<br />
chance <strong>of</strong> winning nothing. The expected value in the lottery was thus 50 dollars. Participants also had a<br />
definite alternative. This alternative started at 25 dollars and moved upwards. Girls stopped participating in<br />
the lottery at 37 dollars, while boys stopped at 45 dollars, which indicates a greater extent <strong>of</strong> risk<br />
willingness among boys than among girls.<br />
Risk is an element in our model as part <strong>of</strong> both motivation and justification. That women generally have a<br />
higher degree <strong>of</strong> risk aversion than men, does not necessarily apply to the specific group <strong>of</strong> pink-collar<br />
criminals. For example, Adams (2012: 2219) found that more female board members do not necessarily<br />
lead to greater risk aversion in decision-making:<br />
A large literature documents that women are different from men in their choices and preferences,<br />
but little is known about gender differences in the boardroom. If women must be like men to break<br />
the glass ceiling, we might expect gender differences to disappear among directors. Using a large<br />
survey <strong>of</strong> directors, we show that female and male directors differ systematically in their core<br />
values and risk attitudes, but in ways that differ from gender differences in the general population.<br />
These results are robust to controlling for differences in observable characteristics. Consistent with<br />
findings for the population, female directors are more benevolent and universally concerned, but<br />
less power oriented than male directors. However, in contrast to findings for the population, they<br />
are less tradition and security oriented than their male counterparts. They are also more risk loving<br />
than male directors. Thus, having a woman on the board needs not lead to more risk-averse<br />
decision making.<br />
A study in Sweden confirms the finding that having a woman on the board does not necessarily lead to<br />
more risk-averse decision making. On the contrary, the Swedish study indicates that women are more risk<br />
willing than previously assumed. One reason for the greater risk willingness was that women are more in<br />
favor <strong>of</strong> change. It was Adams and Funk (2012) who studied differences among a total <strong>of</strong> 1800 female and<br />
male board members in companies registered on the stock exchange in Sweden. The result <strong>of</strong> the study was<br />
that female board members take greater risks than men on the board. Men are more concerned with<br />
competition, while women like change and being independent.<br />
Justification <strong>of</strong> crime takes place by applying neutralization techniques. White-collar crime involves some<br />
form <strong>of</strong> social deviance and represents a breakdown in social order. According to Heath (2008) based on<br />
Sykes and Matza (1957), white-collar criminals tend to apply techniques <strong>of</strong> neutralization to deny the<br />
criminality <strong>of</strong> their actions. Examples <strong>of</strong> neutralization techniques are (a) denial <strong>of</strong> responsibility; (b) denial<br />
<strong>of</strong> injury; (c) denial <strong>of</strong> the victim; (d) condemnation <strong>of</strong> the condemners; (e) appeal to higher loyalties; (f)<br />
everyone else is doing it; and (g) claim to entitlement. The <strong>of</strong>fender may claim an entitlement to act as he<br />
did, either because he was subject to a moral obligation, or because <strong>of</strong> some misdeed perpetrated by the<br />
victim. Family as a neutralization argument is applied more frequently by women than men. Women tend<br />
to justify their crime by pointing to basic needs <strong>of</strong> the family, while men, to a larger extent, argue in<br />
2013©<strong>Academy</strong> <strong>of</strong> <strong>Knowledge</strong> <strong>Process</strong><br />
28
International Journal <strong>of</strong> Contemporary Business Studies<br />
Vol: 4, No: 1. January, 2013 ISSN 2156-7506<br />
Available online at http://www.akpinsight.webs.com<br />
business terms. However, research by Klenowski et al. (2011) shows that both men and women tend to<br />
justify financial crime by family needs and more generally commit crime for the benefit <strong>of</strong> others.<br />
When <strong>of</strong>fenders are asked to explain their crimes, they typically portray themselves as decent people<br />
despite their wrongdoings. They tend to apply neutralization techniques as defined by neutralization theory<br />
(Bock and Kenhove, 2011; Siponen and Vance, 2010; Sykes and Matza, 1957). To be effective at<br />
managing the stigma <strong>of</strong> crime, motivational accounts must be believable to the social audience. Thus,<br />
Klenowski et al. (2011) found that variations in patterns <strong>of</strong> accounts are likely due to the social position <strong>of</strong><br />
the actors. They examined whether gender constrains the way individuals describe their crimes by<br />
analyzing the motivational accounts <strong>of</strong> male and female white collar <strong>of</strong>fenders. Results show that while<br />
men and women both elicit justifications when discussing their crimes, they do differ in the frequency with<br />
which they call forth specific accounts and in the rhetorical nature <strong>of</strong> these accounts. When accounting for<br />
their crime, white-collar <strong>of</strong>fenders draw on gendered themes to align their actions with cultural<br />
expectations <strong>of</strong> masculinity and femininity. These findings suggest that gender does constrain the accounts<br />
that are available to white-collar <strong>of</strong>fenders.<br />
Cauffman (2008: 126) found that “on average, males tend to have longer criminal careers than females.<br />
Because it is difficult to assess when a criminal career is “finished”, convincing evidence about the duration<br />
<strong>of</strong> criminal careers is sparse. A long-term study by Roger Tarling followed a sample <strong>of</strong> male and female<br />
<strong>of</strong>fenders who were born in 1958 through age thirty-one, finding that the average duration <strong>of</strong> <strong>of</strong>fending was<br />
4.9 years for females, and 7.4 years for males.”<br />
The idea that women, to a lesser extent than men, are able to justify white-collar crime might be explained<br />
by moral theory (Bowman and Giligan, 2008) combined with slippery slope theory. Slippery slope theory<br />
implies that a person or an organization is sliding from legal to illegal activities (Arjoon, 2008). This theory<br />
attempts to explain why good people do bad things. The explanation is that people do not really notice<br />
when they slide over the border to crime. Many unethical and criminal acts happen without involved<br />
persons knowing or understanding that they are doing something wrong. Criminal behavior can follow a<br />
downward slope, where sliding downwards is a continuous deterioration in the organization not caused by<br />
any specific event. It is a development, a trend, a path that leads the wrong way. Gender differences can be<br />
found in men realizing grey zones, while women see more black or white. Therefore, women will, to a<br />
lesser extent, be able to justify activities that are on the wrong side <strong>of</strong> the law, because it is black to them,<br />
while it is grey to men.<br />
Women find it more difficult than men to justify criminal acts based on an ethical perspective, according to<br />
Ruegger and King (1992: 181):<br />
The findings suggest that gender is a significant factor in the determination <strong>of</strong> ethical conduct and<br />
that females are more ethical than males in their perception <strong>of</strong> business ethical situations.<br />
Yet another theory can explain gender differences in justification. It is the theory <strong>of</strong> self-control. The lower<br />
the individual’s self-control, the greater is the likelihood <strong>of</strong> his or hers involvement in criminal behavior.<br />
Low self-control is defined in terms <strong>of</strong> characteristics such as impulsive, risk-taking, and self-centered<br />
(Meneses and Akers, 2011). While most scholars – such as Haantz (2002), Holtfeter et al. (2010) and<br />
Huffman et al. (2010) – argue that the main reason for less female white-collar crime is lack <strong>of</strong> opportunity,<br />
they also mention gender differences in self-control. They argue that even if women over time have the<br />
same opportunities as men, they will not commit as much crime, because lack <strong>of</strong> justification leads them to<br />
more self-control.<br />
Self-control theory simply states that white-collar people with a low degree <strong>of</strong> self-control will tend to<br />
commit more financial crime than white-collar people with a high degree <strong>of</strong> self-control (Hansen 2009):<br />
Self-control theory proposes that individuals commit crime because <strong>of</strong> low self-control. Except in rare<br />
cases <strong>of</strong> mass fraud such as the Enron scandal, not all elites within a given organization or industry<br />
will commit crime. Hence, though elites at the top <strong>of</strong> their pr<strong>of</strong>ession and corporation differentially<br />
associate with the people <strong>of</strong> equal status in their own and other corporations, not all corporate elites<br />
commit crimes and behave in an overtly deviant manner.<br />
Social control and self-control could be more developed among women than men, combined with learning<br />
theory results, causing less crime by women. This phenomenon <strong>of</strong> gender difference is explained by<br />
2013©<strong>Academy</strong> <strong>of</strong> <strong>Knowledge</strong> <strong>Process</strong><br />
29
International Journal <strong>of</strong> Contemporary Business Studies<br />
Vol: 4, No: 1. January, 2013 ISSN 2156-7506<br />
Available online at http://www.akpinsight.webs.com<br />
Worthen (2011) in terms <strong>of</strong> parent-child bonding. She suggests that adolescents who have healthy<br />
relationships with their parents are less likely to be involved in delinquency. She found that gender<br />
differences in delinquency can be partially explained by gender differences in mean values <strong>of</strong> each element<br />
<strong>of</strong> the parental bond, i.e., emotional attachment to parents, time spent with parents, and parental<br />
monitoring. Gender differences can, in addition, be partially explained by examining the effects <strong>of</strong> the<br />
elements <strong>of</strong> the parental bond on delinquent involvement as they differ by gender.<br />
DISCUSSION<br />
Crime justification is only one reason for the substantial discrepancy between 50 % women in the total<br />
Norwegian population, 8 % women in the convicted population, and 6 % women in the prison population.<br />
Figure 1 illustrates a number <strong>of</strong> elements that reduce the female fraction stage by stage on the left hand<br />
side, caused by factors on the right hand side. There are a total <strong>of</strong> five stages.<br />
The purpose <strong>of</strong> the model is to illustrate and explain how common opinions documented in theoretical<br />
thoughts can predict the decreasing female fraction from general population fraction to imprisonment<br />
fraction. The common opinion in society is that men represent the large majority within all kinds <strong>of</strong> crime,<br />
including white-collar crime (Friedrichs, 2009). The model supports Messerschmidt’s (1997) suggestion<br />
that gender is an important predictor <strong>of</strong> criminal involvement – males dominate criminal activity in society.<br />
Both Friedrichs (2009) and Messerschmidt (1997) receive support from Steffensmeier and Allen (1996),<br />
who list a number <strong>of</strong> empirical studies in different countries where men commit far more crimes than<br />
women. Additionally, Blickle et al. (2006) show that men were the dominant majority among white-collar<br />
criminals in Germany.<br />
Numbers in terms <strong>of</strong> percentage are here suggested for future research, as we have no empirical bases for<br />
these elements. Currently, numbers only suggest how female fraction is reduced from stage to stage, where<br />
50 %<br />
50% WOMEN IN THE POPULATION<br />
RELATIVE NEEDS 80%<br />
40% WOMEN HAVE SAME NEEDS<br />
CRIME OPPORTUNITY 70%<br />
CRIME MOTIVATION 90%<br />
20% WOMEN COMMIT CRIME<br />
CRIME JUSTIFICATION 80%<br />
DETECTION RISK 30%<br />
6% WOMEN ARE PROSECUTED<br />
CONVICTIONS 140%<br />
8% WOMEN PRISON SENTENCE<br />
IMPRISONMENT 70%<br />
6% WOMEN IN PRISON<br />
Figure 1. Model for estimation <strong>of</strong> female fraction in white-collar crime<br />
2013©<strong>Academy</strong> <strong>of</strong> <strong>Knowledge</strong> <strong>Process</strong><br />
30
International Journal <strong>of</strong> Contemporary Business Studies<br />
Vol: 4, No: 1. January, 2013 ISSN 2156-7506<br />
Available online at http://www.akpinsight.webs.com<br />
REFERENCES<br />
Adams, R.B. (2012). Beyond the Glass Ceiling: Does Gender Matter Management Science, 58 (2), 219-<br />
235.<br />
Aguilera, R.V. and Vadera, A.K. (2008). The Dark Side <strong>of</strong> Authority: Antecedents, Mechanisms, and<br />
Outcomes <strong>of</strong> Organizational Corruption, Journal <strong>of</strong> Business Ethics, 77, 431-449.<br />
Arjoon, S. (2008). Slippery When Wet: The Real Risk in Business, Journal <strong>of</strong> Markets & Morality, 11 (1),<br />
Spring, 11 (1), 77-91.<br />
Baird, J.E. and Zelin, R.C. (2009). An Examination <strong>of</strong> the Impact <strong>of</strong> Obedience Pressure on Perceptions <strong>of</strong><br />
Fraudulent Acts and the Likelihood <strong>of</strong> Committing Occupational Fraud, Journal <strong>of</strong> Forensic<br />
Studies in Accounting and Business, Winter, 1 (1), 1-14.<br />
Barber, B.M. and Odean, T. (2001). Boys will be boys: Gender, overconfidence and common stock<br />
investment, The Quarterly Journal <strong>of</strong> Economics, February, 261-292.<br />
Benson, M.L. and Simpson, S.S. (2009). White-Collar Crime: An Opportunity Perspective, Criminology<br />
and Justice Series, Routledge, NY: New York.<br />
Blickle, G., Schlegel, A., Fassbender, P. and Klein, U. (2006). Some Personality Correlates <strong>of</strong> Business<br />
White-Collar Crime, Applied Psychology: An International Review, 55 (2), 220-233.<br />
Bock, G.W., Zmud, R.W. and Kim, Y.G. (2005). Behavioural intention formation in knowledge sharing:<br />
examining the roles <strong>of</strong> extrinsic motivators, social-psychological forces, and organizational<br />
climate, MIS Quarterly, 29 (1), 87-111.<br />
Bookman, Z. (2008). Convergences and Omissions in Reporting Corporate and White Collar Crime,<br />
DePaul Business & Commercial Law Journal, 6, 347-392.<br />
Bowman, D. and Gilligan, G. (2008). Public awareness <strong>of</strong> corruption in Australia, Journal <strong>of</strong> Financial<br />
Crime, 14 (4), 438-452.<br />
Britton, D.M. (2000). Feminism in Criminology: Engendering the Outlaw, Annals <strong>of</strong> the American<br />
<strong>Academy</strong> <strong>of</strong> Political and Social Science, 571, 57-76.<br />
Bucy, P.H., Formby, E.P., Raspanti, M.S. and Rooney, K.E. (2008). Why do they do it: The motives,<br />
mores, and character <strong>of</strong> white collar criminals, St. John's Law Review, 82 (2), 401-571.<br />
Campbell, A., Muncer, S. and Bibel, D. (2001). Women and crime: An evolutionary approach, Aggression<br />
and Violent Behavior, 6(5), 481-497.<br />
Cauffman, E. (2008). Understanding the Female Offender, The Future <strong>of</strong> Children, 18 (2), 119-142.<br />
Comey, J.B. (2009). Go directly to jail: White collar sentencing after the Sarbanes-Oxley act, Harvard Law<br />
Review, 122, 1728-1749.<br />
Dobash, R.E., Dobash, R.P. and Cavanagh, K. (2009). “Out <strong>of</strong> the Blue”: Men Who Murder an Intimate<br />
Partner, Feminist Criminology, 4 (3), 194-225.<br />
Fleet, D.D.van, Fleet, E.W.van (2006). Internal terrorists: the terrorists inside organizations, Journal <strong>of</strong><br />
Managerial Psychology, 21 (8), 763-774.<br />
Friedrichs, D.O. (2009). Trusted Criminals: White Collar Crime in Contemporary Society, Wadsworth,<br />
Belmont, CA.<br />
Garoupa, N. (2007). Optimal law enforcement and criminal organization. Journal <strong>of</strong> Economic Behavior &<br />
Organization, 63 (3), 461-474.<br />
Gass, R.H. and Seiter, J.S. (2003). Persuasion – Social influence and compliance gaining, 4. Utgave, UK:<br />
Pearson.<br />
Haantz, S. (2002). Women and White Collar Crime, National White Collar Crime Center, www.nw3c.org.<br />
Hansen, L.L. (2009). Corporate financial crime: social diagnosis and treatment, Journal <strong>of</strong> Financial<br />
Crime, 16 (1), 28-40.<br />
Heath, J. (2008). Business Ethics and Moral Motivation: A Criminological Perspective, Journal <strong>of</strong> Business<br />
Ethics, 83 (4), 595-614.<br />
Holtfreter, K., Beaver, K.M., Reisig, M.D. and Pratt, T.C. (2010). Low self-control and fraud <strong>of</strong>fending,<br />
Journal <strong>of</strong> Financial Crime, 17 (3), 295-307.<br />
Huffman, M.L., Cohen, P.N. and Pearlman, J. (2010). Engendering Change: Organizational Dynamics and<br />
Workplace Gender Desegregation, Administrative Science Quarterly, 55, 255-277.<br />
Hurwitz, J. and Smithey, S. (1998). Gender Differences on Crime and Punishment, Political Research<br />
Quarterly, 51 (1), 89-115.<br />
Ilter, C. (2009). Fraudulent money transfers: a case from Turkey, Journal <strong>of</strong> Financial Crime, 16 (2), 125-<br />
136.<br />
2013©<strong>Academy</strong> <strong>of</strong> <strong>Knowledge</strong> <strong>Process</strong><br />
31
International Journal <strong>of</strong> Contemporary Business Studies<br />
Vol: 4, No: 1. January, 2013 ISSN 2156-7506<br />
Available online at http://www.akpinsight.webs.com<br />
Klenowski, P.M., Copes, H. and Mullins, C.W. (2011). Gender, Identity and Accounts: How White Collar<br />
Offenders Do Gender When Making Sense <strong>of</strong> Their Crimes, Justice Quarterly, 28 (1), 49-69.<br />
Lasley, J.R. (1988). Toward a Control Theory <strong>of</strong> White-Collar Offending, Journal <strong>of</strong> Quantitative<br />
Criminology, 4 (4), 347-362.<br />
Lyman, M.D. and Potter, G.W. (2007). Organized crime, 4th <strong>edition</strong>, Pearson Prentice Hall, Uppler Saddle<br />
River, New Jersey.<br />
Meneses, R.A. and Akers, R.L. (2011). A Comparison <strong>of</strong> Four General Theories <strong>of</strong> Crime and Deviance:<br />
Marijuana Use Among American and Bolivian University Students, International Criminal Justice<br />
Review, 21 (4), 333-352.<br />
Messerschmidt, J.M. (1997). Crime as Structured Action: Gender, Race, Class, and Crime in the Making,<br />
SAGE Publications, Thousand Oaks, London.<br />
Perri, F.S and Brody, R.G. (2011). The Sallie Rohrbach story: lessons for auditors and fraud examiners,<br />
Journal <strong>of</strong> Financial Crime, 18 (1), 93-104.<br />
Ruegger, D. and King, E.W. (1992). A Study <strong>of</strong> the Effect <strong>of</strong> Age and Gender upon Student Business<br />
Ethics, Journal <strong>of</strong> Business Ethics, 11, 179-186.<br />
Schnatterly, K. (2003). Increasing firm value through detection and prevention <strong>of</strong> white-collar crime,<br />
Strategic Management Journal, 24 (7), 587-614.<br />
Simpson, S.S. (2011). Making Sense <strong>of</strong> White Collar Crime: Theory and Research, The Ohio State Journal<br />
<strong>of</strong> Criminal Law, 8 (2), 481-502.<br />
Siponen, M. and Vance, A. (2010). Neutralization: New Insights into the Problem <strong>of</strong> Employee Information<br />
Systems Security Policy Violations, MIS Quarterly, 34 (3), 487-502.<br />
Smith, R. (2009). Understanding entrepreneurial behavior in organized criminals, Journal <strong>of</strong> Enterprising<br />
Communities: People and Places in the Global Economy, 3 (3), 256-268.<br />
Steffensmeier, D. and Allan, E. (1996). Gender and crime: Toward a Gendered Theory <strong>of</strong> Female<br />
Offending, Annual Review <strong>of</strong> Sociology, 22, 459-487.<br />
Sykes, G. and Matza, D. (1957). Techniques <strong>of</strong> Neutralization: A Theory <strong>of</strong> Delinquency, American<br />
Sociological Review, 22 (6), 664.670.<br />
Wheeler, S. (1992). The Problem <strong>of</strong> White Collar Crime Motivation, i: White Collar Crime Reconsidered,<br />
Schlegel, K. og Weisburd, D. (redaktører), Boston: Northeastern University Press, s. 108-123.<br />
Worthen, M.G.F. (2011). Gender differences in parent-child bonding: implications for understanding the<br />
gender gap in delinquency, Journal <strong>of</strong> Crime and Justice, 34 (1), 3-23.<br />
Yusuf, T.O. and Babalola, A.R. (2009). Control <strong>of</strong> insurance fraud in Nigeria: an exploratory study,<br />
Journal <strong>of</strong> Financial Crime, 16 (4), 418-435.<br />
2013©<strong>Academy</strong> <strong>of</strong> <strong>Knowledge</strong> <strong>Process</strong><br />
32
International Journal <strong>of</strong> Contemporary Business Studies<br />
Vol: 4, No: 1. January, 2013 ISSN 2156-7506<br />
Available online at http://www.akpinsight.webs.com<br />
Service Quality Measurement and its evaluation<br />
<strong>of</strong> leading Private Banks <strong>of</strong> India in Delhi and<br />
NCR Region: An analytical study<br />
Dr. Saroj Kumar Dash<br />
Associate Pr<strong>of</strong>essor, Department <strong>of</strong> Management Studies, Skyline Institute <strong>of</strong> Engineering and Technology,<br />
Greater Noida, Uttar Pradesh, India<br />
Dr. Asif Parwez<br />
Assistant Pr<strong>of</strong>essor, Hindu College <strong>of</strong> Engineering, Sonepat, Haryana, India<br />
Mr. Firoz Parwez<br />
Faculty, Department <strong>of</strong> Computer Science & Information System, Jazan University, Jazan , Kingdom <strong>of</strong><br />
Saudi Arabia(KSA)<br />
ABSTRACT<br />
The subject "quality" is nowadays, in a globalized world, one <strong>of</strong> the key concerns <strong>of</strong><br />
businessmen to face the competition on industries and service areas. Financial groups are<br />
measuring no efforts to achieve quality excellence, starting by customer services and<br />
relationship. Indian banking sector opened its doors to private and international players<br />
after the economic liberalization in the year 1991. It has been almost 2 decades <strong>of</strong><br />
operation <strong>of</strong> the private banks in India. Much has evolved in the overall structure <strong>of</strong><br />
banking during this time but have the private banks delivered the type <strong>of</strong> quality that the<br />
customers expect them to. This research is an effort to evaluate the service quality <strong>of</strong> the<br />
private banks in India. The study is based on primary data collected in the cities <strong>of</strong> Delhi<br />
and NCR through a structured questionnaire designed on the basis <strong>of</strong> SERVQUAL<br />
Model. The banks under study are the five top private banks from Delhi and NCR region.<br />
The study has found that none <strong>of</strong> the banks have been able to meet the customer<br />
expectations and are still dwelling on the ‘zone <strong>of</strong> pain’. The research is very useful for<br />
managers, policymakers, implementers as well as academicians. The research provides<br />
implications for managers as well as policy makers to understand the customer<br />
expectations in India. It can be a guideline for bigger role for the BCSBI (Banking Codes<br />
and Standard Board <strong>of</strong> India). Implications for future research are also discussed. The<br />
novelty <strong>of</strong> the research lies in the context that no effort has been made so far to effect<br />
research on sector specific contribution <strong>of</strong> banks. There is also very little literature<br />
available to identify the need-service gap in this area. The study adds value to the<br />
knowledge in the field <strong>of</strong> banking service quality for development and also opens new<br />
areas <strong>of</strong> research.<br />
Key Words: Customer Satisfaction, SERVQUAL Analysis, GAP Analysis, Private Sector<br />
banks, Service Quality.<br />
INTRODUCTION<br />
Customer satisfaction is a popular research topic among researchers <strong>of</strong> different areas. Banking industry is<br />
not an exception to this. Banking is one <strong>of</strong> the numerouno services in which the customer satisfaction has<br />
had an ever increasing importance in the corresponding research areas. This is essentially because the<br />
banking sector is becoming more and more competitive (Lindenmeier and Tscheulin, 2008). Retail banks<br />
are pursuing this strategy, in part, because <strong>of</strong> the difficulty in differentiating based on the service <strong>of</strong>fering.<br />
2013©<strong>Academy</strong> <strong>of</strong> <strong>Knowledge</strong> <strong>Process</strong><br />
33
International Journal <strong>of</strong> Contemporary Business Studies<br />
Vol: 4, No: 1. January, 2013 ISSN 2156-7506<br />
Available online at http://www.akpinsight.webs.com<br />
Typically, customers perceive very little difference in the services <strong>of</strong>fered by retail banks and any new<br />
<strong>of</strong>fering is quickly matched by competitors (Devlin et al., 1995).<br />
MEASURING CUSTOMER SATISFACTION IN BANKING<br />
Customer Satisfaction, a business term, is a measure <strong>of</strong> how products and services supplied by a company<br />
meet or surpass customer expectation. It is seen as a key performance indicator within business and is part<br />
<strong>of</strong> the strategy for customer retention. The entry <strong>of</strong> private sector commercial banks can be traced to the<br />
period <strong>of</strong> privatization and the need to satisfy customers all the more by the banking sector increased.<br />
However no consistent effort was taken on the part <strong>of</strong> policy makers to trace the level <strong>of</strong> satisfaction from<br />
the services till the year 2003 when BCSBI (Banking Codes and Standards Boards <strong>of</strong> India) an<br />
autonomous body was formed to monitor the level <strong>of</strong> services provided by the Indian banks.<br />
SERVQUAL MODELS<br />
A quite large number <strong>of</strong> models have been derived by experts round the world to derive the level <strong>of</strong> service<br />
quality and therefore the customer satisfaction perhaps the best and the most widely validated research is<br />
one by Parasurama et al. (1995) popularly known as SERVQUAL Model. This is the one that will be used<br />
in this research to evaluate the level <strong>of</strong> service quality <strong>of</strong> Private Sector banks in India. Below is a<br />
discussion on the SERVQUAL Model:<br />
GAP Model (Parasuraman et al. 1985)<br />
The GAP model was proposed by Parasuraman et al. (1985). The model presupposes that service quality is<br />
the differences between expectation and performance relating to quality dimensions. These differences are<br />
referred to as gaps.<br />
The gaps model conceptualizes five gaps which are:<br />
Gap 1: Difference between consumers’ expectation and management’s perceptions <strong>of</strong> consumers’<br />
expectations (not identifying what consumers expect);<br />
Gap 2: Disparity between management’s perceptions <strong>of</strong> consumer’s expectations and service quality<br />
specifications (inappropriate service-quality standards);<br />
Gap 3: Variations between service quality specifications and service actually delivered (poor delivery<br />
<strong>of</strong> service quality);<br />
Gap 4: Difference between service delivery and the communications to consumers about service<br />
delivery (promises mismatch delivery);<br />
Gap 5: Difference between consumer’s expectation and perceived service; this gap depends on size and<br />
direction <strong>of</strong> the four gaps associated with the delivery <strong>of</strong> service quality on the marketer’s side.<br />
Based on the above five gaps, the SERVQUAL instrument was developed. It initially consisted <strong>of</strong> ten<br />
dimensions which were later refined into five dimensions namely, reliability, responsiveness, tangibles,<br />
assurance (communication, competence, credibility, courtesy, and security) and empathy (which capture<br />
access and understanding or knowing the customers). Later in year 1991 SERVQUAL was revised by<br />
replacing “should” word by “would” and in 1994 by reducing the total number <strong>of</strong> items to 22, but five<br />
dimensional structure remaining the same. In addition to this empirical research, the authors later came out<br />
with the extended service quality model. According to this extended model most factors involve<br />
communication and control process implemented in organizations to manage employees.<br />
OBJECTIVES OF THE STUDY<br />
The main objectives <strong>of</strong> the study are:<br />
a. To have a clear understanding <strong>of</strong> the level <strong>of</strong> service quality in the Private Sector banks in India.<br />
b. To find out the gap in the dimensions <strong>of</strong> service quality based on the SERVQUAL analysis.<br />
2013©<strong>Academy</strong> <strong>of</strong> <strong>Knowledge</strong> <strong>Process</strong><br />
34
International Journal <strong>of</strong> Contemporary Business Studies<br />
Vol: 4, No: 1. January, 2013 ISSN 2156-7506<br />
Available online at http://www.akpinsight.webs.com<br />
RESEARCH METHODOLOGY<br />
The study is exploratory in nature. It provides a description <strong>of</strong> contemporary satisfaction parameter in the<br />
Indian Banking Sector. The determination <strong>of</strong> the sample and the area <strong>of</strong> study is justified below:<br />
The research consists <strong>of</strong> 5 banks from the private sectors from Delhi and NCR region. The Top 5 banks<br />
<strong>of</strong> Private Sector Banks selected are ICICI Bank, HDFC Bank, HSBC Bank, Axis Bank and Federal<br />
Bank, The questionnaires were distributed manually to the customers <strong>of</strong> these banks in the cities <strong>of</strong> Delhi<br />
and NCR (National Capital Region). The purpose <strong>of</strong> choosing the capital <strong>of</strong> the country (Delhi) and NCR<br />
region as the study area because private banks in these areas are serving their customers more as<br />
compared to other cities. The basic reasons <strong>of</strong> opening more number <strong>of</strong> private banks are the income level<br />
<strong>of</strong> the customers are fairly high in these areas. The respondents are selected at random on visits to banks.<br />
Therefore for the purpose <strong>of</strong> our research the probability sampling process has been used. The sample<br />
size was determined according to (Cooper and Schindler, 2003), the formula as follows:<br />
(+,-) 0.05 → desired interval range within which the population proportion is expected (subjective<br />
decision).<br />
1.96(σ p ) → 95 percent confidence level for estimating the interval within which the population proportion<br />
is expected (subject decision).<br />
σ p =0.0255 → standard error for the proportion (0.05/1.96)<br />
pq → measure <strong>of</strong> sample dispersion (used here as an estimate <strong>of</strong> the population dispersion).<br />
pq<br />
n =<br />
σ<br />
2<br />
p<br />
For the purpose <strong>of</strong> this research, after running 30 questionnaires a sample size (N) was derived for each<br />
bank as follows.<br />
0.24×<br />
0.76<br />
N = = 280<br />
2<br />
0.0255<br />
Therefore the total sample size for all the 5 banks is 280×5 = 1400.<br />
ANALYSIS AND FINDINGS<br />
Following is the detailed analysis <strong>of</strong> the 5 banks under study based on the SERVQUAL analysis.<br />
SERVQUAL analysis for ICICI Bank<br />
Table 1 depicts the SERVQUAL score <strong>of</strong> the five dimensions for ICICI Bank. The highest expectation<br />
score for the tangibility dimension is for E4 and the lowest is for the E3. The perception score for this<br />
dimension is highest for the P2 and lowest for P1. For the reliability dimension the highest score for the<br />
expectation is for E5 and the lowest is for the E8.As against expectation the perception score for reliability<br />
dimension was highest for P6 and lowest for P5. In case <strong>of</strong> responsiveness dimension the highest<br />
expectation was for E12 and the lowest was for E10. The perception scores for this dimension were highest<br />
for P11 and lowest for P10. For the assurance dimension the highest expectation score was for E17 and the<br />
lowest for E14 and E15. The perception score was highest for P15 and the lowest for P17. For the empathy<br />
dimension the highest expectation score was for E21 and the lowest for E22.As against the expectation<br />
scores the perception score for this dimension are highest for P19/22 and the lowest for P18.<br />
2013©<strong>Academy</strong> <strong>of</strong> <strong>Knowledge</strong> <strong>Process</strong><br />
35
International Journal <strong>of</strong> Contemporary Business Studies<br />
Vol: 4, No: 1. January, 2013 ISSN 2156-7506<br />
Available online at http://www.akpinsight.webs.com<br />
Table 1: Average ‘SERVQUAL’ <strong>of</strong> various dimensions for ICICI Bank<br />
Tangible<br />
E1: Excellent banking<br />
companies will have modern<br />
looking equipment.<br />
E2: The physical facilities ate<br />
excellent banks will be visually<br />
appealing<br />
E3: Employees at excellent<br />
banks will be neat appearing<br />
E4: Materials association with<br />
the service (such as pamphlets<br />
or statements) will be visually<br />
appealing at excellent banks.<br />
Reliability<br />
E5: When excellent banks<br />
promise to do something by a<br />
certain time, they do.<br />
E6: When a customer has a<br />
problem, excellent banks will<br />
show a sincere interest in<br />
solving it.<br />
E7: Excellent banks will<br />
perform the service right the<br />
first time.<br />
E8: Excellent banks will<br />
provide the service at the time<br />
them promise to do so.<br />
E9: Excellent banks will insist<br />
on error free records<br />
Responsiveness<br />
E10: Employees <strong>of</strong> excellent<br />
banks will tell customers<br />
exactly when services will be<br />
performed.<br />
E11:Employees <strong>of</strong> excellent<br />
banks will give prompt service<br />
to customers.<br />
E12:Employees <strong>of</strong> excellent<br />
banks will always be willing to<br />
help customers.<br />
E13:Employees <strong>of</strong> excellent<br />
banks will never be too busy to<br />
respond to customers’ requests.<br />
Assurance<br />
E14: The behaviour <strong>of</strong><br />
employees in excellent banks<br />
(E) (P) Gap Score<br />
P-E<br />
Tangible<br />
4.12 P1: Your bank has modern looking 3.46 -0.66<br />
equipment<br />
3.99 P2: Your bank’s physical facilities are<br />
visually appealing<br />
3.88 -0.11<br />
3.96 P3: Your bank’s reception desk 3.75 -0.21<br />
employee are neat appearing<br />
4.45 P4: Materials associated with the 3.70 -0.84<br />
service (such as pamphlets or<br />
statements) are visually appealing at<br />
your bank.<br />
Average Tangible SERVQUAL score -0.45<br />
Reliability<br />
4.54 P5: When your bank promises to do 3.39 -1.15<br />
something by a certain time, it does so.<br />
4.44 P6: When you have a problem, your<br />
bank shows a sincere interest in<br />
solving it.<br />
4.40 P7: Your bank performs the service<br />
right the first time.<br />
4.29 P8: Your bank provides its service at<br />
the time it promises to do so.<br />
4.41 P9: Your bank insists on error free<br />
records.<br />
Average Reliability SERVQUAL<br />
score<br />
Responsiveness<br />
4.37 P10: Employees in your bank tell you<br />
exactly when services will be<br />
performed.<br />
4.50 P11: Employees in your bank give you<br />
prompt service.<br />
4.57 P12: Employees in your bank are<br />
always willing to help you.<br />
4.44 P13: Employees in your bank are<br />
never too busy to respond to your<br />
request.<br />
Average Responsiveness SERVQUAL<br />
score<br />
Assurance<br />
4.12 P14: The behaviour <strong>of</strong> employees in<br />
your bank instill confidence in you.<br />
3.78 -0.66<br />
3.61 -0.79<br />
3.63 -0.66<br />
3.70 -0.71<br />
-0.79<br />
3.43 -0.94<br />
3.64 -0.86<br />
3.50 -1.07<br />
3.57 -0.87<br />
-0.75<br />
3.35 -0.77<br />
2013©<strong>Academy</strong> <strong>of</strong> <strong>Knowledge</strong> <strong>Process</strong><br />
36
International Journal <strong>of</strong> Contemporary Business Studies<br />
Vol: 4, No: 1. January, 2013 ISSN 2156-7506<br />
Available online at http://www.akpinsight.webs.com<br />
will instill confidence in<br />
customers.<br />
E15: Customers <strong>of</strong> excellent<br />
banks will feel safe in<br />
transactions<br />
E16: Employees <strong>of</strong> excellent<br />
banks will be consistently<br />
courteous with customers.<br />
E17: Employees <strong>of</strong> excellent<br />
banks will have the knowledge<br />
to answer customers’ questions.<br />
Empathy<br />
E18: Excellent banks will give<br />
customers individual attention<br />
E19: Excellent banks will have<br />
operating hours convenient to<br />
all their customers.<br />
E20: Excellent banks will have<br />
employees who give customers<br />
personal attention.<br />
E21: Excellent banks will have<br />
their customer’s best interests at<br />
heart.<br />
E22:The employees <strong>of</strong> excellent<br />
banks will understand the<br />
specific needs <strong>of</strong> their customer<br />
4.12 P15: You feel safe in your transactions<br />
with your bank.<br />
4.35 P16: Employees in your bank area<br />
consistently courteous with you.<br />
4.70 P17: Employees in your bank have the<br />
knowledge to answer your questions.<br />
Average Assurance SERVQUAL<br />
score<br />
Empathy<br />
4.9 P18: Your bank gives you individual<br />
attention<br />
4.9 P19: Your bank has operating hours<br />
convenient to all its customers<br />
4.9 P20: Your bank has employees who<br />
give you personal attention.<br />
4.91 P21: Your bank has your best interest<br />
at heart.<br />
4.76 P22: The employees <strong>of</strong> your bank<br />
understand your specific needs.<br />
3.53 -0.59<br />
3.35 -1.00<br />
3.06 -1.64<br />
-1.00<br />
3.59 -1.31<br />
3.94 -0.96<br />
3.81 -1.09<br />
3.74 -1.17<br />
3.94 -0.82<br />
Average Empathy SERVQUAL scores -1.07<br />
SERVQUAL analysis for HDFC Bank<br />
Table 2 depicts the SERVQUAL score <strong>of</strong> the five dimensions for HDFC Bank. The highest expectation<br />
score for the tangibility dimension is for E4 and the lowest is for the E2/3. The perception score for this<br />
dimension is highest for the P2 and lowest for P1. For the reliability dimension the highest score for the<br />
expectation is for E5 and the lowest is for the E8. As against expectation the perception score for reliability<br />
dimension was highest for P6 and lowest for P7. In case <strong>of</strong> responsiveness dimension the highest<br />
expectation was for E71 and the lowest was for E10/11. The perception scores for this dimension were<br />
highest for P11 and lowest for P13. For the assurance dimension the highest expectation score was for E17<br />
and the lowest for E12 and E13. The perception score was highest for P15 and the lowest for P14/16. For<br />
the empathy dimension the highest expectation score was for E21 and the lowest for E18/19/20. As against<br />
the expectation scores the perception score for this dimension are highest for P19/22 and the lowest for<br />
P18.<br />
Table 2 : Average ‘SERVQUAL’ <strong>of</strong> various dimensions for HDFC Bank<br />
Tangible<br />
E1: Excellent banking<br />
companies will have modern<br />
looking equipment.<br />
E2: The physical facilities ate<br />
excellent banks will be visually<br />
(E) (P) Gap Score<br />
P-E<br />
Tangible<br />
4.72 P1: Your bank has modern looking 3.74 -0.98<br />
equipment<br />
4.71 P2: Your bank’s physical facilities are<br />
visually appealing<br />
3.97 -0.74<br />
2013©<strong>Academy</strong> <strong>of</strong> <strong>Knowledge</strong> <strong>Process</strong><br />
37
International Journal <strong>of</strong> Contemporary Business Studies<br />
Vol: 4, No: 1. January, 2013 ISSN 2156-7506<br />
Available online at http://www.akpinsight.webs.com<br />
appealing<br />
E3: Employees at excellent<br />
banks will be neat appearing<br />
E4: Materials association with<br />
the service (such as pamphlets<br />
or statements) will be visually<br />
appealing at excellent banks.<br />
Reliability<br />
E5: When excellent banks<br />
promise to do something by a<br />
certain time, they do.<br />
E6: When a customer has a<br />
problem, excellent banks will<br />
show a sincere interest in<br />
solving it.<br />
E7: Excellent banks will<br />
perform the service right the<br />
first time.<br />
E8: Excellent banks will<br />
provide the service at the time<br />
them promise to do so.<br />
E9: Excellent banks will insist<br />
on error free records<br />
Responsiveness<br />
E10: Employees <strong>of</strong> excellent<br />
banks will tell customers<br />
exactly when services will be<br />
performed.<br />
E11:Employees <strong>of</strong> excellent<br />
banks will give prompt service<br />
to customers.<br />
E12:Employees <strong>of</strong> excellent<br />
banks will always be willing to<br />
help customers.<br />
E13:Employees <strong>of</strong> excellent<br />
banks will never be too busy to<br />
respond to customers’ requests.<br />
Assurance<br />
E14: The behaviour <strong>of</strong><br />
employees in excellent banks<br />
will instill confidence in<br />
customers.<br />
E15: Customers <strong>of</strong> excellent<br />
banks will feel safe in<br />
transactions<br />
E16: Employees <strong>of</strong> excellent<br />
banks will be consistently<br />
courteous with customers.<br />
E17: Employees <strong>of</strong> excellent<br />
banks will have the knowledge<br />
4.71 P3: Your bank’s reception desk 3.82 -0.89<br />
employee are neat appearing<br />
4.74 P4: Materials associated with the 3.93 -0.81<br />
service (such as pamphlets or<br />
statements) are visually appealing at<br />
your bank.<br />
Average Tangible SERVQUAL score -0.86<br />
Reliability<br />
4.54 P5: When your bank promises to do 3.69 -0.85<br />
something by a certain time, it does so.<br />
4.46 P6: When you have a problem, your<br />
bank shows a sincere interest in<br />
solving it.<br />
4.46 P7: Your bank performs the service<br />
right the first time.<br />
4.37 P8: Your bank provides its service at<br />
the time it promises to do so.<br />
4.46 P9: Your bank insists on error free<br />
records.<br />
Average Reliability SERVQUAL<br />
score<br />
Responsiveness<br />
4.12 P10: Employees in your bank tell you<br />
exactly when services will be<br />
performed.<br />
4.12 P11: Employees in your bank give you<br />
prompt service.<br />
4.36 P12: Employees in your bank are<br />
always willing to help you.<br />
4.71 P13: Employees in your bank are<br />
never too busy to respond to your<br />
request.<br />
Average Responsiveness SERVQUAL<br />
score<br />
Assurance<br />
4.12 P14: The behaviour <strong>of</strong> employees in<br />
your bank instill confidence in you.<br />
4.12 P15: You feel safe in your transactions<br />
with your bank.<br />
4.36 P16: Employees in your bank area<br />
consistently courteous with you.<br />
4.71 P17: Employees in your bank have the<br />
knowledge to answer your questions.<br />
4.01 -0.45<br />
3.38 -0.54<br />
3.82 -0.64<br />
3.96 -0.52<br />
-0.44<br />
3.36 -0.76<br />
3.53 -0.59<br />
3.36 -1.00<br />
3.07 -1.64<br />
-1.00<br />
3.36 -0.76<br />
3.53 -0.59<br />
3.36 -1.00<br />
3.07 -1.64<br />
2013©<strong>Academy</strong> <strong>of</strong> <strong>Knowledge</strong> <strong>Process</strong><br />
38
International Journal <strong>of</strong> Contemporary Business Studies<br />
Vol: 4, No: 1. January, 2013 ISSN 2156-7506<br />
Available online at http://www.akpinsight.webs.com<br />
to answer customers’ questions.<br />
Empathy<br />
E18: Excellent banks will give<br />
customers individual attention<br />
E19: Excellent banks will have<br />
operating hours convenient to<br />
all their customers.<br />
E20: Excellent banks will have<br />
employees who give customers<br />
personal attention.<br />
E21: Excellent banks will have<br />
their customer’s best interests at<br />
heart.<br />
E22: The employees <strong>of</strong><br />
excellent banks will understand<br />
the specific needs <strong>of</strong> their<br />
customer<br />
Average Assurance SERVQUAL<br />
score<br />
Empathy<br />
4.90 P18: Your bank gives you individual<br />
attention<br />
4.90 P19: Your bank has operating hours<br />
convenient to all its customers<br />
4.90 P20: Your bank has employees who<br />
give you personal attention.<br />
4.91 P21: Your bank has your best interest<br />
at heart.<br />
4.76 P22: The employees <strong>of</strong> your bank<br />
understand your specific needs.<br />
-1.00<br />
3.57 -1.33<br />
3.92 -0.98<br />
3.79 -1.11<br />
3.72 -1.19<br />
3.92 -0.84<br />
Average Empathy SERVQUAL scores -1.09<br />
SERVQUAL analysis for HSBC Bank<br />
Table 3 depicts the SERVQUAL score <strong>of</strong> the five dimensions for HSBC Bank. The highest expectation<br />
score for the tangibility dimension is for E4 and the lowest is for the E3. The perception score for this<br />
dimension is highest for the P4 and lowest for P1. For the reliability dimension the highest score for the<br />
expectation is for E5 and the lowest is for the E8. As against expectation the perception score for reliability<br />
dimension was highest for P9 and lowest for P5. In case <strong>of</strong> responsiveness dimension the highest<br />
expectation was for E12 and the lowest was for E10. The perception scores for this dimension were highest<br />
for P11 and lowest for P10. For the assurance dimension the highest expectation score was for E17 and the<br />
lowest for E14/15.The perception score was highest for P15 and the lowest for P16. For the empathy<br />
dimension the highest expectation score was for E21 and the lowest for E22. As against the expectation<br />
scores the perception score for this dimension are highest for P19 and the lowest for P18.<br />
Table 3 : Average ‘SERVQUAL’ <strong>of</strong> various dimensions for HSBC Bank<br />
Tangible<br />
E1: Excellent banking<br />
companies will have modern<br />
looking equipment.<br />
E2: The physical facilities ate<br />
excellent banks will be visually<br />
appealing<br />
E3: Employees at excellent<br />
banks will be neat appearing<br />
E4: Materials association with<br />
the service (such as pamphlets<br />
or statements) will be visually<br />
appealing at excellent banks.<br />
Reliability<br />
E5: When excellent banks<br />
promise to do something by a<br />
(E) (P) Gap Score<br />
P-E<br />
Tangible<br />
4.30 P1: Your bank has modern looking 3.59 -0.44<br />
equipment<br />
3.94 P2: Your bank’s physical facilities are<br />
visually appealing<br />
3.78 -0.16<br />
3.92 P3: Your bank’s reception desk 3.64 -0.28<br />
employee are neat appearing<br />
4.53 P4: Materials associated with the 3.87 -0.66<br />
service (such as pamphlets or<br />
statements) are visually appealing at<br />
your bank.<br />
Average Tangible SERVQUAL score -0.38<br />
Reliability<br />
4.53 P5: When your bank promises to do 3.36 -1.17<br />
something by a certain time, it does so.<br />
2013©<strong>Academy</strong> <strong>of</strong> <strong>Knowledge</strong> <strong>Process</strong><br />
39
International Journal <strong>of</strong> Contemporary Business Studies<br />
Vol: 4, No: 1. January, 2013 ISSN 2156-7506<br />
Available online at http://www.akpinsight.webs.com<br />
certain time, they do.<br />
E6: When a customer has a<br />
problem, excellent banks will<br />
show a sincere interest in<br />
solving it.<br />
E7: Excellent banks will<br />
perform the service right the<br />
first time.<br />
E8: Excellent banks will<br />
provide the service at the time<br />
them promise to do so.<br />
E9: Excellent banks will insist<br />
on error free records<br />
Responsiveness<br />
E10: Employees <strong>of</strong> excellent<br />
banks will tell customers<br />
exactly when services will be<br />
performed.<br />
E11:Employees <strong>of</strong> excellent<br />
banks will give prompt service<br />
to customers.<br />
E12:Employees <strong>of</strong> excellent<br />
banks will always be willing to<br />
help customers.<br />
E13:Employees <strong>of</strong> excellent<br />
banks will never be too busy to<br />
respond to customers’ requests.<br />
Assurance<br />
E14: The behaviour <strong>of</strong><br />
employees in excellent banks<br />
will instill confidence in<br />
customers.<br />
E15: Customers <strong>of</strong> excellent<br />
banks will feel safe in<br />
transactions<br />
E16: Employees <strong>of</strong> excellent<br />
banks will be consistently<br />
courteous with customers.<br />
E17: Employees <strong>of</strong> excellent<br />
banks will have the knowledge<br />
to answer customers’ questions.<br />
Empathy<br />
E18: Excellent banks will give<br />
customers individual attention<br />
E19: Excellent banks will have<br />
operating hours convenient to<br />
all their customers.<br />
E20: Excellent banks will have<br />
employees who give customers<br />
4.44 P6: When you have a problem, your<br />
bank shows a sincere interest in<br />
solving it.<br />
4.44 P7: Your bank performs the service<br />
right the first time.<br />
4.36 P8: Your bank provides its service at<br />
the time it promises to do so.<br />
4.47 P9: Your bank insists on error free<br />
records.<br />
Average Reliability SERVQUAL<br />
score<br />
Responsiveness<br />
4.27 P10: Employees in your bank tell you<br />
exactly when services will be<br />
performed.<br />
4.41 P11: Employees in your bank give you<br />
prompt service.<br />
4.50 P12: Employees in your bank are<br />
always willing to help you.<br />
4.37 P13: Employees in your bank are<br />
never too busy to respond to your<br />
request.<br />
Average Responsiveness SERVQUAL<br />
score<br />
Assurance<br />
4.11 P14: The behaviour <strong>of</strong> employees in<br />
your bank instill confidence in you.<br />
4.11 P15: You feel safe in your transactions<br />
with your bank.<br />
4.35 P16: Employees in your bank area<br />
consistently courteous with you.<br />
4.71 P17: Employees in your bank have the<br />
knowledge to answer your questions.<br />
Average Assurance SERVQUAL<br />
score<br />
Empathy<br />
4.90 P18: Your bank gives you individual<br />
attention<br />
4.90 P19: Your bank has operating hours<br />
convenient to all its customers<br />
4.90 P20: Your bank has employees who<br />
give you personal attention.<br />
3.79 -0.65<br />
3.57 -0.87<br />
3.66 -0.70<br />
3.72 -0.75<br />
-0.83<br />
3.74 -0.53<br />
4.00 -0.41<br />
3.87 -0.63<br />
3.87 -0.50<br />
-0.41<br />
3.35 -0.76<br />
3.53 -0.58<br />
3.35 -1.00<br />
3.05 -1.66<br />
-1.00<br />
3.57 -1.33<br />
3.92 -0.98<br />
3.79 -1.11<br />
2013©<strong>Academy</strong> <strong>of</strong> <strong>Knowledge</strong> <strong>Process</strong><br />
40
International Journal <strong>of</strong> Contemporary Business Studies<br />
Vol: 4, No: 1. January, 2013 ISSN 2156-7506<br />
Available online at http://www.akpinsight.webs.com<br />
personal attention.<br />
E21: Excellent banks will have<br />
their customer’s best interests at<br />
heart.<br />
E22:The employees <strong>of</strong> excellent<br />
banks will understand the<br />
specific needs <strong>of</strong> their customer<br />
4.91 P21: Your bank has your best interest<br />
at heart.<br />
4.76 P22: The employees <strong>of</strong> your bank<br />
understand your specific needs.<br />
3.73 -1.18<br />
3.92 -0.84<br />
Average Empathy SERVQUAL scores -1.09<br />
SERVQUAL analysis for Axis Bank<br />
Table 4 depicts the SERVQUAL score <strong>of</strong> the five dimensions for Axis Bank. The highest expectation score<br />
for the tangibility dimension is for E4 and for the rest <strong>of</strong> the parameters it is the same. The perception score<br />
for this dimension is highest for the P2 and lowest for P4. For the reliability dimension the highest score for<br />
the expectation is for E8 and the lowest is for the E5.As against expectation the perception score for<br />
reliability dimension was highest for P6 and lowest for P5. In case <strong>of</strong> responsiveness dimension the highest<br />
expectation was for E12 and the lowest was for E10. The perception scores for this dimension were highest<br />
for P11 and lowest for P10. For the assurance dimension the highest expectation score was for E17 and the<br />
lowest for E14 and E15. The perception score was highest for P14 and the lowest for P17. For the empathy<br />
dimension the highest expectation score was for E21 and the lowest for E14/15. As against the expectation<br />
scores the perception score for this dimension are highest for P19 and the lowest for P18.<br />
Table 4 : Average ‘SERVQUAL’ <strong>of</strong> various dimensions for Axis Bank<br />
(E) (P) Gap Score<br />
P-E<br />
Tangible<br />
Tangible<br />
E1: Excellent banking 4.70 P1: Your bank has modern looking 3.30 -1.40<br />
companies will have modern equipment<br />
looking equipment.<br />
E2: The physical facilities ate 4.70 P2: Your bank’s physical facilities are 3.42 -1.28<br />
excellent banks will be visually<br />
appealing<br />
visually appealing<br />
E3: Employees at excellent 4.70 P3: Your bank’s reception desk 3.27 -1.43<br />
banks will be neat appearing<br />
employee are neat appearing<br />
E4: Materials association with 4.71 P4: Materials associated with the 3.02 -1.69<br />
the service (such as pamphlets service (such as pamphlets or<br />
or statements) will be visually<br />
appealing at excellent banks.<br />
statements) are visually appealing at<br />
your bank.<br />
Average Tangible SERVQUAL score -1.45<br />
Reliability<br />
Reliability<br />
E5: When excellent banks 4.71 P5: When your bank promises to do 3.57 -1.14<br />
promise to do something by a something by a certain time, it does so.<br />
certain time, they do.<br />
E6: When a customer has a 4.77 P6: When you have a problem, your 3.94 -0.83<br />
problem, excellent banks will<br />
show a sincere interest in<br />
solving it.<br />
bank shows a sincere interest in<br />
solving it.<br />
E7: Excellent banks will 4.72 P7: Your bank performs the service 3.76 -0.96<br />
perform the service right the right the first time.<br />
first time.<br />
E8: Excellent banks will 4.73 P8: Your bank provides its service at 3.81 -0.92<br />
provide the service at the time the time it promises to do so.<br />
them promise to do so.<br />
E9: Excellent banks will insist 4.72 P9: Your bank insists on error free 3.88 -0.84<br />
2013©<strong>Academy</strong> <strong>of</strong> <strong>Knowledge</strong> <strong>Process</strong><br />
41
International Journal <strong>of</strong> Contemporary Business Studies<br />
Vol: 4, No: 1. January, 2013 ISSN 2156-7506<br />
Available online at http://www.akpinsight.webs.com<br />
on error free records<br />
Responsiveness<br />
E10: Employees <strong>of</strong> excellent<br />
banks will tell customers<br />
exactly when services will be<br />
performed.<br />
E11:Employees <strong>of</strong> excellent<br />
banks will give prompt service<br />
to customers.<br />
E12:Employees <strong>of</strong> excellent<br />
banks will always be willing to<br />
help customers.<br />
E13:Employees <strong>of</strong> excellent<br />
banks will never be too busy to<br />
respond to customers’ requests.<br />
Assurance<br />
E14: The behaviour <strong>of</strong><br />
employees in excellent banks<br />
will instill confidence in<br />
customers.<br />
E15: Customers <strong>of</strong> excellent<br />
banks will feel safe in<br />
transactions<br />
E16: Employees <strong>of</strong> excellent<br />
banks will be consistently<br />
courteous with customers.<br />
E17: Employees <strong>of</strong> excellent<br />
banks will have the knowledge<br />
to answer customers’ questions.<br />
Empathy<br />
E18: Excellent banks will give<br />
customers individual attention<br />
E19: Excellent banks will have<br />
operating hours convenient to<br />
all their customers.<br />
E20: Excellent banks will have<br />
employees who give customers<br />
personal attention.<br />
E21: Excellent banks will have<br />
their customer’s best interests at<br />
heart.<br />
E22: The employees <strong>of</strong><br />
excellent banks will understand<br />
the specific needs <strong>of</strong> their<br />
customer<br />
records.<br />
Average Reliability SERVQUAL<br />
score<br />
Responsiveness<br />
4.53 P10: Employees in your bank tell you<br />
exactly when services will be<br />
performed.<br />
4.60 P11: Employees in your bank give you<br />
prompt service.<br />
4.66 P12: Employees in your bank are<br />
always willing to help you.<br />
4.60 P13: Employees in your bank are<br />
never too busy to respond to your<br />
request.<br />
Average Responsiveness SERVQUAL<br />
score<br />
Assurance<br />
4.23 P14: The behaviour <strong>of</strong> employees in<br />
your bank instill confidence in you.<br />
4.23 P15: You feel safe in your transactions<br />
with your bank.<br />
4.50 P16: Employees in your bank area<br />
consistently courteous with you.<br />
4.73 P17: Employees in your bank have the<br />
knowledge to answer your questions.<br />
Average Assurance SERVQUAL<br />
score<br />
Empathy<br />
4.90 P18: Your bank gives you individual<br />
attention<br />
4.90 P19: Your bank has operating hours<br />
convenient to all its customers<br />
4.90 P20: Your bank has employees who<br />
give you personal attention.<br />
4.91 P21: Your bank has your best interest<br />
at heart.<br />
4.76 P22: The employees <strong>of</strong> your bank<br />
understand your specific needs.<br />
-0.93<br />
3.65 -0.88<br />
3.92 -0.68<br />
3.78 -0.88<br />
3.78 -0.82<br />
-0.65<br />
4.23 -0.78<br />
3.61 -0.62<br />
3.41 -1.09<br />
3.18 -1.55<br />
-1.01<br />
3.57 -1.33<br />
3.93 -0.97<br />
3.80 -1.10<br />
3.73 -1.18<br />
3.93 -0.83<br />
Average Empathy SERVQUAL scores -1.08<br />
2013©<strong>Academy</strong> <strong>of</strong> <strong>Knowledge</strong> <strong>Process</strong><br />
42
International Journal <strong>of</strong> Contemporary Business Studies<br />
Vol: 4, No: 1. January, 2013 ISSN 2156-7506<br />
Available online at http://www.akpinsight.webs.com<br />
SERVQUAL analysis for Federal Bank<br />
Table 5 depicts the SERVQUAL score <strong>of</strong> the five dimensions for Federal Bank. The highest expectation<br />
score for the tangibility dimension is for E2 and the lowest is for the E3. The perception score for this<br />
dimension is highest for the P3 and lowest for P1. For the reliability dimension the highest score for the<br />
expectation is for E5 and the lowest is for the E8. As against expectation the perception score for reliability<br />
dimension was highest for P6 and lowest for P5. In case <strong>of</strong> responsiveness dimension the highest<br />
expectation was for E12 and the lowest was for E10. The perception scores for this dimension were highest<br />
for P10/11 and lowest for P12/13. For the assurance dimension the highest expectation score was for E16<br />
and the lowest for E14 and E15. The perception score was highest for P15 and the lowest for P17. For the<br />
empathy dimension the highest expectation score was for E21 and the lowest for E22. As against the<br />
expectation scores the perception score for this dimension are highest for P22 and the lowest for P21.<br />
Table 5: Average ‘SERVQUAL’ <strong>of</strong> various dimensions for Federal Bank<br />
(E) (P) Gap Score<br />
P-E<br />
Tangible<br />
E1: Excellent banking<br />
companies will have modern<br />
looking equipment.<br />
E2: The physical facilities ate<br />
excellent banks will be visually<br />
appealing<br />
Tangible<br />
4.76 P1: Your bank has modern looking<br />
equipment<br />
5.00 P2: Your bank’s physical facilities are<br />
visually appealing<br />
3.53 -1.23<br />
3.99 -1.01<br />
E3: Employees at excellent 4.84 P3: Your bank’s reception desk 3.89 -0.95<br />
banks will be neat appearing<br />
employee are neat appearing<br />
E4: Materials association with 4.93 P4: Materials associated with the 3.86 -1.07<br />
the service (such as pamphlets service (such as pamphlets or<br />
or statements) will be visually<br />
appealing at excellent banks.<br />
statements) are visually appealing at<br />
your bank.<br />
Average Tangible SERVQUAL score<br />
Reliability<br />
Reliability<br />
E5: When excellent banks 4.59 P5: When your bank promises to do 3.44 -1.15<br />
promise to do something by a something by a certain time, it does so.<br />
certain time, they do.<br />
E6: When a customer has a 4.46 P6: When you have a problem, your 3.88 -0.58<br />
problem, excellent banks will<br />
show a sincere interest in<br />
solving it.<br />
bank shows a sincere interest in<br />
solving it.<br />
E7: Excellent banks will 4.38 P7: Your bank performs the service 3.68 -0.70<br />
perform the service right the right the first time.<br />
first time.<br />
E8: Excellent banks will 4.26 P8: Your bank provides its service at 3.80 -0.46<br />
provide the service at the time the time it promises to do so.<br />
them promise to do so.<br />
E9: Excellent banks will insist 4.38 P9: Your bank insists on error free 3.84 -0.54<br />
on error free records<br />
records.<br />
Average Reliability SERVQUAL -0.68<br />
score<br />
Responsiveness<br />
Responsiveness<br />
E10: Employees <strong>of</strong> excellent 4.51 P10: Employees in your bank tell you 3.25 -1.26<br />
banks will tell customers exactly when services will be<br />
exactly when services will be performed.<br />
performed.<br />
E11:Employees <strong>of</strong> excellent 4.62 P11: Employees in your bank give you 3.25 -1.37<br />
2013©<strong>Academy</strong> <strong>of</strong> <strong>Knowledge</strong> <strong>Process</strong><br />
43
International Journal <strong>of</strong> Contemporary Business Studies<br />
Vol: 4, No: 1. January, 2013 ISSN 2156-7506<br />
Available online at http://www.akpinsight.webs.com<br />
banks will give prompt service<br />
to customers.<br />
E12:Employees <strong>of</strong> excellent<br />
banks will always be willing to<br />
help customers.<br />
E13:Employees <strong>of</strong> excellent<br />
banks will never be too busy to<br />
respond to customers’ requests.<br />
Assurance<br />
E14: The behaviour <strong>of</strong><br />
employees in excellent banks<br />
will instill confidence in<br />
customers.<br />
E15: Customers <strong>of</strong> excellent<br />
banks will feel safe in<br />
transactions<br />
E16: Employees <strong>of</strong> excellent<br />
banks will be consistently<br />
courteous with customers.<br />
E17: Employees <strong>of</strong> excellent<br />
banks will have the knowledge<br />
to answer customers’ questions.<br />
Empathy<br />
E18: Excellent banks will give<br />
customers individual attention<br />
E19: Excellent banks will have<br />
operating hours convenient to<br />
all their customers.<br />
E20: Excellent banks will have<br />
employees who give customers<br />
personal attention.<br />
E21: Excellent banks will have<br />
their customer’s best interests at<br />
heart.<br />
E22:The employees <strong>of</strong> excellent<br />
banks will understand the<br />
specific needs <strong>of</strong> their customer<br />
prompt service.<br />
4.67 P12: Employees in your bank are<br />
always willing to help you.<br />
4.56 P13: Employees in your bank are<br />
never too busy to respond to your<br />
request.<br />
Average Responsiveness SERVQUAL<br />
score<br />
Assurance<br />
4.12 P14: The behaviour <strong>of</strong> employees in<br />
your bank instill confidence in you.<br />
4.12 P15: You feel safe in your transactions<br />
with your bank.<br />
4.35 P16: Employees in your bank area<br />
consistently courteous with you.<br />
4.70 P17: Employees in your bank have the<br />
knowledge to answer your questions.<br />
Average Assurance SERVQUAL<br />
score<br />
Empathy<br />
4.90 P18: Your bank gives you individual<br />
attention<br />
4.90 P19: Your bank has operating hours<br />
convenient to all its customers<br />
4.90 P20: Your bank has employees who<br />
give you personal attention.<br />
4.92 P21: Your bank has your best interest<br />
at heart.<br />
4.77 P22: The employees <strong>of</strong> your bank<br />
understand your specific needs.<br />
3.13 -1.54<br />
3.13 -1.43<br />
-1.12<br />
3.33 -0.79<br />
3.43 -0.69<br />
3.20 -1.15<br />
3.00 -1.70<br />
-1.08<br />
3.8 -1.1<br />
4.07 -0.83<br />
3.8 -1.1<br />
3.7 -1.22<br />
4.16 -0.61<br />
Average Empathy SERVQUAL scores -0.97<br />
CONCLUSION<br />
Table 6 depicts the Average Weighted SERVQUAL scores <strong>of</strong> the private sector banks under study. In case<br />
<strong>of</strong> the private sector banks also it has been observed that the banks are in the ‘zone <strong>of</strong> pain’. HDFC Bank is<br />
the best among the private banks and Axis Bank is the worst <strong>of</strong> the five banks under study in terms <strong>of</strong><br />
service delivery. HDFC Bank has to work in the empathy dimension to perform better and move to the<br />
‘zone <strong>of</strong> satisfaction’ and then to the ‘zone <strong>of</strong> delight’. HSBC Bank which is just near HDFC Bank in<br />
service delivery has to work in assurance and empathy dimensions. ICICI Bank has also to work in the<br />
assurance and empathy dimensions. Federal Bank has to work in the responsiveness, assurance and the<br />
empathy dimensions. Axis Bank has to work in the dimensions <strong>of</strong> tangibility, assurance and empathy to<br />
move out <strong>of</strong> the ‘zone <strong>of</strong> pain’ to ‘zone <strong>of</strong> satisfaction’ and ‘delight’.<br />
2013©<strong>Academy</strong> <strong>of</strong> <strong>Knowledge</strong> <strong>Process</strong><br />
44
International Journal <strong>of</strong> Contemporary Business Studies<br />
Vol: 4, No: 1. January, 2013 ISSN 2156-7506<br />
Available online at http://www.akpinsight.webs.com<br />
Table 6: Average Weighted ‘SERVQUAL’ Scores <strong>of</strong> Private Sector Banks<br />
Name<br />
bank<br />
<strong>of</strong><br />
Dimensions <strong>of</strong> Service Quality<br />
Tangible Reliability Responsiveness Assurance Empathy<br />
Average<br />
Weighted<br />
SERVQUAL<br />
Score<br />
ICICI Bank -0.45 -0.79 -0.74 -1.00 -1.07 -16.92<br />
HDFC -0.86 -0.59 -0.44 -0.99 -1.09 -15.29<br />
HSBC -0.38 -0.83 -0.41 -1.00 -1.09 -15.41<br />
Axis Bank -1.45 -0.93 -0.65 -1.01 -1.08 -19.27<br />
Federal<br />
Bank<br />
-1.06 -0.68 -1.12 -1.08 -0.97 -18.94<br />
The present research has been undertaken with the help <strong>of</strong> SERVQUAL analysis and is trying to find the<br />
level <strong>of</strong> service quality in the Private Banks. Further research in this field can be carried out with the help<br />
<strong>of</strong> other tools <strong>of</strong> measuring service quality like the Kano’s Model <strong>of</strong> Product quality or Fuzzy based<br />
algorithmic analysis. The research provides a new approach to understanding the contribution and the<br />
condition <strong>of</strong> the Private Sector Banks. A lot more interesting approach can be a comparative study between<br />
Public and Private Sector banks in India. Along with that a comparison <strong>of</strong> foreign banks and performance<br />
on service delivery in India and the same banks service delivery in other country can be a good piece <strong>of</strong><br />
work.<br />
REFERENCES<br />
Asubonteng, P., McCleary, K.J. and Swan, J.E. (1996). ‘SERVQUAL revisited: a critical review <strong>of</strong> service<br />
quality’, Journal <strong>of</strong> Services Marketing, 10(6): 62-81.<br />
Berry, L.L., Shankar, V., Parish, J.T., Cadwallader, S. & Dotzel, T. (2006). ‘Creating new markets through<br />
service innovation’, Sloan Management Review, 47(2): 56-63.<br />
Cronin, J.J. Jr and Taylor, S.A. (1992), ‘Measuring service quality: a re-examination and extension’,<br />
Journal <strong>of</strong> Marketing, 56: 55-68.<br />
Edvardsson et al., (2005). ‘Services portrait in service research: a critical review’. International Journal <strong>of</strong><br />
Service Industry Management, 16(1): 107-121.<br />
Edvardsson. (2005). ‘Service quality: beyond cognitive assessment Service Sweden Managing Service<br />
Quality’, 15 (2):127-131.<br />
Grönroos, C. (2000). ‘Service Management and Marketing, Lexington Books’, Lexington, MA.<br />
Grönroos, C. (2001). ‘The Perceived Quality Concept: a mistake’ Managing Service Quality, 11(3): 150-<br />
152.<br />
Grönroos, C.A. (1984). ‘Service model and its marketing implications’, European Journal <strong>of</strong> Marketing,<br />
18(4): 36-44.<br />
Heskett, J.L., et al., (1994). ‘Putting the service-pr<strong>of</strong>it chain to work’, Harvard Business Review, 3(4):164-<br />
74.<br />
Kotler & Keller (2006). ‘Marketing Management’, Pearson Prentice Hall. Hardcover, New Jearsy .<br />
Lovelock (1991). ‘Services Marketing’ 2 nd Edition. Englewood Cliffs, New Jearsy, Prentice Hall.<br />
Lovelock C. & Wirtz J., (2007). ‘Services Marketing: People, Technology, Strategy’, (6 th ed.), Pearson<br />
Prentice Hall, New Jersey .<br />
Mano and Oliver’s (1993). ‘Assessing the dimensionality and structure <strong>of</strong> the consumption experience:<br />
evaluation, feeling, and satisfaction’, Journal <strong>of</strong> Consumer Research, December, 20: 451-66.<br />
Newman, K. and Cowling, A. (1996). ‘Service quality in retail banking: the experience <strong>of</strong> two British<br />
clearing banks’, International Journal <strong>of</strong> Bank Marketing, 14(6): 3-11.<br />
Nitin S. et al., (2005). ‘Service Quality Models: a review.’ International Journal <strong>of</strong> Quality & Reliability<br />
Management, 22(9): 913-949.<br />
Parasuraman et al., (1985). ‘A Conceptual Model <strong>of</strong> Service Quality and its implications for future<br />
research’, Journal <strong>of</strong> Marketing. 49: 41-50.<br />
2013©<strong>Academy</strong> <strong>of</strong> <strong>Knowledge</strong> <strong>Process</strong><br />
45
International Journal <strong>of</strong> Contemporary Business Studies<br />
Vol: 4, No: 1. January, 2013 ISSN 2156-7506<br />
Available online at http://www.akpinsight.webs.com<br />
Parasuraman, A. et al., (1988). ‘SERVQUAL: a multiple item scale for measuring customer perceptions <strong>of</strong><br />
service quality’, Journal <strong>of</strong> Retailing, 64:12-40.<br />
Pepper et al., (1999). ‘Is your Company Ready for One-to-One Marketing’ Harvard Business<br />
Review,77(1): 151-156.<br />
Regan (1963) (cited in S.W. Brown et al., 1994, pg 23). Development and Emergence <strong>of</strong> Service Marketing<br />
Thought. International Journal <strong>of</strong> Service Industry Management, 5(1): 21-48.<br />
Rosen, L.D. Karwan, K.R. Scribner, L.L. (2003). ‘Service quality measurement and the disconfirmation<br />
model: taking care in interpretation’, Total Quality Management, 14(1): 3- 14.<br />
Sherry, J. Jr (ed.)(1998).‘Service Scapes: The Concept <strong>of</strong> Place in Contemporary Markets’, American<br />
Marketing Association, Chicago.<br />
Vargo, S.L. and Lusch, R.F. (2004). “The four service marketing myths – remnants <strong>of</strong> a goods-based,<br />
manufacturing model”, Journal <strong>of</strong> Service Research, 6(4): 324- 35.<br />
Wong, A. (2004). “The role <strong>of</strong> emotions in service encounters”, Managing Service Quality, 14(5): 365-76.<br />
Zeithaml and Bitner (2003 in Edvardsson et al., (2005), ‘Services Marketing: Integrating Customer Focus<br />
across the Firm’, (3rd ed.), McGraw-Hill, New York.<br />
2013©<strong>Academy</strong> <strong>of</strong> <strong>Knowledge</strong> <strong>Process</strong><br />
46
International Journal <strong>of</strong> Contemporary Business Studies<br />
Vol: 4, No: 1. January, 2013 ISSN 2156-7506<br />
Available online at http://www.akpinsight.webs.com<br />
A Boss causes mental disorder - Stay or Leave<br />
K.R.Sowmya<br />
Associate Pr<strong>of</strong>essor, Management Studies,Rajalakshmi Engineering<br />
College,Chennai.saumiyaa@gmail.com<br />
ABSTRACT<br />
The case is a real time problem faced by a school teacher in her workplace from her boss<br />
which led to her mental disorder and now she is under medical treatment slowly<br />
recovering from her mental illness. This case is a unique attempt by the researcher to<br />
highlight about then dynamics <strong>of</strong> power and politics in workplace, managing superior<br />
subordinate relationship, and managing the relationship with Boss. This will be a value<br />
addition to the existing literature <strong>of</strong> Politics in the universal scenario.<br />
Keywords: Power, politics, organizational behavior, superior, subordinate, managing boss<br />
INTRODUCTION<br />
Shruthi was walking very fast towards her home the un-walkable distance absent-minded, from school on<br />
a mid afternoon on one <strong>of</strong> the working days in the midst <strong>of</strong> her class. However she managed to reach her<br />
home safely by walk, not realizing that she has walked beyond 15 kms in the hot sun. She was affected<br />
beyond her limits to realize the heat or the leg pain that she suffered due to walking that long in the mid<br />
afternoon. She could not stop the tears rolling down her cheeks. She was unaware <strong>of</strong> anybody who would<br />
notice her crying and was not bothered about it too. Tears are sometimes a symbol <strong>of</strong> anger. She was angry<br />
beyond limits. She did not know what to do, except to cry helplessly thinking <strong>of</strong> her family and the<br />
economic need to work. She slowly recalled the miserable events that led to this mess <strong>of</strong> her maddening,<br />
while walking home about the happenings in the last eight months in her new school that she had joined to<br />
support her husband in running a family with two children in the most important metropolitan city,<br />
Chennai.<br />
CASE BACKGROUND<br />
Shruthi joined one <strong>of</strong> most important Schools in Chennai. She is a very traditional introvert woman from a<br />
rural background transferred to Chennai along with her husband. After 12 years <strong>of</strong> experience in normal<br />
schools Shruthi got an opportunity to enter into a school beyond her standards, her life style etc. The school<br />
environment was to totally different and very competitive in terms <strong>of</strong> the syllabus, methodology, standard<br />
<strong>of</strong> students, class <strong>of</strong> people, standard <strong>of</strong> peers etc. Although she was developed an inferiority complex on<br />
joining the new school, she decided there could be no other school which would pay her as much as this<br />
popular school. So she strived as much as possible to prove her best efforts to stay on par in the school in<br />
terms <strong>of</strong> teaching and behavior. She changed her life style, body mannerism and dissolved herself<br />
completely in her performance in the school. Her performance in form <strong>of</strong> teaching, results and extracurricular<br />
contributions was appreciated highly by her school principal. This extraordinary performance<br />
made her Boss to view her as a threat in the workplace. Therefore he started involving himself in various<br />
activities causing damage to her goodwill like hiding information from her that has to be revealed on time,<br />
claiming the credit for hardwork done by her, etc. Shruthi being an introvert was not able to handle him. So<br />
she carried all the stress within and became mentally affected. Now she is under medical treatment and not<br />
in a position to continue work anywhere with mental peace. She is confronted with two issues;<br />
1. How to manage without a job<br />
2. Whether to continue in the same school If so how<br />
Nature <strong>of</strong> Shruthi<br />
Shruthi aged 40 years old , was a simple, and a matured woman with very clear thoughts about her own self<br />
and her family status. Shruthi is basically from a remote village in the deep south <strong>of</strong> Tamilnadu. She was<br />
2013©<strong>Academy</strong> <strong>of</strong> <strong>Knowledge</strong> <strong>Process</strong><br />
47
International Journal <strong>of</strong> Contemporary Business Studies<br />
Vol: 4, No: 1. January, 2013 ISSN 2156-7506<br />
Available online at http://www.akpinsight.webs.com<br />
from a lower middle class joint family. She already had two sisters (one younger and another elder). Both<br />
<strong>of</strong> them were mentally disordered after the divorce <strong>of</strong> the younger sister and the death <strong>of</strong> the elder sister’s<br />
husband. Now Shruthi also was travelling in the same path due to her job confusions. Shruthi was by nature<br />
a very understanding woman who never wished for more than her possibilities. But now the new job that<br />
she was enjoying has given her more expectations and is not enabling her experience her life with peace.<br />
Now how much ever she was getting she was unable to enjoy it. She felt she needed more.<br />
Nature <strong>of</strong> Shruthi’s Husband<br />
Anand (name changed) was an understanding person who was a single son <strong>of</strong> their family, a relative <strong>of</strong><br />
Shruthi too. He was already a person who lived completely in Chennai for almost 25 years. Hence he was<br />
not carried away by the life style <strong>of</strong> Chennai as Shruthi was. So he was able to accept the changes in her<br />
and he tried to advice her. However he was earning less than her and was not in a stable job.<br />
Case description<br />
She was worried over two issues. One is about the definite need to work and the further possibility <strong>of</strong><br />
surviving in this school. After a long struggle in convincing her husband , she could finally succeed in<br />
relocating to Chennai, one <strong>of</strong> the important metropolitan cities in India. It was a jaint leap in the life <strong>of</strong><br />
Shruthi in terms <strong>of</strong> her career and her living. At first she found a simple Tamil teacher job in a school <strong>of</strong><br />
average standard in which she was able to perform well but had lot <strong>of</strong> work pressure. Later after 15 years <strong>of</strong><br />
service she managed to get a job in a high standard school catering CBSE syllabus to highest society <strong>of</strong><br />
students.<br />
At first Shruthi was delighted and felt proud to be a part <strong>of</strong> such a great school which was almost a dream<br />
in her life. She started changing her dressing and her life style based on the demands <strong>of</strong> the school.<br />
Although she was the least paid teacher as per that school standards , according to her it three times the<br />
salary which she was drawing at her previous school. So she forgot her family, relatives, and children and<br />
started struggling to survive in her job. The school and her peers were beyond her standard and looked<br />
down upon her. She was able to read her environment and she managed to crush the inferior complex that<br />
was overtaking her. She concentrated in her job with great care. She felt she was inferior to all and so she<br />
started working hard and giving her best to the students and to the school. The school principal was very<br />
happy with her performance. According to her this job was enough for her life. But she was very confused<br />
and upset about the possibility <strong>of</strong> continuing with the job at this place.<br />
Question paper Incident<br />
The teachers are expected to prepare a copy <strong>of</strong> the question paper and handover to the Head <strong>of</strong> the<br />
department as per the school rules. Same way even Shruthi also did as per the rules. But somehow she<br />
found that the questions were changed in a different manner and was not the same as always submitted.<br />
Shruthi for the first two times thought it was printing mistake. But the third time she found out that it is not<br />
accidental but incidental. The sad part was in spite <strong>of</strong> the questions being changed the principal also warned<br />
her to prepare questions clearly and as per requirements <strong>of</strong> the school. Shruthi then understood that the<br />
situation has been picturized that she is not capable <strong>of</strong> preparing a question paper as per standards.<br />
Cultural Events Organizing event<br />
Shruthi actively participated and organized several cultural events as per the instructions <strong>of</strong> the school<br />
principal. Similarly, for the recent programme also shruthi contributed effectively. But the sad part is every<br />
activity, approval etc has to happen through the Head <strong>of</strong> the Department. This time also the programme was<br />
a grand success, but shruthi did not receive even a single word <strong>of</strong> appreciation from the principal. She then<br />
realized that it has been projected by the Head <strong>of</strong> the department as if he had done everything by his own<br />
self.<br />
Principal meeting event<br />
Shruthi, was devastated by the above two incidents and so she complained to the school principal about her<br />
worries in surviving in the school. The principal immediately took up her complaint and called the Head <strong>of</strong><br />
the department for discussion. The joint discussion by principal with shruthi, Head <strong>of</strong> the department,<br />
assistant in charge <strong>of</strong> the department ended in vain as there was no strong pro<strong>of</strong> against the complainant,<br />
the Head <strong>of</strong> the Department. Shruthi, observed that although the principal was acting neutrally she was<br />
2013©<strong>Academy</strong> <strong>of</strong> <strong>Knowledge</strong> <strong>Process</strong><br />
48
International Journal <strong>of</strong> Contemporary Business Studies<br />
Vol: 4, No: 1. January, 2013 ISSN 2156-7506<br />
Available online at http://www.akpinsight.webs.com<br />
unable to take action without any evidence. This made it very clear to shruthi, that nothing could be done<br />
against her head <strong>of</strong> the department due to his powers he was enjoying as per hierarchy in the school.<br />
Confusions <strong>of</strong> Shruthi<br />
She did not have any other big aim in life. In order to survive in this continuous threat she had to struggle a<br />
lot and with all her struggle she was able to perform well in the school as an individual and very well in her<br />
department too. This created a very big problem for her peers and her boss. Her boss became aware <strong>of</strong> her<br />
popularity in a very short time. He started to play tricks and games against her. He started hiding her<br />
performance and started claiming the reward for all the hard work she put in. Shruthi was unable to<br />
withstand the politics played by her boss. She found lot <strong>of</strong> manipulations in her original work, but was<br />
unable to prove it. For example, the question paper she submits for the exam would be different when it<br />
was printed. Shruthi was really upset and did not know the way to handle the problem. She was worried<br />
about the loss that would be created if she loses her job and she was also unable to face her situations in the<br />
job. Situation became worse day by day and therefore she made a complaint to the Principal about the Head<br />
<strong>of</strong> the Department and his tricks played on her. The principal was able to understand the position. But she<br />
was in a helpless position and so she asked Shruthi to prove her situation. This was not possible for Shruthi.<br />
She was a very shy and a timid lady from a very narrow minded family background. She was not even able<br />
to raise her voice to her peers and therefore to her boss was impossible according to her. Hence she choked<br />
within, hiding all the worries within her.<br />
On the other side, her husband Anand (name changed) was very unhappy with her because she did not<br />
respect him as earlier after joining this school. She was earning more than him, not bothered about cleaning<br />
the house, not bothered about her two children Abhinaya in 11 th standard and Kumaran in 10 th standard.<br />
Shruthi also failed to visit her in laws in her native place . He was very unhappy about her behaviour and<br />
her cultural changes. So he insisted that she should discontinue with her new school and get back to her old<br />
school. Shruthi did not heed to his words. This led to continuous war between them at home.<br />
Now Shruthi was confronted with two issues. One is the need to work in this school to be successful, but its<br />
impossibility due to the politics in workplace. The second is the trauma she was undergoing at home with<br />
her husband and her in laws.<br />
Outcomes<br />
As an outcome <strong>of</strong> her two major problems, Shruthi has become mentally disturbed. Now she is unable to<br />
cook, unable to realize her husband & children. She is identifying everybody as a spy around her sent by<br />
her department head and thereby is mentally disordered. She is hugging close to a god’s calendar and under<br />
medication <strong>of</strong> high dosage drugs (Sizopin 150mg). This tablet <strong>of</strong> 25mg keeps a normal person in a sleeping<br />
state for 48 hours. But with 150mg <strong>of</strong> the same she is unable to sleep even one <strong>full</strong> night. She is worried<br />
that she is not able to continue in her job and she is not able to compromise her job. She is also worried that<br />
she will not be able to survive even a single month without a job. Knowing that her husband cannot support<br />
the family alone she could not think <strong>of</strong> leaving her job. She also was not willing to compromise on the life<br />
style the new school had given her.<br />
Exhibit 1 Organizational Chart at the present school<br />
Top management<br />
The principal<br />
Head <strong>of</strong> the Department<br />
Teachers (Shruthi)<br />
2013©<strong>Academy</strong> <strong>of</strong> <strong>Knowledge</strong> <strong>Process</strong><br />
49
International Journal <strong>of</strong> Contemporary Business Studies<br />
Vol: 4, No: 1. January, 2013 ISSN 2156-7506<br />
Available online at http://www.akpinsight.webs.com<br />
Exhibit 2 Department seating arrangements at school in each room<br />
HOD Table Teacher 1<br />
Teacher 2<br />
Teacher 3<br />
(Shruthi)<br />
Note : The distance between the table oh HOD and Shruthi was just 10 foot long.<br />
A Boss causes mental disorder - Stay or Leave<br />
Teaching Note<br />
I. Case Summary<br />
Shruthi is a Tamil teacher in a popular schools in Chennai. She was pressurized due to politics by her head<br />
<strong>of</strong> the department and she became mentally disordered. She is now forced to stop going to school due to her<br />
mental status. She feels people are talking about her behind her back, when there is nobody around at all.<br />
She feels that any man front <strong>of</strong> her has come to spy her on behalf <strong>of</strong> her Head <strong>of</strong> the department. The<br />
previous school was very comfortable about the salary was not sufficient. So she felt the new school would<br />
suit her need. Now Shruthi is not able to continue in her new school and she has also lost her selfconsciousness.<br />
Kindly, advice her on how to proceed with her family and career.<br />
II. Learning Objectives<br />
The objective <strong>of</strong> the case is to study about the superior-subordinate relationships, or managing the boss at<br />
the workplace. This could suit the syllabus <strong>of</strong> power and politics in the organizational behavior subject for<br />
the 1 st year MBA students.<br />
The case is a very plain problem faced by any normal individual in the colleges and schools. It narrates a<br />
real time problem practically faced in the work environment. Analyzing this case will give experience to<br />
the present and future pr<strong>of</strong>essional to manage their boss in the workplace.<br />
1. To expose the audience to real time problem in the workplace in form <strong>of</strong> politics, thereby enabling<br />
them to face their future workplace effectively.<br />
2. To inculcate analyzing and problem solving skills in future managers.<br />
3. To enable decision making and action implementing skills among the future managers.<br />
III. Assignment Questions<br />
1. What should Shruthi do Whether to continue in present job or leave the Job<br />
2. Is the problem on side <strong>of</strong> Shruthi or HOD Is her Principal Genuinely in support <strong>of</strong> Shruthi or is<br />
pretending to do so<br />
3. Is the problem <strong>of</strong> Shruthi due to her family history like her sisters<br />
4. The psychological problem <strong>of</strong> Shruthi is due to her two problems she is facing in life and career.<br />
Discuss.<br />
5. Does this case give a clear picture <strong>of</strong> workplace politics leading to Psychological disorder <strong>of</strong> a<br />
person Discuss.<br />
6. Is politics at educational institutions healthy for the employees<br />
Teaching Plan<br />
1. Introduction (10 Minutes)<br />
Discussion about the case in simple language so as to reach all the class students <strong>of</strong> MBA.<br />
Shruthi, is traditional introvert woman from the deep south <strong>of</strong> India. She was basically a tamil<br />
teacher and has experience <strong>of</strong> 15 years from various school. As a lucky <strong>of</strong>fer beyond her standards<br />
she managed to get a job through her friends’ reference (front <strong>of</strong>fice executive in the same school),<br />
2013©<strong>Academy</strong> <strong>of</strong> <strong>Knowledge</strong> <strong>Process</strong><br />
50
International Journal <strong>of</strong> Contemporary Business Studies<br />
Vol: 4, No: 1. January, 2013 ISSN 2156-7506<br />
Available online at http://www.akpinsight.webs.com<br />
in a famous CBSE school in Chennai, a metropolitan city in India. Shruthi was very happy about<br />
the job, salary, perks, work environment etc. She also worked very hard to survive as she was not<br />
on par with the other teachers in language and lifestyle. The school principal also was very happy<br />
with her work and appreciated her always at several incidents. But, lately several events caused a<br />
strong friction between Shruthi and her head <strong>of</strong> the department. Shruthi basically being an<br />
introvert is unable to fight the situation nor able to survive in the position. She is also heavily<br />
worried that if she loses the job she will be unable to support her family. This trauma within her<br />
caused a strong mental disorder and now she is strong medication. She is currently not in an<br />
advisable position to go to school.<br />
2. Diagnosis (30 Minutes)<br />
How did Shruthi get into this mess<br />
Three incidents have been quoted in the case that has landed shruthi in this mess. Shruthi should<br />
basically be taught interpersonal relationship in order to handle her boss and peers. Because events<br />
<strong>of</strong> such narrated types happens in every work environment and almost many <strong>of</strong> them fall victim to<br />
such events. Shruthi should be taught to manage relationships. She must also be made understand<br />
that as she feels happy for her job beyond her standards so will be there be pressure & problems<br />
also beyond standards and she has to face it boldly. These are general view about the researcher.<br />
However, the teacher can discuss about the reasons for “shruthi entering into such a mess” among<br />
the students.<br />
Did Shruthi take the right Job<br />
The teacher must get the opinion about the students about whether shruthi took up a right job. The<br />
various possible answers and the relevant justification for the same should be got from the<br />
students. However, the researcher feels that there is no job called as the right job on this earth.<br />
Every job has its own demands and blessings, Just like how life is a bed <strong>full</strong> <strong>of</strong> roses and thorns.<br />
She did not understand the power dynamics and politics in workplace.<br />
Relationship management is lagging in shruthi that she has to be taught. Such schools <strong>of</strong> good<br />
standards normally train their teachers according to the school requirements irrespective <strong>of</strong> their<br />
years <strong>of</strong> experience. As the training is given for handling classes, so should it be given even for<br />
relationship management. The teacher can give this as her conclusion after listening to the<br />
students’ opinion about the arised point <strong>of</strong> discussion.<br />
3. Action plan (30 Minutes)<br />
What should she do now/Whether to stay or leave/What if she decides to stay<br />
Opportunities for Shruthi in the same school.<br />
The students can give their opinion about whether there is any further opportunities for shruthi in<br />
the same school. If yes, what she should do and if no what other scope is available for her in the<br />
market.<br />
4. Conclusion (20 Minutes)<br />
Other options available for Shruthi.<br />
General discussion as to how to confront such issues with boss in the workplace.<br />
General relationship management between boss and subordinate can be discussed in order to relate<br />
to the power and politics concept in organizational behavior subject.<br />
The teacher can call one <strong>of</strong> the student to give a conclusion for the case , then can give his or her<br />
opinion in front <strong>of</strong> the class room. The entire can debate about the conclusions from both ends and<br />
come to a mutual understanding on any suggestions that could be given to shruthi.<br />
2013©<strong>Academy</strong> <strong>of</strong> <strong>Knowledge</strong> <strong>Process</strong><br />
51
International Journal <strong>of</strong> Contemporary Business Studies<br />
Vol: 4, No: 1. January, 2013 ISSN 2156-7506<br />
Available online at http://www.akpinsight.webs.com<br />
DISCUSSION AND CONCLUSION<br />
The researcher has made this effort <strong>of</strong> writing a case study because <strong>of</strong> the work place politics that leads to<br />
psychological affecting <strong>of</strong> the mental status <strong>of</strong> a person. The researcher has written several papers on<br />
Organizational politics in banks and educational institutions. But they have highlighted about the job<br />
dissatisfaction and thereby the turnover <strong>of</strong> an employee from the organization. But here the case highlights<br />
a situation where the affected person is neither able to voice out the problem and is nor able to face it.<br />
However the person is forced to leave the organization but due to mental disorder. This gives way to a new<br />
idea <strong>of</strong> studying politics with relevance to causing mental problems in workplace. This is a real life<br />
situation faced by a person presently in her life. This case can be discussed for MBA students <strong>of</strong> all B-<br />
Schools under the category <strong>of</strong> Organizational Behaviour – Organizational Politics. In this case the politics<br />
has been shown in illegitimate manner through legitimate hierarchy. The HOD as a person using his<br />
authority has indulged in politics but in a hidden manner.<br />
Sowmya, K.R. & Panchantham,N. (2011) a in their study about perception <strong>of</strong> politics identified six forms <strong>of</strong><br />
political involvements in work place. Of which going along to get ahead over another person for their own<br />
survival is one <strong>of</strong> the factor. The same has been adopted by the Head <strong>of</strong> the department in this case, in order<br />
to save his own position in the School. But inspite <strong>of</strong> Shruthi having complained to the Principal no action<br />
has been taken on their behalf. This creates a need for the school to revamp its staff grieviance policies and<br />
procedures in order to protect the employees being affected by hidden politics which ultimately will erode<br />
the workplace and thereby the lives <strong>of</strong> the future citizens. It is a pity that the workplace politics has not<br />
spared even the educational institutions.<br />
Sowmya, K.R. & Panchantham,N. (2011) b in their study tried to find out the reason for turnover intention<br />
in educational institutions and found that Organizational politics was one <strong>of</strong> the major reason for the same.<br />
Sowmya, K.R. & Panchantham,N. (2012) c in their study tried to find out the correlation between turnover<br />
intention and organizational politics in educational institutions using Karl Pearson’s Coefficient <strong>of</strong><br />
correlation and found that there was a strong correlation between the both.<br />
The mentioned secondary sources stimulated to write this case study. This is an unique attempt on behalf <strong>of</strong><br />
the researcher because the concept <strong>of</strong> politics has been tried in form <strong>of</strong> a case study for the first time. The<br />
case is a real situation faced by shruthi. The names have been changed as the career <strong>of</strong> the mentioned lady<br />
may be destroyed if in case, Shruthi intends to continue in the same school and it will damage her goodwill<br />
if she intends to change schools because she has a definite need to work. The intention <strong>of</strong> the researcher is<br />
not to <strong>of</strong>fend the school or the HOD, but make the future managers understand how politics will damage<br />
the workplace and destroy the mental peace <strong>of</strong> the person.<br />
REFERENCES<br />
Sowmya, K.R. & Panchantham,N. (2011) a : “Employees’ perception about organizational politics in<br />
banking sector”, International Journal for Research in Commerce and Management, Issue No 2<br />
(February), Volume 2, Pg. 27-31<br />
Sowmya, K.R. & Panchantham,N. (2011) b :“Faculty turnover intention in educational institutions”, Indian<br />
journal <strong>of</strong> Applied research, 1(6), 155-156.(2012)<br />
Sowmya, K.R. & Panchantham,N. (2011)c :“Influence <strong>of</strong> Organizational Politics on Turnover Intention <strong>of</strong><br />
employees in Education Sector, Chennai-India", Arth prabhand: A journal <strong>of</strong> Economics and<br />
management, 1(1), 19-25.(2012).<br />
Kind Note: The researcher has no objection in revealing the name <strong>of</strong> the persons involved and the name <strong>of</strong><br />
the school to the Publisher on request. The publisher is requested to claim replies and comments about the<br />
case to its own <strong>of</strong>fice.<br />
2013©<strong>Academy</strong> <strong>of</strong> <strong>Knowledge</strong> <strong>Process</strong><br />
52
International Journal <strong>of</strong> Contemporary Business Studies<br />
Vol: 4, No: 1. January, 2013 ISSN 2156-7506<br />
Available online at http://www.akpinsight.webs.com<br />
Enrich the <strong>Knowledge</strong> through<br />
Quality Research<br />
An International Journal Published by<br />
<strong>Academy</strong> <strong>of</strong> <strong>Knowledge</strong> <strong>Process</strong><br />
www.akpinsight.webs.com<br />
Copyright © 2013 IJCBS<br />
2013©<strong>Academy</strong> <strong>of</strong> <strong>Knowledge</strong> <strong>Process</strong><br />
53