The Gabelli Global Telecommunications Fund
The Gabelli Global Telecommunications Fund
The Gabelli Global Telecommunications Fund

Create successful ePaper yourself
Turn your PDF publications into a flip-book with our unique Google optimized e-Paper software.
<strong>Gabelli</strong> <strong>Global</strong> Series <strong>Fund</strong>s, Inc.<br />
One Corporate Center<br />
Rye, New York 10580 - 1434<br />
<strong>The</strong> <strong>Gabelli</strong> <strong>Global</strong> <strong>Telecommunications</strong> <strong>Fund</strong><br />
First Quarter Report<br />
March 31, 1997<br />
To Our Shareholders:<br />
For the first quarter ended March 31, 1997, <strong>The</strong> <strong>Gabelli</strong> <strong>Global</strong> <strong>Telecommunications</strong> <strong>Fund</strong>’s net<br />
asset value increased 0.1% to $11.29 per share. This compares to the 0.7% return of the average<br />
global fund as tracked by Lipper Analytical Services, Inc. <strong>The</strong> Lipper average covers 194 global openend<br />
mutual funds which may invest in a diversified group of industry sectors. <strong>The</strong> Salomon Brothers<br />
<strong>Global</strong> <strong>Telecommunications</strong> Index, an unmanaged index of 52 equity security issues of companies in<br />
the telecommunications industry, increased 3.4% over the same period. For the year ended March 31,<br />
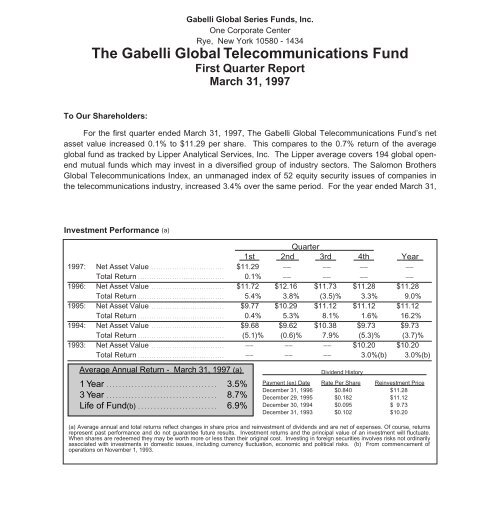
Investment Performance (a)<br />
Quarter<br />
1st 2nd 3rd 4th Year<br />
1997: Net Asset Value . . . . . . . . . . . . . . . . . . . . . . . . . . . . . . . . $11.29 __ __ __ __<br />
Total Return . . . . . . . . . . . . . . . . . . . . . . . . . . . . . . . . . . . . . . 0.1% __ __ __ __<br />
1996: Net Asset Value . . . . . . . . . . . . . . . . . . . . . . . . . . . . . . . . $11.72 $12.16 $11.73 $11.28 $11.28<br />
Total Return . . . . . . . . . . . . . . . . . . . . . . . . . . . . . . . . . . . . . . 5.4% 3.8% (3.5)% 3.3% 9.0%<br />
1995: Net Asset Value . . . . . . . . . . . . . . . . . . . . . . . . . . . . . . . . $9.77 $10.29 $11.12 $11.12 $11.12<br />
Total Return . . . . . . . . . . . . . . . . . . . . . . . . . . . . . . . . . . . . . . 0.4% 5.3% 8.1% 1.6% 16.2%<br />
1994: Net Asset Value . . . . . . . . . . . . . . . . . . . . . . . . . . . . . . . . $9.68 $9.62 $10.38 $9.73 $9.73<br />
Total Return . . . . . . . . . . . . . . . . . . . . . . . . . . . . . . . . . . . . . . (5.1)% (0.6)% 7.9% (5.3)% (3.7)%<br />
1993: Net Asset Value . . . . . . . . . . . . . . . . . . . . . . . . . . . . . . . .<br />
__ __ __ $10.20 $10.20<br />
Total Return . . . . . . . . . . . . . . . . . . . . . . . . . . . . . . . . . . . . . .<br />
__ __ __ 3.0%(b) 3.0%(b)<br />
Average Annual Return - March 31, 1997 (a)<br />
1 Year . . . . . . . . . . . . . . . . . . . . . . . . . . . . . . . . . . . 3.5%<br />
3 Year . . . . . . . . . . . . . . . . . . . . . . . . . . . . . . . . . . . 8.7%<br />
Life of <strong>Fund</strong>(b) . . . . . . . . . . . . . . . . . . . . . . . . . 6.9%<br />
Dividend History<br />
Payment (ex) Date Rate Per Share Reinvestment Price<br />
December 31, 1996 $0.840 $11.28<br />
December 29, 1995 $0.182 $11.12<br />
December 30, 1994 $0.095 $ 9.73<br />
December 31, 1993 $0.102 $10.20<br />
(a) Average annual and total returns reflect changes in share price and reinvestment of dividends and are net of expenses. Of course, returns<br />
represent past performance and do not guarantee future results. Investment returns and the principal value of an investment will fluctuate.<br />
When shares are redeemed they may be worth more or less than their original cost. Investing in foreign securities involves risks not ordinarily<br />
associated with investments in domestic issues, including currency fluctuation, economic and political risks. (b) From commencement of<br />
operations on November 1, 1993.
1997, the <strong>Fund</strong> increased 3.5%, versus 11.1% and 16.5% for the Lipper global fund average and the<br />
Salomon Brothers <strong>Global</strong> <strong>Telecommunications</strong> Index, respectively.<br />
Since inception on November 1,<br />
1993, through March 31, 1997, the<br />
<strong>Fund</strong> gained 25.7% which reflects an<br />
average annual rate of return of 6.9%<br />
assuming reinvestment of dividends.<br />
<strong>The</strong> Portfolio<br />
<strong>Global</strong> Allocation<br />
HOLDINGS BY GEOGRAPHIC REGION - 3/31/97<br />
United States<br />
43.8%<br />
Europe 21.8%<br />
Asia/Pacific<br />
Rim 11.0%<br />
<strong>The</strong> chart to the right represents<br />
the <strong>Fund</strong>’s holdings by geographic<br />
region as of March 31, 1997. <strong>The</strong><br />
geographic allocation will change<br />
based on current global market<br />
conditions. Countries and/or regions or companies represented in the chart and below may or may not<br />
be included in the <strong>Fund</strong>’s portfolio in the future.<br />
Our Approach<br />
Our approach is multifaceted. We purchase companies that are attractively valued relative to<br />
what we estimate a buyer would be willing to pay for the entire company in a private transaction.<br />
When the gap between a company’s Private Market Value (PMV) and public market value widens, our<br />
risk/reward parameters improve. To maximize returns, our decision process requires the expectation<br />
of a trigger that will promote a reduction in this gap. But we will not invest in just any “cheap”<br />
company. For most of our holdings, our selection is based on “bottom up” fundamental analysis, which<br />
requires strong cash flow and earnings power, positive industry dynamics and, certainly not least, good<br />
management with a track record of growing value for their shareholders.<br />
Portfolio Structure<br />
Other 4.2%<br />
Canada 8.6%<br />
Latin America<br />
10.6%<br />
We remain “bottom-up” focused, with roughly half the fund’s investment in the U.S.<br />
Internationally, the trend continues to be liberalization and privatization of the telecommunications<br />
sector. <strong>The</strong> result is an expanding universe of publicly-traded telecom companies poised for growth.<br />
Deutsche Telekom, the largest telecom company in Europe and the third-largest in the world,<br />
successfully completed its initial public offering in November 1996. Many other major telecom<br />
companies are expected to “go public” in the years ahead.<br />
Almost 22% of the <strong>Fund</strong> is invested in Europe, much of that in the UK. Key holdings are<br />
companies with a strong global presence and attractive valuations. Included are Cable & Wireless, the<br />
2
UK’s second-largest telecom group, and Vodafone, the biggest UK cellular service provider with<br />
attractive wireless investments on a global basis. Telefonica de Espana is another key investment in<br />
light of its strong telecom franchise and significant discount to its underlying asset value.<br />
Asia/Pacific Rim represents about 11.0% of the <strong>Fund</strong> and Latin America around 10.6%. <strong>The</strong>se<br />
regions are among the most rapidly growing in the world. <strong>Telecommunications</strong> forms the “information<br />
highways” necessary for strong economic development. Telebras, the Brazilian telephone company,<br />
and Telekom Malaysia, the primary provider of domestic and international telecom services in<br />
Malaysia, are key examples of attractively valued, rapidly growing investments.<br />
Competition, consolidation and convergence are occurring globally as companies seek economies<br />
of scale. Simply put, “bigger is better.” <strong>Telecommunications</strong> stocks are selling at large discounts to their<br />
estimated Private Market Values. Moreover, the stock price performance has not kept pace with the<br />
growth in value. Major forces — strong demand, open markets, technology, consolidation — should<br />
drive telecom stock prices toward their Private Market Values, thereby enhancing shareholder value.<br />
Commentary<br />
<strong>The</strong> Economy and the Stock Market: Too Much of a Good Thing<br />
Once again, the economy confounded the Wall Street economists by growing much faster than<br />
consensus expectations. Although inflation has not yet shown up in the Producer Price and Consumer<br />
Price inidices, Federal Reserve Chairman Alan Greenspan and bond investors decided to err on the<br />
side of caution by taking short- and long-term interest rates higher.<br />
We applaud Fed Chairman Greenspan’s preemptive strike against inflation. We believe he will<br />
continue to take the steps necessary to combat inflation and, in the process, provide confidence in Soft<br />
Landing - Part II. Over the short-term, this may not be pleasant for equities investors. However, with<br />
the elimination of some of the speculative excesses, the market will be on much better fundamental<br />
footing going forward. We do not believe this is the beginning of a secular bear market, but rather a<br />
healthy correction that is arguably long overdue.<br />
What can we expect over the balance of this year We should continue to see a volatile market as<br />
skittish investors wrestle with the latest economic data trying to determine if inflation is a real threat.<br />
While the jury may still be out on inflation, higher interest rates are a reality and will be problematic for<br />
stocks on several levels. Higher interest rates might trim the economy and restrain corporate earnings<br />
growth, putting consensus estimates of 9% to 10% gains for 1997 in jeopardy. Higher rates also boost<br />
the U.S. dollar, further crimping the U.S. dollar value of international earnings. Whether you are looking<br />
at stocks on the basis of asset values or using a dividend discount model, public prices of equities tend<br />
to decline as interest rates rise, all else constant. So, price/cash flow and price/earnings multiples would<br />
contract, should interest rates rise.<br />
3
<strong>The</strong> wild card will be how investors react to any sustained decline in stock prices. A tremendous<br />
amount of money has flowed into the equities market in the last three years. Will it back out at the first<br />
sign of serious trouble It may not be how the great unwashed public reacts, but rather how the great<br />
unwashed professional investors — those twenty and thirty something mutual fund managers who have<br />
never experienced even a substantial market correction — respond to the perceived crisis. Will they see<br />
the glass half empty or half full We don’t know.<br />
While we are dwelling on things on our watch list, we should also mention the strong dollar.<br />
Despite the enormous advances in the quality of American made goods in a wide variety of industries,<br />
the strong dollar will restrain exports and currency translation will have an adverse impact on the<br />
earnings of U.S. based multi-national companies. Longer term, we must also be sensitive to the fact<br />
that substantial cost reductions and productivity gains in American industry over the last five years may<br />
be close to running their course. In other words, profit margins are unlikely to advance further.<br />
We don’t view a market correction as bad news. In general, we are not exposed to those sectors<br />
and individual companies that have benefited most from investor euphoria and which are, therefore,<br />
most vulnerable to a dramatic change in investor sentiment. If anything, a market correction should<br />
provide a more level playing field for disciplined investors focusing on the fundamental value of<br />
individual stocks. We are just now emerging from a two year period in which fundamentals have<br />
mattered much less than market momentum. We are entering what may prove to be an extended<br />
period in which stock pickers excel.<br />
Must Carry<br />
In an upset rivaling the University of Arizona's victory over Kentucky in the 1997 NCAA basketball<br />
championship, the Supreme Court voted 5 to 4 to uphold the “must carry” provision for local broadcast<br />
companies. <strong>The</strong> must carry rule specified that cable television systems must make one-third of their<br />
channel capacity available free to local broadcasters. Led by Ted Turner, the cable television industry<br />
had challenged the rule on the grounds that it violated their first amendment rights. <strong>The</strong> industry’s<br />
economic goal was to free up channel capacity for new cable television networks providing more<br />
popular programming and paying the cable operator for channel space. <strong>The</strong> consensus of the lawyers<br />
on both sides of the issue was the cable guys would win. However, the Supreme Court decided that<br />
allowing cable operators to exclude local broadcast channels would create undue economic hardship<br />
for many broadcasters and threaten the survival of weaker independents.<br />
Who are the winners and losers <strong>The</strong> broadcasters, particularly those with extensive UHF<br />
properties get a renewed lease on life as they maintain and in some cases add to their cable audience.<br />
<strong>The</strong> entrenched cable television networks, like International Family Entertainment, Inc. (FAM -<br />
$20.375 - NYSE), BET Holdings, Inc. (BTV - $29.625 - NYSE), Gaylord Entertainment Company<br />
(GET - $21.50 - NYSE), HSN, Inc. (HSNI - $25.375 - NASDAQ) and Tele-Communications,<br />
Inc./Liberty Media Group (LBTYA - $19.9375 - NASDAQ) benefit because with cable channel capacity<br />
4
still restrained, the value of their “slots” with cable operators increase in value. For example, the<br />
prospective value of International Family Entertainment to a News Corporation Limited (NWS - $18.00 -<br />
NYSE), which is trying to expand distribution of its programming, increases substantially. <strong>The</strong> biggest<br />
losers are the cable television network wannabes who will have to wait until cable operators complete<br />
upgrades to their systems before channel space is available.<br />
<strong>Global</strong> Trends: Positioning the Portfolio for the New Millennium<br />
We have identified several global trends in telecommunications which should continue to surface<br />
values: a huge, rapidly growing market; exploding demand; deregulation; and digital technology. In<br />
1995, telecom services world-wide was a $600 billion industry. By 2000, it is projected to exceed a<br />
trillion dollars. Today, half the world’s population has never made a telephone call. Consumer desire<br />
for value-added communications is driving rapid growth in traditional land-line telephone and wireless<br />
services. Countries must build information highways for the 21st century.<br />
Around the world, countries are opening their telecom markets to competition. In the U.S., the<br />
<strong>Telecommunications</strong> Reform Act of 1996 removed regulatory barriers between industry segments (local<br />
telephone, long distance, and cable TV) to encourage competition and spur development. Europe<br />
plans to open its markets to competitive forces by 1998. Foreign governments in Asia and elsewhere<br />
are opening their markets, creating growth opportunities.<br />
Digital technology is facilitating new services like the Internet, satellites (e.g., DirecTV) and<br />
personal communications services (PCS). New technology means lower costs for communication<br />
companies and lower prices for consumers.<br />
Let’s Talk Stocks<br />
<strong>The</strong> following are stock specifics on selected holdings of our <strong>Fund</strong>. Favorable EBITDA prospects<br />
do not necessarily translate into higher stock prices, but they do express a positive trend which we<br />
believe will develop over time.<br />
AirTouch Communications Inc. (ATI - $23.00 - NYSE) is one of the premier players in global wireless<br />
communications. Operating in attractive cellular markets in the U.S. and overseas (including Germany,<br />
Japan, Portugal, Sweden, Belgium, Italy, Spain and South Korea), the company is well-positioned to<br />
participate in the world-wide expansion of wireless communications. Roughly half of the company’s<br />
current 8.5 million world-wide cellular customers are located in the U.S. Annual growth is estimated at<br />
30% to 40%. AirTouch is in the process of strengthening its cellular position in the U.S. with the<br />
acquisition of U.S. West Media Group’s cellular and personal communications services (PCS)<br />
properties previously held in a shared joint venture.<br />
BC TELECOM Inc. (BCT - $21.85 - TSE) is a full-service telecommunications company operating in<br />
British Columbia, Canada. Its major investor is GTE Corporation (GTE - $45.50 - NYSE), which owns<br />
5
52% of the company. We estimate the private market value of BCT to be $50 per share. Its basic<br />
telephone operations provide service to more than two million telephone lines and are growing at twice<br />
the Canadian industry average. BCT’s crown jewel is a rapidly growing cellular phone company which<br />
currently serves 324,850 subscribers. We expect BCT to take advantage of the deregulatory trend in<br />
Canada by entering new businesses in which they are now allowed to participate.<br />
Cable & Wireless, PLC (CWP - $23.75 - NYSE) is a United Kingdom-based company comprised of<br />
broad global telecommunications interests. CWP has bolstered its presence in the increasingly<br />
competitive U.K. communications market following a major restructuring. <strong>The</strong> company now owns 53%<br />
of a new, publicly-traded U.K. based company which owns 100% of Mercury Communications, the<br />
second largest provider of telecom services in Britain (after British <strong>Telecommunications</strong>), and a majority<br />
of U.K. Cable TV/Telco Companies including Bell Cable Media, Nynex CableComms and Videotron<br />
Holdings plc. Hong Kong Telecom (58% owned by CWP), the dominant telecom service provider in<br />
Hong Kong, remains the “crown jewel” of the CWP portfolio and represents approximately $18 per<br />
CWP share. Deducting CWP’s interest in Hong Kong Telecom at its public market value, we are<br />
paying about three times the EBITDA of CWP’s other assets. CWP is attractive based on its high rate<br />
of growth and reasonable stock market valuation.<br />
Comcast Corporation (CMCSA - $16.375 - NASDAQ) is the fourth-largest cable company in the U.S.,<br />
serving approximately 4.3 million subscribers. <strong>The</strong> company owns a cellular telephone business<br />
serving eight million “POP”s in the high traffic, mid-Atlantic region including parts of New Jersey,<br />
Pennsylvania and Delaware. In addition to its controlling ownership of QVC, the cable TV retailer,<br />
Comcast recently added to its programming investments by purchasing a controlling interest in the<br />
Philadelphia 76ers, Philadelphia Flyers and two arenas. We estimate Comcast’s PMV to be about $29<br />
per share.<br />
Tele-Communications, Inc. (TCOMA - $12.00 - NASDAQ), the largest cable TV operator in the U.S.,<br />
serving about 14 million subscribers, is guided by Dr. John C. Malone - one of the most shareholder<br />
sensitive managers we have found. Regulation has historically played a major role in the valuation of<br />
cable properties. We believe that the passage of the <strong>Telecommunications</strong> Reform Act of 1996,<br />
combined with the current deregulatory climate in Congress, could prove to be a significant catalyst for<br />
cable stocks. Strategically, TCOMA is a well-positioned industry leader, from its wireless telephony<br />
PCS venture with Sprint, Comcast and Cox, to its innovative Internet access business, dubbed<br />
“@Home”, to its 80% stake in Tele-Communications International, Inc. A major cost containment effort<br />
is beginning to show results, leading to substantial increases in operating cash flow.<br />
Telecomunicacoes Brasileiras SA (Telebras) (TBR - $102.375 - NYSE) is the Brazilian governmentcontrolled<br />
monopoly telecommunications holding company consisting of 28 subsidiaries serving more<br />
than 14 million telephone lines and two million cellular customers in a country with a population of 160<br />
million. <strong>The</strong> penetration rate is less than 9% for telephone and 1% for cellular. <strong>The</strong> stock is attractively<br />
priced at less than five times our estimate of 1997 cash flow. Future opportunities include the<br />
6
prospects of privatization, strong line growth and improvements in efficiency. <strong>The</strong> company is<br />
benefiting from an improved rate structure which allows the company to recoup inflation-related cost<br />
increases on a more consistent basis.<br />
Telefonica de Espana (TEF - $71.75 - NYSE) is a diversified telecommunications service provider<br />
offering services to more than 15 million lines. <strong>The</strong> company also services a fast growing cellular<br />
subscriber base which now exceeds two million subscribers. We consider TEF an ideal way to invest<br />
in Latin America, with a diversified portfolio of telecommunication operations in the region. Its portfolio<br />
of publicly-traded Latin American companies includes: Compania Telefonos Chile, Telefonica de<br />
Argentina S.A. and Compania Peruana de Telefonos. TEF also holds interests in non-public Latin<br />
American telecom operations in Mexico, Colombia, Puerto Rico, Uruguay and Venezuela. <strong>The</strong><br />
company’s long-term strategy is to create a Pan-American network, leveraging the Spanish-speaking<br />
world. TEF jump-started this effort with its decision to form a global alliance with British Telecom/MCI’s<br />
Concert plc, which is gaining momentum in the race to become the dominant provider of one-stop<br />
shopping for full-service, global telecommunications products.<br />
Vodafone Group plc (VOD - $44.125 - NYSE) is a U.K.-based global provider of wireless<br />
telecommunications services. <strong>The</strong> company’s major interests in the U.K. include cellular, paging and<br />
data transmission. 630,000 net new customers were added last year, to reach a subscriber base of<br />
2,450,000. Vodafone’s shares sell at one of the lowest multiples of EBITDA among the major wireless<br />
companies, despite a pristine balance sheet and prospects for 20% annual growth in earnings and<br />
cash flow. Management is highly respected and has positioned the company to share in the exciting<br />
and rapidly growing global market for wireless communications.<br />
Telephone and Data Systems, Inc (TDS - $38.375 - ASE) is oriented to create substantial shareholder<br />
value (as compared to focusing on near-term earnings per share). TDS is a domestic provider of local<br />
telephone service to about 493,000 mostly rural access lines and is the seventh largest cellular<br />
telephone company in the U.S. with a fast growing paging company. Consolidated operating cash flow<br />
rose 25% in 1996, driven mainly by internal growth in cellular telephone. Cellular telephone<br />
subscribers grew by almost 55% to over one million at year-end 1996. We expect strong growth at<br />
TDS to result in a private market value of $160 per share by 2000. TDS has been active in the PCS<br />
auctions and was the high bidder in eight markets with a combined population of 27 million. TDS’s<br />
investments in U.S. Cellular, American Portable Telephone and American Paging, at their current<br />
market prices, are worth $35 per TDS share.<br />
7
Minimum Initial Investment - $1,000<br />
Effective August 12, 1996 <strong>The</strong> <strong>Gabelli</strong> <strong>Global</strong> <strong>Telecommunications</strong> <strong>Fund</strong>’s minimum initial<br />
investment is $1,000 for all accounts. <strong>The</strong>re are no subsequent investment minimums. No initial<br />
minimum is required for those establishing an Automatic Investment Plan. <strong>The</strong> <strong>Gabelli</strong> <strong>Global</strong><br />
<strong>Telecommunications</strong> <strong>Fund</strong> and other <strong>Gabelli</strong> <strong>Fund</strong>s are available through the no-transaction fee<br />
programs at many major discount brokerage firms.<br />
Internet<br />
You can now visit us on the Internet. Our home page at http://www.gabelli.com contains<br />
information about <strong>Gabelli</strong> <strong>Fund</strong>s, Inc., the <strong>Gabelli</strong> Mutual <strong>Fund</strong>s, quarterly reports, closing prices, IRAs,<br />
401(k)s and other current news. You can also send us e-mail at info@gabelli.com.<br />
In Conclusion<br />
<strong>The</strong> <strong>Fund</strong>’s daily net asset value is available in the financial press and each evening after<br />
6:00 PM (Eastern Time) by calling 1-800-GABELLI (1-800-422-3554). <strong>The</strong> <strong>Fund</strong>’s NASDAQ symbol is<br />
GABTX. Please call us during the day for further information.<br />
Sincerely,<br />
Mario J. <strong>Gabelli</strong>, CFA<br />
President and Portfolio Manager<br />
Marc J. <strong>Gabelli</strong><br />
Associate Portfolio Manager<br />
May 1, 1997<br />
Ivan Arteaga, CPA<br />
Associate Portfolio Manager<br />
Top Ten Holdings<br />
March 31, 1997<br />
Telefonica de Espana<br />
Telecomunicacoes Brasileiras SA (Telebras)<br />
Telephone & Data Systems, Inc.<br />
Cable & Wireless plc<br />
AirTouch Communications Inc.<br />
Vodafone Group plc<br />
BC Telecom Inc.<br />
Cia De Telefonos Chile<br />
Comcast Corporation<br />
Tele-Communications, Inc.<br />
NOTE: <strong>The</strong> views expressed in this report reflect those of the portfolio manager only through the end<br />
of the period of this report as stated on the cover. <strong>The</strong> manager’s views are subject to change at any<br />
time based on market and other conditions.<br />
8
<strong>The</strong> <strong>Gabelli</strong> <strong>Global</strong> Telecommunication <strong>Fund</strong><br />
Portfolio of Investments Ì March 31, 1997 (Unaudited)<br />
Shares Value Shares Value<br />
COMMON STOCKS Ì 94.45% 20,000 Sprint Corporation ÏÏÏÏÏÏÏÏÏÏÏÏÏÏÏÏÏ $ 910,000<br />
Alternative Telecommunication Service<br />
4,000 Teleglobe Inc. ÏÏÏÏÏÏÏÏÏÏÏÏÏÏÏÏÏÏÏÏ 115,896<br />
500<br />
Providers Ì 1.70%<br />
Bouygues GroupÏÏÏÏÏÏÏÏÏÏÏÏÏÏÏÏÏÏÏ $ 49,681<br />
5,130,945<br />
4,000 Esprit Telecom Group Plc ÏÏÏÏÏÏÏÏÏÏÏ 47,500 Miscellaneous Ì 1.49%<br />
15,000 GST <strong>Telecommunications</strong> Inc.‰ ÏÏÏÏÏÏ 112,500 3,000 Lodgenet Entertainment Corporation‰ ÏÏ 31,500<br />
15,000 ICG Communications Inc. ÏÏÏÏÏÏÏÏÏÏÏ 170,625 6,000 Metromedia International Group Inc. ÏÏÏ 52,125<br />
1,000 Intermedia Communications Inc.‰ ÏÏÏÏÏ 16,625 10,000 News Corporation Limited ADR ÏÏÏÏÏÏÏ 180,000<br />
2,500 Mannesmann AG ÏÏÏÏÏÏÏÏÏÏÏÏÏÏÏÏÏÏ 951,493 10,000 Price Communications Corporation ÏÏÏÏ 97,500<br />
400 Teleport Communications Group Inc. 22,000 Time Warner Inc. ÏÏÏÏÏÏÏÏÏÏÏÏÏÏÏÏÏÏ 951,500<br />
Cl. A‰ ÏÏÏÏÏÏÏÏÏÏÏÏÏÏÏÏÏÏÏÏÏÏÏÏÏ 9,200 3,000 Veba AG ÏÏÏÏÏÏÏÏÏÏÏÏÏÏÏÏÏÏÏÏÏÏÏÏÏ 171,582<br />
15,000 WorldCom ÏÏÏÏÏÏÏÏÏÏÏÏÏÏÏÏÏÏÏÏÏÏÏ 330,000<br />
1,484,207<br />
1,687,624<br />
Publishing Ì 0.43%<br />
Aviation: Parts and Accessories Ì 0.71%<br />
14,000 Media General Inc. Class A ÏÏÏÏÏÏÏÏÏÏ 397,250<br />
13,000 General Motors Corporation Cl. H ÏÏÏÏÏ 705,250<br />
100,000 Seat Spa*ÏÏÏÏÏÏÏÏÏÏÏÏÏÏÏÏÏÏÏÏÏÏÏÏ 34,635<br />
431,885<br />
Cable Ì 10.32%<br />
Regional/Local Telephone Services Ì 13.71%<br />
50,000 Adelphia Communications Corporation<br />
44,000 Aliant Communications Inc. ÏÏÏÏÏÏÏÏÏ 726,000<br />
Cl. A‰ ÏÏÏÏÏÏÏÏÏÏÏÏÏÏÏÏÏÏÏÏÏÏÏÏÏ 268,750<br />
28,000 ALLTEL CorporationÏÏÏÏÏÏÏÏÏÏÏÏÏÏÏÏ 910,000<br />
32,000 Bell Cablemedia plc ADR‰ ÏÏÏÏÏÏÏÏÏÏÏ 504,000<br />
24,000 Ameritech Corporation ÏÏÏÏÏÏÏÏÏÏÏÏÏÏ 1,476,000<br />
30,000 Cablevision Systems Corporation Cl. A‰ 892,500<br />
38,000 Atlantic Tele-Network Inc.‰ ÏÏÏÏÏÏÏÏÏÏ 465,500<br />
65,000 Century Communications Corporation<br />
8,000 Bell Atlantic Corporation ÏÏÏÏÏÏÏÏÏÏÏÏ 487,000<br />
Cl. A‰ ÏÏÏÏÏÏÏÏÏÏÏÏÏÏÏÏÏÏÏÏÏÏÏÏÏ 300,625<br />
35,000 BellSouth Corporation ÏÏÏÏÏÏÏÏÏÏÏÏÏÏ 1,478,750<br />
110,000 Comcast Corporation Cl. A‰ ÏÏÏÏÏÏÏÏÏ 1,801,250<br />
9,000 Bruncor, Inc. ÏÏÏÏÏÏÏÏÏÏÏÏÏÏÏÏÏÏÏÏÏ 194,436<br />
42,000 Comcast U.K. Cable Partners Limited‰ 467,250<br />
1,000 Cincinnati Bell Inc. ÏÏÏÏÏÏÏÏÏÏÏÏÏÏÏÏ 56,500<br />
10,000 General Cable Corporation plc ADR‰ÏÏÏ 148,750<br />
62,000 C-TEC Corporation Cl. B ÏÏÏÏÏÏÏÏÏÏÏÏ 1,821,250<br />
42,200 International CableTel Incorporated‰ ÏÏÏ 891,475<br />
1,000 First PaciÑc Company Ltd. Spons. ADR 63,556<br />
18,500 NYNEX CableComms Group plc ADR‰ 307,563<br />
30,000 Frontier Corporation ÏÏÏÏÏÏÏÏÏÏÏÏÏÏÏÏ 536,250<br />
20,000 Rogers Communications, Inc. Cl. B ÏÏÏÏ 125,000<br />
38,000 GTE CorporationÏÏÏÏÏÏÏÏÏÏÏÏÏÏÏÏÏÏÏ 1,771,750<br />
75,000 Tele-Communications, Inc. Cl. A‰ ÏÏÏÏÏ 900,000<br />
15,000 Island Telephone Company LimitedÏÏÏÏ 287,211<br />
60,375 Tele-Communications, Inc./Liberty<br />
19,000 Maritime Telegraph and Telephone<br />
Media Group Cl. A‰ ÏÏÏÏÏÏÏÏÏÏÏÏÏÏ 1,203,727<br />
Company Limited ÏÏÏÏÏÏÏÏÏÏÏÏÏÏÏÏ 316,438<br />
35,000 <strong>Telecommunications</strong> International Inc.<br />
12,000 NewTel Enterprises Limited ÏÏÏÏÏÏÏÏÏÏ 209,827<br />
Cl. A‰ ÏÏÏÏÏÏÏÏÏÏÏÏÏÏÏÏÏÏÏÏÏÏÏÏÏ 450,625<br />
3,000 NYNEX Corporation ÏÏÏÏÏÏÏÏÏÏÏÏÏÏÏÏ 136,875<br />
6,000 Telewest Communications plc ADR‰ ÏÏÏ 104,250<br />
12,000 PaciÑc Telecom, Inc. ÏÏÏÏÏÏÏÏÏÏÏÏÏÏÏ 360,000<br />
90,000 United International Holdings Inc. Cl. A‰ 855,000<br />
3,000 PaciÑc Telesis Group Inc. ÏÏÏÏÏÏÏÏÏÏÏ 113,250<br />
55,000 US WEST Media Group‰ ÏÏÏÏÏÏÏÏÏÏÏÏ 1,024,375<br />
3,000 Peoples Telephone Company Inc.‰ ÏÏÏÏ 10,125<br />
10,245,140 10,000 Quebec-Telephone‰ ÏÏÏÏÏÏÏÏÏÏÏÏÏÏÏÏ 171,243<br />
10,000 SBC Communications, Inc. ÏÏÏÏÏÏÏÏÏÏ 526,250<br />
Long Distance Telephone Companies Ì 5.17%<br />
28,000 Southern New England<br />
25,000 AT&T Corp. ÏÏÏÏÏÏÏÏÏÏÏÏÏÏÏÏÏÏÏÏÏÏ 868,750<br />
<strong>Telecommunications</strong> Corporation ÏÏÏÏ 1,004,500<br />
25,000 Call-Net Enterprises Inc.‰ ÏÏÏÏÏÏÏÏÏÏÏ 388,367<br />
10,000 Telus CorporationÏÏÏÏÏÏÏÏÏÏÏÏÏÏÏÏÏÏ 154,624<br />
25,000 Cam-Net Communications Network<br />
10,000 US WEST Communications GroupÏÏÏÏÏ 340,000<br />
Inc.‰ ÏÏÏÏÏÏÏÏÏÏÏÏÏÏÏÏÏÏÏÏÏÏÏÏÏ 1,550<br />
13,617,335<br />
165 DDI Corporation ÏÏÏÏÏÏÏÏÏÏÏÏÏÏÏÏÏÏÏ 1,041,207<br />
5,000 Fonorola Inc.‰ ÏÏÏÏÏÏÏÏÏÏÏÏÏÏÏÏÏÏÏÏ 72,254 Satellite Ì 0.47%<br />
100,000 General Communication Inc. Cl. A‰ ÏÏÏÏ 668,750 1,000 British Sky Broadcasting Group ADRÏÏÏ 60,625<br />
6,500 Kokusai DenshinÏÏÏÏÏÏÏÏÏÏÏÏÏÏÏÏÏÏÏ 378,921 8,000 Echostar Communications Corporation<br />
5,000 LCI International Inc.‰ ÏÏÏÏÏÏÏÏÏÏÏÏÏÏ 83,750 Cl. A‰ ÏÏÏÏÏÏÏÏÏÏÏÏÏÏÏÏÏÏÏÏÏÏÏÏÏ 164,000<br />
6,000 MCI Communications Corporation ÏÏÏÏÏ 213,750 452 <strong>Global</strong>star Capital, Corp. ÏÏÏÏÏÏÏÏÏÏÏÏ 12,204<br />
66,000 P.D.L. Holdings Limited ÏÏÏÏÏÏÏÏÏÏÏÏÏ 387,750 2,000 PT Indonesia Satellite ÏÏÏÏÏÏÏÏÏÏÏÏÏÏ 53,500<br />
9
<strong>The</strong> <strong>Gabelli</strong> <strong>Global</strong> Telecommunication <strong>Fund</strong><br />
Portfolio of Investments (Continued) Ì March 31, 1997 (Unaudited)<br />
Shares Value Shares Value<br />
COMMON STOCKS (continued) 20,000 Singapore <strong>Telecommunications</strong><br />
Satellite (continued)<br />
Limited ÏÏÏÏÏÏÏÏÏÏÏÏÏÏÏÏÏÏÏÏÏÏÏÏ $ 41,522<br />
20,000 TCI Satellite Entertainment Cl A‰ ÏÏÏÏÏ $ 155,000<br />
28,000 STET SpA Ì Societa Financiaria<br />
2,000 U.S. Satellite Broadcasting Co.‰ ÏÏÏÏÏÏ 21,500<br />
Telfonica SpA ADRÏÏÏÏÏÏÏÏÏÏÏÏÏÏÏ 1,214,500<br />
8,000 Tele Danmark A/S ADRÏÏÏÏÏÏÏÏÏÏÏÏÏ 209,000<br />
466,829<br />
18,000 Telecom Argentina Stet Ì France<br />
<strong>Telecommunications</strong> (Other) Ì 0.28%<br />
Telecom S.A. ADR ÏÏÏÏÏÏÏÏÏÏÏÏÏÏÏ 828,000<br />
2,500 Great Nordic Stores ÏÏÏÏÏÏÏÏÏÏÏÏÏÏÏÏ 261,112<br />
326,086 Telecom Asia ÏÏÏÏÏÏÏÏÏÏÏÏÏÏÏÏÏÏÏÏÏ 555,401<br />
2,000 United Communication IndustryÏÏÏÏÏÏÏ 12,933<br />
2,000 Telecom Asia ADR ÏÏÏÏÏÏÏÏÏÏÏÏÏÏÏÏÏ 35,200<br />
19,000 Telecom Corporation of New Zealand<br />
274,045 Ltd. ADRÏÏÏÏÏÏÏÏÏÏÏÏÏÏÏÏÏÏÏÏÏÏÏ 1,349,000<br />
Telephone Equipment Ì 3.12%<br />
350,000 Telecom Italia SpA‰ ÏÏÏÏÏÏÏÏÏÏÏÏÏÏÏÏ 871,551<br />
60,000 Champion Technology Holdings ADR ÏÏ 45,300<br />
36,000 Telecomunicacoes Brasileiras<br />
4,400 Ericsson (L.M.) Telephone Company<br />
(Telebras) S.A. Spons. ADR ÏÏÏÏÏÏÏ 3,685,500<br />
ADR ÏÏÏÏÏÏÏÏÏÏÏÏÏÏÏÏÏÏÏÏÏÏÏÏÏÏ 148,775<br />
938,570 Telecomunicacoes de Sao Paulo SA<br />
10,000 General Instrument Corporation ÏÏÏÏÏÏÏ 228,750<br />
(Telesp)ÏÏÏÏÏÏÏÏÏÏÏÏÏÏÏÏÏÏÏÏÏÏÏ 234,864<br />
9,000 Lucent Technologies, Inc. ÏÏÏÏÏÏÏÏÏÏÏ 474,750<br />
4,000,000 <strong>Telecommunications</strong> of Jamaica ÏÏÏÏÏÏ 404,000<br />
500 Siemens AG Ì ADRÏÏÏÏÏÏÏÏÏÏÏÏÏÏÏÏ 26,942<br />
45,000 Telefonica de Argentina S.A. ADR ÏÏÏÏÏ 1,321,875<br />
2,500 Motorola, Inc. ÏÏÏÏÏÏÏÏÏÏÏÏÏÏÏÏÏÏÏÏ 150,938<br />
55,000 Telefonica de Espana ADRÏÏÏÏÏÏÏÏÏÏÏ 3,802,750<br />
25,000 Northern Telecom Limited ÏÏÏÏÏÏÏÏÏÏÏ 1,634,375<br />
50,000 Telefonos De Mexico S.A. Cl. L ADR ÏÏ 1,925,000<br />
10,000 ScientiÑc-Atlanta, Inc. ÏÏÏÏÏÏÏÏÏÏÏÏÏÏ 152,500<br />
190,000 Telekom Malaysia Berhad ÏÏÏÏÏÏÏÏÏÏÏ 1,479,225<br />
115,500 Time Engineering Berhad ÏÏÏÏÏÏÏÏÏÏÏÏ 239,946<br />
8,075 Thai Telephone & Telecom GDR ÏÏÏÏÏÏ 20,296<br />
3,102,276<br />
36,391,960<br />
Telephone Networks Ì 36.64% Wireless Communications Ì 20.41%<br />
110,000 BC TELECOM Inc. ÏÏÏÏÏÏÏÏÏÏÏÏÏÏÏÏÏ 2,404,263 40,000 ABC Communications Holdings Ltd. ÏÏÏ $ 9,292<br />
45,000 BCE Inc. ÏÏÏÏÏÏÏÏÏÏÏÏÏÏÏÏÏÏÏÏÏÏÏÏ 2,070,000 100,000 AirTouch Communications Inc.‰ ÏÏÏÏÏÏ 2,300,000<br />
3,000 BHI Corporation ÏÏÏÏÏÏÏÏÏÏÏÏÏÏÏÏÏÏÏ 58,125 73,000 Aerial Communications Inc.‰ ÏÏÏÏÏÏÏÏÏ 401,500<br />
3,000 British <strong>Telecommunications</strong> plc ADRÏÏÏ 210,000 2,000 American Mobile Satellite Corporation‰ 22,500<br />
120,000 Cable & Wireless plc ADR ÏÏÏÏÏÏÏÏÏÏÏ 2,850,000 72,000 American Paging, Incorporated‰ ÏÏÏÏÏÏ 252,000<br />
80,000 Compagnia Telefonos Chile S.A. ÏÏÏÏÏÏ 2,300,000 100 Asia Satellite Telcommunications<br />
30,000 CP Pokphand Spons. ADRÏÏÏÏÏÏÏÏÏÏÏ 241,965 Holdings Ltd. ÏÏÏÏÏÏÏÏÏÏÏÏÏÏÏÏÏÏÏ 2,563<br />
525,100 CPT Telefonica del Peru Cl. B ÏÏÏÏÏÏÏÏ 1,168,213 14,200 Associated Group, Inc. Cl. A‰ ÏÏÏÏÏÏÏÏ 536,050<br />
1,000 CPT Telefonica del Peru Cl. B ADRÏÏÏÏ 22,250 16,000 Associated Group, Inc. Cl. B‰ ÏÏÏÏÏÏÏÏ 580,000<br />
9,000 Deutsche Telecom AG‰ ÏÏÏÏÏÏÏÏÏÏÏÏÏ 196,875 14,000 BCE Mobile Communications Inc.‰ ÏÏÏÏ 424,855<br />
3,430 Hellenic <strong>Telecommunications</strong> 20,000 Cellular Communications International<br />
Organization S.A. (OTE) ÏÏÏÏÏÏÏÏÏÏ 74,139 Inc.‰ ÏÏÏÏÏÏÏÏÏÏÏÏÏÏÏÏÏÏÏÏÏÏÏÏÏ 555,000<br />
15,000 Hong Kong <strong>Telecommunications</strong> Ltd. 105,000 Centennial Cellular Corp. Cl. A‰ÏÏÏÏÏÏÏ 1,089,375<br />
ADR ÏÏÏÏÏÏÏÏÏÏÏÏÏÏÏÏÏÏÏÏÏÏÏÏÏÏ 245,625 30,000 Century Telephone Enterprises, Inc. ÏÏÏ 885,000<br />
8,000 PT Telekomunikasi Indonesia*ÏÏÏÏÏÏÏÏ 241,000 2,000 Commnet Cellular Inc.‰ ÏÏÏÏÏÏÏÏÏÏÏÏÏ 51,000<br />
1,000 Hungarian Telephone & Cable 50,000 COMSAT Corporation ÏÏÏÏÏÏÏÏÏÏÏÏÏÏÏ 1,218,750<br />
CorporationÏÏÏÏÏÏÏÏÏÏÏÏÏÏÏÏÏÏÏÏÏ 9,750 400 Omnipoint Corporation ÏÏÏÏÏÏÏÏÏÏÏÏÏÏ 3,900<br />
40 Japan Telecom Co. Ltd. ÏÏÏÏÏÏÏÏÏÏÏÏ 675,420 150,000 Technology Resources Industries ÏÏÏÏÏ 326,745<br />
8,000 MIDCOM Communications Inc.‰ ÏÏÏÏÏÏ 64,000 1,000 CoreComm Inc. ÏÏÏÏÏÏÏÏÏÏÏÏÏÏÏÏÏÏÏ 14,500<br />
167 Nippon Telegraph & Telephone 4,000 <strong>Global</strong>star <strong>Telecommunications</strong><br />
Corporation‰ÏÏÏÏÏÏÏÏÏÏÏÏÏÏÏÏÏÏÏÏ 1,176,075 Limited‰ ÏÏÏÏÏÏÏÏÏÏÏÏÏÏÏÏÏÏÏÏÏÏÏ 214,000<br />
10,000 Nippon Telegraph & Telephone 44,000 Grupo Iusacell S.A. ADR Ser. D‰ÏÏÏÏÏÏ 368,500<br />
Corporation ADR ÏÏÏÏÏÏÏÏÏÏÏÏÏÏÏÏ 358,750 26,000 Himachal(a)ÏÏÏÏÏÏÏÏÏÏÏÏÏÏÏÏÏÏÏÏÏÏ 32,933<br />
50,000 Nordictel Holdings AB‰ ÏÏÏÏÏÏÏÏÏÏÏÏÏ 1,029,938 24,000 Jasmine International(a) ÏÏÏÏÏÏÏÏÏÏÏÏ 33,718<br />
800 Pakistan <strong>Telecommunications</strong> GDR‰ ÏÏÏ 60,000 15,000 Loral Space & Communications Ltd.‰ 211,875<br />
26,900 Philippine Long Distance Telephone 5,300 Matrix <strong>Telecommunications</strong> Ltd.‰ ÏÏÏÏÏ 8,540<br />
Company ÏÏÏÏÏÏÏÏÏÏÏÏÏÏÏÏÏÏÏÏÏÏ 1,610,638 1,500 Metrocall, Inc.‰ ÏÏÏÏÏÏÏÏÏÏÏÏÏÏÏÏÏÏÏ 6,188<br />
12,000 Portugal Telecom S.A. ADR ÏÏÏÏÏÏÏÏÏÏ 441,000 8,000 Mobile Telecommunication<br />
25,000 Kominklijke PTT Nederland NV ADR ÏÏÏ 906,250 Technologies Corp.‰ ÏÏÏÏÏÏÏÏÏÏÏÏÏ 50,000<br />
10
<strong>The</strong> <strong>Gabelli</strong> <strong>Global</strong> Telecommunication <strong>Fund</strong><br />
Portfolio of Investments (Continued) Ì March 31, 1997 (Unaudited)<br />
Principal<br />
Amount<br />
or Shares Value Shares Value<br />
COMMON STOCKS (continued) Long Distance Telephone Companies Ì 0.69%<br />
Wireless Communications (continued)<br />
10,000 Philippine Long Distance Telephone<br />
$ Company 7.00% Cv. Pfd. Ser. 111 ÏÏ $ 550,000<br />
4,000 Sprint Corporation 8.25% Cv. Pfd. ÏÏÏÏ 137,500<br />
11,000<br />
8,000<br />
NEXTEL Communications, Inc. Cl. A‰ ÏÏ<br />
Palmer Wireless Inc. ÏÏÏÏÏÏÏÏÏÏÏÏÏÏÏ<br />
147,125<br />
98,000<br />
1,000 PanAmSat Corporation‰ÏÏÏÏÏÏÏÏÏÏÏÏÏ 28,750<br />
8,000 PittencrieÅ Communications, Inc.‰ ÏÏÏÏ 28,500<br />
687,500<br />
31,000 PriCellular Corporation ÏÏÏÏÏÏÏÏÏÏÏÏÏÏ 255,750 TELECOMMUNICATION Ì<br />
Wireless Communications Ì 0.36%<br />
Cl. B ÏÏÏÏÏÏÏÏÏÏÏÏÏÏÏÏÏÏÏÏÏÏÏÏÏÏ 790,124 6,222 AirTouch Communications, Inc. 6.00%<br />
1,000 Rural Cellular Corp. Cl. A‰ÏÏÏÏÏÏÏÏÏÏÏ 10,500 Cv. Pfd. Cl. B ÏÏÏÏÏÏÏÏÏÏÏÏÏÏÏÏÏÏÏ 159,439<br />
70,000 Securicor Group plc ÏÏÏÏÏÏÏÏÏÏÏÏÏÏÏÏ 336,363 3,000 AirTouch Communications, Inc. 4.25%<br />
5,001 360 Communications Company‰ 86,261 Cv. Pfd. Cl. C ÏÏÏÏÏÏÏÏÏÏÏÏÏÏÏÏÏÏÏ 131,250<br />
800,000 Telecom Italia Mobile SpA‰ ÏÏÏÏÏÏÏÏÏÏ 2,293,085 5,000 Mobile Telecommunication<br />
90,000 Telephone and Data Systems, Inc. ÏÏÏÏ 3,453,750 Technologies Corp 144 Ì A(a) ÏÏÏÏ 68,750<br />
2,000 Thyssen AG ÏÏÏÏÏÏÏÏÏÏÏÏÏÏÏÏÏÏÏÏÏÏ 451,343<br />
22,000 Total Access Communications plcÏÏÏÏÏ 95,156<br />
359,439<br />
43,000 Rogers Cantel Mobile Communications<br />
3,000 United States Cellular Corporation‰ÏÏÏÏ 74,625<br />
TOTAL CONVERTIBLE PREFERRED<br />
1,500 Vanguard Cellular Systems, Inc. Cl. A‰ 16,500<br />
1,000 Vimpel Communications‰ ÏÏÏÏÏÏÏÏÏÏÏ 32,000<br />
56,000 Vodafone Group plc ADRÏÏÏÏÏÏÏÏÏÏÏÏ 2,471,000<br />
STOCKS (Cost: $2,421,863)ÏÏÏÏÏÏÏ 2,196,439<br />
PREFERRED STOCKS Ì 0.54%<br />
20,267,616 Telephone Equipment Ì 0.12%<br />
2,000 Nokia Corp. ADR Ì A ÏÏÏÏÏÏÏÏÏÏÏÏÏÏ 116,500<br />
TOTAL COMMON STOCKS<br />
(Cost: $81,371,420) ÏÏÏÏÏÏÏÏÏÏÏÏÏ 93,805,112<br />
Wireless Communications Ì 0.42%<br />
Tel Rio de Janeiro Pfd. ÏÏÏÏÏÏÏÏÏÏÏÏÏ 416,374<br />
CONVERTIBLE CORPORATE BONDS Ì 2.12%<br />
TOTAL PREFERRED STOCKS<br />
Telephone Networks Ì 0.96%<br />
(Cost: $280,139) ÏÏÏÏÏÏÏÏÏÏÏÏÏÏÏ 532,874<br />
$1,000,000 Telekom Malaysia Berhad Sub. Deb. Cv.<br />
4.000%, 10/03/04(a)ÏÏÏÏÏÏÏÏÏÏÏÏ 951,250 TOTAL INVESTMENTS Ì 99.32%<br />
(Cost: $86,013,967) ÏÏÏÏÏÏÏÏÏÏÏÏÏ 98,643,261<br />
Wireless Communications Ì 1.16%<br />
300,000,000(b) Softe SA Unsub. Deb. Cv. 4.25%,<br />
Other Assets less liabilities Ì 0.68% 679,426<br />
07/30/98ÏÏÏÏÏÏÏÏÏÏÏÏÏÏÏÏÏÏÏÏÏÏ 360,086<br />
250,000 Technology Resources Industries Sub.<br />
NET ASSETS Ì 100.00% ÏÏÏÏÏÏÏÏÏÏÏ $99,322,687<br />
Deb. Cv. 2.75%, 11/28/04(a) ÏÏÏÏÏ 287,500<br />
500,000 Tele 2000 Sub. Deb. Cv. 9.75%,<br />
(Shares outstanding 8,794,773) ÏÏÏÏÏÏ $11.29<br />
04/14/97(a) ÏÏÏÏÏÏÏÏÏÏÏÏÏÏÏÏÏÏÏ 510,000<br />
1,157,586<br />
‰ Ì Non-income producing security<br />
ADR Ì American Depositary Receipt<br />
TOTAL CONVERTIBLE CORPORATE<br />
SDR Ì <strong>Global</strong> Depositary Receipt<br />
BONDS (Cost: $1,940,545) ÏÏÏÏÏÏÏ 2,108,836<br />
(a) Ì Security exempt from registration under Rule 144A of the<br />
CONVERTIBLE PREFERRED STOCKS Ì 2.21%<br />
Securities Act of 1933. <strong>The</strong>se securities may be resold in<br />
transactions exempt from registration., normally to qualiÑed<br />
Cable Ì 1.16%<br />
institutional buyers. At March 31, 1997, Rule 144A securities<br />
19,000 Tele-Communications, Inc. Cv. Pfd.<br />
amounted to $1,884,151 or 1.9% of net assets.<br />
Ser. E ÏÏÏÏÏÏÏÏÏÏÏÏÏÏÏÏÏÏÏÏÏÏÏÏÏ $ 1,149,500 (b) Ì Principal amount denoted in Italian Lira.<br />
11
<strong>Gabelli</strong> <strong>Global</strong> Series <strong>Fund</strong>s, Inc.<br />
<strong>The</strong> <strong>Gabelli</strong> <strong>Global</strong> <strong>Telecommunications</strong> <strong>Fund</strong><br />
One Corporate Center<br />
Rye, New York 10580-1434<br />
1-800-GABELLI<br />
®1-800-422-3554©<br />
fax: 1-914-921-5118<br />
http://www.gabelli.com<br />
e-mail: info@gabelli.com<br />
(Net Asset Value may be obtained daily by calling<br />
1-800-GABELLI after 6:00 P.M.)<br />
Board of Directors<br />
Mario J. <strong>Gabelli</strong>, CFA<br />
Chairman and Chief<br />
Investment OÇcer<br />
<strong>Gabelli</strong> <strong>Fund</strong>s, Inc.<br />
Karl Otto P ohl<br />
Former President<br />
Deutsche Bundesbank<br />
Felix J. Christiana<br />
Werner J. Roeder, MD<br />
Former Senior Vice President Director of Surgery<br />
Dollar Dry Dock Savings Bank Lawrence Hospital<br />
Anthony J. Colavita<br />
Anthonie C. van Ekris<br />
Attorney-at-Law Managing Director <strong>The</strong><br />
Anthony J. Colavita, P.C.<br />
BALMAC International, Inc.<br />
John D. <strong>Gabelli</strong><br />
Vice President<br />
<strong>Gabelli</strong> & Company, Inc.<br />
Mario J. <strong>Gabelli</strong>, CFA<br />
President<br />
Bruce N. Alpert<br />
Vice President and Treasurer<br />
James E. McKee<br />
Secretary<br />
OÇcers<br />
Distributor<br />
<strong>Gabelli</strong> & Company, Inc.<br />
Marc J. <strong>Gabelli</strong><br />
Associate Portfolio Manager<br />
Ivan Arteaga, CPA<br />
Associate Portfolio Manager<br />
<strong>Gabelli</strong><br />
<strong>Global</strong><br />
<strong>Telecommunications</strong><br />
<strong>Fund</strong><br />
Custodian, Transfer Agent and Dividend Agent<br />
State Street Bank and Trust Company<br />
Legal Counsel<br />
Skadden, Arps, Slate, Meagher & Flom LLP<br />
This report is submitted for the general information of the shareholders of<br />
<strong>The</strong> <strong>Gabelli</strong> <strong>Global</strong> <strong>Telecommunications</strong> <strong>Fund</strong>. It is not authorized for<br />
distribution to prospective investors unless preceded or accompanied by<br />
FIRST QUARTER REPORT<br />
an eÅective prospectus.<br />
MARCH 31, 1997