1 Technical Note: Hydrology of the Bahi wetland, Tanzania
1 Technical Note: Hydrology of the Bahi wetland, Tanzania
1 Technical Note: Hydrology of the Bahi wetland, Tanzania

Create successful ePaper yourself
Turn your PDF publications into a flip-book with our unique Google optimized e-Paper software.
<strong>Technical</strong> <strong>Note</strong>: <strong>Hydrology</strong> <strong>of</strong> <strong>the</strong> <strong>Bahi</strong> <strong>wetland</strong>, <strong>Tanzania</strong><br />
Mat<strong>the</strong>w McCartney September 2007<br />
Description<br />
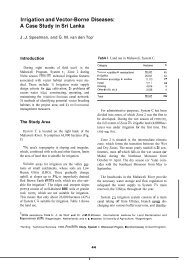
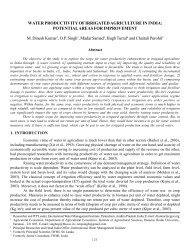
The <strong>Bahi</strong> <strong>wetland</strong> is a shallow ephemeral lake located in central <strong>Tanzania</strong>, approximately 60 km<br />
north-east <strong>of</strong> <strong>the</strong> city <strong>of</strong> Dodoma. Several studies have highlighted <strong>the</strong> importance <strong>of</strong> <strong>the</strong> lake and<br />
<strong>the</strong> surrounding <strong>wetland</strong> to local communities, who utilize it for cultivation, livestock keeping<br />
and fishing (Department <strong>of</strong> Irrigation and <strong>Technical</strong> Services, 2004; Yanda et al., 2007). Located<br />
within <strong>the</strong> <strong>Bahi</strong> depression, a downwarped section <strong>of</strong> <strong>the</strong> Eastern Rift Valley, between latitudes<br />
05 o 51’ and 06 o 20’ south and longitudes 34 o 59’ and 35 o 21’ east, <strong>the</strong> lake has a surface area <strong>of</strong><br />
approximately 974 km 2 (Figure 1) and lies at an altitude <strong>of</strong> 830 masl. There is no outflow from<br />
<strong>the</strong> lake, which consequently varies considerably in size depending on precipitation in <strong>the</strong><br />
catchment area. In some years <strong>the</strong> lake dries completely. The <strong>Bahi</strong> <strong>wetland</strong> receives water from<br />
various seasonal rivers, mainly draining from <strong>the</strong> north. Of <strong>the</strong>se <strong>the</strong> Bubu and Mponde are <strong>the</strong><br />
largest. O<strong>the</strong>r rivers flowing into <strong>the</strong> lake are <strong>the</strong> Lawila, Nkojigwe, Msemembo, Maduma and<br />
Zuboro. The total catchment area <strong>of</strong> <strong>the</strong> lake is 23,447 km 2 . All <strong>the</strong> rivers are ephemeral, usually<br />
ceasing to flow during <strong>the</strong> dry season (i.e. May to December).<br />
Climate<br />
The climate <strong>of</strong> <strong>the</strong> region, largely controlled by <strong>the</strong> movement <strong>of</strong> air masses associated with <strong>the</strong><br />
inter-tropical convergence zone (ITCZ), is semi-arid with a short rainy season extending from<br />
December to March. Mean annual rainfall across <strong>the</strong> catchment is approximately 600 mm with<br />
slightly higher rainfall at <strong>the</strong> higher altitudes in <strong>the</strong> north <strong>of</strong> <strong>the</strong> catchment (Figure 2). However,<br />
<strong>the</strong> rainfall pattern is irregular with significant variation from one year to <strong>the</strong> next and <strong>of</strong>ten<br />
several concurrent years with below average rainfall (Figure 3). Potential evapotranspiration<br />
(determined by <strong>the</strong> method <strong>of</strong> Penman-Monteith) is approximately 1620 mm and mean monthly<br />
values exceed mean monthly rainfall throughout <strong>the</strong> year (Figure 2). Table 1 lists <strong>the</strong> climate<br />
stations for which data were obtained for this study. Table 2 summarizes mean monthly rainfall,<br />
temperature and potential evaotranspiration for <strong>the</strong> <strong>Bahi</strong> meteorological station, which is <strong>the</strong><br />
closest monitoring site to <strong>the</strong> <strong>wetland</strong>.<br />
Table 1: Climate stations for which data obtained<br />
Nos. Name Latitude Longitude Altitude<br />
(masl)<br />
Distance<br />
from<br />
<strong>wetland</strong><br />
(km)<br />
Rainfall data<br />
Temperature<br />
data<br />
<strong>Bahi</strong> met station N/A N/A N/A
+ Obtained from Department <strong>of</strong> Irrigation and <strong>Technical</strong> Services (2004)<br />
All o<strong>the</strong>rs from FAO databases FAOClim and LocClim.<br />
BAHI WETLAND<br />
714000<br />
748000<br />
782000<br />
9350000<br />
To Kilimatinde<br />
#<br />
Kilimatinde<br />
Mpempe<br />
#<br />
Kintinku<br />
#<br />
Kisalalo<br />
#<br />
DODOMA REGION<br />
9350000<br />
#<br />
Mkonjigwe<br />
#<br />
<strong>Bahi</strong> Sokoni<br />
#<br />
Mwigamile<br />
#<br />
To Dodoma<br />
<strong>Bahi</strong><br />
9316000<br />
To Makasuku<br />
#<br />
#<br />
Majiri<br />
Kisarusaru<br />
Mahaka<br />
SINGIDA REGION<br />
#<br />
Area = 947.27 Sq Km<br />
Lugosi<br />
#<br />
Kikole<br />
Igongo<br />
#<br />
#<br />
Ikasi<br />
#<br />
#<br />
Kanyika<br />
To Isanza<br />
#<br />
#<br />
Makulu<br />
#<br />
Chali Makulu<br />
#<br />
#<br />
Kinyambwa<br />
#<br />
#<br />
Chenje<br />
#<br />
To Dodoma<br />
Utajenda To Chigongwe<br />
#<br />
Ntasa<br />
#<br />
Kitalalo<br />
Ugombe Kikola<br />
Ipanga<br />
Misui<br />
#<br />
#<br />
#<br />
Kigwa Mbuga<br />
To Magobwe<br />
Magobwe<br />
9316000<br />
714000<br />
748000<br />
782000<br />
0<br />
-5<br />
-10<br />
LOCATION SKETCH<br />
30 35 40<br />
MARA<br />
KAGER A<br />
MWANZA<br />
ARUSHA<br />
MAP OF TANZANIA<br />
SCALE 1: 6,000,000<br />
<strong>Bahi</strong> Wetland<br />
SHINYA NGA<br />
KILIMAN JA RO<br />
KIGOMA<br />
MANYARA<br />
KUSINI PEMBA<br />
SINGID A<br />
TANGA<br />
TABOR A<br />
KAS KAZINI UNGUJA<br />
DODOMA<br />
KUS INI U NGU JA<br />
DAR ES SALAAM<br />
MOROGORO<br />
RU KW A<br />
PWA NI<br />
MBEYA IRINGA<br />
LINDI<br />
RUVUMA<br />
MTWARA<br />
30 35 40<br />
0<br />
-5<br />
-10<br />
Railway<br />
All wea<strong>the</strong>r road<br />
River<br />
Regional boundary<br />
International boundary<br />
<strong>Bahi</strong> Wetland<br />
Regional boundary<br />
Water bodies<br />
LEGEND<br />
Wetland areas<br />
Bushed grassland<br />
Bushland with Scattered Cropland<br />
Dense Bushland<br />
Grassland with Scattered Cropland<br />
Mixed Cropping<br />
Open Bushland<br />
Wetland<br />
Source: Department <strong>of</strong> Irrigation and <strong>Technical</strong> Services (2003).<br />
Figure 1:<br />
Map <strong>of</strong> <strong>the</strong> <strong>Bahi</strong> Wetland<br />
2
Table 2:<br />
Mean monthly climate data from <strong>the</strong> <strong>Bahi</strong> meteorological station<br />
Month Rainfall (mm) Mean daily temperature<br />
( o C)<br />
Potential<br />
evapotranspiration (mm)<br />
(Penman-Monteith)<br />
Jan 124.7 26.0 130<br />
Feb 116.4 26.3 125<br />
Mar 116.8 26.9 127<br />
Apr 61.3 25.0 120<br />
May 11.4 24.2 115<br />
Jun 0.0 22.3 111<br />
Jul 0.0 22.2 121<br />
Aug 0.0 23.5 136<br />
Sep 0.5 25.3 159<br />
Oct 0.7 27.1 180<br />
Nov 38.9 28.0 165<br />
Dec 119.5 27.6 133<br />
Annual 590.1 1622<br />
(source: + data supplied by Wami-Ruvu River Basin Office<br />
* from Department <strong>of</strong> Irrigation and technical Services, 2004)<br />
200<br />
160<br />
120<br />
mm<br />
80<br />
40<br />
0<br />
Jan Feb Mar Apr May Jun Jul Aug Sep Oct Nov Dec<br />
Rainfall at <strong>Bahi</strong> Rainfall at Farkwa Potential Evapotranspiration<br />
Figure 2:<br />
Mean Monthly rainfall and Potential Evapotranspiration (Penman-Monteith)<br />
3
a) b)<br />
1200<br />
500<br />
Annual Rainfall (mm)<br />
1000<br />
800<br />
600<br />
400<br />
200<br />
0<br />
1980<br />
1982<br />
1984<br />
1986<br />
1988<br />
1990<br />
1992<br />
1994<br />
1996<br />
1998<br />
2000<br />
2002<br />
2004<br />
2006<br />
Deviation from mean annual rainfall (mm)<br />
400<br />
300<br />
200<br />
100<br />
0<br />
-100<br />
-200<br />
-300<br />
-400<br />
1980<br />
1982<br />
1984<br />
1986<br />
1988<br />
1990<br />
1992<br />
1994<br />
1996<br />
1998<br />
2000<br />
2002<br />
2004<br />
2006<br />
Figure 3:<br />
Rainfall measured at <strong>Bahi</strong> met station: a) annual time series b) deviation<br />
from <strong>the</strong> annual mean<br />
River flows<br />
All <strong>the</strong> major rivers flowing into <strong>the</strong> <strong>Bahi</strong> <strong>wetland</strong> originate from <strong>the</strong> nor<strong>the</strong>rn part <strong>of</strong> <strong>the</strong><br />
catchment in <strong>the</strong> Mbulu and Babati highlands. The catchment area <strong>of</strong> <strong>the</strong> Bubu river, <strong>the</strong> primary<br />
inflow, is 12,661 km 2 (i.e., 54% <strong>of</strong> <strong>the</strong> total). With <strong>the</strong> exception <strong>of</strong> <strong>the</strong> grassy floodplain<br />
extending around <strong>the</strong> edge <strong>of</strong> <strong>the</strong> lake (locally know as mbuga), <strong>the</strong> dominant vegetation is thorn<br />
scrub and thicket (Government <strong>of</strong> <strong>Tanzania</strong>, 1967). The drainage system to <strong>the</strong> south <strong>of</strong> <strong>the</strong><br />
swamp comprises several small ephemeral rivers, which drain directly into <strong>the</strong> lake.<br />
In <strong>the</strong> past several flow gauges were installed on <strong>the</strong> Bubu River and some flow monitoring <strong>of</strong> <strong>the</strong><br />
o<strong>the</strong>r rivers was also undertaken. However, largely as a consequence <strong>of</strong> flood damage or<br />
vandalism, as well as lack <strong>of</strong> funds for operation and repair, most <strong>of</strong> <strong>the</strong> gauges are no longer<br />
operational. Table 2 provides a summary <strong>of</strong> data obtained from <strong>the</strong> Ministry <strong>of</strong> Water Resources<br />
for <strong>the</strong> current study. There are no data available after 1983 and for most stations <strong>the</strong> records<br />
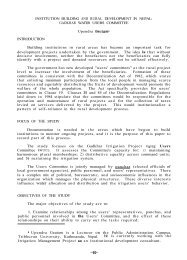
available are sparse and incomplete. By far <strong>the</strong> best data available are for <strong>the</strong> Bubu at <strong>Bahi</strong> (gauge<br />
2R4), but even this station (Figure 4) has only twenty years <strong>of</strong> complete data between 1957 and<br />
1981 and nothing after this date.<br />
Table 2:<br />
Station<br />
No.<br />
Flow gauging stations for which data were obtained<br />
River Location Latitude Longitude Catchment<br />
Area (km 2 )<br />
Record<br />
2R4 Bubu <strong>Bahi</strong> 5 o 38’ S 35 o 18’E 11,470 1957-1981 20<br />
2R24 Bubu Kinyika 5 o 49’ S 35 o 18’E 12,700 1969-1974 2<br />
2R1A Bubu Farkwa 5 o 19’ S 35 o 38’E 7,360 1957-1983 11<br />
2R7 Bubu Gwandi N/A N/A N/A 1956-1961 1<br />
2R29 Bubu Thawi 4 o 38’ S 35 o 41’E N/A 1971-1982 3<br />
2R23 Mponde Mponde 5 o 28’ S 35 o 12’E 1,922 1969-1973 2<br />
2R26 Maduma Mahuru 5 o 25’ S 34 o 59’E 933 1970-1978 6<br />
* Short periods (i.e. < 3 days) <strong>of</strong> missing data were infilled by interpolation<br />
Source: Ministry <strong>of</strong> Water Resources<br />
Nos. <strong>of</strong><br />
complete<br />
years*<br />
4
Figure 4:<br />
Photograph <strong>of</strong> <strong>the</strong> Bubu River at <strong>Bahi</strong> (location <strong>of</strong> gauge 2R4) in <strong>the</strong> dry season<br />
Monthly river flows are seasonal, reflecting <strong>the</strong> variation in rainfall in <strong>the</strong> catchment. Table 3<br />
presents mean monthly flows for <strong>the</strong> three stations for which more than 6 years <strong>of</strong> complete data<br />
are available. On average 95% <strong>the</strong> discharge occurs between December and April. Figure 4 shows<br />
<strong>the</strong> annual flow series and mean monthly flow for <strong>the</strong> same 3 stations. There is considerable year<br />
to year variation in flow, most likely reflecting <strong>the</strong> high rainfall variability. Annual flows in <strong>the</strong><br />
Bubu at <strong>Bahi</strong> range from 30.5 Mm 3 (1958) to 1,343 Mm 3 (1968).<br />
Table 3: Mean monthly flow (Mm 3 ) at three gauges<br />
Gauge Jan Feb Mar Apr May Jun Jul Aug Sep Oct Nov Dec Annual<br />
2R4 67.0 72.9 88.9 104.9 42.8 11.8 3.6 1.4 0.04 0 1.5 48.6 443.6<br />
2R1A 18.4 21.5 29.5 25.2 12.3 2.9 0.6 0.9 0.01 0 0.44 14.5 126.2<br />
2R26 3.0 2.9 1.8 0.5 0.03 0 0 0 0 0.01 0.02 2.29 10.5<br />
a) b)<br />
Annual Flow (Mm 3 )<br />
1600<br />
1400<br />
1200<br />
1000<br />
800<br />
600<br />
400<br />
200<br />
0<br />
1957<br />
1958<br />
1959<br />
1960<br />
1961<br />
1962<br />
1963<br />
1964<br />
1965<br />
1966<br />
1967<br />
1968<br />
1969<br />
1970<br />
1971<br />
1972<br />
1973<br />
1974<br />
1975<br />
1976<br />
1977<br />
1978<br />
1979<br />
1980<br />
1981<br />
Mean monthly flow (Mm 3 )<br />
120<br />
100<br />
80<br />
60<br />
40<br />
20<br />
0<br />
Jan Feb Mar Apr May Jun Jul Aug Sep Oct Nov Dec<br />
c) d)<br />
500<br />
35<br />
Annual Flow (Mm 3 )<br />
450<br />
400<br />
350<br />
300<br />
250<br />
200<br />
150<br />
100<br />
50<br />
Mean Monthly Flow (Mm 3 )<br />
30<br />
25<br />
20<br />
15<br />
10<br />
5<br />
0<br />
1957<br />
1959<br />
1961<br />
1963<br />
1965<br />
1967<br />
1969<br />
1971<br />
1973<br />
1975<br />
1977<br />
1979<br />
1981<br />
1983<br />
0<br />
Jan Feb Mar Apr May Jun Jul Aug Sep Oct Nov Dec<br />
e) f)<br />
5
20<br />
3.5<br />
Annual Flow (Mm 3 )<br />
18<br />
16<br />
14<br />
12<br />
10<br />
8<br />
6<br />
4<br />
2<br />
Mean Monthly Flow (Mm 3 )<br />
3<br />
2.5<br />
2<br />
1.5<br />
1<br />
0.5<br />
0<br />
1957<br />
1959<br />
1961<br />
1963<br />
1965<br />
1967<br />
1969<br />
1971<br />
1973<br />
1975<br />
1977<br />
1979<br />
1981<br />
0<br />
Jan Feb Mar Apr May Jun Jul Aug Sep Oct Nov Dec<br />
Figure 4:<br />
Annual flow and mean monthly flow for three stations: a) 2R4 b) 2R1A<br />
and c) 2R26<br />
The three gauges for which <strong>the</strong>re are more than 6 years <strong>of</strong> data indicate a clear relationship<br />
between catchment area and mean annual flow. Analyses <strong>of</strong> data from <strong>the</strong>se three stations,<br />
indicates mean annual run<strong>of</strong>f across <strong>the</strong> catchment is in <strong>the</strong> range 11 - 41 mm (Table 4). This<br />
indicates a coefficient <strong>of</strong> run<strong>of</strong>f in <strong>the</strong> range 2 – 6 %. The mean annual run<strong>of</strong>f estimated for <strong>the</strong><br />
Bubu at <strong>Bahi</strong> (i.e., 443.6 Mm 3 ) is significantly greater than that derived by <strong>the</strong> Department <strong>of</strong><br />
Irrigation (i.e., 183 Mm 3 ) (Department <strong>of</strong> Irrigation and <strong>Technical</strong> Services, 2003). However, <strong>the</strong><br />
Department <strong>of</strong> Irrigation estimate was based on just 4 years <strong>of</strong> data, while that in <strong>the</strong> current study<br />
has been determined using a much longer flow record (Table 3).<br />
Table 4: Run<strong>of</strong>f characteristics at three locations within <strong>the</strong> catchment<br />
Gauge Catchment area (km) Mean Annual Flow Run<strong>of</strong>f (mm)<br />
(Mm 3 )<br />
2R4 11,470 443.6 38.7<br />
2R1A 7,360 126.2 17.1<br />
2R26 933 10.5 11.3<br />
Wetland water budget<br />
A crude (back <strong>of</strong> <strong>the</strong> envelope) estimate <strong>of</strong> <strong>the</strong> annual water budget <strong>of</strong> <strong>the</strong> <strong>wetland</strong> was<br />
determined. The water budget <strong>of</strong> <strong>the</strong> <strong>wetland</strong> is approximated by <strong>the</strong> equation:<br />
P + Q i = E + Q o (equation 1)<br />
Where: P = precipitation onto <strong>the</strong> <strong>wetland</strong><br />
Q i = inflow into <strong>the</strong> <strong>wetland</strong><br />
E = evapotranspiration from <strong>the</strong> <strong>wetland</strong><br />
(a combination <strong>of</strong> open water evaporation and evapotranspiration from<br />
<strong>the</strong> surrounding grassland, as <strong>the</strong> lake recedes)<br />
Q o = outflow<br />
This assumes that groundwater fluxes to and from <strong>the</strong> <strong>wetland</strong> are negligible. Table 5 presents a<br />
summary <strong>of</strong> <strong>the</strong> mean annual water fluxes, with evapotranspiration computed from equation 1.<br />
The estimate indicates that on average approximately 60% <strong>of</strong> <strong>the</strong> water in <strong>the</strong> <strong>wetland</strong> originates<br />
as direct rainfall onto <strong>the</strong> <strong>wetland</strong> with 40% originating as inflow from <strong>the</strong> surrounding<br />
catchment. The estimated evapotranspiration <strong>of</strong> 1,415 Mm 3 equates to 1,494 mm (i.e., 92% <strong>of</strong> <strong>the</strong><br />
annual potential estimated using <strong>the</strong> Penman-Monteith equation (Table 2).<br />
6
Table 5: Estimate <strong>of</strong> <strong>the</strong> average annual water fluxes (Mm 3 ) into and out <strong>of</strong> <strong>the</strong> <strong>Bahi</strong><br />
<strong>wetland</strong><br />
Annual<br />
Direct rainfall onto <strong>the</strong> <strong>wetland</strong> + 852<br />
Evapotranspiration from <strong>the</strong> <strong>wetland</strong> 1,415<br />
Inflow from catchment* 563<br />
Outflow from <strong>the</strong> <strong>wetland</strong> 0<br />
+ Estimated to be 600 mm over an area <strong>of</strong> 947 km 2<br />
* Assumed coefficient <strong>of</strong> run<strong>of</strong>f <strong>of</strong> 4%, (i.e. 24 mm) and catchment area <strong>of</strong> 23,447 km 2<br />
The Possible Impact <strong>of</strong> Irrigation<br />
In recent years <strong>the</strong>re has been an increase in irrigation in <strong>the</strong> area, primarily for rice cultivation.<br />
Since <strong>the</strong> early 1980s IFAD have assisted with <strong>the</strong> establishment <strong>of</strong> many small-scale rice<br />
irrigation schemes through programs such as <strong>the</strong> Freedom from Hunger Campaign, <strong>the</strong> Integrated<br />
Rural Development Program and <strong>the</strong> Rift Valley Rice Production program. These are mostly<br />
based around traditional methods <strong>of</strong> irrigation (locally known as vinyungu) that comprises <strong>the</strong><br />
construction <strong>of</strong> large bunds into which rainwater and some river flows are diverted (i.e.,<br />
effectively spate irrigation). Table 6 provides an estimate <strong>of</strong> <strong>the</strong> current irrigated area located<br />
close to rivers flowing into <strong>the</strong> lake. Currently <strong>the</strong> total area remains small, but many <strong>of</strong> <strong>the</strong><br />
schemes have been reasonably successful and farmers are expanding <strong>the</strong>m on <strong>the</strong>ir own initiative.<br />
Table 6: Estimated area <strong>of</strong> rice irrigation close to <strong>the</strong> <strong>wetland</strong>.<br />
Village/scheme<br />
Estimated Area (ha)<br />
<strong>Bahi</strong> 1,200-1,500<br />
Chikuyu 300<br />
Weselleila 100<br />
Walelya 200<br />
Chipanga 250 (currently only 40 ha producing)<br />
Chikepelo 120<br />
Charli<br />
106 (currently only 20-40 ha producing)<br />
Uhaleya 134<br />
TOTAL 2,110 – 2,710<br />
Source: personal communication with Mr. Laurent Gallet (IFAD Program Coordinator) and Nicholas<br />
Lupindu (Irrigation Technician at <strong>the</strong> District Agriculture and Development Office)<br />
For 2,500 ha, assuming 1,000 mm <strong>of</strong> <strong>the</strong> total evaporative demand (i.e. 1,622 mm) is met through<br />
diverted water and irrigation efficiencies are <strong>of</strong> <strong>the</strong> order <strong>of</strong> 50% 1 , diversions <strong>of</strong> approximately 50<br />
Mm 3 are required. This represents approximately 9% <strong>of</strong> <strong>the</strong> estimated mean annual inflow into<br />
<strong>the</strong> lake. However, in very dry years diversions to rice irrigation schemes could potentially<br />
abstract a significant proportion <strong>of</strong> <strong>the</strong> inflow to <strong>the</strong> lake. For example, in 1938 <strong>the</strong> total inflow is<br />
estimated to have been only about 60 Mm 3 (i.e., derived by scaling <strong>the</strong> flow measured on <strong>the</strong><br />
Bubu at <strong>Bahi</strong>) and clearly current irrigation areas could have diverted a significant proportion <strong>of</strong><br />
this flow.<br />
1 Research in <strong>the</strong> Usangu catchment in <strong>Tanzania</strong> has shown that field application efficiency <strong>of</strong> smallholder<br />
farmers is typically in <strong>the</strong> range 56% to 69% (Machibya and Mdemu, 2005)<br />
7
Although <strong>the</strong> irrigation schemes are bringing benefits to many people, care is required to ensure<br />
that future development <strong>of</strong> water resources is sustainable. Consideration should be given to <strong>the</strong><br />
o<strong>the</strong>r natural resources that <strong>the</strong> lake and surrounding <strong>wetland</strong>s provide. To this end a water<br />
resource management plan should be developed for <strong>the</strong> lake and surrounding catchment. Clearly<br />
this needs to take into account <strong>the</strong> high variability in rainfall and run<strong>of</strong>f.<br />
Data requirements to improve <strong>the</strong> analyses<br />
i) time series <strong>of</strong> water levels measured in <strong>the</strong> lake<br />
ii) any additional data on inflows into <strong>the</strong> lake – in particular <strong>the</strong> data record for <strong>the</strong><br />
Bubu at <strong>Bahi</strong><br />
iii) a water-level volume relationship for <strong>the</strong> lake<br />
iv) estimates <strong>of</strong> variation in <strong>the</strong> areal coverage <strong>of</strong> open water as <strong>the</strong> lake fills and dries<br />
and differences between years - from image analysis<br />
References<br />
Department <strong>of</strong> Irrigation and <strong>Technical</strong> Services (2004). Sustainable development and<br />
management <strong>of</strong> <strong>wetland</strong>s. A case study <strong>of</strong> <strong>Bahi</strong> <strong>wetland</strong> – <strong>Tanzania</strong>. Ministry <strong>of</strong> Agricuture and<br />
Food Security, Dar Es Salaam, <strong>Tanzania</strong>. 61 pp.<br />
Government <strong>of</strong> <strong>Tanzania</strong> 1967. Geological Map sheet 142. Mineral resources Division Dodoma.<br />
Survey <strong>of</strong> <strong>the</strong> Ministry <strong>of</strong> Lands, Settlement and Water Development, Dar Es Salaam, <strong>Tanzania</strong>.<br />
Machibya, M. and Mdemu, M. 2005. Comparison assessment <strong>of</strong> water use and damage between<br />
modern and traditional rice irrigation schemes: case <strong>of</strong> Usangu Basin, <strong>Tanzania</strong>. International<br />
Journal <strong>of</strong> Environmental Research and Public Health 2, 335-342.<br />
Yanda, P.Z, Majule, A.E. and Mwakaje, A.G. 2007. Wetland utilization, poverty alleviation and<br />
environmental conservation in semi-arid areas <strong>of</strong> <strong>Tanzania</strong> – <strong>the</strong> case <strong>of</strong> Singida and Dodoma<br />
regions.<br />
8