Benchmarking Asian Microfinance 2005 - Microfinance Information ...
Benchmarking Asian Microfinance 2005 - Microfinance Information ...
Benchmarking Asian Microfinance 2005 - Microfinance Information ...

You also want an ePaper? Increase the reach of your titles
YUMPU automatically turns print PDFs into web optimized ePapers that Google loves.
<strong>Microfinance</strong> <strong>Information</strong> eXchange<br />
<strong>Benchmarking</strong> <strong>Asian</strong><br />
<strong>Microfinance</strong> <strong>2005</strong><br />
<br />
A report from the <strong>Microfinance</strong> <strong>Information</strong> eXchange, Inc. November 2006<br />
In Brief<br />
<strong>Asian</strong> microfinance stands at the leading edge of<br />
the industry’s global drive to expand financial sector<br />
inclusion. According to the <strong>2005</strong> global survey of 446<br />
microfinance institutions (MFIs) conducted by the<br />
<strong>Microfinance</strong> <strong>Information</strong> Exchange, Inc. (MIX), <strong>Asian</strong><br />
institutions managed over 4 billion dollars in loans and<br />
served an impressive 22.5 million borrowers. While <strong>Asian</strong><br />
institutions included here represent less than one fourth of<br />
the total global data set, they serve over two thirds of the<br />
total borrowers. Four colossal microfinance institutions<br />
take the limelight with an average outreach of four million<br />
borrowers each. These <strong>Asian</strong> giants – Grameen Bank, ASA,<br />
BRAC and BRI – stand unrivaled in scale of service.<br />
Wide disparities in operating environments limit overarching<br />
conclusions on the performance of the sector, but as more<br />
institutions commit themselves to financial transparency,<br />
Table of Contents<br />
In Brief 1<br />
Analysis 1<br />
Scale and Outreach 1<br />
Financial Structure 3<br />
Profitability 4<br />
Conclusion 7<br />
Data and Data Preparation 8<br />
Indicator Definitions 9<br />
Asia Tables 10<br />
common threads begin to emerge. This year’s sample of<br />
101 <strong>Asian</strong> institutions in the MicroBanking Bulletin (MBB)<br />
presents the richest data set as yet compiled on the sector<br />
and begins to weave a tapestry of the sector’s performance,<br />
providing unprecedented insight into the opportunities and<br />
challenges facing <strong>Asian</strong> microfinance today.<br />
Access to a large pool of external funds has proved a doubleedged<br />
sword for <strong>Asian</strong> institutions, fueling their rapidly<br />
growing portfolios, while requiring specific strategies for<br />
maintaining profits. In response to drastically different<br />
operating environments, institutions pursue two separate<br />
courses as they vie for profitability, with some boosting<br />
revenues and others minimizing costs, all the while remaining<br />
focused on the lower segment of the microfinance market.<br />
By examining regional performance through the global<br />
lens and exploring trends across the sector, <strong>Benchmarking</strong><br />
<strong>Asian</strong> <strong>Microfinance</strong> <strong>2005</strong> bring to light the particularities<br />
of <strong>Asian</strong> microfinance in <strong>2005</strong>.<br />
Analysis<br />
Scale and Outreach<br />
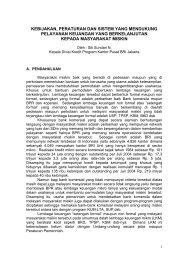
This year’s class of <strong>Asian</strong> MBB participants covers 10<br />
million more clients than in 2004 – testament to both<br />
rapid growth among existing participants and the spread<br />
of financial transparency to an increasing number of<br />
institutions. Excluding borrowers added by new entrants,<br />
large and giant scale MFIs accounted for over 80 percent of<br />
growth in outreach. Leveraging their immense structures,<br />
these institutions expanded their ranks by 2.3 million<br />
borrowers over the course of the year and set themselves<br />
further apart from their peers, as Figure 1 clearly illustrates.<br />
<strong>Microfinance</strong> <strong>Information</strong> Exchange, Inc.
<strong>Benchmarking</strong> <strong>Asian</strong> <strong>Microfinance</strong> <strong>2005</strong><br />
Figure 1<br />
Giant<br />
Large<br />
Medium<br />
Growth in active borrowers by scale<br />
none of them concentrates large MFIs like Bangladesh<br />
and, increasingly, India. The latter’s transforming class of<br />
non-bank finance companies is growing at an exceptional<br />
rate, averaging over 100 percent growth over the year and<br />
driving median outreach for the country past the 100,000<br />
mark, all while remaining resolutely focused on a core<br />
client group of poor women.<br />
Small<br />
0 100 200 300 400 500 600 700 800 900<br />
2004 <strong>2005</strong><br />
Number of Active Borrowers ('000)<br />
Source: <strong>Microfinance</strong> <strong>Information</strong> Exchange, Inc., 2004-05<br />
Benchmarks. Results are peer group medians and draw from<br />
panel data for MFIs in both years’ data sets.<br />
While remarkable, these results should be tempered in light<br />
of widely acknowledged client overlap in hotly contested<br />
markets. Product rigidity within some <strong>Asian</strong> markets<br />
pushes clients to take simultaneous loans from multiple<br />
MFIs to meet their credit needs, artificially inflating<br />
outreach measures. Without market-wide infrastructure<br />
for tracking clients and in the absence of credit bureaus,<br />
Asia’s true outreach eludes analysis.<br />
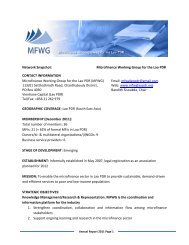
Regional figures mask considerable differences across<br />
countries. Median outreach ranges from under 10,000<br />
borrowers in the Philippines to a whopping 330,000 in<br />
Bangladesh. The latter holds the largest concentration of<br />
large scale microfinance service providers, though India is<br />
fast on its heels, as Figure 2 indicates. While all other markets<br />
in the region are host to at least one large scale institution,<br />
The proliferation of Grameen replicators lies at the heart of<br />
the region’s tremendous expansion, together with the self help<br />
group revolution that is bringing financial services to poor<br />
and excluded clients at a lightning-fast rate. Diversification<br />
of services, however, has generally failed to keep pace<br />
with developments in outreach. Except for India, where<br />
institutions have begun to experiment with microinsurance,<br />
and the Philippines, where rural banks mobilize significant<br />
deposits from the public, <strong>Asian</strong> microfinance providers<br />
maintain the most single-minded focus on microcredit.<br />
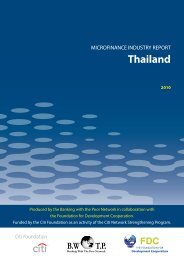
Yet with this single service, <strong>Asian</strong> microfinance targets<br />
some of the most vulnerable populations in the world<br />
and attains unparalleled depth of outreach. On the whole,<br />
the region’s portfolio consists of tiny loans held almost<br />
exclusively in the hands of women. At just 115 dollars,<br />
the average loan balance managed by <strong>Asian</strong> MFIs is the<br />
lowest among all regions and amounts to barely one<br />
fifth of local income. With the exception of Cambodia,<br />
where institutions offer loans of various amounts and<br />
serve different market segments, average loan balances<br />
stay below one fourth of local income. As shown in<br />
Figure 3, Asia’s depth of outreach is only matched by the<br />
Arab sector, where solidarity groups also dominate.<br />
Figure 2<br />
Outreach by country<br />
350,000<br />
300,000<br />
250,000<br />
200,000<br />
150,000<br />
100,000<br />
50,000<br />
0<br />
Bangladesh Cambodia Pakistan Philippines India 2004 India <strong>2005</strong><br />
Number of Active Borrowers<br />
Source: <strong>Microfinance</strong> <strong>Information</strong> Exchange, Inc., <strong>2005</strong> Benchmarks. All observations are medians. India<br />
observations draw from panel data for MFIs in 2004-05 Benchmarks.<br />
November 2006<br />
<strong>Microfinance</strong> <strong>Information</strong> Exchange, Inc.
<strong>Benchmarking</strong> <strong>Asian</strong> <strong>Microfinance</strong> <strong>2005</strong><br />
<br />
Figure 3<br />
Depth of outreach<br />
1<br />
0.8<br />
0.6<br />
0.4<br />
0.2<br />
0<br />
Asia<br />
Middle East and<br />
North Africa<br />
Latin America<br />
and Caribbean<br />
Average Loan Balance/ GNI per Capita<br />
Eastern Europe<br />
and Central Asia<br />
Africa<br />
Percent of Women Borrowers<br />
Source: <strong>Microfinance</strong> <strong>Information</strong> Exchange, Inc., <strong>2005</strong> Benchmarks. All observations are medians.<br />
Financing Structure<br />
Over the course of the year, <strong>Asian</strong> microfinance drew<br />
heavily on external funds to fuel its expansion. Savings<br />
mobilization across East Asia and easy access to borrowings<br />
in other markets leveraged institutional capital four times,<br />
surpassing global norms and topping all other sectors.<br />
While still funding a significant share of its portfolio from<br />
subsidized sources, <strong>Asian</strong> microfinance presents one of the<br />
strongest mixes of commercial funding and matches global<br />
norms of just under two thirds of the portfolio. Figure 4<br />
shows that as Philippine and Indian MFIs dominate the<br />
commercialization wave, regulated institutions across the<br />
region are unhampered by country funding patterns and<br />
attract the bulk of debt financing.<br />
Within Asia, India and the Philippines lead in leverage.<br />
Philippine rural banks source over 100 percent of their funds<br />
for on-lending from commercially priced debt, principally<br />
raised from customer deposits. Indian MFIs, on the other<br />
hand, secure enormous quantities of debt in borrowings<br />
as they are prohibited from mobilizing savings. Growing<br />
investor confidence, combined with central bank directives<br />
Figure 4<br />
Modes of financing across Asia<br />
120%<br />
100%<br />
80%<br />
60%<br />
40%<br />
20%<br />
0%<br />
Asia Bank Non-Bank<br />
Financial<br />
Institution<br />
NGO Rural Bank Bangladesh India Philippines Financial<br />
Self<br />
Sufficiency<br />
Non<br />
Financial<br />
Self<br />
Sufficiency<br />
Capital/ Asset Ratio Commercial Funding Liabilities Ratio Deposits to Loans<br />
Source: <strong>Microfinance</strong> <strong>Information</strong> Exchange, Inc., <strong>2005</strong> Benchmarks. Results are peer group medians.<br />
November 2006<br />
<strong>Microfinance</strong> <strong>Information</strong> Exchange, Inc.
<strong>Benchmarking</strong> <strong>Asian</strong> <strong>Microfinance</strong> <strong>2005</strong><br />
on priority sector lending, has led to a surge of commercial<br />
funds for microfinance in the country. On- and off-balance<br />
sheet financing – through servicing arrangements with<br />
banks – makes Indian microfinance providers some of the<br />
most highly leveraged institutions globally; at the end of<br />
<strong>2005</strong>, they serviced 12 times as much debt as capital.<br />
Across the region, registered entities concentrate the wealth<br />
of commercial funding. Though they vary in levels of<br />
funding, <strong>Asian</strong> banks and rural banks finance the majority<br />
of their portfolios with commercial debt – 97 percent for<br />
the former and over 100 percent for the latter. Facing<br />
fewer legal constraints than other types of institutions,<br />
these two groups mobilized significant customer deposits<br />
as part of this financing. Indeed, banks drew on customer<br />
deposits for one third of their loan portfolio while rural<br />
banks mobilized almost the totality of disbursed funds in<br />
savings. While non-bank finance institutions generally lack<br />
access to public deposits, they are quickly following suit on<br />
the commercialization front, raising access to commercial<br />
debt by 34 percent between 2004 and <strong>2005</strong> to just under<br />
half of the portfolio at the close of the year.<br />
Only NGOs lag in access to commercial markets as they<br />
continue to rely on soft funds from public entities. Yet even<br />
this group has grown more leveraged and commercialized.<br />
<strong>2005</strong> marked a watershed year in commercialization for the<br />
Bangladeshi market, composed almost entirely of NGOs.<br />
While remaining heavily dependent on compulsory<br />
savings and soft loans from the apex body PKSF, the sector<br />
has begun to experiment with voluntary savings services<br />
and is increasingly turning to commercial banks for funds,<br />
boosting commercial financing by over 40 percent since<br />
2004 to one fifth of the portfolio in <strong>2005</strong>.<br />
As institutions increasingly dip into capital markets for<br />
their financing, building a strong capital base becomes all<br />
the more important to ensure that they are able to meet<br />
their debt obligations without cutting back operations. But<br />
with generally slim returns, many <strong>Asian</strong> institutions fail to<br />
build up institutional capital and are leveraged well beyond<br />
international capital adequacy standards. This is especially<br />
true among banks and Indian non bank finance companies.<br />
While this level of leverage may sound alarms in the formal<br />
financial sector, the presence of soft loans and government<br />
intervention in the microfinance industry, coupled with<br />
access to off-balance sheet financing, may mean that the real<br />
level of risk is somewhat mitigated. Nonetheless, the region’s<br />
high reliance on debt raises financial costs and trims profits.<br />
Profitability<br />
With the average asset base yielding just 0.7 percent in<br />
losses, <strong>Asian</strong> microfinance is on the verge of breaking<br />
even. MFIs across the region ended <strong>2005</strong> largely at or<br />
near profitability, as indicated by Figure 5. Half of the<br />
institutions in the sample are financially self-sufficient,<br />
while another quarter covers at least four fifths of costs on<br />
an adjusted basis. While overall cost and revenue indicators<br />
for <strong>Asian</strong> MFIs are broadly similar to other regions, Asia’s<br />
Figure 5<br />
Distribution of Adjusted Return on Assets<br />
16<br />
Pakistan Philippines India Bangladesh/Cambodia<br />
Number of MFIs<br />
14<br />
12<br />
10<br />
8<br />
6<br />
4<br />
2<br />
0<br />
> -15% -13% -11% -9% -7% -5% -3% -1% 1% 3% 5% > 5%<br />
Source: <strong>Microfinance</strong> <strong>Information</strong> Exchange, Inc., <strong>2005</strong> Benchmarks. Observations are for individual MFIs and represent the<br />
10th through 90th percentiles. Dark lines indicate placement of country median within the regional distribution.<br />
November 2006<br />
<strong>Microfinance</strong> <strong>Information</strong> Exchange, Inc.
<strong>Benchmarking</strong> <strong>Asian</strong> <strong>Microfinance</strong> <strong>2005</strong><br />
<br />
comparatively greater dependence on external debt–<br />
subsidized and commercial – brings a higher blended cost<br />
of funds that strips much of its profitability.<br />
In the quest for profits, <strong>Asian</strong> MFIs align themselves<br />
along one of two competing strategies. As South <strong>Asian</strong><br />
institutions rein in costs to offset their slender yields, East<br />
<strong>Asian</strong> MFIs set higher prices to overcome more costly<br />
operating environments. At 20 percent of assets, South<br />
<strong>Asian</strong> MFIs incurred just two thirds of total expenses faced<br />
by their East <strong>Asian</strong> peers and were able to charge half as<br />
much on their loans, generating lower revenue streams<br />
that nonetheless brought them within one percent of<br />
profitability. While East Asia’s high cost, high yield track<br />
proved slightly more successful, returns across the subregion<br />
were still precarious and, at 0.2 percent, have yet<br />
to be solidified.<br />
As Figure 6 illustrates, Bangladesh and India are<br />
prime examples of the low cost, low yield strategy that<br />
characterizes South Asia, while Cambodia and the<br />
Philippines reflect the high yield strategy that is prevalent<br />
across East Asia. All four sectors generate sufficient yields<br />
to cover the direct costs of managing their portfolios.<br />
Dense markets like India and Bangladesh show clear<br />
advantages over more dispersed markets in Cambodia<br />
or the Philippines. Median costs per dollar outstanding<br />
hover below 15 percent for the denser markets, reflecting<br />
both higher productivity and lower labor costs. As a result,<br />
Indian and Bangladeshi MFIs charge a median 25 percent<br />
or less on their loan portfolio, while Cambodian and<br />
Philippine institutions need between 35 and 45 percent<br />
to cover operating costs. The Philippine market shows an<br />
interesting bifurcation, with NGOs clearly set on high<br />
cost, high yield curves but banks lying somewhere in<br />
the middle between the two strategies. In the end, both<br />
groups show similar average performance.<br />
Pakistan offers a different picture, with trailing revenues<br />
driving down returns and many of its service providers<br />
at the lower end of the regional returns spectrum. Local<br />
institutions offer some of the most costly services of any<br />
market, both per dollar outstanding and per client served.<br />
A concentration of young and start-up MFIs in the<br />
country accentuates the cost structure as institutions build<br />
staff capacity and learn to optimize the use of resources.<br />
While improving operational efficiencies will help boost<br />
MFIs towards positive returns, they are unlikely to clear<br />
the profitability hurdle without adjusting their interest rate<br />
structure. At 22 percent, portfolio yields are among the<br />
lowest of any region and cannot cover operating costs, let<br />
alone financial and provisioning expenses. Currently, lack<br />
of management buy-in to setting higher prices presents<br />
the principal obstacle to sustainability. Pakistani MFIs will<br />
have to renounce the prevalent view of microfinance as a<br />
charitable activity and recognize the importance of charging<br />
cost-recovery rates to maintain operations and ensure that<br />
clients have access to reliable financial services.<br />
Markets across the globe show an inextricable link<br />
between sustainability and outreach, and Asia is no<br />
exception to this trend. Well managed, profitable MFIs<br />
across the region generally enjoy greater access to debt<br />
markets than their loss-making peers and are able to<br />
Figure 6<br />
45%<br />
40%<br />
35%<br />
30%<br />
25%<br />
20%<br />
15%<br />
10%<br />
5%<br />
0%<br />
Comparison of Yields and Costs on the Loan Portfolio<br />
Asia Bangladesh Cambodia India Pakistan Philippines Financial<br />
Self<br />
Sufficiency<br />
Spreads of yield over operating expenses (shading indicates loss)<br />
Non<br />
Financial<br />
Self<br />
Sufficiency<br />
Source: <strong>Microfinance</strong> <strong>Information</strong> Exchange, Inc., <strong>2005</strong> Benchmarks. Results are peer group medians.<br />
November 2006<br />
<strong>Microfinance</strong> <strong>Information</strong> Exchange, Inc.
<strong>Benchmarking</strong> <strong>Asian</strong> <strong>Microfinance</strong> <strong>2005</strong><br />
quickly and efficiently channel these funds into their<br />
loan portfolios, extending services to increasingly more<br />
borrowers. Institutions that broke the profitability<br />
barrier in 2004 boosted their median outreach by 28<br />
percent to over 60,000 borrowers – four times as many<br />
as those reached by their unsustainable peers. Figure<br />
7 indicates that with the exception of Pakistan, the<br />
majority of borrowers in MIX’s sample and across Asia<br />
had access to sustainable financial services. Defying<br />
global trends, two unsustainable Pakistani institutions<br />
ranked among the ten fastest-growing MFIs within the<br />
region, indicating that some funders may be turning a<br />
blind eye to operating losses in order to boost immediate<br />
outreach. The evidence to date clearly demonstrates that<br />
building long-lasting, inclusive financial systems for the<br />
poor, gains most from profitable institutions that will be<br />
able to maintain quality service and continue to push the<br />
outreach envelope even when donor funds dry out.<br />
As profitability boosts outreach, institutional scale<br />
feeds back into profits through greater efficiency and<br />
superior staff productivity, creating a virtuous circle that<br />
continuously fuels outreach. Figure 8 vividly depicts the<br />
marked gains in efficiency realized by <strong>Asian</strong> MFIs that<br />
cross the threshold of two million dollars in assets. The<br />
cost of managing one dollar in loans drops from 38 to just<br />
22 cents, suggesting that the very tiny service providers<br />
do not have the scale to reach clients profitably. Gains in<br />
efficiency taper off after the eight million dollar mark but<br />
take off again at the next level. MFI giants in Asia with over<br />
15 million dollars in loans continue to reap the benefits of<br />
economies of scale and spend one third as much as their<br />
large counterparts per client reached.<br />
The gains from scale appear to be largest for banks and<br />
NGO microfinance providers. As NGOs increase in scale,<br />
expenses drop significantly and provide a much needed<br />
Figure 7<br />
Sustainability and Outreach<br />
100%<br />
80%<br />
60%<br />
40%<br />
20%<br />
0%<br />
Asia Bangladesh Cambodia India Pakistan Philippines<br />
Borrowers served by sustainable MFIs<br />
Borrowers served by unsustainable MFIs<br />
Source: <strong>Microfinance</strong> <strong>Information</strong> Exchange, Inc., <strong>2005</strong> Benchmarks. Results are aggregates.<br />
Figure 8<br />
Efficiency and Productivity by Scale<br />
40%<br />
32%<br />
24%<br />
16%<br />
8%<br />
0%<br />
Small Medium Large Giant<br />
Operating Expense / Loan Portfolio<br />
Borrowers per Staff Member<br />
200<br />
160<br />
120<br />
80<br />
40<br />
0<br />
Source: <strong>Microfinance</strong> <strong>Information</strong> Exchange, Inc., <strong>2005</strong> Benchmarks. Results are peer group medians.<br />
November 2006<br />
<strong>Microfinance</strong> <strong>Information</strong> Exchange, Inc.
<strong>Benchmarking</strong> <strong>Asian</strong> <strong>Microfinance</strong> <strong>2005</strong><br />
<br />
break that drives many of these institutions across the<br />
profitability threshold. As Figure 9 illustrates, NGOs<br />
within the region trump all other groups with their high<br />
operating costs. These MFIs spend one third more than<br />
non bank finance institutions on their operations and<br />
two thirds more than rural banks. The exceptionally low<br />
loan balances that make up their portfolios prove costly<br />
to manage, incurring 29 cents in operating expenses for<br />
every dollar lent. Boosting scale emerges as a natural<br />
solution for attaining efficiency gains and improving<br />
NGO financial performance.<br />
Clients also benefit from efficiency gains in the form of<br />
lower interest rates. Portfolio yields plummet by twenty<br />
percentage points as MFIs grow their portfolios from small<br />
to large scale. Despite declining revenues, returns increase<br />
with scale as large institutions maintain excellent portfolio<br />
quality and invest a higher share of assets in their lending<br />
activities. As Indian non bank finance institutions rapidly<br />
scaled up outreach, the sector witnessed the largest decline<br />
in interest rates, with yields on the portfolio dropping by<br />
three percentage points – from 31 to 28 percent. Rates<br />
among Pakistani MFIs, on the other hand, showed a<br />
slight increase, improving the outlook for sustainability<br />
within the sector.<br />
Conclusion<br />
Asia’s achievements in outreach are dazzling by all accounts,<br />
and while a large fraction of the population remains excluded<br />
from financial services, the region is well positioned to<br />
rapidly expand outreach to these under-served groups. As<br />
more institutions begin disclosing standard performance<br />
data, the sector provides an increasing number of examples<br />
– spanning almost every market – of MFIs that are<br />
attaining great scale and breaking the profitability barrier,<br />
through world-class efficiency and appropriate product<br />
pricing. Vigorous growth among these institutions extends<br />
sustainable services to an increasing number of clients and<br />
brings them ever-closer to financial integration.<br />
But profitability has yet to fully make its mark on the region<br />
as certain markets are still subject to cultural and political<br />
taboos around interest rates, dampening MFI growth and<br />
limiting potential outreach. Growing evidence suggests that<br />
new technology and innovation in delivery mechanisms,<br />
combined with increasing competition, are most likely to<br />
push down ultimate prices to clients – without sacrificing<br />
outreach. Both within countries and across the region,<br />
institutions differ in their degree of self-conception as<br />
development programs or financial institutions broadening<br />
access for underserved populations. In many cases there<br />
is a perceived tradeoff between the measures necessary<br />
for financial sustainability and outreach. By looking at<br />
standardized performance data from a wide range of<br />
institutions, we can better begin to analyze the impact of<br />
institutional structure, country environment and other<br />
factors on the success of microfinance institutions.<br />
Scott Gaul, Analyst, East Asia and the Pacific<br />
Blaine Stephens, Director of Analysis<br />
Hind Tazi, Analyst, South Asia<br />
Figure 9<br />
Breaking Down Return on Assets<br />
30%<br />
25%<br />
20%<br />
15%<br />
10%<br />
5%<br />
0%<br />
Asia Bank Rural Bank Non-Bank<br />
Financial<br />
Institution<br />
Non<br />
Governmental<br />
Organization<br />
Source: <strong>Microfinance</strong> <strong>Information</strong> Exchange, Inc., <strong>2005</strong> Benchmarks. Results are peer group medians.<br />
Financial<br />
Self<br />
Sufficiency<br />
Non Financial<br />
Self<br />
Sufficiency<br />
Operating Expense Ratio Loan Loss Provision Expense Ratio Financial Expense Ratio Financial Revenue Ratio<br />
November 2006<br />
<strong>Microfinance</strong> <strong>Information</strong> Exchange, Inc.
<strong>Benchmarking</strong> <strong>Asian</strong> <strong>Microfinance</strong> <strong>2005</strong><br />
Data and Data Preparation<br />
For benchmarking purposes, MIX collects and prepares<br />
MFI financial and outreach data according to international<br />
microfinance reporting standards as applied in the<br />
MicroBanking Bulletin. Raw data are collected from the MFI,<br />
inputted into standard reporting formats and crosschecked<br />
with audited financial statements, ratings and other third<br />
party due diligence reports, as available. Performance results<br />
are then adjusted, using industry standard adjustments,<br />
to eliminate subsidy, guarantee minimal provisioning for<br />
risk and reflect the impact of inflation on institutional<br />
performance. This process increases comparability of<br />
performance results across institutions.<br />
MIX thanks all institutions participating in the <strong>2005</strong><br />
industry benchmarks and extends its gratitude to the<br />
following partners for facilitating data collection: Centre<br />
for Micro Finance in Nepal, Pakistan <strong>Microfinance</strong><br />
Network, <strong>Microfinance</strong> Council of the Philippines, Inc,<br />
and the Microenterprise Access to Banking Services<br />
program in the Philippines.<br />
Asia MFI Participants<br />
<strong>2005</strong> Benchmarks (101 MFIs)<br />
2004-<strong>2005</strong> Balanced Panel Data (52 MFIs) names in italics<br />
ABS-CBN (Philippines), ACLEDA (Cambodia), AMK (Cambodia), AMRET (Cambodia), ARMP (Afghanistan), ASA (Bangladesh), Asasah (Pakistan), ASHI (Philippines), Bandhan<br />
(India), Bank of Khyber (Pakistan), BASIX - Samruddhi (India), BISWA (India), BRAC (Bangladesh), BRAC - AFG (Afghanistan), BRI (Indonesia), BSS (India), BURO (Bangladesh),<br />
CARD NGO (Philippines), CARD RB (Philippines), Cashpor MC (India), CBB (Nepal), CCT (Philippines), CEB (Cambodia), CEP (Vietnam), CEVI (Philippines), CMEDFI (Philippines),<br />
CREDIT (Cambodia), DAMEN (Pakistan), DD Bank (Nepal), ECLOF - PHL (Philippines), ESAF (India), FCBFI (Philippines), FICO (Philippines), First Valley Bank (Philippines), FMFB<br />
- AFG (Afghanistan), FMFB - PAK (Pakistan), G7 Bank (Philippines), Ganesha (Indonesia), Grama Vidiyal (India), Grameen Bank (Bangladesh), Grameen Koota (India), Green<br />
Bank (Philippines), HKL (Cambodia), IASC (India), IDF (Bangladesh), JCF (Bangladesh), JVOFI (Philippines), Kasagana-Ka (Philippines), Kashf (Pakistan), Kazama Grameen<br />
(Philippines), Khushhali (Pakistan), KMBI (Philippines), MEDF (Philippines), MGBB (Nepal), Milamdec (Philippines), Nirdhan (Nepal), NMFB (Pakistan), Norfil Foundation,<br />
Inc. (Philippines), NWTF (Philippines), OMB (Philippines), PALFSI (Philippines), Parwaz (Afghanistan), PGBB (Nepal), PMDF (Philippines), Prasac (Cambodia), RB Bukidnon<br />
(Philippines), RB Cantilan (Philippines), RB Century (Philippines), RB Cotabato (Philippines), RB Digos (Philippines), RB Kabayan (Philippines), RB Lebak (Philippines), RB Libon<br />
(Philippines), RB Mabitac (Philippines), RB Mabuhay (Philippines), RB Mallig (Philippines), RB Oroquieta (Philippines), RB Santo Tomas (Philippines), RB Solano (Philippines),<br />
RB Talisayan (Philippines), RB Valiant (Philippines), RB Victorias (Philippines), RBMO (Philippines), RDRS (Bangladesh), Rozgar (Pakistan), Sabaragamuwa (Sri Lanka), SAFWCO<br />
(Pakistan), Sarvodaya (India), SEEDS (Sri Lanka), SHARE (India), SKS (India), Spandana (India), SPBD (Samoa), Sungi (Pakistan), TMSS (Bangladesh), TPC (Cambodia), TSKI<br />
(Philippines), TSPI (Philippines), VEF (Philippines), VFC (Cambodia), VWS (India)<br />
Peer Groups Definition Description<br />
Charter Type<br />
FSS<br />
Scale<br />
Countries<br />
Asia Bank (8 MFIs)<br />
Asia Rural Bank (27 MFIs)<br />
Asia NBFI (18 MFIs)<br />
Asia MFIs with Bank charter type<br />
Asia MFIs with Rural Bank charter type<br />
Asia MFIs with Non Bank Financial Intermediary charter type<br />
Asia NGO (47 MFIs)<br />
Asia MFIs with Non Governmental Organization charter type<br />
Asia FSS (51 MFIs) Asia MFIs with Financial Self-sufficiency ratio > 100%<br />
Asia Non FSS (50 MFIs) Asia MFIs with Financial Self-sufficiency ratio < 100%<br />
Asia Small (30 MFIs)<br />
Asia Medium (40 MFIs)<br />
Asia Large (14 MFIs)<br />
Asia Giant (17 MFIs)<br />
Bangladesh (8 MFIs)<br />
Cambodia (9 MFIs)<br />
India (14 MFIs)<br />
Pakistan (10 MFIs)<br />
Philippines (45 MFIs)<br />
Asia MFIs with Loan Portfolio < USD 2 million<br />
Asia MFIs with Loan Portfolio > USD 2 and < USD 8 million<br />
Asia MFIs with Loan Portfolio > USD 8 and < USD 15 million<br />
Asia MFIs with Gross Loan Portfolio > USD 15 million<br />
Asia MFIs from Bangladesh<br />
Asia MFIs from Cambodia<br />
Asia MFIs from India<br />
Asia MFIs from Pakistan<br />
Asia MFIs from Philippines<br />
November 2006<br />
<strong>Microfinance</strong> <strong>Information</strong> Exchange, Inc.
<strong>Benchmarking</strong> <strong>Asian</strong> <strong>Microfinance</strong> <strong>2005</strong><br />
<br />
Indicator Definitions<br />
INSTITUTIONAL CHARACTERISTICS<br />
Number of MFIs<br />
Age<br />
Total Assets<br />
Offices<br />
Personnel<br />
FINANCING STRUCTURE<br />
Capital/ Asset Ratio<br />
Commercial Funding Liabilities Ratio<br />
Debt/ Equity Ratio<br />
Deposits to Loans<br />
Deposits to Total Assets<br />
Gross Loan Portfolio/ Total Assets<br />
OUTREACH INDICATORS<br />
Number of Active Borrowers<br />
Percent of Women Borrowers<br />
Number of Loans Outstanding<br />
Gross Loan Portfolio<br />
Average Loan Balance per Borrower<br />
Average Loan Balance per Borrower/ GNI per Capita<br />
Average Outstanding Balance<br />
Average Outstanding Balance/ GNI per Capita<br />
Number of Voluntary Savers<br />
Number of Voluntary Savings Accounts<br />
Voluntary Savings<br />
Average Savings Balance per Saver<br />
Average Savings Account Balance<br />
MACROECONOMIC INDICATORS<br />
GNI per Capita<br />
US Dollars<br />
GDP Growth Rate<br />
Annual Average<br />
Deposit Rate %<br />
Inflation Rate %<br />
Financial Depth<br />
M3/ GDP<br />
OVERALL FINANCIAL PERFORMANCE<br />
Return on Assets<br />
Return on Equity<br />
Operational Self-Sufficiency<br />
Financial Self-Sufficiency<br />
REVENUES<br />
Financial Revenue Ratio<br />
Profit Margin<br />
Yield on Gross Portfolio (nominal)<br />
Yield on Gross Portfolio (real)<br />
EXPENSES<br />
Total Expense Ratio<br />
Financial Expense Ratio<br />
Loan Loss Provision Expense Ratio<br />
Operating Expense Ratio<br />
Personnel Expense Ratio<br />
Administrative Expense Ratio<br />
Adjustment Expense Ratio<br />
EFFICIENCY<br />
Operating Expense/ Loan Portfolio<br />
Personnel Expense/ Loan Portfolio<br />
Average Salary/ GNI per Capita<br />
Cost per Borrower<br />
Cost per Loan<br />
PRODUCTIVITY<br />
Borrowers per Staff Member<br />
Loans per Staff Member<br />
Borrowers per Loan Officer<br />
Loans per Loan Officer<br />
Voluntary Savers per Staff Member<br />
Savings Accounts per Staff Member<br />
Personnel Allocation Ratio<br />
RISK AND LIQUIDITY<br />
Portfolio at Risk > 30 Days<br />
Portfolio at Risk > 90 Days<br />
Write-off Ratio<br />
Loan Loss Rate<br />
Risk Coverage<br />
Non-earning Liquid Assets as % Total Assets<br />
Current Ratio<br />
Sample size of group<br />
Years functioning as an MFI<br />
Total Assets, adjusted for Inflation and standardized loan portfolio provisioning and write-offs<br />
Number, including head office<br />
Total number of employees<br />
Adjusted Total Equity/ Adjusted Total Assets<br />
All liabilities with “market” price/ Adjusted Gross Loan Portfolio<br />
Adjusted Total Liabilities/ Adjusted Total Equity<br />
Voluntary Savings/ Adjusted Gross Loan Portfolio<br />
Voluntary Savings/ Adjusted Total Assets<br />
Adjusted Gross Loan Portfolio/ Adjusted Total Assets<br />
Number of borrowers with loans outstanding, adjusted for standardized write-offs<br />
Number of active women borrowers/ Adjusted Number of Active Borrowers<br />
Number of loans outstanding, adjusted for standardized write-offs<br />
Gross Loan Portfolio, adjusted for standardized write-offs<br />
Adjusted Gross Loan Portfolio/ Adjusted Number of Active Borrowers<br />
Adjusted Average Loan Balance per Borrower/ GNI per Capita<br />
Adjusted Gross Loan Portfolio/ Adjusted Number of Loans Outstanding<br />
Adjusted Average Outstanding Balance/ GNI per Capita<br />
Number of savers with voluntary savings demand deposit and time deposit accounts<br />
Number of voluntary savings demand deposit and time deposit accounts<br />
Total value of voluntary savings demand deposit and time deposit accounts<br />
Voluntary Savings/ Number of Voluntary Savers<br />
Voluntary Savings/ Number of Voluntary Savings Accounts<br />
Adjusted Net Operating Income, net of taxes/ Adjusted Average Total Assets<br />
Adjusted Net Operating Income, net of taxes/ Adjusted Average Total Equity<br />
Financial Revenue/ (Financial Expense + Net Loan Loss Provision Expense + Operating Expense)<br />
Adjusted Financial Revenue/ Adjusted (Financial Expense + Net Loan Loss Provision Expense + Operating Expense)<br />
Adjusted Financial Revenue/ Adjusted Average Total Assets<br />
Adjusted Net Operating Income/ Adjusted Financial Revenue<br />
Adjusted Financial Revenue from Loan Portfolio/ Adjusted Average Gross Loan Portfolio<br />
(Adjusted Yield on Gross Portfolio (nominal) - Inflation Rate)/ (1 + Inflation Rate)<br />
Adjusted (Financial Expense + Net Loan Loss Provision Expense + Operating Expense)/ Adjusted Average Total Assets<br />
Adjusted Financial Expense/ Adjusted Average Total Assets<br />
Adjusted Net Loan Loss Provision Expense/ Adjusted Average Total Assets<br />
Adjusted Operating Expense/ Adjusted Average Total Assets<br />
Adjusted Personnel Expense/ Adjusted Average Total Assets<br />
Adjusted Administrative Expense/ Adjusted Average Total Assets<br />
(Adjusted Net Operating Income - Unadjusted Net Operating Income)/ Adjusted Average Total Assets<br />
Adjusted Operating Expense/ Adjusted Average Gross Loan Portfolio<br />
Adjusted Personnel Expense/ Adjusted Average Gross Loan Portfolio<br />
Adjusted Average Personnel Expense/ GNI per capita<br />
Adjusted Operating Expense/ Adjusted Average Number of Active Borrowers<br />
Adjusted Operating Expense/ Adjusted Average Number of Loans<br />
Adjusted Number of Active Borrowers/ Number of Personnel<br />
Adjusted Number of Loans Outstanding/ Number of Personnel<br />
Adjusted Number of Active Borrowers/ Number of Loan Officers<br />
Adjusted Number of Loans Outstanding/ Number of Loan Officers<br />
Number of Voluntary Savers/ Number of Personnel<br />
Number of Saving Accounts/ Number of Personnel<br />
Number of Loan Officers/ Number of Personnel<br />
Outstanding balance, loans overdue> 30 Days/ Adjusted Gross Loan Portfolio<br />
Outstanding balance, loans overdue> 90 Days/ Adjusted Gross Loan Portfolio<br />
Value of loans written-off/ Adjusted Average Gross Loan Portfolio<br />
Adjusted Write-offs, net of recoveries/ Adjusted Average Gross Loan Portfolio<br />
Adjusted Loan Loss Reserve/ PAR > 30 Days<br />
Adjusted Cash and banks/ Adjusted Total Assets<br />
Short Term Assets/ Short Term Liabilities<br />
November 2006<br />
<strong>Microfinance</strong> <strong>Information</strong> Exchange, Inc.
10<br />
<strong>Benchmarking</strong> <strong>Asian</strong> <strong>Microfinance</strong> <strong>2005</strong><br />
Asia<br />
INSTITUTIONAL CHARACTERISTICS<br />
Charter Type<br />
Country<br />
Asia Bank NBFI NGO Rural Bank Bangladesh Cambodia<br />
Number of MFIs 101 8 18 47 27 8 9<br />
Age 11 11 10 9 32 16 10<br />
Total Assets 6,579,511 31,720,370 13,292,508 4,361,128 4,939,946 30,551,444 5,114,353<br />
Offices 15 47 38 24 6 248 15<br />
Personnel 174 283 384 148 83 2,198 191<br />
FINANCING STRUCTURE<br />
Capital/ Asset Ratio 18.6% 5.8% 30.6% 25.1% 12.5% 29.6% 59.7%<br />
Commercial Funding Liabilities Ratio 62.9% 96.9% 48.1% 24.7% 112.5% 19.7% 28.7%<br />
Debt/ Equity Ratio 4.0 4.2 2.3 2.3 7.0 2.4 0.7<br />
Deposits to Loans 1.8% 35.6% 0.0% 0.0% 90.9% 12.8% 0.7%<br />
Deposits to Total Assets 1.2% 22.1% 0.0% 0.0% 64.9% 10.5% 0.6%<br />
Gross Loan Portfolio/ Total Assets 67.6% 63.9% 81.5% 67.4% 65.9% 82.8% 86.5%<br />
OUTREACH INDICATORS<br />
Number of Active Borrowers 18,487 95,002 83,163 18,487 8,224 330,168 36,221<br />
Percent of Women Borrowers 99.0% 56.4% 84.3% 99.9% 97.9% 99.9% 83.0%<br />
Number of Loans Outstanding 19,299 97,333 83,163 24,902 9,188 337,281 36,221<br />
Gross Loan Portfolio 3,961,878 17,917,742 9,757,248 3,653,529 2,883,019 24,033,276 4,426,465<br />
Average Loan Balance per Borrower 115 314 135 83 373 71 136<br />
Average Loan Balance per Borrower/ GNP per Capita 19.4% 52.3% 27.0% 11.1% 42.0% 16.3% 42.5%<br />
Average Outstanding Balance 112 311 135 74 373 70 136<br />
Average Outstanding Balance / GNP per Capita 20.3% 50.4% 27.0% 11.3% 40.8% 16.0% 42.5%<br />
Number of Voluntary Savers 1,430 360 0 0 16,908 56,683 145<br />
Number of Voluntary Savings Accounts 1,686 51,024 0 0 17,146 56,683 145<br />
Voluntary Savings 66,180 14,502,938 0 0 2,744,445 2,867,636 25,536<br />
Average Savings Balance per Saver 92 358 240 12 192 18 232<br />
Average Savings Account Balance 100 356 240 11 189 14 466<br />
MACROECONOMIC INDICATORS<br />
GNP per Capita 620 520 600 620 1,170 440 320<br />
GDP Growth Rate 6.2% 6.0% 6.4% 6.2% 6.2% 5.5% 6.0%<br />
Deposit Rate 5.6% 6.0% 5.8% 5.8% 5.6% 8.1% 1.9%<br />
Inflation Rate 7.6% 8.4% 5.7% 7.6% 7.6% 7.0% 5.7%<br />
Financial Depth 55.5% 43.5% 50.3% 55.5% 55.5% 42.1% 23.6%<br />
OVERALL FINANCIAL PERFORMANCE<br />
Return on Assets -0.7% -1.0% -3.1% 0.6% -0.9% 2.6% 2.6%<br />
Return on Equity -1.4% -3.9% -6.4% 7.0% -6.8% 10.6% 5.6%<br />
Operational Self-Sufficiency 109.9% 102.7% 106.7% 109.1% 116.6% 131.2% 126.1%<br />
Financial Self-Sufficiency 100.6% 97.5% 91.5% 104.3% 96.4% 113.5% 115.2%<br />
REVENUES<br />
Financial Revenue Ratio 24.1% 14.9% 23.6% 27.2% 21.4% 21.1% 30.3%<br />
Profit Margin 0.6% -2.7% -9.8% 4.1% -3.7% 11.5% 13.2%<br />
Yield on Gross Portfolio (nominal) 30.7% 24.1% 26.5% 35.9% 26.5% 24.8% 37.6%<br />
Yield on Gross Portfolio (real) 21.9% 13.2% 21.3% 26.0% 17.5% 16.6% 30.2%<br />
EXPENSES<br />
Total Expense Ratio 25.6% 18.3% 24.3% 28.9% 21.8% 18.6% 26.3%<br />
Financial Expense Ratio 6.1% 5.8% 7.0% 6.1% 5.1% 6.3% 5.2%<br />
Loan Loss Provision Expense Ratio 1.8% 0.7% 1.3% 1.9% 4.5% 0.8% 0.3%<br />
Operating Expense Ratio 15.1% 8.1% 15.4% 20.1% 11.9% 10.6% 18.6%<br />
Personnel Expense Ratio 7.6% 4.5% 8.0% 10.4% 5.2% 7.5% 11.4%<br />
Administrative Expense Ratio 7.3% 3.6% 6.5% 8.7% 7.1% 3.7% 8.4%<br />
Adjustment Expense Ratio 2.2% 1.5% 3.1% 2.1% 4.0% 2.7% 2.8%<br />
EFFICIENCY<br />
Operating Expense/ Loan Portfolio 22.8% 13.1% 22.9% 29.0% 17.8% 13.5% 22.2%<br />
Personnel Expense/ Loan Portfolio 11.9% 8.7% 13.9% 15.8% 8.3% 9.1% 13.2%<br />
Average Salary/ GNP per Capita 2.8 4.9 5.8 2.4 3.0 2.6 9.2<br />
Cost per Borrower 38 31 28 27 68 9 38<br />
Cost per Loan 31 31 28 22 68 9 38<br />
PRODUCTIVITY<br />
Borrowers per Staff Member 142 170 161 147 97 204 133<br />
Loans per Staff Member 141 176 160 169 94 201 133<br />
Borrowers per Loan Officer 222 265 222 227 151 262 209<br />
Loans per Loan Officer 224 265 239 231 189 285 209<br />
Voluntary Savers per Staff Member 127 107 15 89 186 106 2<br />
Savings Accounts per Staff Member 137 128 15 117 216 106 4<br />
Personnel Allocation Ratio 64.4% 59.5% 64.8% 68.8% 59.3% 70.4% 63.4%<br />
RISK AND LIQUIDITY<br />
Portfolio at Risk> 30 Days 2.8% 2.6% 0.9% 2.4% 7.5% 1.2% 0.6%<br />
Portfolio at Risk> 90 Days 1.2% 1.5% 0.4% 0.7% 5.6% 0.5% 0.2%<br />
Write-off Ratio 2.4% 2.8% 1.6% 1.6% 3.2% 1.5% 0.5%<br />
Loan Loss Rate 2.1% 1.6% 1.5% 1.2% 3.2% 1.1% 0.2%<br />
Risk Coverage 0.8 0.5 0.8 0.9 0.7 3.0 3.9<br />
Non-earning Liquid Assets as a % of Total Assets 10.9% 1.7% 3.2% 10.9% 16.0% 4.9% 4.1%<br />
Current Ratio 1.903 0 0 0 0 0 0<br />
November 2006<br />
<strong>Microfinance</strong> <strong>Information</strong> Exchange, Inc.
<strong>Benchmarking</strong> <strong>Asian</strong> <strong>Microfinance</strong> <strong>2005</strong><br />
11<br />
INSTITUTIONAL CHARACTERISTICS<br />
Country<br />
Scale<br />
India Pakistan Philippines Asia Small Asia Medium Asia Large Asia Giant<br />
Number of MFIs 14 10 45 30 40 14 17<br />
Age 9 7 19 9 12 12 15<br />
Total Assets 11,396,488 2,532,416 3,967,838 1,346,788 6,297,509 13,351,643 49,041,572<br />
Offices 47 16 6 6 12 51 117<br />
Personnel 555 89 108 54 177 574 1,504<br />
FINANCING STRUCTURE<br />
Capital/ Asset Ratio 6.9% 38.9% 17.1% 21.6% 12.7% 28.8% 14.0%<br />
Commercial Funding Liabilities Ratio 75.8% 26.9% 79.0% 48.8% 91.4% 26.8% 59.9%<br />
Debt/ Equity Ratio 12.0 1.1 4.3 3.0 4.8 2.5 6.1<br />
Deposits to Loans 0.0% 0.4% 52.5% 1.9% 1.8% 0.0% 19.9%<br />
Deposits to Total Assets 0.0% 0.3% 34.6% 1.2% 1.3% 0.0% 15.5%<br />
Gross Loan Portfolio/ Total Assets 81.5% 41.6% 65.8% 64.1% 67.7% 81.8% 80.5%<br />
OUTREACH INDICATORS<br />
Number of Active Borrowers 101,158 10,696 8,858 6,380 23,221 105,666 204,341<br />
Percent of Women Borrowers 100.0% 33.1% 98.7% 100.0% 96.9% 99.6% 86.9%<br />
Number of Loans Outstanding 115,740 10,696 8,553 5,931 22,323 116,075 227,172<br />
Gross Loan Portfolio 8,337,637 1,684,216 2,558,787 672,480 3,895,899 10,785,238 32,145,168<br />
Average Loan Balance per Borrower 97 159 201 105 204 94 142<br />
Average Loan Balance per Borrower/ GNP per Capita 15.6% 26.6% 17.1% 10.5% 34.5% 16.1% 19.1%<br />
Average Outstanding Balance 91 144 201 99 170 93 139<br />
Average Outstanding Balance / GNP per Capita 14.7% 24.1% 17.1% 11.5% 36.3% 16.1% 18.6%<br />
Number of Voluntary Savers 0 602 7,282 1,155 3,624 0 31,284<br />
Number of Voluntary Savings Accounts 0 602 7,665 1,220 4,349 0 68,280<br />
Voluntary Savings 0 20,735 719,907 24,781 85,030 0 7,016,271<br />
Average Savings Balance per Saver 53 187 53 192 146 40<br />
Average Savings Account Balance 53 189 53 191 146 92<br />
MACROECONOMIC INDICATORS<br />
GNP per Capita 620 600 1,170 1,170 620 620 620<br />
GDP Growth Rate 6.9% 6.4% 6.2% 6.2% 6.2% 6.3% 6.0%<br />
Deposit Rate 6.0% 5.8% 5.6% 5.6% 5.6% 5.9% 6.0%<br />
Inflation Rate 4.3% 9.1% 7.6% 7.6% 7.6% 7.3% 7.0%<br />
Financial Depth 66.1% 50.3% 55.5% 55.5% 55.5% 55.5% 51.2%<br />
OVERALL FINANCIAL PERFORMANCE<br />
Return on Assets 0.9% -9.0% -0.8% -5.3% -0.8% 2.5% -0.3%<br />
Return on Equity 35.8% -21.6% -3.5% -10.5% -1.1% 6.9% -1.4%<br />
Operational Self-Sufficiency 107.0% 70.9% 114.1% 98.6% 107.1% 133.7% 119.5%<br />
Financial Self-Sufficiency 104.7% 53.7% 97.6% 83.7% 98.2% 111.7% 103.8%<br />
REVENUES<br />
Financial Revenue Ratio 20.9% 11.2% 31.6% 29.9% 23.1% 20.8% 22.1%<br />
Profit Margin 4.5% -86.8% -2.5% -19.5% -1.9% 10.5% 3.7%<br />
Yield on Gross Portfolio (nominal) 25.1% 21.7% 42.8% 45.2% 30.9% 25.4% 25.2%<br />
Yield on Gross Portfolio (real) 20.0% 11.6% 32.7% 34.8% 20.3% 18.1% 20.0%<br />
EXPENSES<br />
Total Expense Ratio 22.9% 26.4% 31.0% 32.6% 25.9% 22.8% 19.4%<br />
Financial Expense Ratio 7.0% 6.9% 5.6% 5.6% 5.9% 6.4% 6.7%<br />
Loan Loss Provision Expense Ratio 1.9% 1.7% 3.9% 3.3% 2.5% 1.1% 1.7%<br />
Operating Expense Ratio 10.1% 12.2% 20.1% 21.8% 13.8% 14.6% 9.4%<br />
Personnel Expense Ratio 5.0% 6.7% 10.5% 12.4% 7.0% 7.0% 5.0%<br />
Administrative Expense Ratio 4.9% 5.7% 9.1% 9.6% 7.3% 6.9% 3.8%<br />
Adjustment Expense Ratio 0.2% 5.0% 2.8% 2.5% 2.6% 2.3% 1.4%<br />
EFFICIENCY<br />
Operating Expense/ Loan Portfolio 13.9% 37.2% 29.0% 37.9% 21.4% 19.3% 12.8%<br />
Personnel Expense/ Loan Portfolio 7.0% 21.9% 14.8% 21.8% 10.4% 10.0% 7.5%<br />
Average Salary/ GNP per Capita 2.5 4.8 2.4 2.3 3.0 3.1 2.9<br />
Cost per Borrower 15 48 56 41 43 21 14<br />
Cost per Loan 11 48 58 41 41 21 12<br />
PRODUCTIVITY<br />
Borrowers per Staff Member 217 111 114 113 132 161 178<br />
Loans per Staff Member 257 99 111 109 136 175 182<br />
Borrowers per Loan Officer 252 186 183 178 211 226 238<br />
Loans per Loan Officer 312 186 189 178 220 230 284<br />
Voluntary Savers per Staff Member 74 174 107 117 90 175<br />
Savings Accounts per Staff Member 74 174 107 122 90 257<br />
Personnel Allocation Ratio 78.4% 59.5% 63.3% 64.6% 63.8% 63.9% 66.1%<br />
RISK AND LIQUIDITY<br />
Portfolio at Risk> 30 Days 0.7% 2.9% 6.9% 3.9% 3.0% 0.5% 2.4%<br />
Portfolio at Risk> 90 Days 0.2% 1.2% 3.7% 2.2% 1.5% 0.1% 0.9%<br />
Write-off Ratio 2.0% 2.1% 3.9% 3.9% 2.6% 0.8% 2.3%<br />
Loan Loss Rate 1.9% 2.1% 3.5% 3.9% 2.2% 0.8% 2.0%<br />
Risk Coverage 1.5 0.8 0.7 0.7 1.0 1.7 0.7<br />
Non-earning Liquid Assets as a % of Total Assets 6.7% 1.9% 15.8% 15.9% 11.4% 8.0% 5.2%<br />
Current Ratio 0 0 2.26 10.953 1.829 1.903<br />
November 2006<br />
<strong>Microfinance</strong> <strong>Information</strong> Exchange, Inc.
<strong>Benchmarking</strong> <strong>Microfinance</strong> <strong>2005</strong><br />
This publication is part of a series of regional industry benchmarking reports presented by<br />
the <strong>Microfinance</strong> <strong>Information</strong> Exchange, Inc. (MIX):<br />
<br />
<br />
<br />
<br />
<br />
<strong>Benchmarking</strong> African <strong>Microfinance</strong> <strong>2005</strong><br />
<strong>Benchmarking</strong> <strong>Asian</strong> <strong>Microfinance</strong> <strong>2005</strong><br />
<strong>Benchmarking</strong> Arab <strong>Microfinance</strong> <strong>2005</strong><br />
<strong>Benchmarking</strong> Latin American <strong>Microfinance</strong> <strong>2005</strong><br />
<strong>Benchmarking</strong> <strong>Microfinance</strong> in Eastern Europe and Central Asia <strong>2005</strong><br />
The five regional <strong>2005</strong> performance reports are based on the <strong>2005</strong> benchmark data,<br />
collected from 446 microfinance institutions from 78 countries, located in Sub-Saharan<br />
Africa, Asia, Eastern Europe and Central Asia, Latin America and the Caribbean, as well<br />
as the Middle East and North Africa. The series represents the most methodologically<br />
consistent and in-depth reports on the performance of microfinance providers produced<br />
to date.<br />
The <strong>Microfinance</strong> <strong>Information</strong> Exchange, Inc. is a non-profit company dedicated to improving<br />
the information infrastructure of the microfinance industry in developing countries, by<br />
promoting standards of financial and operational reporting, offering readily accessible data,<br />
and providing specialized information services.<br />
<strong>Microfinance</strong> <strong>Information</strong> eXchange<br />
1901 Pennsylvania Avenue NW - Suite 307<br />
Washington, DC - 20006, USA<br />
Tel +1 202 659 9094, Fax +1202 659 9095<br />
Email: info@themix.org<br />
www.themix.org<br />
The <strong>Benchmarking</strong> <strong>Asian</strong> <strong>Microfinance</strong> <strong>2005</strong> report was produced with help from:<br />
Centre for Micro-Finance<br />
(Pvt.) Limited, Nepal<br />
<strong>Microfinance</strong> Council of<br />
the Philippines, Inc.<br />
Pakistan <strong>Microfinance</strong> Network<br />
Microenterprise Access to Banking<br />
Services, Philippines