Solar EUV Irradiance Variability Reflected in the Terrestrial Dayglow
Solar EUV Irradiance Variability Reflected in the Terrestrial Dayglow
Solar EUV Irradiance Variability Reflected in the Terrestrial Dayglow

You also want an ePaper? Increase the reach of your titles
YUMPU automatically turns print PDFs into web optimized ePapers that Google loves.
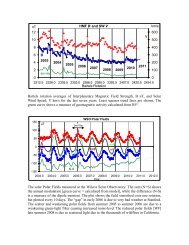
ecent period from 2002 to 2008 when decreas<strong>in</strong>g solar irradiance dur<strong>in</strong>g <strong>the</strong> descend<strong>in</strong>g phase of <strong>the</strong> 11-<br />
year cycle countered much of <strong>the</strong> anthropogenic warm<strong>in</strong>g.<br />
Accord<strong>in</strong>g to our projections of annual mean regional surface temperature changes, shown <strong>in</strong> Figure<br />
3, <strong>the</strong> <strong>in</strong>crease from 2009 to 2014 will be largest from 30 to ∼70 o N, especially over land but also over <strong>the</strong><br />
ocean, except <strong>in</strong> <strong>the</strong> north east Pacific. As solar irradiance decreases and global surface temperatures<br />
<strong>in</strong>crease m<strong>in</strong>imally between 2014 and 2019, <strong>the</strong> anthropogenic <strong>in</strong>fluence never<strong>the</strong>less will cont<strong>in</strong>ue to<br />
warm <strong>the</strong> Nor<strong>the</strong>rn mid latitudes, but less uniformly and at a slower rate because of cool<strong>in</strong>g <strong>in</strong> those<br />
regions most sensitive to solar variability (Figure 3, bottom). Our projections are consistent with IPCC’s<br />
long-range forecast that warm<strong>in</strong>g will be greatest over land and at most high nor<strong>the</strong>rn latitudes. But<br />
whereas IPCC asserts m<strong>in</strong>imal warm<strong>in</strong>g <strong>in</strong> parts of <strong>the</strong> North Atlantic Ocean, our forecast suggests that<br />
this region will warm throughout <strong>the</strong> next decade, <strong>in</strong> response to both solar and anthropogenic <strong>in</strong>fluences.<br />
A major volcanic eruption or a super ENSO will modify significantly <strong>the</strong> temperature change<br />
scenarios <strong>in</strong> Figure 3, both globally and regionally, as shown <strong>in</strong> Figure 4. A large volcanic eruption with<br />
peak climate impact <strong>in</strong> 2014 will cool much of <strong>the</strong> Americas and <strong>the</strong> mid Atlantic Ocean, parts of<br />
Australia, <strong>the</strong> tropical Pacific Ocean and <strong>the</strong> western India Ocean relative to <strong>the</strong> base period (1951-1980).<br />
A “super” El N<strong>in</strong>o peak<strong>in</strong>g <strong>in</strong> 2019 would produce significant warm<strong>in</strong>g over many regions of <strong>the</strong> globe,<br />
as shown <strong>in</strong> Figure 4. Such a comb<strong>in</strong>ation of an ENSO event follow<strong>in</strong>g a P<strong>in</strong>atubo-like eruption would<br />
mean that ra<strong>the</strong>r than rema<strong>in</strong><strong>in</strong>g approximately level from 2014 to 2019, global surface temperatures<br />
would <strong>in</strong>crease 0.4±0.02 o C (Figure 1), but from entirely natural (not anthropogenic) causes. A similar<br />
sequence occurred <strong>in</strong> <strong>the</strong> recent past from mid 1992 to mid 1997, when global surface temperatures<br />
<strong>in</strong>creased 0.5 o C, significantly more than <strong>the</strong> 0.1 o C, attributable to anthropogenic warm<strong>in</strong>g over this<br />
period.<br />
4. Summary<br />
By represent<strong>in</strong>g monthly mean surface temperatures <strong>in</strong> terms of <strong>the</strong>ir comb<strong>in</strong>ed l<strong>in</strong>ear responses to<br />
ENSO, volcanic and solar activity and anthropogenic <strong>in</strong>fluences, we account for 76% of <strong>the</strong> variance<br />
observed s<strong>in</strong>ce 1980 (and s<strong>in</strong>ce 1889, Lean and R<strong>in</strong>d, 2008) and forecast global and regional temperatures<br />
6
![When the Heliospheric Current Sheet [Figure 1] - Leif and Vera ...](https://img.yumpu.com/51383897/1/190x245/when-the-heliospheric-current-sheet-figure-1-leif-and-vera-.jpg?quality=85)

![The sum of two COSine waves is equal to [twice] the product of two ...](https://img.yumpu.com/32653111/1/190x245/the-sum-of-two-cosine-waves-is-equal-to-twice-the-product-of-two-.jpg?quality=85)