Solar EUV Irradiance Variability Reflected in the Terrestrial Dayglow
Solar EUV Irradiance Variability Reflected in the Terrestrial Dayglow
Solar EUV Irradiance Variability Reflected in the Terrestrial Dayglow

You also want an ePaper? Increase the reach of your titles
YUMPU automatically turns print PDFs into web optimized ePapers that Google loves.
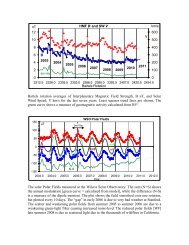
to calculate <strong>the</strong> aerosol optical depth because of <strong>the</strong> lack of direct quantitative space-based observations<br />
[Thomason and Pitts, 2009]. <strong>Solar</strong> irradiance, S, is estimated as <strong>the</strong> compet<strong>in</strong>g effects of sunspots and<br />
facular, identified <strong>in</strong> observations made by space-based radiometers [Lean et al., 2005]. The<br />
anthropogenic <strong>in</strong>fluence, A, is <strong>the</strong> net effect of eight different components, <strong>in</strong>clud<strong>in</strong>g greenhouse gases,<br />
land use and snow albedo changes, and (admittedly uncerta<strong>in</strong>) tropospheric aerosols [Hansen et al.,<br />
2007].<br />
The comb<strong>in</strong>ation of natural and anthropogenic <strong>in</strong>fluences (at appropriate lags) <strong>in</strong> <strong>the</strong> empirical model<br />
captures 76% of <strong>the</strong> variance <strong>in</strong> <strong>the</strong> monthly global surface temperature record. Figure 1 illustrates that<br />
this statistical model tracks closely <strong>the</strong> observed global surface temperatures from 1980 to 2008,<br />
<strong>in</strong>clud<strong>in</strong>g <strong>the</strong> lack of overall warm<strong>in</strong>g dur<strong>in</strong>g <strong>the</strong> past decade. The <strong>in</strong>dividual contributions to <strong>the</strong> net<br />
global surface temperatures of <strong>the</strong> natural and anthropogenic <strong>in</strong>fluences are also shown <strong>in</strong> Figure 1,<br />
<strong>in</strong>clud<strong>in</strong>g 0.2 o C warm<strong>in</strong>g dur<strong>in</strong>g <strong>the</strong> 1997-98 ENSO, cool<strong>in</strong>g approach<strong>in</strong>g 0.3 o C <strong>in</strong> 1992 follow<strong>in</strong>g<br />
P<strong>in</strong>atubo, and ∼0.1 o C warm<strong>in</strong>g near peak solar cycle activity.<br />
To test our empirical approach, we determ<strong>in</strong>e <strong>the</strong> model parameters us<strong>in</strong>g observations from 1970 to<br />
1999, and compare <strong>the</strong> observed surface temperature change with our empirical determ<strong>in</strong>ation averaged<br />
over <strong>the</strong> subsequent five-year period from 2001 to 2005 (for direct comparison with Hansen et al., 2006,<br />
Figure 1B). Relative to <strong>the</strong> base period, observed global surface temperature <strong>in</strong>creased 0.56±0.03 o C<br />
compared with 0.53±0.03 o C projected by our empirical model, where <strong>the</strong> uncerta<strong>in</strong>ties are obta<strong>in</strong>ed by<br />
comb<strong>in</strong><strong>in</strong>g <strong>the</strong> uncerta<strong>in</strong>ties of <strong>the</strong> means. Figure 2 shows that <strong>the</strong> observed and model-projected regional<br />
pattern change for 2001-2005 (relative to 1951-1980) and <strong>the</strong> (area-weighted) zonal surface temperatures<br />
are very similar. Note that our model is limited to those latitudes (approximately 60 o S to 70 o N, Figure 2)<br />
where actual observations are available for 50% of all months over <strong>the</strong> 30-year model regression period.<br />
Us<strong>in</strong>g global and regional surface temperature responses to <strong>the</strong> four <strong>in</strong>dividual <strong>in</strong>fluences<br />
parameterized by regression aga<strong>in</strong>st <strong>the</strong> observations from 1980 to 2008, we forecast change from 2009 to<br />
2030 by adopt<strong>in</strong>g <strong>the</strong> best estimate of how each <strong>in</strong>fluence will change <strong>in</strong> <strong>the</strong> future. The anthropogenic<br />
forc<strong>in</strong>g <strong>in</strong> <strong>the</strong> past 40 years is well represented by a l<strong>in</strong>ear trend that we extrapolate <strong>in</strong>to <strong>the</strong> future, as<br />
4
![When the Heliospheric Current Sheet [Figure 1] - Leif and Vera ...](https://img.yumpu.com/51383897/1/190x245/when-the-heliospheric-current-sheet-figure-1-leif-and-vera-.jpg?quality=85)


![The sum of two COSine waves is equal to [twice] the product of two ...](https://img.yumpu.com/32653111/1/190x245/the-sum-of-two-cosine-waves-is-equal-to-twice-the-product-of-two-.jpg?quality=85)