Solar EUV Irradiance Variability Reflected in the Terrestrial Dayglow
Solar EUV Irradiance Variability Reflected in the Terrestrial Dayglow
Solar EUV Irradiance Variability Reflected in the Terrestrial Dayglow

Create successful ePaper yourself
Turn your PDF publications into a flip-book with our unique Google optimized e-Paper software.
How Will Earth’s Surface Temperature Change <strong>in</strong> Future Decades<br />
Judith L. Lean 1 , David H. R<strong>in</strong>d 2<br />
1. Space Science Division, Naval Research Laboratory, Wash<strong>in</strong>gton D.C. 20375<br />
2. Goddard Institute for Space Studies, NASA, New York, NY 10025<br />
Abstract<br />
Reliable forecasts of climate change <strong>in</strong> <strong>the</strong> immediate future are difficult, especially on regional scales,<br />
where natural climate variations may amplify or mitigate anthropogenic warm<strong>in</strong>g <strong>in</strong> ways that numerical<br />
models capture poorly. By decompos<strong>in</strong>g recent observed surface temperatures <strong>in</strong>to components associated<br />
with ENSO, volcanic and solar activity, and anthropogenic <strong>in</strong>fluences, we anticipate global and regional<br />
changes <strong>in</strong> <strong>the</strong> next two decades. From 2009 to 2014, projected rises <strong>in</strong> anthropogenic <strong>in</strong>fluences and<br />
solar irradiance will <strong>in</strong>crease global surface temperature 0.15±0.03 o C, at a rate 50% greater than predicted<br />
by IPCC. But as a result of decl<strong>in</strong><strong>in</strong>g solar activity <strong>in</strong> <strong>the</strong> subsequent five years, average temperature <strong>in</strong><br />
2019 is only 0.03±0.01 o C warmer than <strong>in</strong> 2014. This lack of overall warm<strong>in</strong>g is analogous to <strong>the</strong> period<br />
from 2002 to 2008 when decreas<strong>in</strong>g solar irradiance also countered much of <strong>the</strong> anthropogenic warm<strong>in</strong>g.<br />
We fur<strong>the</strong>r illustrate how a major volcanic eruption and a super ENSO would modify our global and<br />
regional temperature projections.<br />
1. Introduction<br />
Global surface temperature <strong>in</strong>creased 0.7 o C dur<strong>in</strong>g <strong>the</strong> twentieth century and is projected to cause a<br />
fur<strong>the</strong>r 1 to 4 o C <strong>in</strong>crease dur<strong>in</strong>g <strong>the</strong> twenty first century, primarily as a result of <strong>in</strong>creas<strong>in</strong>g concentrations<br />
of greenhouse gases [IPCC, 2007]. Yet as Figure 1 shows, global surface temperatures warmed little, if at<br />
all, from 2002 to 2008, even as greenhouse gas concentrations have <strong>in</strong>creased, caus<strong>in</strong>g some to question<br />
<strong>the</strong> reality of anthropogenic global warm<strong>in</strong>g. Natural <strong>in</strong>fluences also alter surface temperatures, produc<strong>in</strong>g<br />
as much as 0.2 o C global warm<strong>in</strong>g dur<strong>in</strong>g major ENSO events, near 0.3 o C cool<strong>in</strong>g follow<strong>in</strong>g large volcanic<br />
eruptions, and 0.1 o C warm<strong>in</strong>g from m<strong>in</strong>ima to maxima of recent solar cycles [Lean and R<strong>in</strong>d, 2008]. On<br />
time scales of years to a decade, naturally <strong>in</strong>duced surface temperature changes can dom<strong>in</strong>ate current<br />
1
anthropogenic warm<strong>in</strong>g of 0.2 o C per decade [Easterl<strong>in</strong>g and Wehner, 2009], especially <strong>in</strong> some locations,<br />
where regional changes can exceed <strong>the</strong> global response by an order of magnitude. With adverse effects of<br />
warm<strong>in</strong>g temperatures already apparent, for example <strong>in</strong> wildfire duration and <strong>in</strong>tensity [Runn<strong>in</strong>g, 2006],<br />
knowledge of surface temperatures is sought <strong>in</strong> <strong>the</strong> immediate decades not just for <strong>the</strong> long-term future,<br />
for application to land management and crop productivity [Mendelsohn et al., 2007], energy usage,<br />
tourism and public health [Khasnis and Nettleman, 2005].<br />
On time scales of 10 to 50 years (and longer) decadal climate forecasts are difficult to make with<br />
general circulation climate models due to <strong>the</strong>ir many uncerta<strong>in</strong>ties [IPCC, 2007]. By <strong>in</strong>clud<strong>in</strong>g<br />
overturn<strong>in</strong>g of <strong>the</strong> ocean’s meridional circulation <strong>in</strong> a numerical model and us<strong>in</strong>g observed distributions<br />
of ocean heat content for <strong>in</strong>itialization, Smith et al. [2007] forecast rapid warm<strong>in</strong>g after 2008, with “at<br />
least half of <strong>the</strong> 5 years after 2009 ..… predicted to exceed (1998) <strong>the</strong> warmest year currently on record”.<br />
But ano<strong>the</strong>r model that also attempts to account for meridional overturn<strong>in</strong>g circulation [Keenlyside et al.,<br />
2008] forecasts <strong>the</strong> opposite, “that global surface temperature may not <strong>in</strong>crease over <strong>the</strong> next decade, as<br />
natural climate variations <strong>in</strong> <strong>the</strong> North Atlantic and tropical Pacific temporarily offset <strong>the</strong> projected<br />
anthropogenic warm<strong>in</strong>g”.<br />
An alternative approach to numerical model simulations for assess<strong>in</strong>g recent climate change and<br />
forecast<strong>in</strong>g future change <strong>in</strong> <strong>the</strong> next two decades is direct analysis of surface temperature observations.<br />
By isolat<strong>in</strong>g and quantify<strong>in</strong>g <strong>the</strong> specific changes aris<strong>in</strong>g from <strong>in</strong>dividual natural and anthropogenic<br />
<strong>in</strong>fluences, <strong>the</strong> causes of past change are identified, <strong>the</strong>reby render<strong>in</strong>g forecasts for future decades<br />
possible, assum<strong>in</strong>g plausible future scenarios expected for each <strong>in</strong>fluence. We use this empirical approach<br />
to develop global and regional surface temperature scenarios for <strong>the</strong> next two decades.<br />
Climate system nonl<strong>in</strong>earities have <strong>the</strong> potential to perturb such an approach, but are less likely over<br />
<strong>the</strong> time-scale of <strong>the</strong> next decade or two. There could, however, be ‘tipp<strong>in</strong>g po<strong>in</strong>ts’ <strong>in</strong> which processes<br />
heretofore unimportant become activated, or simply grow <strong>in</strong> importance relative to <strong>the</strong>ir historical<br />
contribution. An example of <strong>the</strong> former is chang<strong>in</strong>g Arctic sea ice, which may lead to a rapid<br />
amplification of <strong>the</strong> high latitude response. An example of <strong>the</strong> latter is reduction <strong>in</strong> <strong>the</strong> overturn<strong>in</strong>g<br />
2
circulation <strong>in</strong> <strong>the</strong> North Atlantic, <strong>the</strong> reason for IPCC’s forecast of m<strong>in</strong>imal warm<strong>in</strong>g <strong>in</strong> parts of <strong>the</strong> North<br />
Atlantic Ocean, and <strong>the</strong> Keenlyside et al. [2008] reduced warm<strong>in</strong>g. But as <strong>the</strong> state of both ocean/sea ice<br />
model<strong>in</strong>g and ocean <strong>in</strong>itialization is still far from mature, <strong>the</strong>re is as yet little quantitative predictability<br />
for <strong>the</strong>se features.<br />
2. Analysis<br />
Us<strong>in</strong>g <strong>the</strong> most recently available characterizations of ENSO, E, volcanic aerosols, V, solar irradiance, S,<br />
and anthropogenic <strong>in</strong>fluences, A, we perform multiple l<strong>in</strong>ear regression analyses to decompose monthly<br />
mean surface temperature anomalies s<strong>in</strong>ce 1980 <strong>in</strong>to four components. The decomposition is conducted<br />
on a global scale, as well as on a 5 o × 5 o latitude-longitude grid to determ<strong>in</strong>e <strong>the</strong> correspond<strong>in</strong>g<br />
geographical patterns. Dur<strong>in</strong>g this recent epoch, <strong>in</strong> addition to surface temperature observations cover<strong>in</strong>g<br />
∼80% of <strong>the</strong> globe, <strong>the</strong> ENSO, volcanic and solar cycle signals are <strong>the</strong> strongest of <strong>the</strong> past century and<br />
are specified with confidence because of direct observations. Such a decomposition of observations s<strong>in</strong>ce<br />
1980 is consistent with analysis of historical surface temperature records s<strong>in</strong>ce 1889 [Lean and R<strong>in</strong>d,<br />
2008] and it facilitates direct comparison with <strong>the</strong> same base period that Hansen et al., [2006] utilize, <strong>the</strong><br />
average of <strong>the</strong> prior 30 years, 1951-1980.<br />
Monthly mean surface temperature anomalies are reconstructed as T R (t) = c 0 +c E E(t-Δt E )+c V V(t-<br />
Δt V )+c S S(t-Δt S )+c A A(t-Δt A ) where E, V, S and A are zero mean, unit variance time series and <strong>the</strong> lags (<strong>in</strong><br />
months) are Δt E =4, Δt V =7, Δt S =1 and Δt A =120. The lags are chosen to maximize <strong>the</strong> proportion of global<br />
variability that <strong>the</strong> statistical model captures and are spatially <strong>in</strong>variant (although a geographical<br />
dependence is expected). The fitted coefficients, c 0 …, are obta<strong>in</strong>ed by multiple l<strong>in</strong>ear regression aga<strong>in</strong>st<br />
<strong>the</strong> <strong>in</strong>strumental surface temperature record (HadCRUT3v) available from <strong>the</strong> University of East Anglia<br />
Climatic Research Unit (CRU) [Brohan et al., 2006]. The multivariate ENSO <strong>in</strong>dex, E, is a weighted<br />
average of <strong>the</strong> ma<strong>in</strong> ENSO features conta<strong>in</strong>ed <strong>in</strong> sea-level pressure, surface w<strong>in</strong>d, surface sea and air<br />
temperature, and cloud<strong>in</strong>ess [Walter and Timl<strong>in</strong>, 1998]. Volcanic aerosols, V, <strong>in</strong> <strong>the</strong> stratosphere are<br />
compiled by [Sato et al., 1993] s<strong>in</strong>ce 1850, updated from giss.nasa.gov to 1999 and extended to <strong>the</strong><br />
present with zero values. Although some volcanic activity occurred between 2006 and 2008, it is difficult<br />
3
to calculate <strong>the</strong> aerosol optical depth because of <strong>the</strong> lack of direct quantitative space-based observations<br />
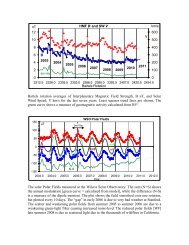
[Thomason and Pitts, 2009]. <strong>Solar</strong> irradiance, S, is estimated as <strong>the</strong> compet<strong>in</strong>g effects of sunspots and<br />
facular, identified <strong>in</strong> observations made by space-based radiometers [Lean et al., 2005]. The<br />
anthropogenic <strong>in</strong>fluence, A, is <strong>the</strong> net effect of eight different components, <strong>in</strong>clud<strong>in</strong>g greenhouse gases,<br />
land use and snow albedo changes, and (admittedly uncerta<strong>in</strong>) tropospheric aerosols [Hansen et al.,<br />
2007].<br />
The comb<strong>in</strong>ation of natural and anthropogenic <strong>in</strong>fluences (at appropriate lags) <strong>in</strong> <strong>the</strong> empirical model<br />
captures 76% of <strong>the</strong> variance <strong>in</strong> <strong>the</strong> monthly global surface temperature record. Figure 1 illustrates that<br />
this statistical model tracks closely <strong>the</strong> observed global surface temperatures from 1980 to 2008,<br />
<strong>in</strong>clud<strong>in</strong>g <strong>the</strong> lack of overall warm<strong>in</strong>g dur<strong>in</strong>g <strong>the</strong> past decade. The <strong>in</strong>dividual contributions to <strong>the</strong> net<br />
global surface temperatures of <strong>the</strong> natural and anthropogenic <strong>in</strong>fluences are also shown <strong>in</strong> Figure 1,<br />
<strong>in</strong>clud<strong>in</strong>g 0.2 o C warm<strong>in</strong>g dur<strong>in</strong>g <strong>the</strong> 1997-98 ENSO, cool<strong>in</strong>g approach<strong>in</strong>g 0.3 o C <strong>in</strong> 1992 follow<strong>in</strong>g<br />
P<strong>in</strong>atubo, and ∼0.1 o C warm<strong>in</strong>g near peak solar cycle activity.<br />
To test our empirical approach, we determ<strong>in</strong>e <strong>the</strong> model parameters us<strong>in</strong>g observations from 1970 to<br />
1999, and compare <strong>the</strong> observed surface temperature change with our empirical determ<strong>in</strong>ation averaged<br />
over <strong>the</strong> subsequent five-year period from 2001 to 2005 (for direct comparison with Hansen et al., 2006,<br />
Figure 1B). Relative to <strong>the</strong> base period, observed global surface temperature <strong>in</strong>creased 0.56±0.03 o C<br />
compared with 0.53±0.03 o C projected by our empirical model, where <strong>the</strong> uncerta<strong>in</strong>ties are obta<strong>in</strong>ed by<br />
comb<strong>in</strong><strong>in</strong>g <strong>the</strong> uncerta<strong>in</strong>ties of <strong>the</strong> means. Figure 2 shows that <strong>the</strong> observed and model-projected regional<br />
pattern change for 2001-2005 (relative to 1951-1980) and <strong>the</strong> (area-weighted) zonal surface temperatures<br />
are very similar. Note that our model is limited to those latitudes (approximately 60 o S to 70 o N, Figure 2)<br />
where actual observations are available for 50% of all months over <strong>the</strong> 30-year model regression period.<br />
Us<strong>in</strong>g global and regional surface temperature responses to <strong>the</strong> four <strong>in</strong>dividual <strong>in</strong>fluences<br />
parameterized by regression aga<strong>in</strong>st <strong>the</strong> observations from 1980 to 2008, we forecast change from 2009 to<br />
2030 by adopt<strong>in</strong>g <strong>the</strong> best estimate of how each <strong>in</strong>fluence will change <strong>in</strong> <strong>the</strong> future. The anthropogenic<br />
forc<strong>in</strong>g <strong>in</strong> <strong>the</strong> past 40 years is well represented by a l<strong>in</strong>ear trend that we extrapolate <strong>in</strong>to <strong>the</strong> future, as<br />
4
shown <strong>in</strong> Figure 1. We assume that future solar irradiance cycles replicate cycle 23, with cycle 24<br />
commenc<strong>in</strong>g at <strong>the</strong> beg<strong>in</strong>n<strong>in</strong>g of 2009. Although solar activity (as <strong>in</strong>dicted by sunspot numbers) was less<br />
<strong>in</strong> cycle 23 than <strong>in</strong> cycles 21 and 22, <strong>the</strong> total irradiance amplitude (near 0.1%) is similar <strong>in</strong> <strong>the</strong> three past<br />
cycles s<strong>in</strong>ce it is <strong>the</strong> net effect of sunspot darken<strong>in</strong>g and facular brighten<strong>in</strong>g, both of which are altered by<br />
solar activity. S<strong>in</strong>ce ENSO fluctuations and volcanic eruptions are not predictable on decadal time scales,<br />
we estimate <strong>the</strong>ir maximum likely future impact with a scenario that <strong>in</strong>cludes a P<strong>in</strong>atubo-like eruption<br />
with peak impact <strong>in</strong> 2014 and a super ENSO with maximum impact <strong>in</strong> 2019, mimick<strong>in</strong>g a similar<br />
sequence that occurred from 1992 to 1997 (Figure 1).<br />
3. Results<br />
With <strong>the</strong> solar and anthropogenic scenarios <strong>in</strong> Figure 1, our empirical model predicts that global surface<br />
temperatures will <strong>in</strong>crease at an average rate of 0.17±0.03 o C per decade <strong>in</strong> <strong>the</strong> next two decades. The<br />
uncerta<strong>in</strong>ty given <strong>in</strong> our prediction is <strong>the</strong> standard deviation of forecasts made with statistical models of<br />
three different epochs, <strong>the</strong> current epoch 1980-2008, our test epoch 1970-1999 and <strong>the</strong> historical record<br />
from 1890-2008. With<strong>in</strong> <strong>the</strong> uncerta<strong>in</strong>ties, <strong>the</strong> average warm<strong>in</strong>g rate <strong>in</strong> <strong>the</strong> next two decades is consistent<br />
with <strong>the</strong> 0.2 o C per decade warm<strong>in</strong>g forecast by IPCC [2007], also shown <strong>in</strong> Figure 1. The warm<strong>in</strong>g trend<br />
is opposite to recent projections of Keenlyside et al. [2008], who forecast an absence of warm<strong>in</strong>g <strong>in</strong> <strong>the</strong><br />
next decade based on weaken<strong>in</strong>g of <strong>the</strong> Atlantic Ocean meridional overturn<strong>in</strong>g circulation (a change not<br />
explicitly <strong>in</strong>cluded <strong>in</strong> our empirical model).<br />
The predicted warm<strong>in</strong>g rate will not, however, be constant on sub-decadal time scales over <strong>the</strong> next<br />
two decades. As both <strong>the</strong> anthropogenic <strong>in</strong>fluence cont<strong>in</strong>ues and solar irradiance <strong>in</strong>creases from <strong>the</strong> onset<br />
to <strong>the</strong> maximum of cycle 24, global surface temperature is projected to <strong>in</strong>crease 0.15±0.03 o C <strong>in</strong> <strong>the</strong> five<br />
years from 2009 to 2014, with global annual temperatures 0.7 o C above <strong>the</strong> base period by 2014. However,<br />
our estimated annual temperate <strong>in</strong>crease of 0.19±0.03 o C from 2004 to 2014 (Figure 1) is less than <strong>the</strong><br />
0.3 o C warm<strong>in</strong>g that Smith et al. [2007] predict over <strong>the</strong> same <strong>in</strong>terval. From 2014 to 2019, global annual<br />
surface temperatures <strong>in</strong>crease only m<strong>in</strong>imally (0.03±0.01 o C), because decl<strong>in</strong><strong>in</strong>g solar irradiance is<br />
expected to cancel much of <strong>the</strong> anthropogenic warm<strong>in</strong>g. This lack of overall warm<strong>in</strong>g is analogous to <strong>the</strong><br />
5
ecent period from 2002 to 2008 when decreas<strong>in</strong>g solar irradiance dur<strong>in</strong>g <strong>the</strong> descend<strong>in</strong>g phase of <strong>the</strong> 11-<br />
year cycle countered much of <strong>the</strong> anthropogenic warm<strong>in</strong>g.<br />
Accord<strong>in</strong>g to our projections of annual mean regional surface temperature changes, shown <strong>in</strong> Figure<br />
3, <strong>the</strong> <strong>in</strong>crease from 2009 to 2014 will be largest from 30 to ∼70 o N, especially over land but also over <strong>the</strong><br />
ocean, except <strong>in</strong> <strong>the</strong> north east Pacific. As solar irradiance decreases and global surface temperatures<br />
<strong>in</strong>crease m<strong>in</strong>imally between 2014 and 2019, <strong>the</strong> anthropogenic <strong>in</strong>fluence never<strong>the</strong>less will cont<strong>in</strong>ue to<br />
warm <strong>the</strong> Nor<strong>the</strong>rn mid latitudes, but less uniformly and at a slower rate because of cool<strong>in</strong>g <strong>in</strong> those<br />
regions most sensitive to solar variability (Figure 3, bottom). Our projections are consistent with IPCC’s<br />
long-range forecast that warm<strong>in</strong>g will be greatest over land and at most high nor<strong>the</strong>rn latitudes. But<br />
whereas IPCC asserts m<strong>in</strong>imal warm<strong>in</strong>g <strong>in</strong> parts of <strong>the</strong> North Atlantic Ocean, our forecast suggests that<br />
this region will warm throughout <strong>the</strong> next decade, <strong>in</strong> response to both solar and anthropogenic <strong>in</strong>fluences.<br />
A major volcanic eruption or a super ENSO will modify significantly <strong>the</strong> temperature change<br />
scenarios <strong>in</strong> Figure 3, both globally and regionally, as shown <strong>in</strong> Figure 4. A large volcanic eruption with<br />
peak climate impact <strong>in</strong> 2014 will cool much of <strong>the</strong> Americas and <strong>the</strong> mid Atlantic Ocean, parts of<br />
Australia, <strong>the</strong> tropical Pacific Ocean and <strong>the</strong> western India Ocean relative to <strong>the</strong> base period (1951-1980).<br />
A “super” El N<strong>in</strong>o peak<strong>in</strong>g <strong>in</strong> 2019 would produce significant warm<strong>in</strong>g over many regions of <strong>the</strong> globe,<br />
as shown <strong>in</strong> Figure 4. Such a comb<strong>in</strong>ation of an ENSO event follow<strong>in</strong>g a P<strong>in</strong>atubo-like eruption would<br />
mean that ra<strong>the</strong>r than rema<strong>in</strong><strong>in</strong>g approximately level from 2014 to 2019, global surface temperatures<br />
would <strong>in</strong>crease 0.4±0.02 o C (Figure 1), but from entirely natural (not anthropogenic) causes. A similar<br />
sequence occurred <strong>in</strong> <strong>the</strong> recent past from mid 1992 to mid 1997, when global surface temperatures<br />
<strong>in</strong>creased 0.5 o C, significantly more than <strong>the</strong> 0.1 o C, attributable to anthropogenic warm<strong>in</strong>g over this<br />
period.<br />
4. Summary<br />
By represent<strong>in</strong>g monthly mean surface temperatures <strong>in</strong> terms of <strong>the</strong>ir comb<strong>in</strong>ed l<strong>in</strong>ear responses to<br />
ENSO, volcanic and solar activity and anthropogenic <strong>in</strong>fluences, we account for 76% of <strong>the</strong> variance<br />
observed s<strong>in</strong>ce 1980 (and s<strong>in</strong>ce 1889, Lean and R<strong>in</strong>d, 2008) and forecast global and regional temperatures<br />
6
<strong>in</strong> <strong>the</strong> next two decades. Accord<strong>in</strong>g to our prediction, which is anchored <strong>in</strong> <strong>the</strong> reality of observed changes<br />
<strong>in</strong> <strong>the</strong> recent past, warm<strong>in</strong>g from 2009 to 2014 will exceed that due to anthropogenic <strong>in</strong>fluences alone but<br />
global temperatures will <strong>in</strong>crease only slightly from 2014 to 2019, and some regions may even cool.<br />
Nor<strong>the</strong>rn mid latitudes, especially western Europe, will experience <strong>the</strong> largest warm<strong>in</strong>g (of as much<br />
as 1 o C), s<strong>in</strong>ce this region responds positively to both solar and anthropogenic <strong>in</strong>fluences. M<strong>in</strong>imal<br />
warm<strong>in</strong>g is likely <strong>in</strong> <strong>the</strong> eastern Pacific ocean and adjacent west coast of South America, and parts of <strong>the</strong><br />
mid latitude Atlantic ocean, which may cool slightly at sou<strong>the</strong>rn latitudes <strong>in</strong> future decades.<br />
The major assumption associated with our forecasts is that ‘past is prologue’; climate will cont<strong>in</strong>ue to<br />
respond <strong>in</strong> <strong>the</strong> future to <strong>the</strong> same factors that have <strong>in</strong>fluenced it <strong>in</strong> <strong>the</strong> recent past and <strong>the</strong> response will<br />
cont<strong>in</strong>ue to be l<strong>in</strong>ear over <strong>the</strong> next several decades. The demonstrated ability of our empirical model to<br />
reproduce <strong>the</strong> historical record of monthly surface temperature changes on a range of time scales from<br />
annual to multidecadal suggests that <strong>the</strong> same atmosphere-ocean <strong>in</strong>terchange (both <strong>in</strong>ternal and forced)<br />
that governs annual surface temperature changes may also control climate change <strong>in</strong> <strong>the</strong> immediate future.<br />
While <strong>the</strong> ability of <strong>the</strong> climate system to depart from its historical response should not be<br />
underestimated (e.g., ocean circulation changes), <strong>the</strong> demonstrated ability of our empirical model to<br />
reproduce with some fidelity <strong>the</strong> historical surface temperature record, and <strong>in</strong> particular <strong>the</strong> geographic<br />
variations of <strong>the</strong> last decade, provides cautious confidence that a similar capability may be available for<br />
<strong>the</strong> next two decades <strong>in</strong> association with <strong>the</strong> expected climate forc<strong>in</strong>gs. Over this time scale,<br />
anthropogenic radiative forc<strong>in</strong>g is forecast to cont<strong>in</strong>ue grow<strong>in</strong>g at close to current trends with all of <strong>the</strong><br />
different trace gas emission scenarios currently be<strong>in</strong>g employed, while <strong>the</strong> solar cycle changes can be<br />
anticipated with<strong>in</strong> a range of uncerta<strong>in</strong>ty. If strong ENSO cycle events and/or volcanoes arise, <strong>the</strong>y can be<br />
factored <strong>in</strong>to <strong>the</strong> forecasts with <strong>the</strong> method described here. In future work we plan to characterize and<br />
forecast <strong>the</strong> seasonal responses to <strong>the</strong> natural and anthropogenic effects.<br />
References<br />
Brohan, P., J. J. Kennedy, I. Harris, S. F. B. Tett, and P. D. Jones (2006), Uncerta<strong>in</strong>ty estimates <strong>in</strong><br />
regional and global observed temperature changes: a new dataset from 1850, J. Geophys. Res., 111,<br />
7
doi:10.1029/2005JD006548.<br />
Easterl<strong>in</strong>g, D.R., and M.F. Wehner (2009), Is <strong>the</strong> climate warm<strong>in</strong>g or cool<strong>in</strong>g Geophys. Res. Letts. 36,<br />
L08706, doi:10.1029/2009GL037810.<br />
Hansen, J., M. Sato, R. Ruedy, K. Lo, D. W. Lea, and M. Med<strong>in</strong>a-Elizade (2006), Global temperature<br />
change, PNAS, 103 doi/10.1073/pnas.0606291103, 14288–14293.<br />
Hansen, J., et al. (2007), Climate simulations for 1880–2003 with GISS modelE, Clim. Dyn., 29:661–696,<br />
DOI 10.1007/s00382-007-0255-8.<br />
Intergovernmental Panel on Climate Change, Fourth Assessment Report, Work<strong>in</strong>g Group I (2007).<br />
Khasnis, A., and M. D. Nettleman (2005), Global warm<strong>in</strong>g and <strong>in</strong>fectious disease, Archives of Medical<br />
Research, 36, 689-696, doi:10.1016/y.aremed.2005.03.041.<br />
Keenlyside, N. S., M. Latif, J. Jungclaus, L. Kornblueh, and E. Roeckner (2008), Advanc<strong>in</strong>g decadalscale<br />
climate prediction <strong>in</strong> <strong>the</strong> North Atlantic sector, Nature, 453, 84-88, doi:10,1038/nature06921.<br />
Lean, J., G. Rottman, J. Harder, and G Kopp (2005), SORCE contributions to new understand<strong>in</strong>g of<br />
global change and solar variability, <strong>Solar</strong> Phys., 230, 27-53.<br />
Lean, J. L., and D. H. R<strong>in</strong>d (2008), How natural and anthropogenic <strong>in</strong>fluences alter global and regional<br />
surface temperatures: 1889 to 2006. Geophys. Res. Lett., 35, L18701, doi:10.1029/2008GL034864.<br />
Mendelsohn, R., A. Basist, A. D<strong>in</strong>ar, P. Kurukulasuriya, and C. Williams (2007), What expla<strong>in</strong>s<br />
agricultural performance: climate normals or climate variance, Climate Change, 81, 85-99, doi:<br />
10.1007/s10584-006-9186-3.<br />
Runn<strong>in</strong>g, S. (2006), Is global warm<strong>in</strong>g caus<strong>in</strong>g more, larger wildfires, Science, 313, 927-928,<br />
doi:10.1126/science.1130370.<br />
Sato, M., J. E. Hansen, M. P. McCormick, and J. B. Pollack (1993), Stratospheric aerosol optical depths,<br />
1850-1990, J. Geophys. Res., 98, 22987-22994.<br />
Smith, D. M., S. Cusack, A. W. Colman, C. K. Folland, G. R. Harris, and J. M. Murphy (2007). Improved<br />
surface temperature prediction for <strong>the</strong> com<strong>in</strong>g decade from a global climate model, Science 317, 796–<br />
799.<br />
8
Thomason, L. W., and M. C. Pitts (2009), CALIPSO observations of volcanic aerosol <strong>in</strong> <strong>the</strong> stratosphere,<br />
private communication.<br />
Wolter, K., and M. S. Timl<strong>in</strong> (1988), Measur<strong>in</strong>g <strong>the</strong> strength of ENSO - how does 1997/98 rank<br />
Wea<strong>the</strong>r, 53, 315-324.<br />
NASA funded this work. Data were obta<strong>in</strong>ed from http://www.cru.uea.ac.uk/,<br />
http://www.cdc.noaa.gov/ENSO/enso.mei_<strong>in</strong>dex.html and http://www.giss.nasa.gov/. Appreciated are<br />
efforts of <strong>the</strong> many scientists who ma<strong>in</strong>ta<strong>in</strong> <strong>the</strong> various datasets and make <strong>the</strong>n readily available.<br />
Figure 1. Compared <strong>in</strong> a) are observed monthly mean global temperatures (black) and an empirical model<br />
(orange) that comb<strong>in</strong>es four different <strong>in</strong>fluences. In b) are shown <strong>the</strong> <strong>in</strong>dividual contributions of <strong>the</strong>se<br />
<strong>in</strong>fluences, namely ENSO (purple), volcanic aerosols (blue), solar irradiance (green) and anthropogenic<br />
effects (red). Toge<strong>the</strong>r <strong>the</strong> four <strong>in</strong>fluences expla<strong>in</strong> 76% (r 2 ) of <strong>the</strong> variance <strong>in</strong> <strong>the</strong> global temperature<br />
observations. Future scenarios are shown as dashed l<strong>in</strong>es. The vertical black dashed l<strong>in</strong>es <strong>in</strong> a) denote<br />
2014 (A) and 2019 (B), at which times correspond<strong>in</strong>g spatial temperature patterns are shown <strong>in</strong> Figures 3<br />
and 4.<br />
Figure 2. Compared (on <strong>the</strong> left) are geographical patterns of surface temperatures averaged over <strong>the</strong> 5-<br />
year period 2001 to 2005 relative to <strong>the</strong> base period from 1951 to 1980 (follow<strong>in</strong>g Hansen et al., 2006),<br />
determ<strong>in</strong>ed from observations (top panel) and forecast us<strong>in</strong>g a model of <strong>the</strong> monthly mean observations<br />
between 1970 and 1999 (bottom panel). Also shown (on <strong>the</strong> right) are <strong>the</strong> (area-weighted) zonal means.<br />
Grey regions <strong>in</strong>dicate where temperature observations are considered <strong>in</strong>adequate for <strong>the</strong> analysis because<br />
less than 50% of monthly mean values are available.<br />
Figure 3. Compared are <strong>the</strong> regional changes <strong>in</strong> annual surface temperature forecast for 2014 and 2019,<br />
relative to <strong>the</strong> base period of 1951-1980, correspond<strong>in</strong>g to <strong>the</strong> global changes <strong>in</strong> Figure 1. The patterns are<br />
derived by us<strong>in</strong>g <strong>the</strong> parameterizations of HadCRUT3v monthly historical surface temperature records<br />
9
from 1980 to 2008 with ENSO, volcanic and solar activity and anthropogenic forc<strong>in</strong>g on a 5 o ×5 o latitudelongitude<br />
grid, toge<strong>the</strong>r with <strong>the</strong> forecast anthropogenic and solar time series <strong>in</strong> Figure 1b. Grey regions<br />
<strong>in</strong>dicate where temperature observations are considered <strong>in</strong>adequate to construct <strong>the</strong> model because less<br />
than 50% of monthly mean values are available.<br />
Figure 4. Shown <strong>in</strong> <strong>the</strong> upper image is <strong>the</strong> annual surface temperature pattern estimated for 2014 from <strong>the</strong><br />
comb<strong>in</strong>ed anthropogenic and solar effects (Figure 3) with <strong>the</strong> addition of a P<strong>in</strong>atubo-type volcanic<br />
eruption with peak impact <strong>in</strong> 2014. In <strong>the</strong> middle image, <strong>the</strong> annual surface temperature pattern estimated<br />
for 2019 from <strong>the</strong> anthropogenic and solar effects (Figure 3) is comb<strong>in</strong>ed with a “super” ENSO (like that<br />
of 1997-98). In <strong>the</strong> bottom image is <strong>the</strong> pattern of change result<strong>in</strong>g from <strong>the</strong> transition of volcanic cool<strong>in</strong>g<br />
to ENSO warm<strong>in</strong>g, superimposed on <strong>the</strong> solar and anthropogenic <strong>in</strong>fluences. Grey regions <strong>in</strong>dicate where<br />
temperature observations are considered <strong>in</strong>adequate to construct <strong>the</strong> model because less than 50% of<br />
monthly mean values are available.<br />
10
![When the Heliospheric Current Sheet [Figure 1] - Leif and Vera ...](https://img.yumpu.com/51383897/1/190x245/when-the-heliospheric-current-sheet-figure-1-leif-and-vera-.jpg?quality=85)


![The sum of two COSine waves is equal to [twice] the product of two ...](https://img.yumpu.com/32653111/1/190x245/the-sum-of-two-cosine-waves-is-equal-to-twice-the-product-of-two-.jpg?quality=85)